Abstract
This paper focuses on the transmission of vibration response of the seismic simulation shaking table system at Southeast University, and analyzes the effect of this response on the surrounding building. The location of the building is less than 10 m away from the laboratory where the shaking table is located, and during the maximum load test, a student reported that the vibration caused him a sense of discomfort, as well as the shaking of office objects on desktops on high floors, which caused panic. For these reasons, multiple three-directional vibration sensors were placed around the shaking table system and on the 1st, 8th, and 16th floors of the building. Test the vibration response transfer and the vibration response of the building floor while the exercise table is in operation. The test results show that the vibration-weighted acceleration levels of some floors exceed the code limits under sinusoidal wave conditions, which was the cause of the discomfort. The floors will have an amplifying effect on the lateral vibration. For seismic wave excitation, all measurement points of the building meet the limit values required by the GB 50868-2013 Standard for allowable vibration of building engineering. This study can provide a data reference for future shaking table system commissioning and operation.
1. Introduction
In the 1940s, earthquake simulation shaking tables were first introduced in civil engineering structures to simulate earthquake effects. Since the 1960s, the construction of earthquake simulation shaking tables has become widespread, with hundreds of these tables established worldwide, particularly in countries such as China, the United States, and Japan [1,2,3,4]. Shaking table experiments have been extensively utilized in earthquake engineering mechanics, providing qualitative insights into the seismic performance of structures. They have found applications in various fields, including basic research in earthquake engineering, bridge structure analysis, and the study of subway and tunnel structures [5,6,7,8,9,10].
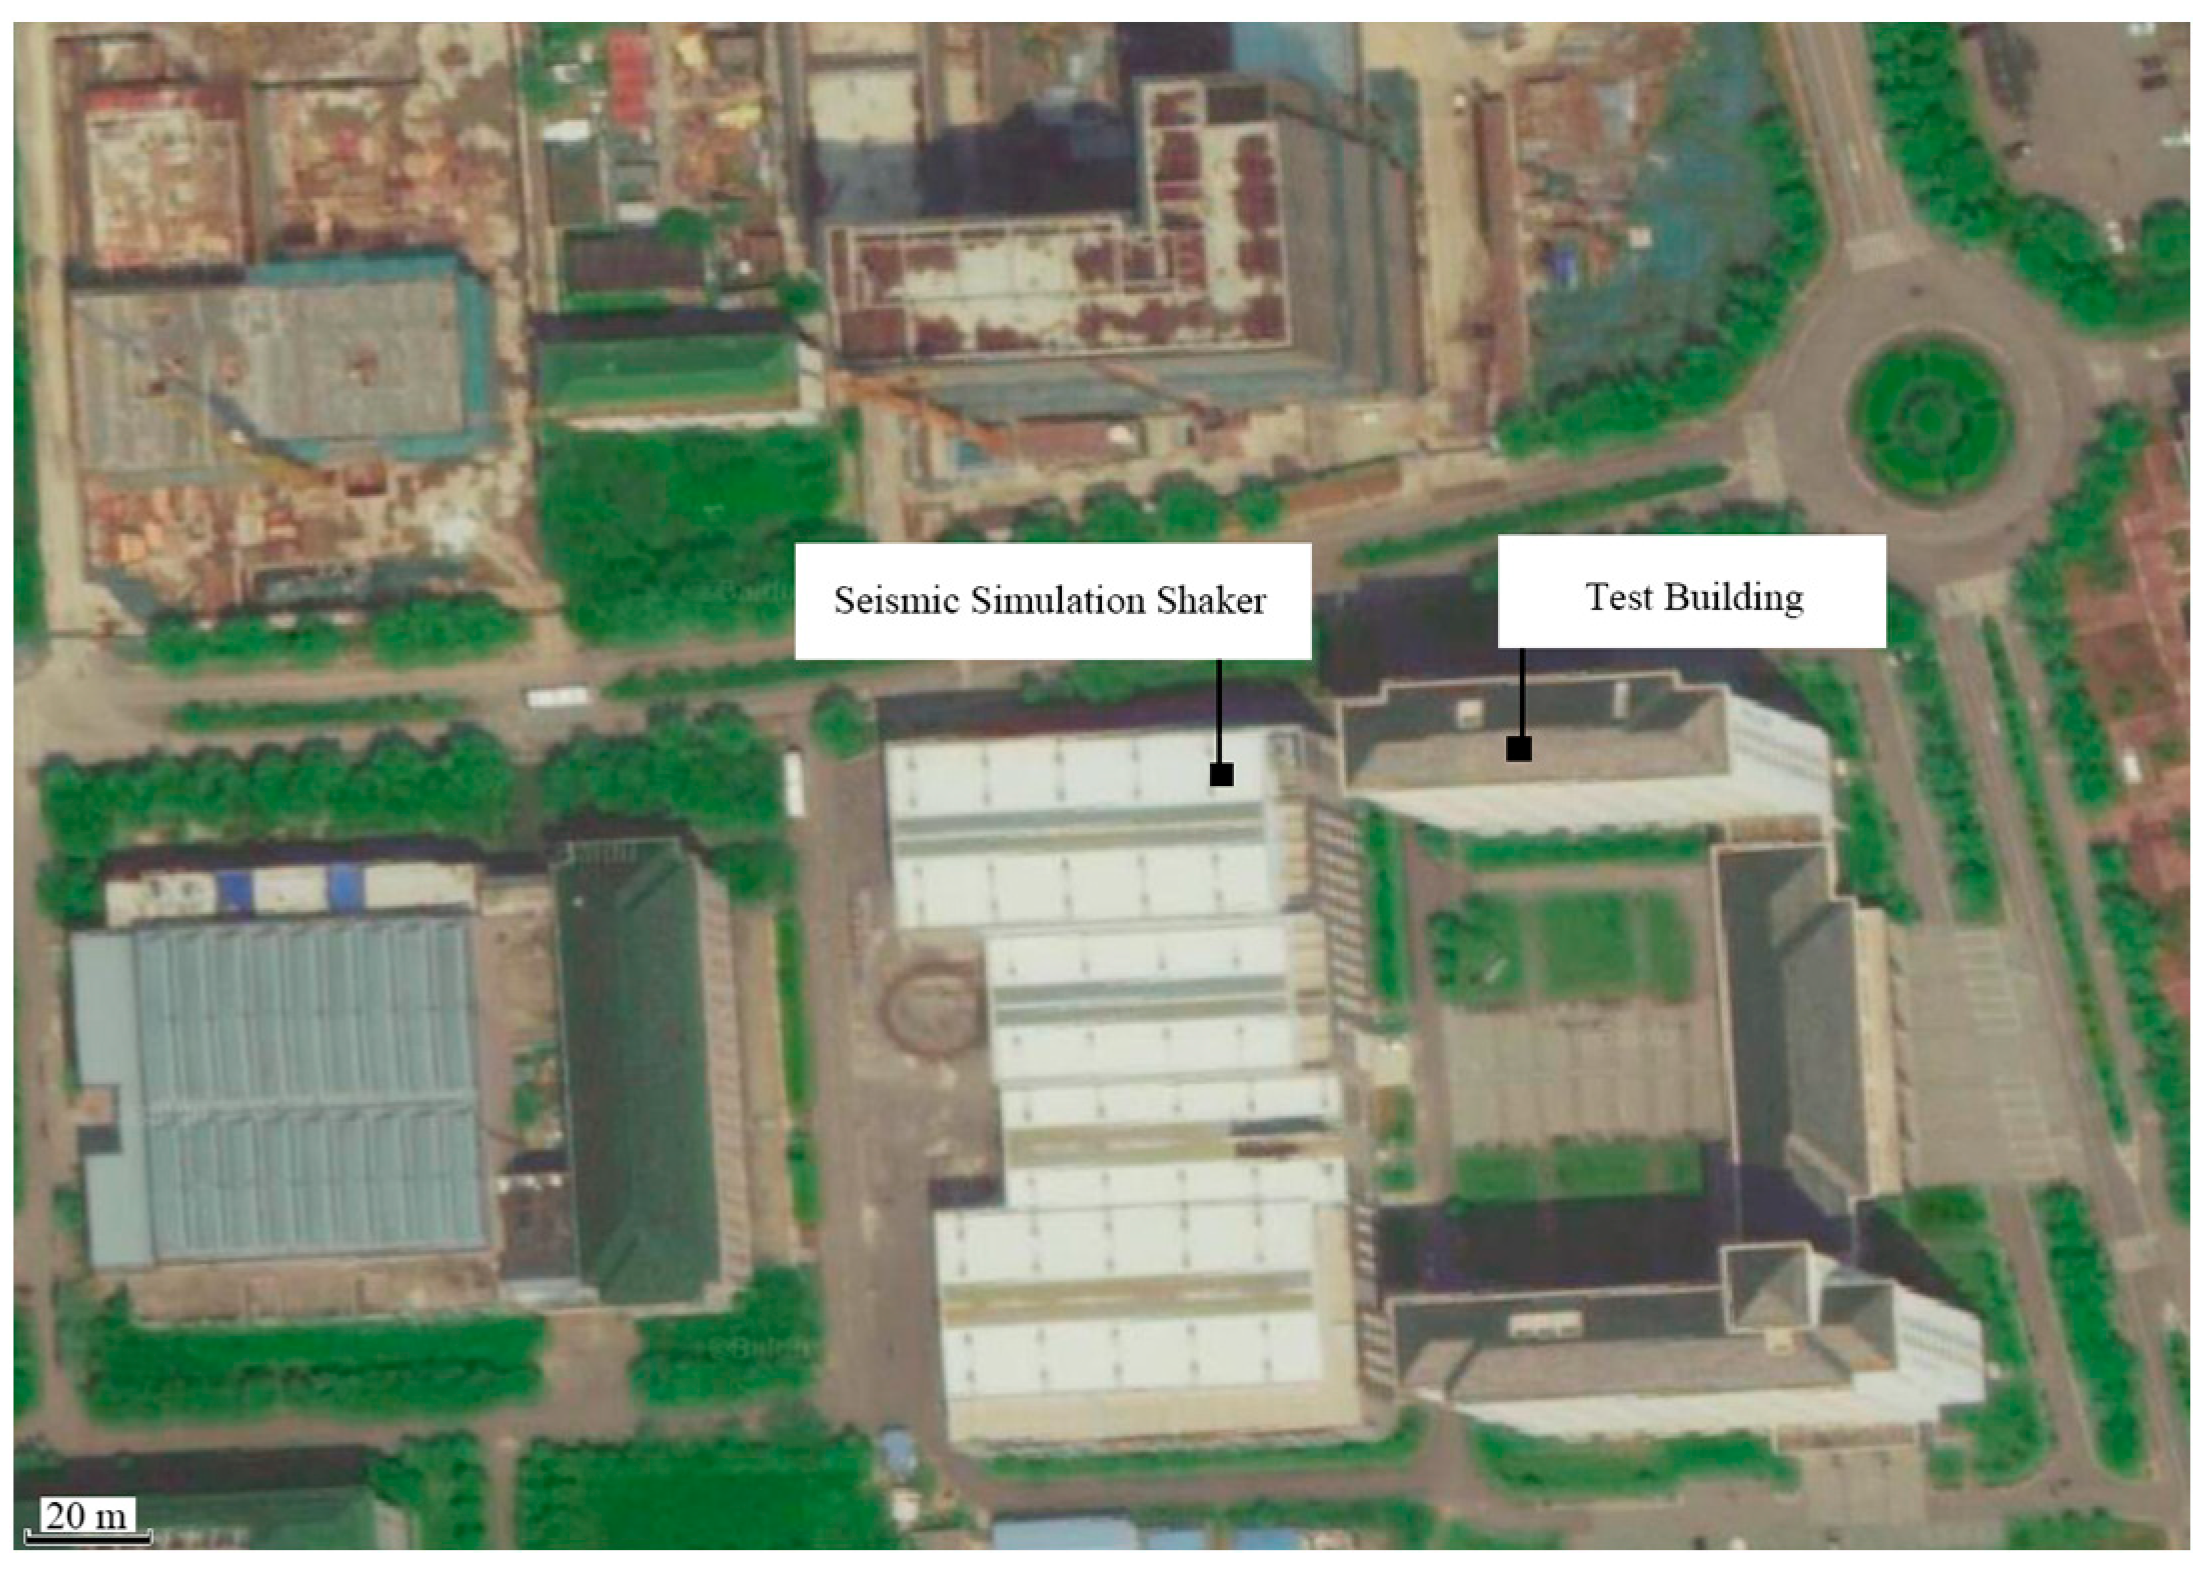
The primary objective of a shaking table, as depicted in Figure 1, is to assess the behavior of full-scale or scaled-down buildings and structures under seismic conditions. This contributes significantly to both engineering and academic research endeavors [2,3,8,11,12,13,14,15]. Typically, shaking tables are situated at a considerable distance from residential and work environments [14,16,17,18,19]. However, the focus of this study is on buildings located within 50 m of the shaking table, with the nearest building a mere 10 m away from the shaking table laboratory entrance (which is also the subject of this study).
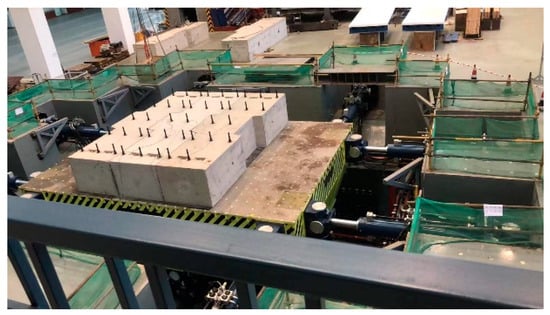
Figure 1.
The shaking table in Laboratory.
During the shaking table commissioning process, several students reported experiencing discomfort due to the vibrations. The shaking table is housed at Southeast University in Nanjing, China, and is recognized as one of the prominent earthquake engineering research facilities in the country. While some shaking tables utilize isolated masses to minimize their influence on surrounding buildings [20], the adjacent building in this study experienced significant discomfort. And, some studies evaluated pounding on the base floor, and their results indicate an increase in acceleration in upper floors [21,22]. Consequently, a comprehensive test was conducted during shaking table operation to determine the magnitude of the vibration response. The findings of this study can provide valuable insights and references for the engineering community.
By incorporating these modifications, the introduction emphasizes the significance of studying the transmission of vibration response from the shaking table system to nearby buildings and clarifies the objectives and implications of the research.
In late 2021, the trial operation of a large seismic simulation shaking table system was initiated for this test (see Figure 1), with the main technical parameters of the shaking table presented in Table 1. The building under test is a 16-story office building belonging to the civil engineering faculty of the university, and its location is illustrated in Figure 2.

Table 1.
Seismic Simulation Shaking table technical parameters.
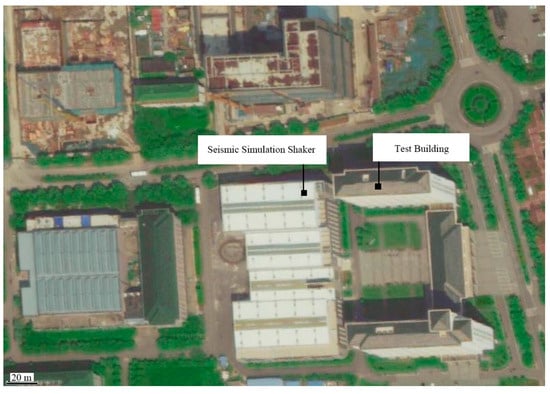
Figure 2.
Buildings around the seismic station.
2. Methods
2.1. Testing Instruments
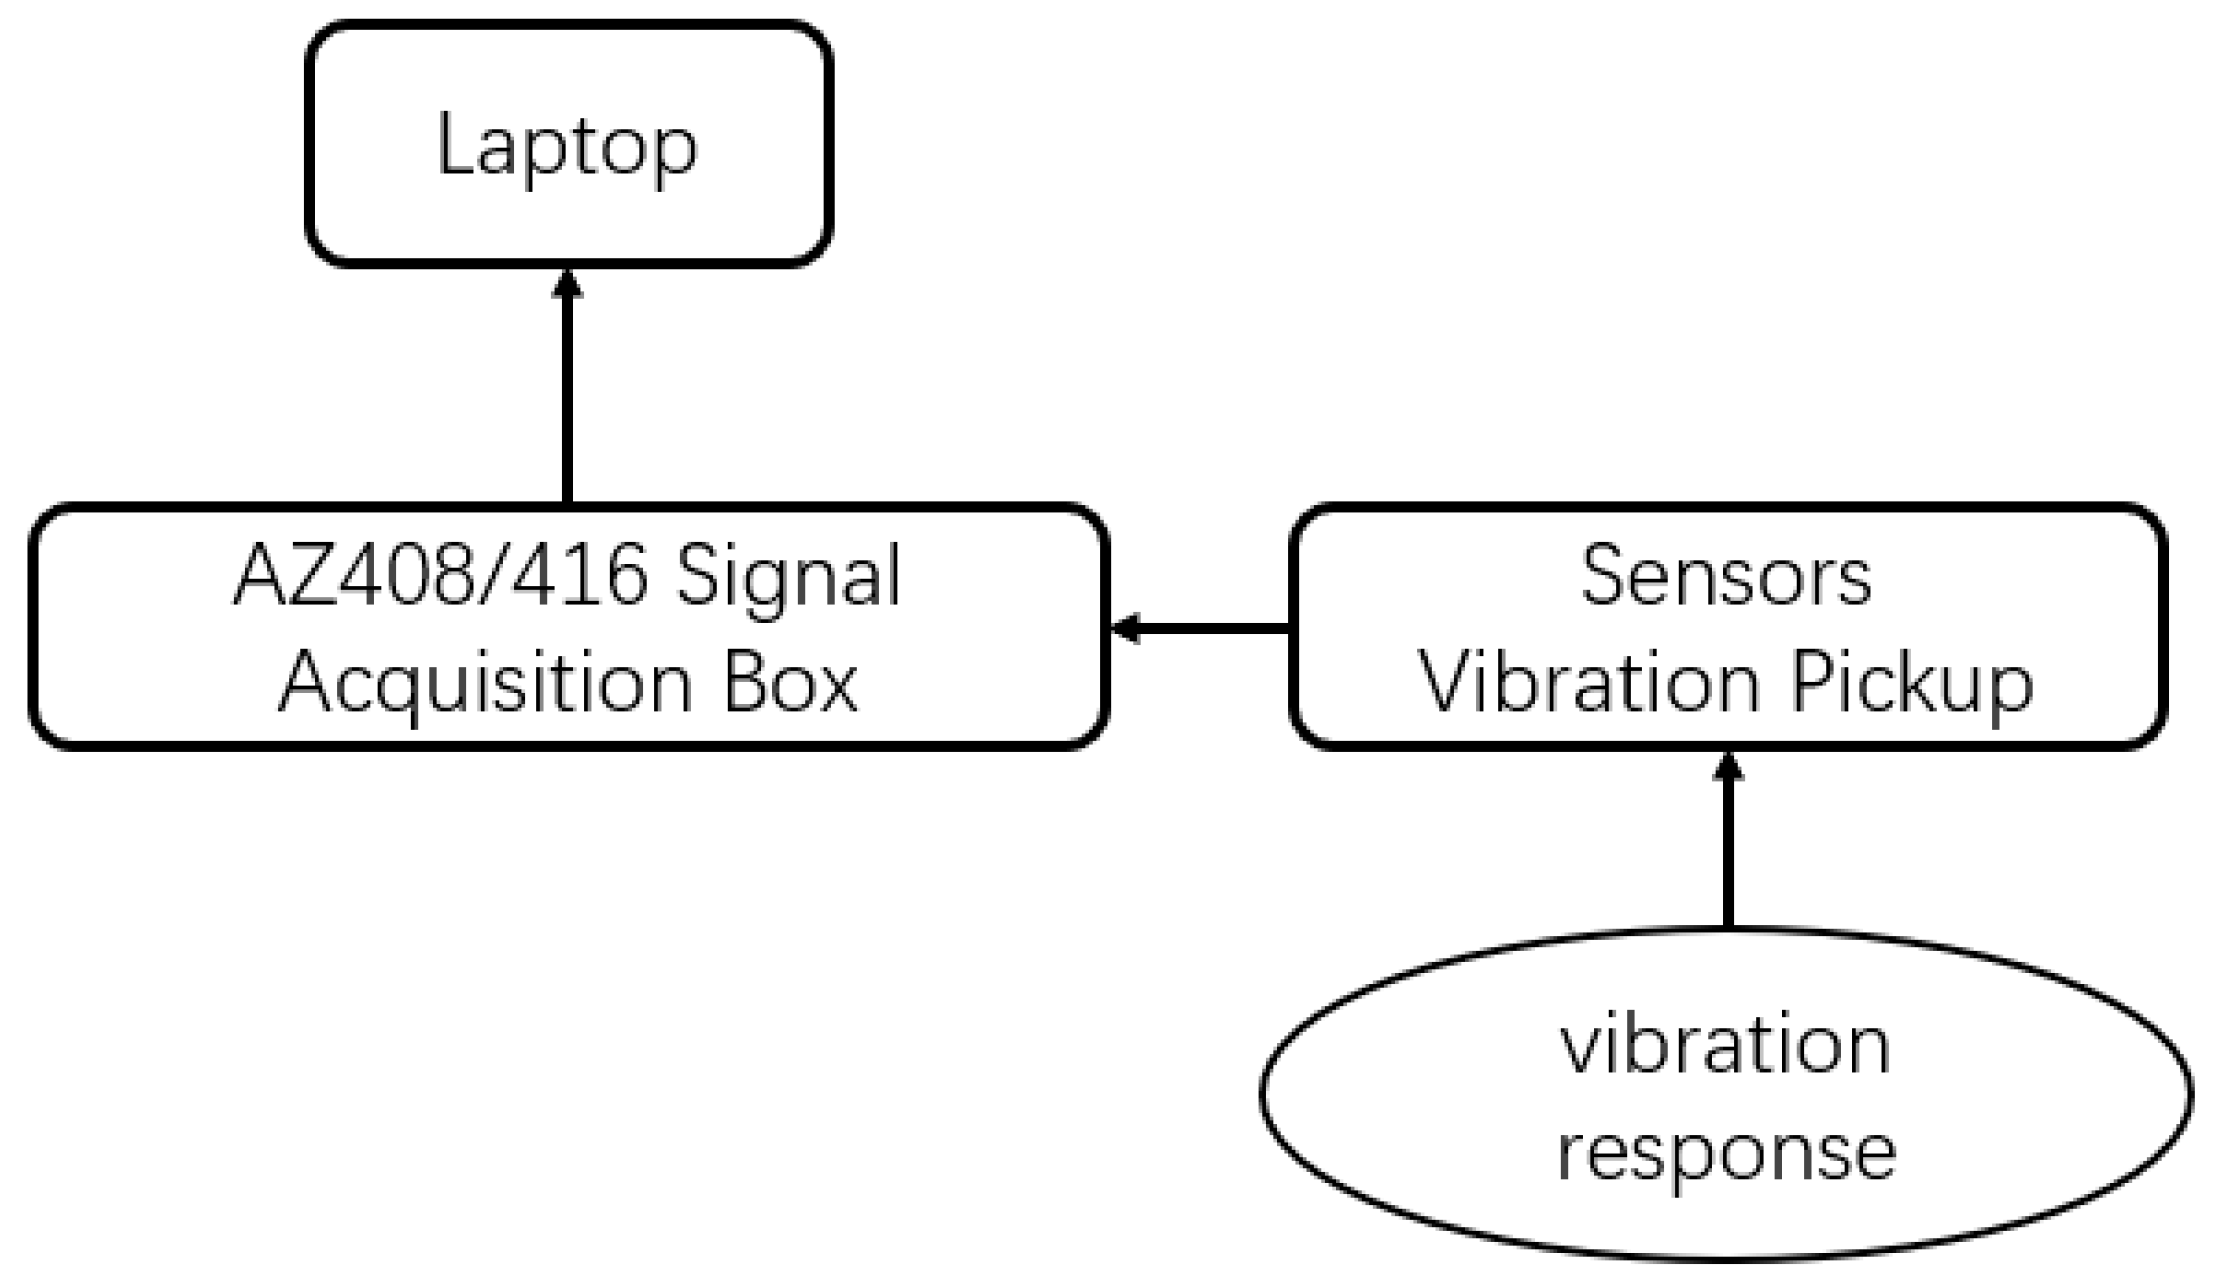
The main objective of the test is to obtain response data from the shaking table, which requires the use of accelerometers, signal acquisition, and an analysis system. In addition to the shaking table mentioned earlier, the accelerometer model used is the 941-B vibration pickup, which has a passband of 0.25–80 Hz and a mass of 0.875 kg. The sensitivity of some of the sensor models is provided in Table 2, and the models and numbers of the other main test instruments are listed in Table 3. Schematic diagrams of the instrument installation are presented in Figure 3 and Figure 4.
Table 2.
Sensitivity of some vibration pickups.
Table 3.
Main test instruments.

Figure 3.
Schematic diagram of instrument installation.
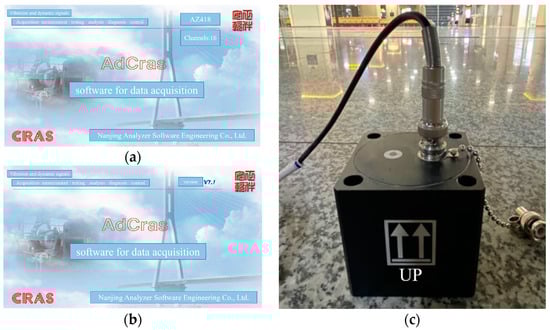
Figure 4.
Equipment and sensor diagram: (a) AZ416 signal acquisition box; (b) AZ408 signal acquisition box; (c) 941-B vibration pickup.
2.2. Test Process
The process of testing includes the following steps: 1. determine the installation location of the sensors; 2. prepare the sine and seismic waves for testing in the seismic station; 3. acquire the data; 4. extract the data; 5 analyze the data.
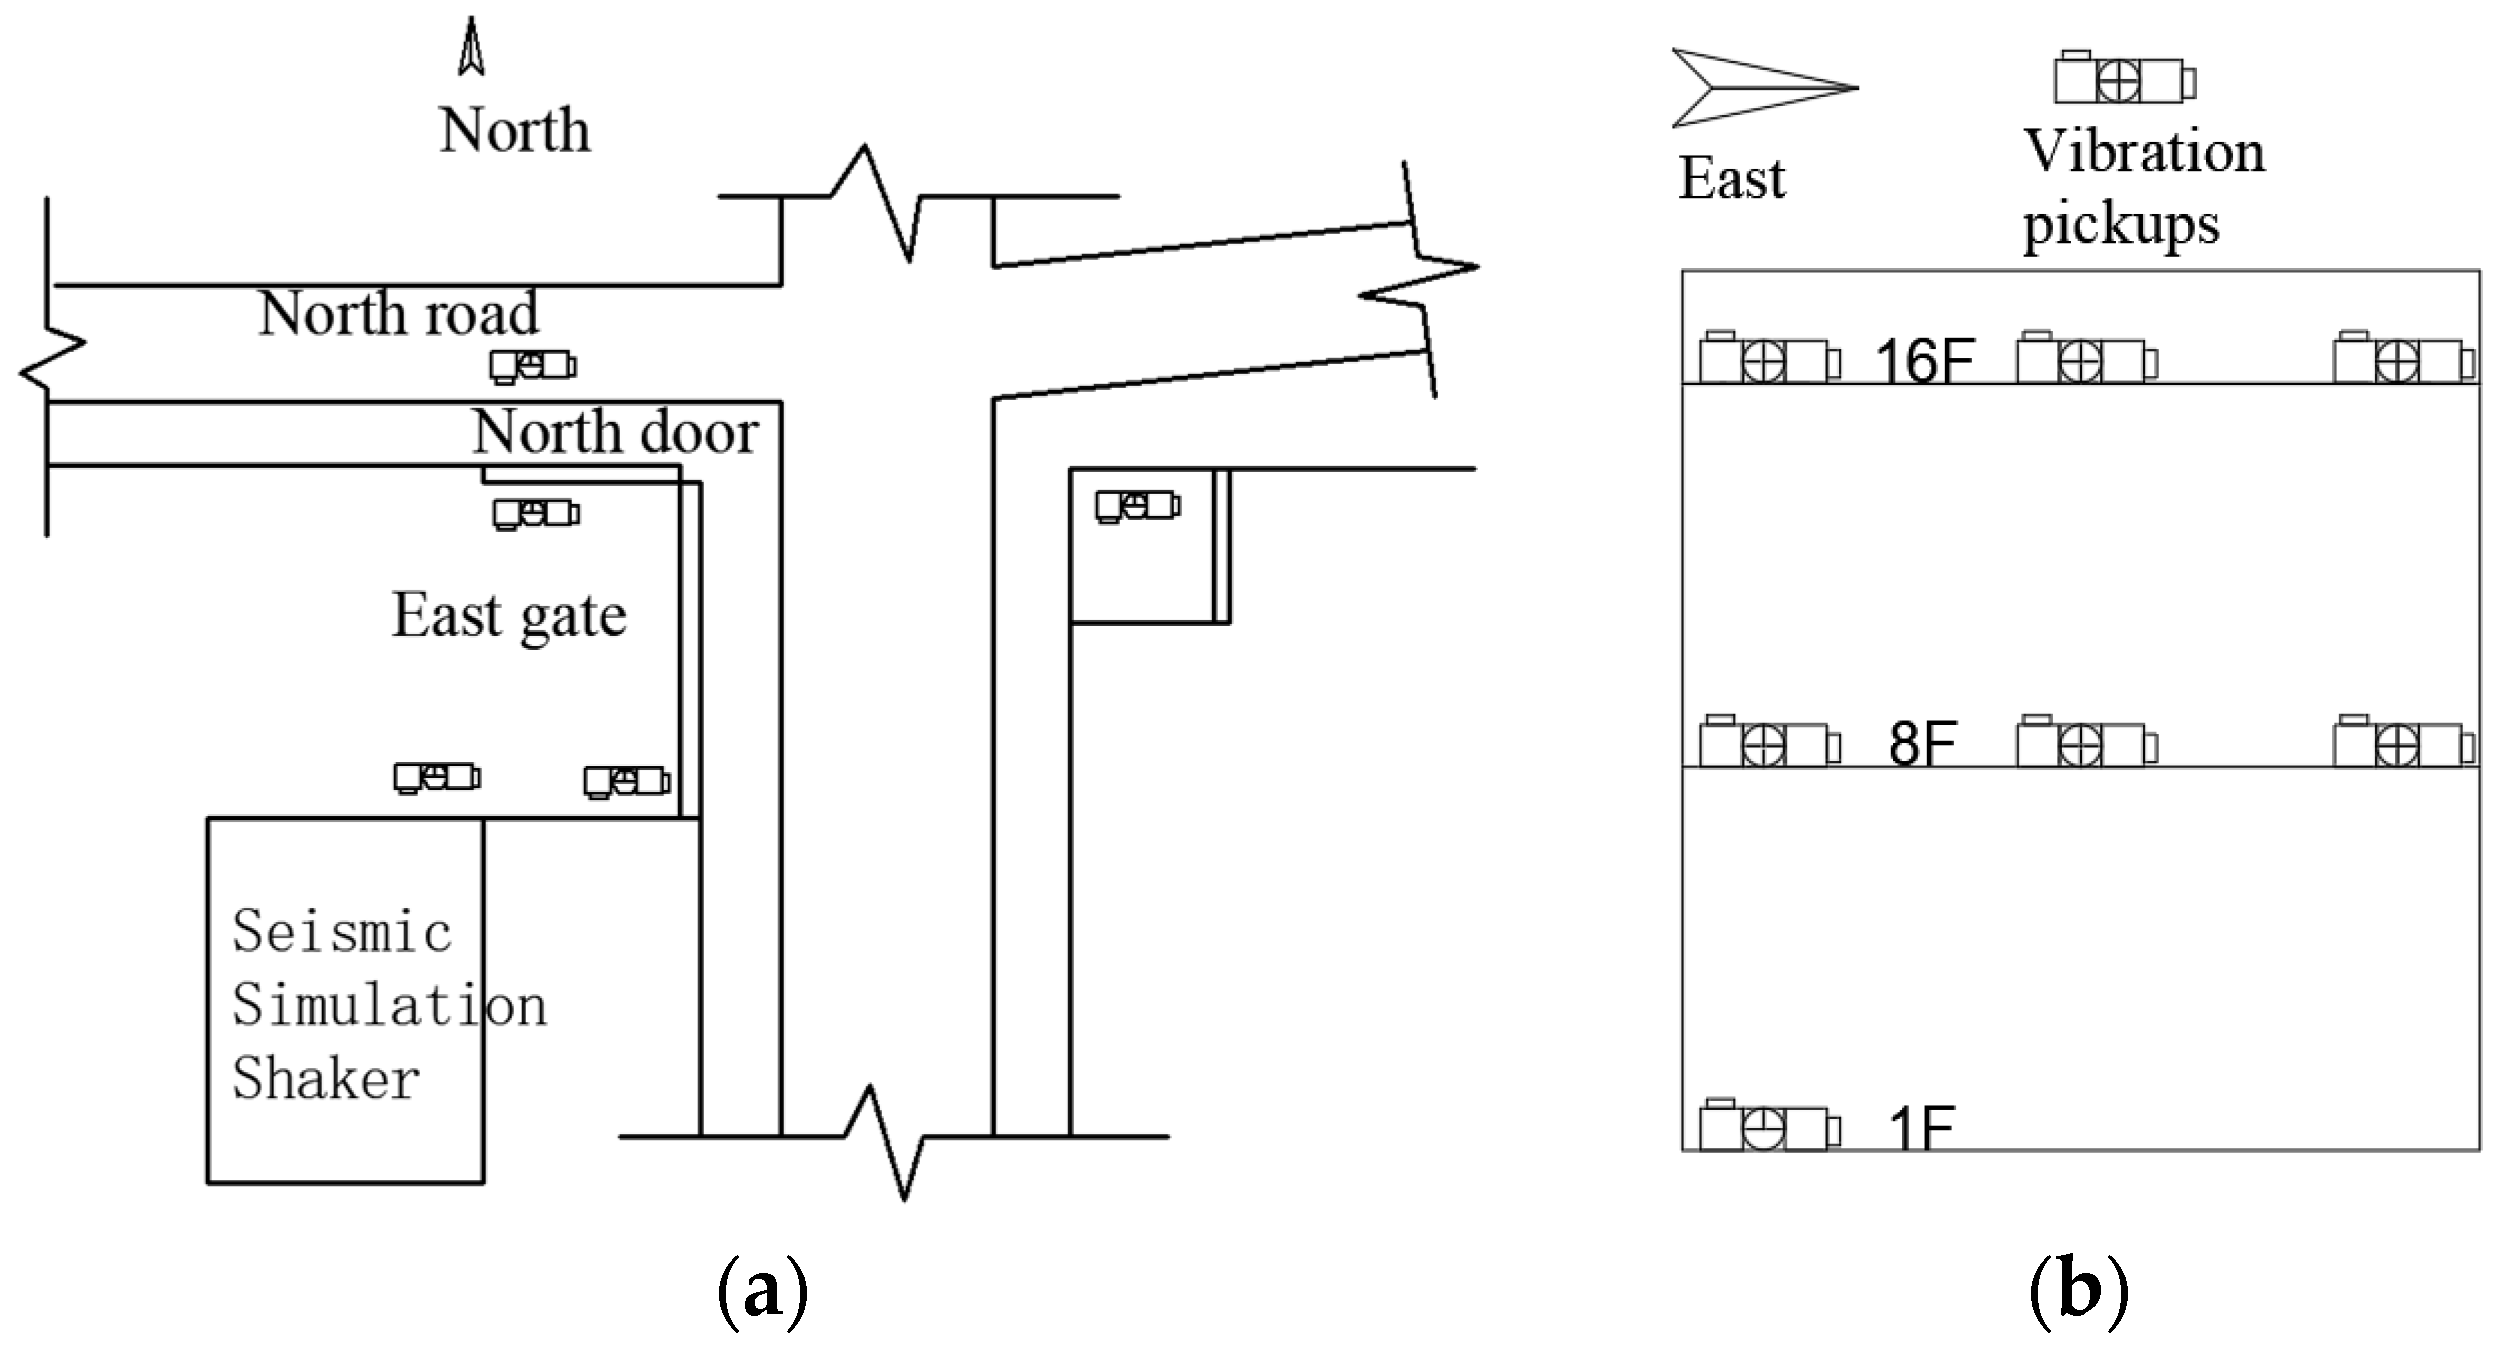
A total of 7 measurement points were in the building (see Figure 5a). The sensors are arranged on the 1st floor (3 sensors, 2 lateral, 1 vertical sensor), 8th floor (9 sensors, 6 lateral, 3 vertical), and 16th floor (9 sensors, 6 lateral, 3 vertical) of the floor. A total of 5 measurement points are arranged in the seismic station laboratory (Figure 5b), each with 3 sensors, 2 lateral and 1 vertical. The north–south direction is defined as X-direction, the east–west direction is defined as Y-direction, and the vertical direction is defined as Z-direction.

Figure 5.
Schematic diagram of sensor locations: (a) Sensors in the Seismic station laboratory; (b) Sensors in the building.
To obtain the response data and natural frequency of the test building, a sweep in three directions (X, Y and Z) was performed. The parameters of the frequency sweep are shown in the following Table 4.
Table 4.
Details of the frequency sweep.
There are 12 operating conditions output from the seismic station laboratory, all of which are used in the normal operation of the laboratory. The parameters are shown in Table 5. El Centro earthquake waves were recorded at seismic observation stations in the El Centro region of California, USA. The Kobe waves are recorded at seismic observation stations in the Kobe region of Japan. The Wenchuan waves were recorded at seismic observation stations in the Wenchuan region of Sichuan, China.
Table 5.
Details of output from the seismic station laboratory.
3. Test Results and Analysis
3.1. Natural Frequency Test Results of the Building
The intrinsic frequency of the building is obtained by performing a fast Fourier transform on the time domain information collected from the sensors that have been arranged in three directions [12]. The time-domain information was chosen to be the same day of the test.
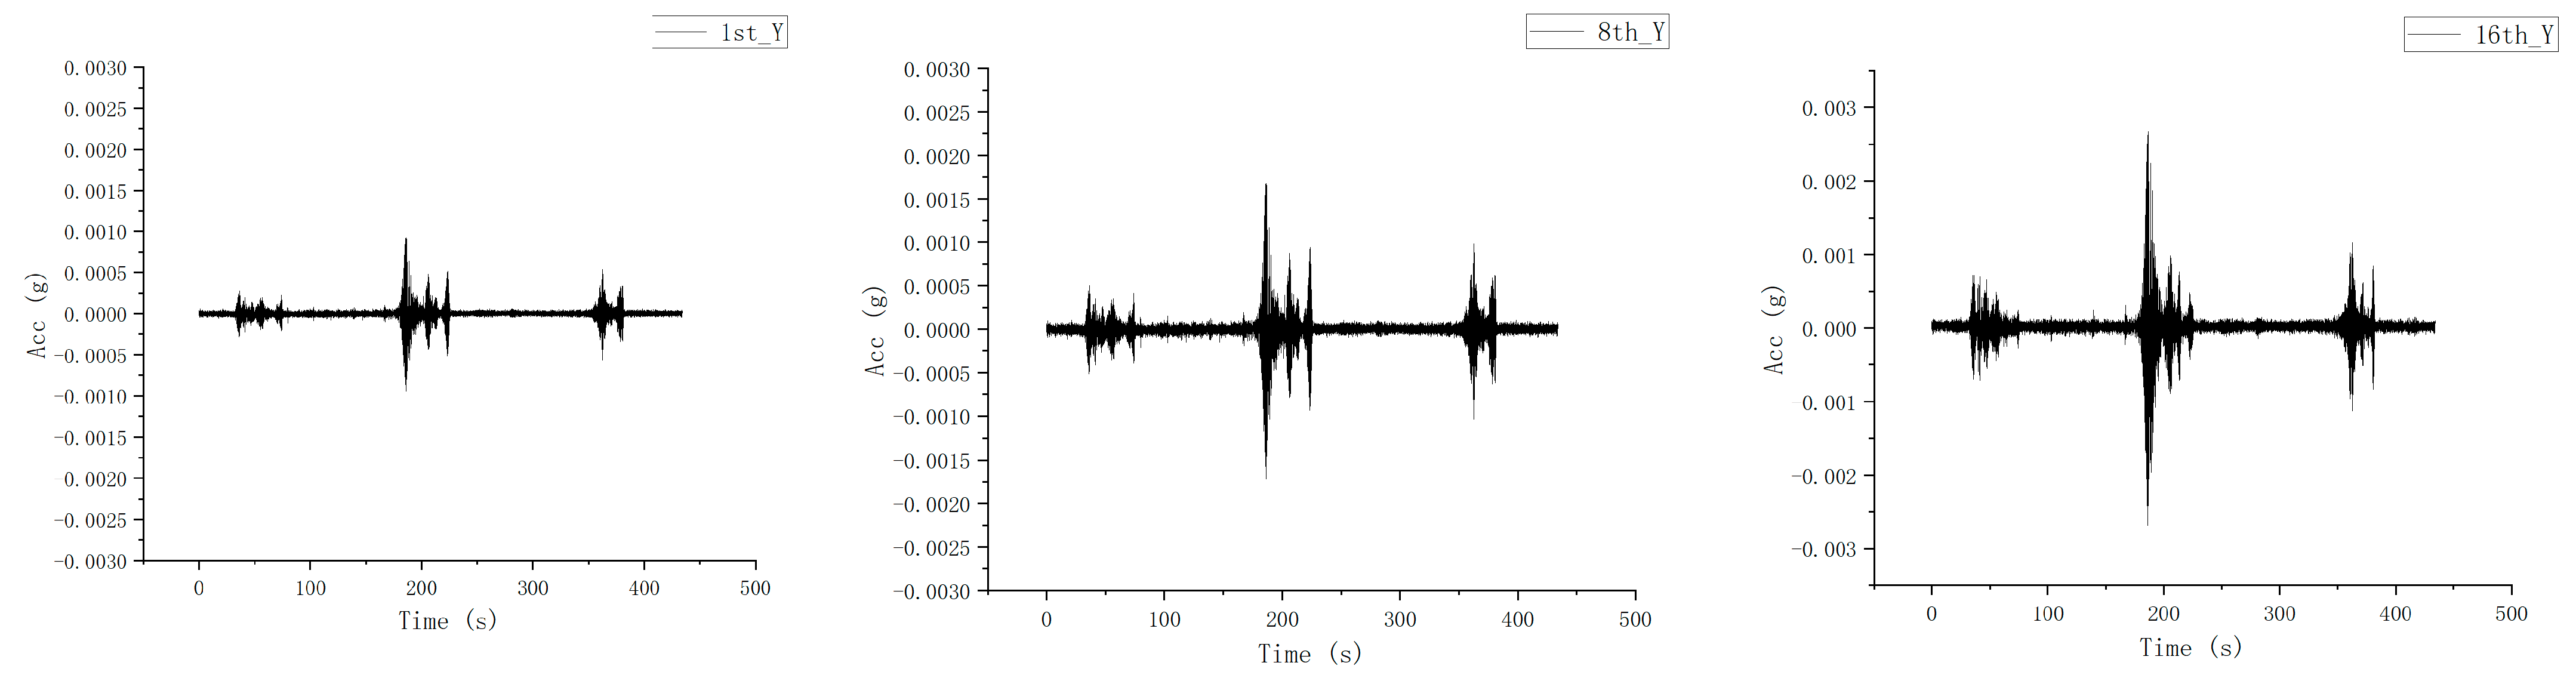
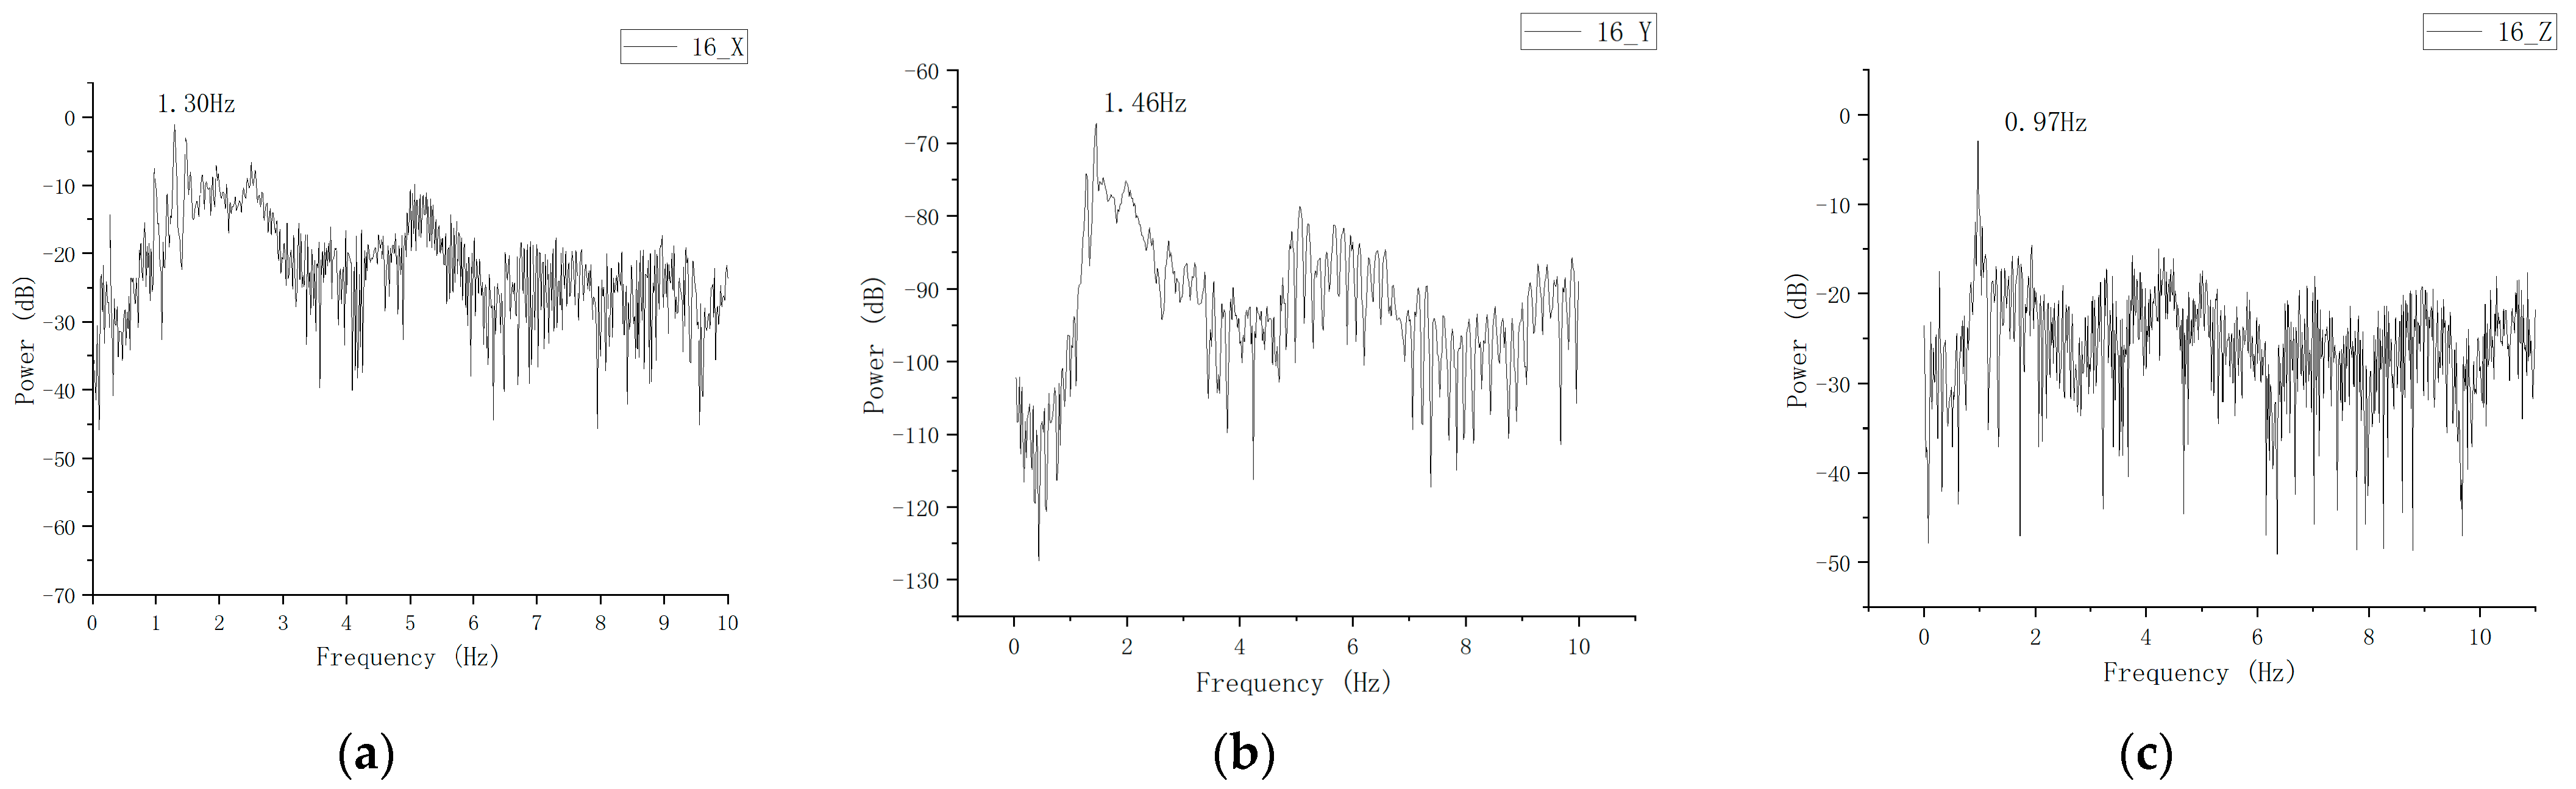
Figure 6 shows the response data of the Y-direction sensor exhibits a greater acceleration response when subjected to Y-direction sinusoidal excitation, compared to its responses under sinusoidal excitations in the X-direction and Z-direction. It is known in Figure 7 that the X-direction frequency is 1.30 Hz, the Y-direction frequency is 1.46 Hz, and the Z-direction floor frequency is 0.97 Hz.
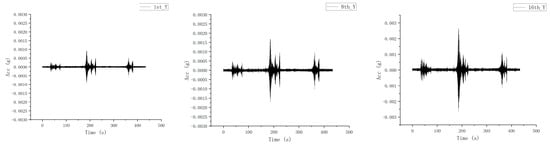
Figure 6.
Y-direction sensor acceleration response data.

Figure 7.
Power spectrum of the building in three directions: (a) X-directional natural frequency; (b) Y-directional natural frequency; (c) Z-directional natural frequency.
3.2. Vibration Test Response Results and Analysis
Table 6.
Maximum values of the accelerations of the building for each working condition (mm/s2).
Table 7.
Maximum value of vibration response in seismic table laboratory (mm/s2).
The following can be seen from Table 6:
- The response value increases with the test frequency and is positively correlated, and when the frequency reaches 30 Hz, the measured data are the largest in the same category.
- The amplitude value next to the vibration source (shaking table) is the largest, the vibration response inside the vibration isolation trench is larger, and the vibration response outside the vibration isolation trench decreases.
- The largest response value of the building is the first-floor Z-directional response, which is generated under the conditions TZ_10 and TZ_30 working excitation.
- The response produced a change in response with distance and position, and the decay rate is shown in Table 8.
Table 8. The vibration decay rate of building.
Table 8 shows the attenuation rate of the seismic simulation shaking table. The vibration propagation path is the attenuation from the ground next to the shaking table to the east gate of the laboratory, then to the 1st floor of the building, then to the 8th floor of the building, and then to the 16th floor of the building for the attenuation, which can be seen in Table 8.
From the shaking table side to the east gate of the laboratory, the vibration response is enhanced; the vibration response of the 1st, 8th, and 16th floors of the civil engineering building tends to decay; and the Z-directional response of the 16th floor increases under each working condition.
To test the indicators of the shaking table, the need for a sine wave and frequency sweep test can be based on the “Construction Allowable Vibration Standards” following consideration of the case of continuous vibration; when the shaking table plane has a load, namely the test using a three-way seismic wave, the time is shorter, the energy release is more concentrated, can be based on the “Construction Allowable Vibration Standards” following consideration of the case of several shock vibrations. According to “GB 50868-2013 Standard for allowable vibration of building engineering”, 6.0.1 “human comfort and fatigue in buildings—efficacy reduction” (Table 9), the TX_2-TZ_30 horizontal limit value is 83 dB, the vertical limit value is 86 dB, the T_EI-T_WC horizontal limit value is 107 dB, and the vertical limit value is 110 dB [23].
Table 9.
Tolerable vibration-weighted acceleration levels (dB) for human comfort in buildings.
The vibration-weighted acceleration level La is calculated from the data in Table 8. The calculation formula is as follows.
where x is the effective value of acceleration, and x0 is the reference acceleration (taken here as 10–6 m/s2).
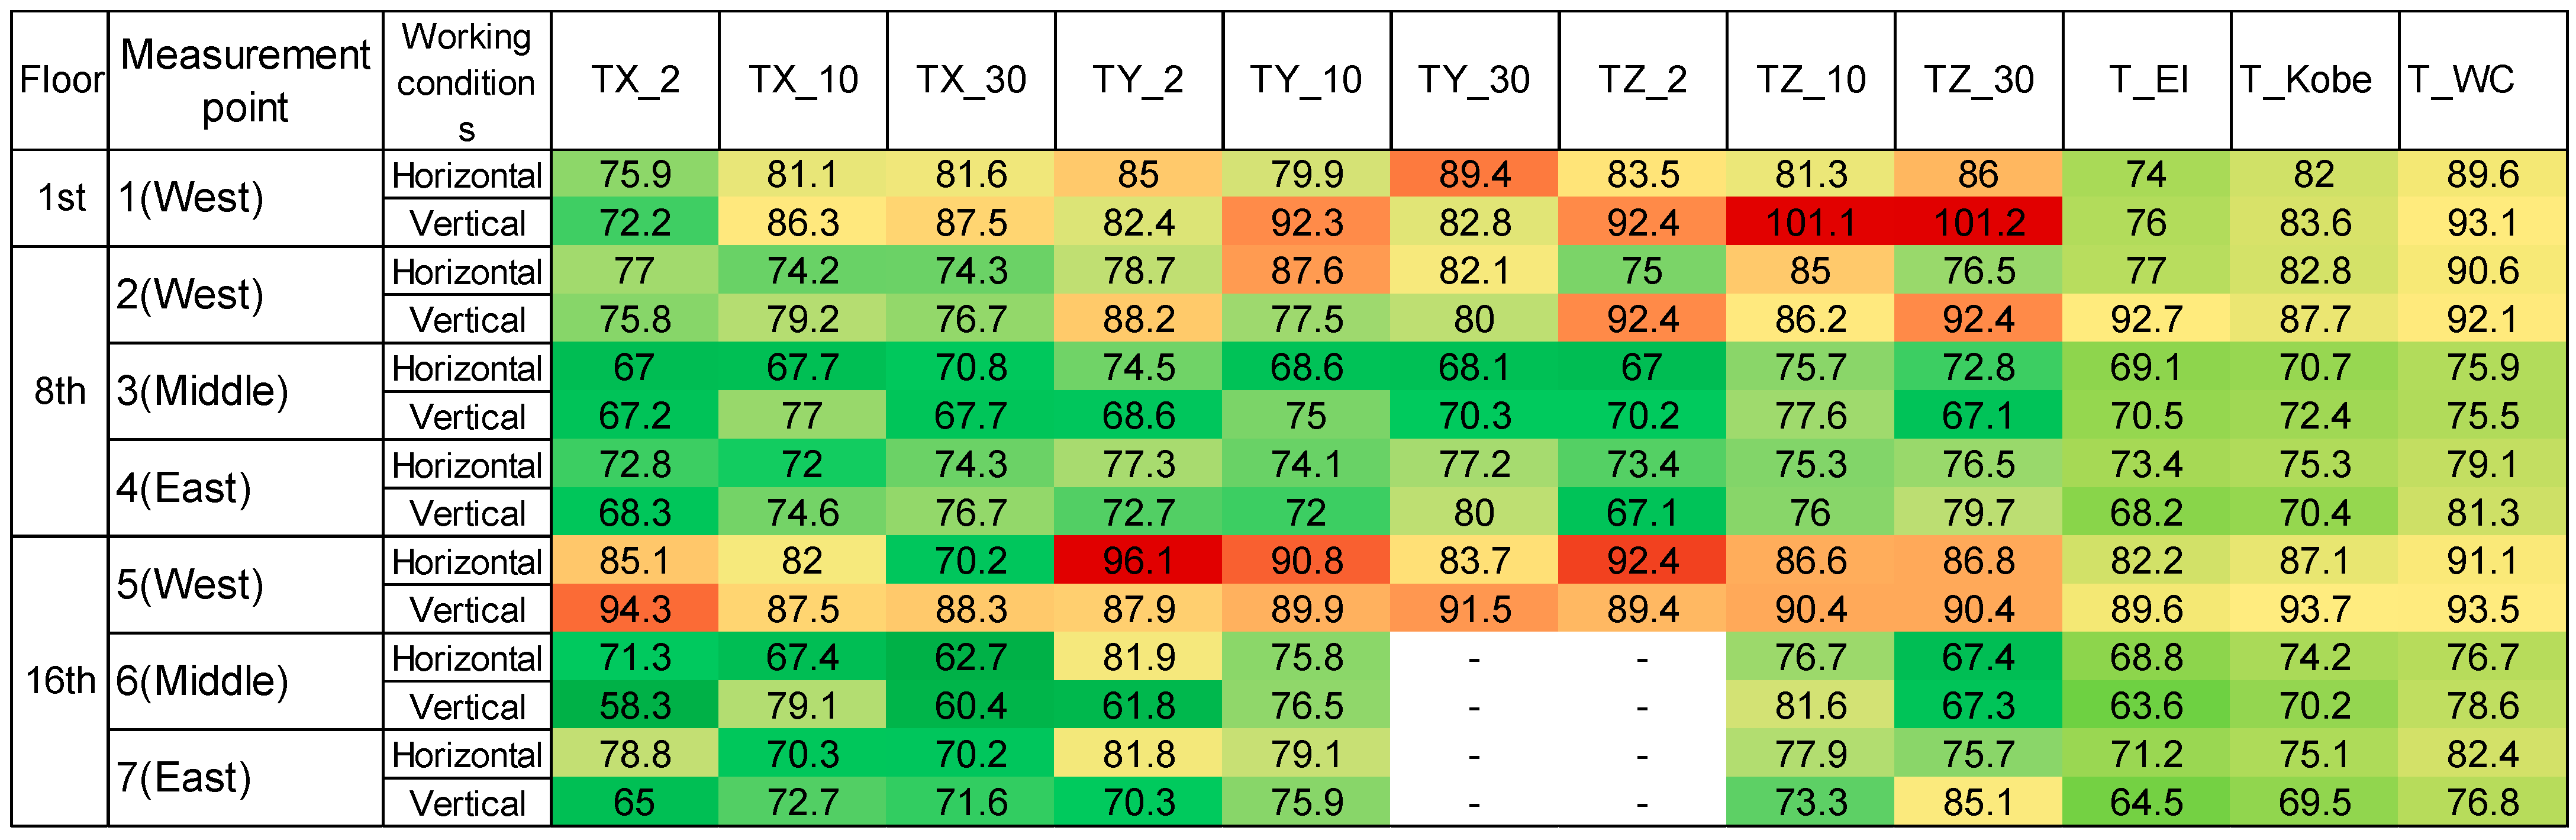
Equation (2) is used to obtain the calculations in Figure 8. The numerical results are annotated with background colors. When the color is dark green or light green, it indicates that the values at this point are below the prescribed vibration-weighted acceleration levels (dB). When the color is light yellow or dark yellow, it indicates that the values at this point are close to the prescribed vibration-weighted acceleration levels (dB) and may potentially exceed them. When the color is red, it indicates that the values at this point exceed the prescribed vibration-weighted acceleration levels (dB).

Figure 8.
Vibration-weighted acceleration levels (dB) on the building.
In the context of the building, Vibration-weighted acceleration levels (dB) are used to assess the extent to which vibrations or accelerations experienced by the building’s occupants exceed permissible limits set by design codes, standards, or regulations. The levels are evaluated at various locations within the building and are often compared to established thresholds to ensure the safety, comfort, and structural integrity of the building. Different colors may be assigned to different ranges of vibration levels to provide a visual indication of whether the vibration levels are within acceptable limits or if they exceed them.
- TZ_10 and TZ_30 working conditions: when the shaking table was tested under 10 Hz and 30 Hz Z-directional sine waves, the vertical vibration-weighted acceleration level of the first floor of the civil engineering building was relatively the largest, 101.1 dB and 101.2 dB, exceeding the limit value by more than 15 dB.
- T_WC working condition: the horizontal vibration-weighted acceleration level of the 1st floor of the civil engineering building is relatively the largest, 89.6 dB.
- TY_10 and TZ_10 working conditions: the horizontal vibration-weighted acceleration level on the 8th floor exceeds the limit value of 83 dB, and the maximum is 90.6 dB for T_WC.
- TY_2, TZ_2-TZ_30 working conditions: the vertical vibration metered acceleration level on the 8th floor exceeds the limit value of 86 dB, and the maximum is 92.7 dB for T_KOBE.
- Most of the horizontal vibration metered acceleration levels on the 16th floor exceeded the limit value of 86 dB (except for TX_10, TX_30, and T_EI-T_WC working conditions), and the maximum vibration metered acceleration level was 96.1 dB for TY_2 working conditions.
- Most of the vertical vibration-weighted acceleration levels on the 16th floor exceed the limit value of 86 dB (except for T_EI-T_WC). The minimum is 87.5 dB for TX_10 working condition and the maximum is 93.7 dB for T_KOBE working condition.
During the commissioning period, positive metaphorical waves are used, the peak is smooth, and the tremor is felt strongly, while during the normal use period, earthquakes dominate, the peak changes abruptly, and the human tremor is not obvious. This is in line with the test data.
4. Conclusions
This paper presents an analysis of the vibration response of a seismic simulation shaking table system on a nearby building. A frequency sweep (0.1–20 Hz) was performed after seismic shaking, and the natural frequencies of the building were found to be 1.3 Hz in the X-direction and 1.46 Hz in the y-direction. After outputting 12 working conditions of the seismic shaker, the collected sensor data were analyzed, and the following conclusions were drawn:
- The vibration responses of the building were significantly attenuated with distance, particularly the transverse wave vibration.
- The vibration response of the building increased from the 1st floor to the 16th floor.
- For the sine wave excitations under TX_2-TZ_30 working conditions, some floors of the building exceeded the vibration limit value specified in “GB50868-2013 Construction Engineering Allowable Vibration Standard”. The data exceeding the limit values are shown in Figure 6, except for the 1st floor and the west measurement points on the 8th and 16th floors near the shaking table (i.e., measurement points 1, 2, and 5). All other points met the requirements. For the seismic wave excitations under T_EI-T_WC working conditions, all the measurement points of the building met the limit values specified in the GB50868-2013 Building Engineering Allowable Vibration Standards.
- The numerical value of the sine wave frequency when using shaking table should avoid the frequency in the XY direction of the structure. The X-direction frequency is 1.30 Hz, and the Y-direction frequency is 1.46 Hz. It is recommended to notify surrounding buildings in advance when the equipment is running. And please do not engage in high-power vibration during office hours.
- Architects and engineers should take into account the natural frequencies of nearby buildings, especially in the X and Y directions, to ensure that the designed structures do not resonate with these frequencies. Additionally, for existing buildings, consider retrofitting or strengthening measures to mitigate vibration issues, particularly on higher floors.
Author Contributions
Conceptualization, W.X. and H.L.; methodology, W.X. and P.W.; software, W.X.; validation, H.L. and W.X.; formal analysis, H.L.; investigation, W.X.; resources, W.X.; data curation, W.X. and Y.L.; writing—original draft preparation, W.X.; writing—review and editing, W.X.; visualization, W.X.; supervision, Z.Z.; project administration, Z.Z.; funding acquisition, Z.Z. All authors have read and agreed to the published version of the manuscript.
Funding
This study were supported by the National Natural Science Foundation of China (Grant No. 51278106) and Key technology research of key passenger stations in the Beijing–Tianjin–Hebei region (Grant No. 6705001055).
Data Availability Statement
Please note your intention and contact email: xie123wenbo@seu.edu.cn.
Acknowledgments
The authors thank to Southeast University for providing the test instrument.
Conflicts of Interest
The authors declare no conflict of interest.
References
- Gao, C.H.; Yuan, X.B. Development of the Shaking Table and Array System Technology in China. Adv. Civ. Eng. 2019, 2019, 8167684. [Google Scholar] [CrossRef]
- Jaswanth, G.; Sumanth, G.; Ganesh, M.; Dash, A.K. Modal Analysis of a 6 DOF Seismic Simulator. In Proceedings of the 2017 IEEE International Conference On Power, Control, Signals And Instrumentation Engineering (ICPCSI), Chennai, India, 21–22 September 2017; pp. 373–376. [Google Scholar]
- Lu, X.L.; Zhang, H.Y.; Hu, Z.L.; Lu, W.S. Shaking table testing of a U-shaped plan building model. Can. J. Civ. Eng. 1999, 26, 746–759. [Google Scholar] [CrossRef]
- Xu, C.; Dou, P.; Du, X.; Chen, S.; Li, X. Review on Shaking Table Test of Dynamic Interaction of Liquefiable Site-structures System: Retrospect and Prospect. J. Beijing Univ. Technol. 2019, 45, 502–514. [Google Scholar]
- Guo, W.; Li, L.; Shao, P. Precision analysis of large structure seismic experiment utilizing shaking table for earthquake simulation. J. Earthq. Eng. Eng. Vib. 2016, 36, 16–21. [Google Scholar]
- Jiang, L.; Chen, J.; Li, J. Shaking table test of utility tunnel under non-uniform seismic excitations (Ⅲ): Numerical simulation. Earthq. Eng. Eng. Vib. 2010, 30, 45–52. [Google Scholar]
- Jiang, Z.; Liu, J.; Xu, C. Prediction method for seismic responses of underground structures in shaking table tests. Chin. J. Geotech. Eng. 2021, 43, 1220–1227. [Google Scholar]
- Jing, J.; Clifton, G.C.; Roy, K.; Lim, J.B.P. Three-storey modular steel building with a novel slider device: Shake table tests on a scaled down model and numerical. Thin-Walled Struct. 2020, 155, 106932. [Google Scholar] [CrossRef]
- Li, P.Z.; Liu, S.T.; Lu, Z.; Yang, J.P. Numerical analysis of a shaking table test on dynamic structure-soil-structure interaction under earthquake excitations. Struct. Des. Tall Spec. Build. 2017, 26, e1382. [Google Scholar] [CrossRef]
- Li, P.Z.; Zhao, P.; Lu, X.L. Parameter Identification and Analysis of Shaking Table Tests on SSI System. J. Asian Archit. Build. Eng. 2011, 10, 421–428. [Google Scholar] [CrossRef]
- Liang, H.Q.; Xie, W.B.; Wei, P.Z.; Zhou, Y.; Zhang, Z.Q. The Effect of the Decorative Surface Layer on the Dynamic Properties of a Symmetric Concrete Slab. Symmetry 2021, 13, 1174. [Google Scholar] [CrossRef]
- Xie, W.B.; Liang, H.Q.; Wei, P.Z.; Zhou, Y.; Zhang, Z.Q. Dynamic Test and Analysis of the Structure of the Stadium Stand in Suzhou Industrial Park. Appl. Sci. 2022, 12, 251. [Google Scholar] [CrossRef]
- Xu, C.; Gao, L.; Chen, S.; Du, X.; Dou, P. Shaking-table tests design on a liquefaction foundation-structure considering compressed ground motion. J. Earthq. Eng. Eng. Vib. 2017, 37, 51–57. [Google Scholar]
- Butenweg, C.; Bursi, O.S.; Paolacci, F.; Marinkovi, M.; Lanese, I.; Nardin, C.; Quinci, G. Seismic performance of an industrial multi-storey frame structure with process equipment subjected to shake table testing. Eng. Struct. 2021, 243, 112681. [Google Scholar] [CrossRef]
- Chen, M.C.; Pantoli, E.; Wang, X.; Astroza, R.; Ebrahimian, H.; Hutchinson, T.C.; Conte, J.P.; Restrepo, J.I.; Marin, C.; Walsh, K.D.; et al. Full-Scale Structural and Nonstructural Building System Performance during Earthquakes: Part I—Specimen Description, Test Protocol, and Structural Response. Earthq. Spectra 2016, 32, 737–770. [Google Scholar] [CrossRef]
- M Federal Emergency Management Agency (FEMA). Interim Protocols for Determining Seismic Performance Characteristics of Structural and Nonstructural Components through Laboratory Testing; Report No. FEMA 461; FEMA: Washington, WS, USA, 2007. [Google Scholar]
- International Code Council Evaluation Service (ICC-ES). AC156 Acceptance Criteria for the Seismic Qualification of Nonstructural Components; ICC-ES: Brea, CA, USA, 2020. [Google Scholar]
- Zito, M.; Nascimbene, R.; Dubini, P.; D’Angela, D.; Magliulo, G. Experimental Seismic Assessment of Nonstructural Elements: Testing Protocols and Novel Perspectives. Buildings 2022, 12, 1871. [Google Scholar] [CrossRef]
- Zito, M.; D’Angela, D.; Maddaloni, G.; Magliulo, G. A shake table protocol for seismic assessment and qualification of accelerationsensitive nonstructural elements. Comput. Civ. Infrastruct. Eng. 2022, 38, 1699–1726. [Google Scholar] [CrossRef]
- Cosenza, E.; Di Sarno, L.; Fiorillo, A.; Maddaloni, G.; Manfredi, G.; Prota, A. The base isolated mass of the dynamic laboratory at University of Naples Federico II. In Proceedings of the 14th World Conference on Earthquake Engineering, Beijing, China, 12–17 October 2008; pp. 1–8. [Google Scholar]
- Rayegani, A.; Nouri, G. Seismic collapse probability and life cycle cost assessment of isolated structures subjected to pounding with smart hybrid isolation system using a modified fuzzy based controller. In Structures; Elsevier: Amsterdam, The Netherlands, 2022; Volume 44, pp. 30–41. [Google Scholar]
- Rayegani, A.; Nouri, G. Application of smart dampers for prevention of seismic pounding in isolated structures subjected to near-fault earthquakes. J. Earthq. Eng. 2022, 26, 4069–4084. [Google Scholar] [CrossRef]
- GB 50868-2013; China Machinery Industry Federation, Standard for allowable vibration of building engineering, Chinese National Standards. Ministry of Housing and Urban Rural Development of the People’s Republic of China: Beijing, China, 2013.


Disclaimer/Publisher’s Note: The statements, opinions and data contained in all publications are solely those of the individual author(s) and contributor(s) and not of MDPI and/or the editor(s). MDPI and/or the editor(s) disclaim responsibility for any injury to people or property resulting from any ideas, methods, instructions or products referred to in the content. |
© 2023 by the authors. Licensee MDPI, Basel, Switzerland. This article is an open access article distributed under the terms and conditions of the Creative Commons Attribution (CC BY) license (https://creativecommons.org/licenses/by/4.0/).