Article

Numerical Simulation of Street Canyon Morphology and Microclimate in Hot Summer and Cold Winter Zone

School of Architecture and Design, Nanchang University, No. 999 Xuefu Avenue, Honggutan District, Nanchang 330031, China
*
Author to whom correspondence should be addressed.
Buildings 2023, 13(10), 2433; https://doi.org/10.3390/buildings13102433
Submission received: 25 August 2023 / Revised: 23 September 2023 / Accepted: 24 September 2023 / Published: 25 September 2023
(This article belongs to the Special Issue Advances of Healthy Environment Design in Urban Development)

Abstract

:
The design of street canyons has become a focus of attention under the requirements of high-quality urban modernization, while existing research has gradually broken through the basic norms of aesthetic design to include ecological considerations. However, it is only in recent decades that relevant research has been carried out in super and super-large cities in China. In this article, we take Nanchang, one of the largest cities in China, as an example, and use ENVI-met software (v5.5.1.) to simulate and analyze the street canyon of the city. Certain measurements were made and verified to compare the microclimatic conditions of street canyons at different scales. The relationship between street canyon morphology and outdoor thermal comfort was explored in terms of near-surface air temperature, wind speed, and thermal comfort indicators. The results show that there is a high correlation between the morphology of street canyons, such as orientation, aspect ratio interface continuity, and outdoor thermal comfort. Therefore, starting from adjusting the morphological characteristics of street canyons, practical suggestions can be provided for urban planners to guide the sustainable development of contemporary cities and improve the comfort of urban street spaces.

1. Introduction

With the continuing development of cities, their influence on the local climate is stronger than ever. According to the sixth report of the United Nations Intergovernmental Panel on Climate Change (IPCC), the global average temperature will rise by 2.1–3.5 °C if the greenhouse gas emission scenario is not changed [1]. Recent global climate change intensities, temperature anomalies, frequent rainstorms, and other issues have attracted many scholars’ attention [2,3]. In response to the problems of rising global carbon dioxide and other greenhouse gas emissions, China proposed “Carbon peak” and “Carbon neutrality”; “Carbon peak” refers to an inflection point of greenhouse gas emissions. “Carbon neutrality” refers to achieving net-zero carbon dioxide emissions. While implementing these two plans, the latest “China Peak Carbon Dioxide Emissions Carbon Neutralisation Progress Report (2022)” emphasizes the need to implement differentiated and detailed plans in different regions and industries [4]. As a result, green and low-carbon transformation in various regions requires the development of regional reform plans based on local basic conditions. The Master Plan of National Land and Space of Nanchang City (2021–2035), published in 2022, also aspires to “promoting urban transformation, building an innovative and green central city” [5]. The development of green cities and the quality of urban human settlements will be the focus of future development.
However, due to high concentrations of population and industry in cities, a series of urban street spaces have emerged, with narrow urban street spaces surrounded by continuous and tall buildings on both sides. Street valleys are not only a fundamental component of a city, but are also an important place for urban residents to live and play. They are typically one of the types of public space with the highest use frequency, the most severe automobile exhaust pollution, and the highest daily population density. As a result, studying the microclimate environment in street valleys can help to optimize the urban environment and have a positive impact on the cities’ future sustainable development.
Temperature, wind speed, humidity, and solar radiation are crucial climatic parameters for assessing the thermal conditions of street valleys, and they also serve as significant indicators for evaluating human thermal comfort. Urban meteorologist T.R. Oke was among the pioneers in exploring the connection between street design and the physical climate. They believed that urban design will influence the urban climate and that the geometric shape of street valleys will also influence the outdoor thermal environment [6].
Research that investigates thermal environmental quality using temperature as an evaluation factor concentrates on the block scale and geometry, including the aspect ratio of street valley space and the cooling effect of the sky’s visual factors. Busato et al. (2014) conducted extensive measurements and simulations at different time periods, and the types of H/W, SVF, and surface determine very different heat exchanges between urban sites, air, and sky [7]. Bourbia et al. (2004) investigated the effect of street size and proportion on the thermal environment in low-latitude dry and hot areas, such as Algeria. The findings revealed that the surface temperature was significantly influenced by the street shape, and was closely related to the street geometry and the sky visibility factor [8]. Deng et al. (2018) also simulated and studied different forms of urban block schemes, and found that the aspect ratio and openness of street valleys played major roles in the influence of temperature and thermal comfort [9].
Wind as a research point for thermal environmental quality concentrates on the wind-blocking effects of building density and street geometry. Kja et al. (2020) used numerical simulation to investigate the relationship between extreme wind environments and urban morphology on the block level [10]. Wu et al. (2009) studied the relationship between the architectural layout and the wind environment in Shenzhen on the macro scale. They discovered that changing the architectural layout significantly changes the wind speed and direction of the dominant wind in the city [11]. Feng et al. (2019) discovered that a dense road network structure increased wind accessibility and improved ventilation effects by investigating the internal correlation between wind environment and spatial form [12]. By controlling the numerical changes of street morphological characteristics, Ying et al. (2018) studied the changing laws of the influence of shape factors such as line attachment rate, street interface density, and street height–width ratio on the wind environment. The results show that the decrease in street interface density would reduce the comfort in the street [13].
In relation to materials, we concentrate on the regulatory effect of physical properties on heat islands. Han et al. (2015) analyzed the ability of biomimetic building envelopes to reflect solar radiation. The results indicate that biomimetic structures can reduce the reflected heat of solar radiation from buildings in close-range spaces, thereby reducing the heat island effect [14]. Kousis et al. (2023) conducted a retrospective study on CPs (Cool Pavements). The performance of various evaluation scales was analyzed from the perspective of material properties, and corresponding limitations, research gaps, and future development directions were deeply explored [15]. Fabiania et al. (2019) studied the potential of urban roof materials to counteract urban overheating in summer. The results demonstrate that using thermochromic materials produces a smart optical response to local environmental stimuli, and allows for enhanced shortwave solar reflection in summer conditions, reduced reflected solar fraction in winter, and adaptive properties during transition periods [16].
Research on solar radiation concentrates on the obstruction of street trees and buildings to direct sunlight. Li et al. (2018) investigated the street geometry and the spatial distribution of street trees in Boston, and studied the shading effect of street trees with the shadow rate as the evaluation index [17]. Yang et al. (2018) analyzed the thermal environment characteristics of typical streets in winter and summer, and concluded that the openness of streets is the key factor affecting the thermal comfort of street space [18]. In the process of studying the influence of solar radiation on the thermal environment and thermal comfort of streets, Li et al. (2016) divided the street space into latent heat and sensible heat areas. The street space where buildings and pavements are directly exposed to the sun is the sensible heat area, and the street space where physical masks such as street trees block the direct sunlight is the latent heat area [19]. Wang et al. (2008), for example, conducted a simulation study on the street thermal environment in Wuhan. The results show that the best street thermal environment in Wuhan is in the Gezizhuang area, which is at an angle of 30 degrees off the true north direction. The results also show that the sloping roof helps to provide shelter in summer, while wide streets should be oriented east–west, and narrow lanes should be north–south [20].
Limor et al. (2004) summarized the typical geometric shapes of streets and studied the influence of street interface density, street height–width ratio, and building depth on air temperature through numerical simulation software [21]. Sun et al. (2016) established the ideal urban space model and block space model using software, and found that street orientation, height–width ratio, envelope coefficient, shadow coefficient, enclosure, and albedo have great influences on the thermal environment [22]. Yang et al. (2018) simulated six streets and lanes in the old city of Beijing using ENVI-met software, and found that the microclimate environment in the streets is very different from the overall climate of the city, and the thermal environment in the streets is affected by factors such as physical space environment and its use state [23]. Du et al. (2015) believe that the trend makes the greatest contribution to the thermal environment of living streets and valleys in Guangzhou, and the optimal trend is the southeast–northwest trend, based on numerical simulations of the thermal environment of living streets and valleys in Guangzhou. The thermal environment optimization design strategies and methods of Guangzhou living streets and valleys at all levels are obtained through optimization and induction when combined with field investigations and existing codes. The thermal environment of street valleys is influenced by local climatic conditions and geographical latitude, and the research results in different climatic regions cannot be simply analogized [24,25].
Based on the comprehensive analysis of the research results at home and abroad, it can be found that computer numerical simulation has become an important way to quantitatively analyze the impact of the urban thermal environment on the basis of field measurement. However, existing research mostly focuses on the spatial optimization of super cities and super-large cities, as these types of cities typically represent areas with high population concentrations. But the number of medium to large cities is larger, and the living population is not in the minority either. It is quite necessary to improve the quality of living space in such cities. Simultaneously, considering the different climates in different regions, selecting representative medium-sized and large cities in specific climate zones for research may have certain reference significance for the climate adaptation transformation of similar cities in the region. In addition, most of the existing studies focus on a single physical factor, while the thermal comfort of streets is affected by many factors. At the same time, in the simulation study of the microclimate influence mechanism, there are many studies on influencing factors such as urban greening and water bodies. But from the perspective of urban construction land, the area of green space and water bodies that can be used for planning and layout is relatively limited, while the area of streets or buildings accounts for a huge proportion of the city. Hence, the paper selects the microclimate of street canyons in the central urban area of Nanchang in the hot summer and cold winter regions for research to study the impact of urban street or building layouts on the local thermal environment. Due to the main focus of this study being on several influencing factors closely related to morphology, street greening, building materials, interface density, and other content, they are temporarily not within the scope of discussion. This aspect will continue in future research.

2. Case Study

2.1. Study Subjects

Nanchang, the provincial city of Jiangxi Province, is an important central city in China’s middle reaches of the Yangtze River and the central city of the State Council-approved Poyang Lake Eco-Economic Zone. Nanchang was designated as a type I big city in China in December 2022 due to its rapid development and expanding city scale, it being a city with a permanent population of more than 3 million but less than 5 million. Nanchang, in the northwestern part of central Jiangxi, has a subtropical monsoon climate with long summers and long winters. It is a typical Chinese city with “hot summers and cold winters” and is one of China’s “four stoves”. Nanchang’s urban construction dates back to the early Han Dynasty and gradually formed a unique urban pattern of “one large river, three little rivers, and ten lakes” in the evolution process of successive dynasties. But the city side is still evolving and expanding. The growth of a city is inextricably linked to the construction of the central city.
This paper investigates the street canyons in downtown Nanchang, extracts typical geometric shapes and builds physical models, and simulates and analyzes the thermal environment of urban streets under different layout forms from the standpoint of urban design. On the basis of meeting the technical regulations of Nanchang urban planning management, the characteristics of the microclimate inside the streets are analyzed, and their regular changes are summarized, in order to provide some reference and basis for street design and optimization in Nanchang urban renewal.
The annual average temperature in downtown Nanchang is 17–17.7 °C, the extreme historical maximum temperature is 40.9 °C, the extreme historical minimum temperature is −15.2 °C, and the annual average relative humidity is 78.5%. According to monthly climate data from China Ground International Exchange Station, the average summer temperature is 29.84 °C, the average maximum temperature is 38.72 °C, and the wind direction in summer is southeast wind. The average winter temperature is 3.12 °C, the average minimum temperature is −3.39 °C, and the wind direction in winter is north wind.

2.2. Description of the Studied Area

The main factors affecting the street layout of the microclimate are street aspect ratio, street orientation, sky visibility factor, and street interface density. This paper mainly analyzes the orientation and aspect ratio of streets in the central urban area of Nanchang, and the target area has a high population density and high development intensity. Through the arrangement of urban planning documents and related papers about Nanchang, it is concluded that the road network structure is regular and complete, and is basically vertically distributed.
With the classification of roads in China, the streets in the central urban area of Nanchang can be divided into expressways, main roads, secondary roads, and branch roads. According to the road network system planning map of the central urban area of Nanchang Land and Space Master Plan (2021–2035), there are 20 main roads in the central urban area, 8 in the north–south direction and 12 in the east–west direction; 174 secondary roads, 91 from north to south and 83 from east to west; and approximately 74 branches, 25 in the north–south direction and 49 in the east–west direction, according to incomplete statistics.
Because there are no pedestrians on the expressways, the expressway study will not be undertaken in this article. Furthermore, plots containing historical blocks of the old city will be excluded, since the buildings along the street in the old city street valley are mostly one to two floors, and can no longer meet the development requirements of modern urban areas. The living street is the most closely related to citizens’ daily lives in the city, mainly comprising urban secondary roads and branches. As a result, the research object defined in this paper is the canyon-like space formed by urban secondary roads or branches with living functions and buildings on both sides.
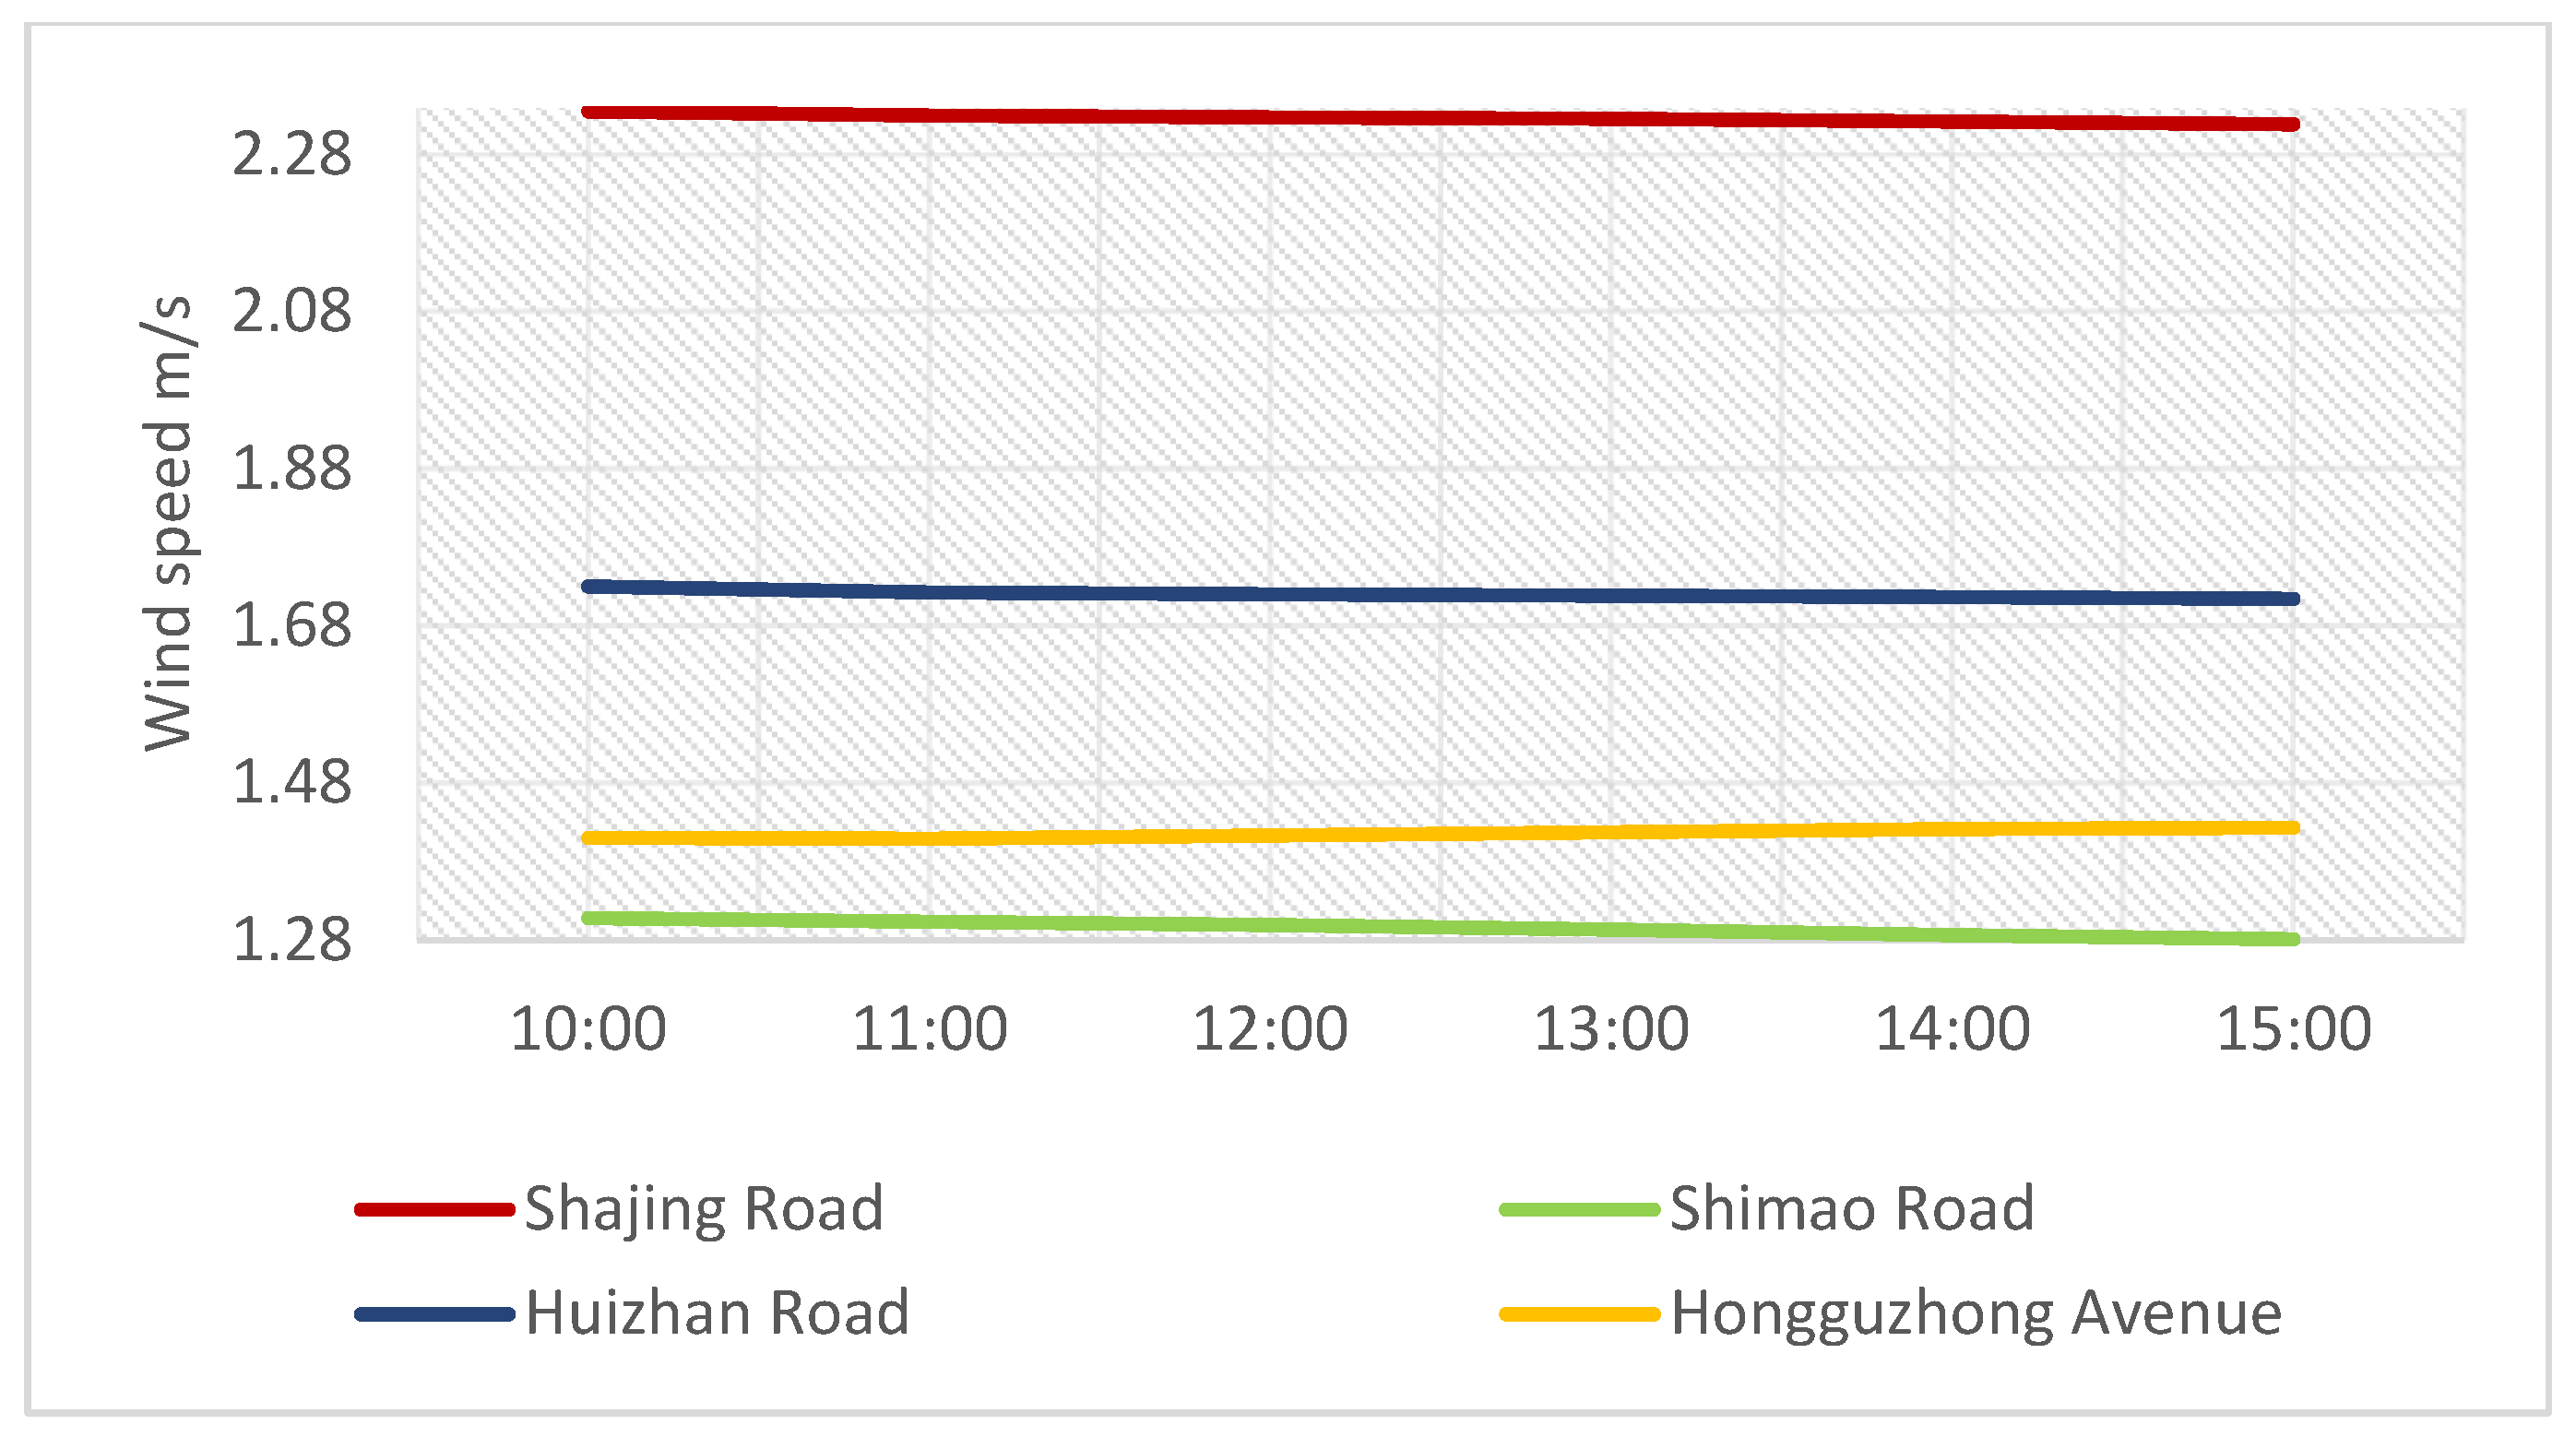
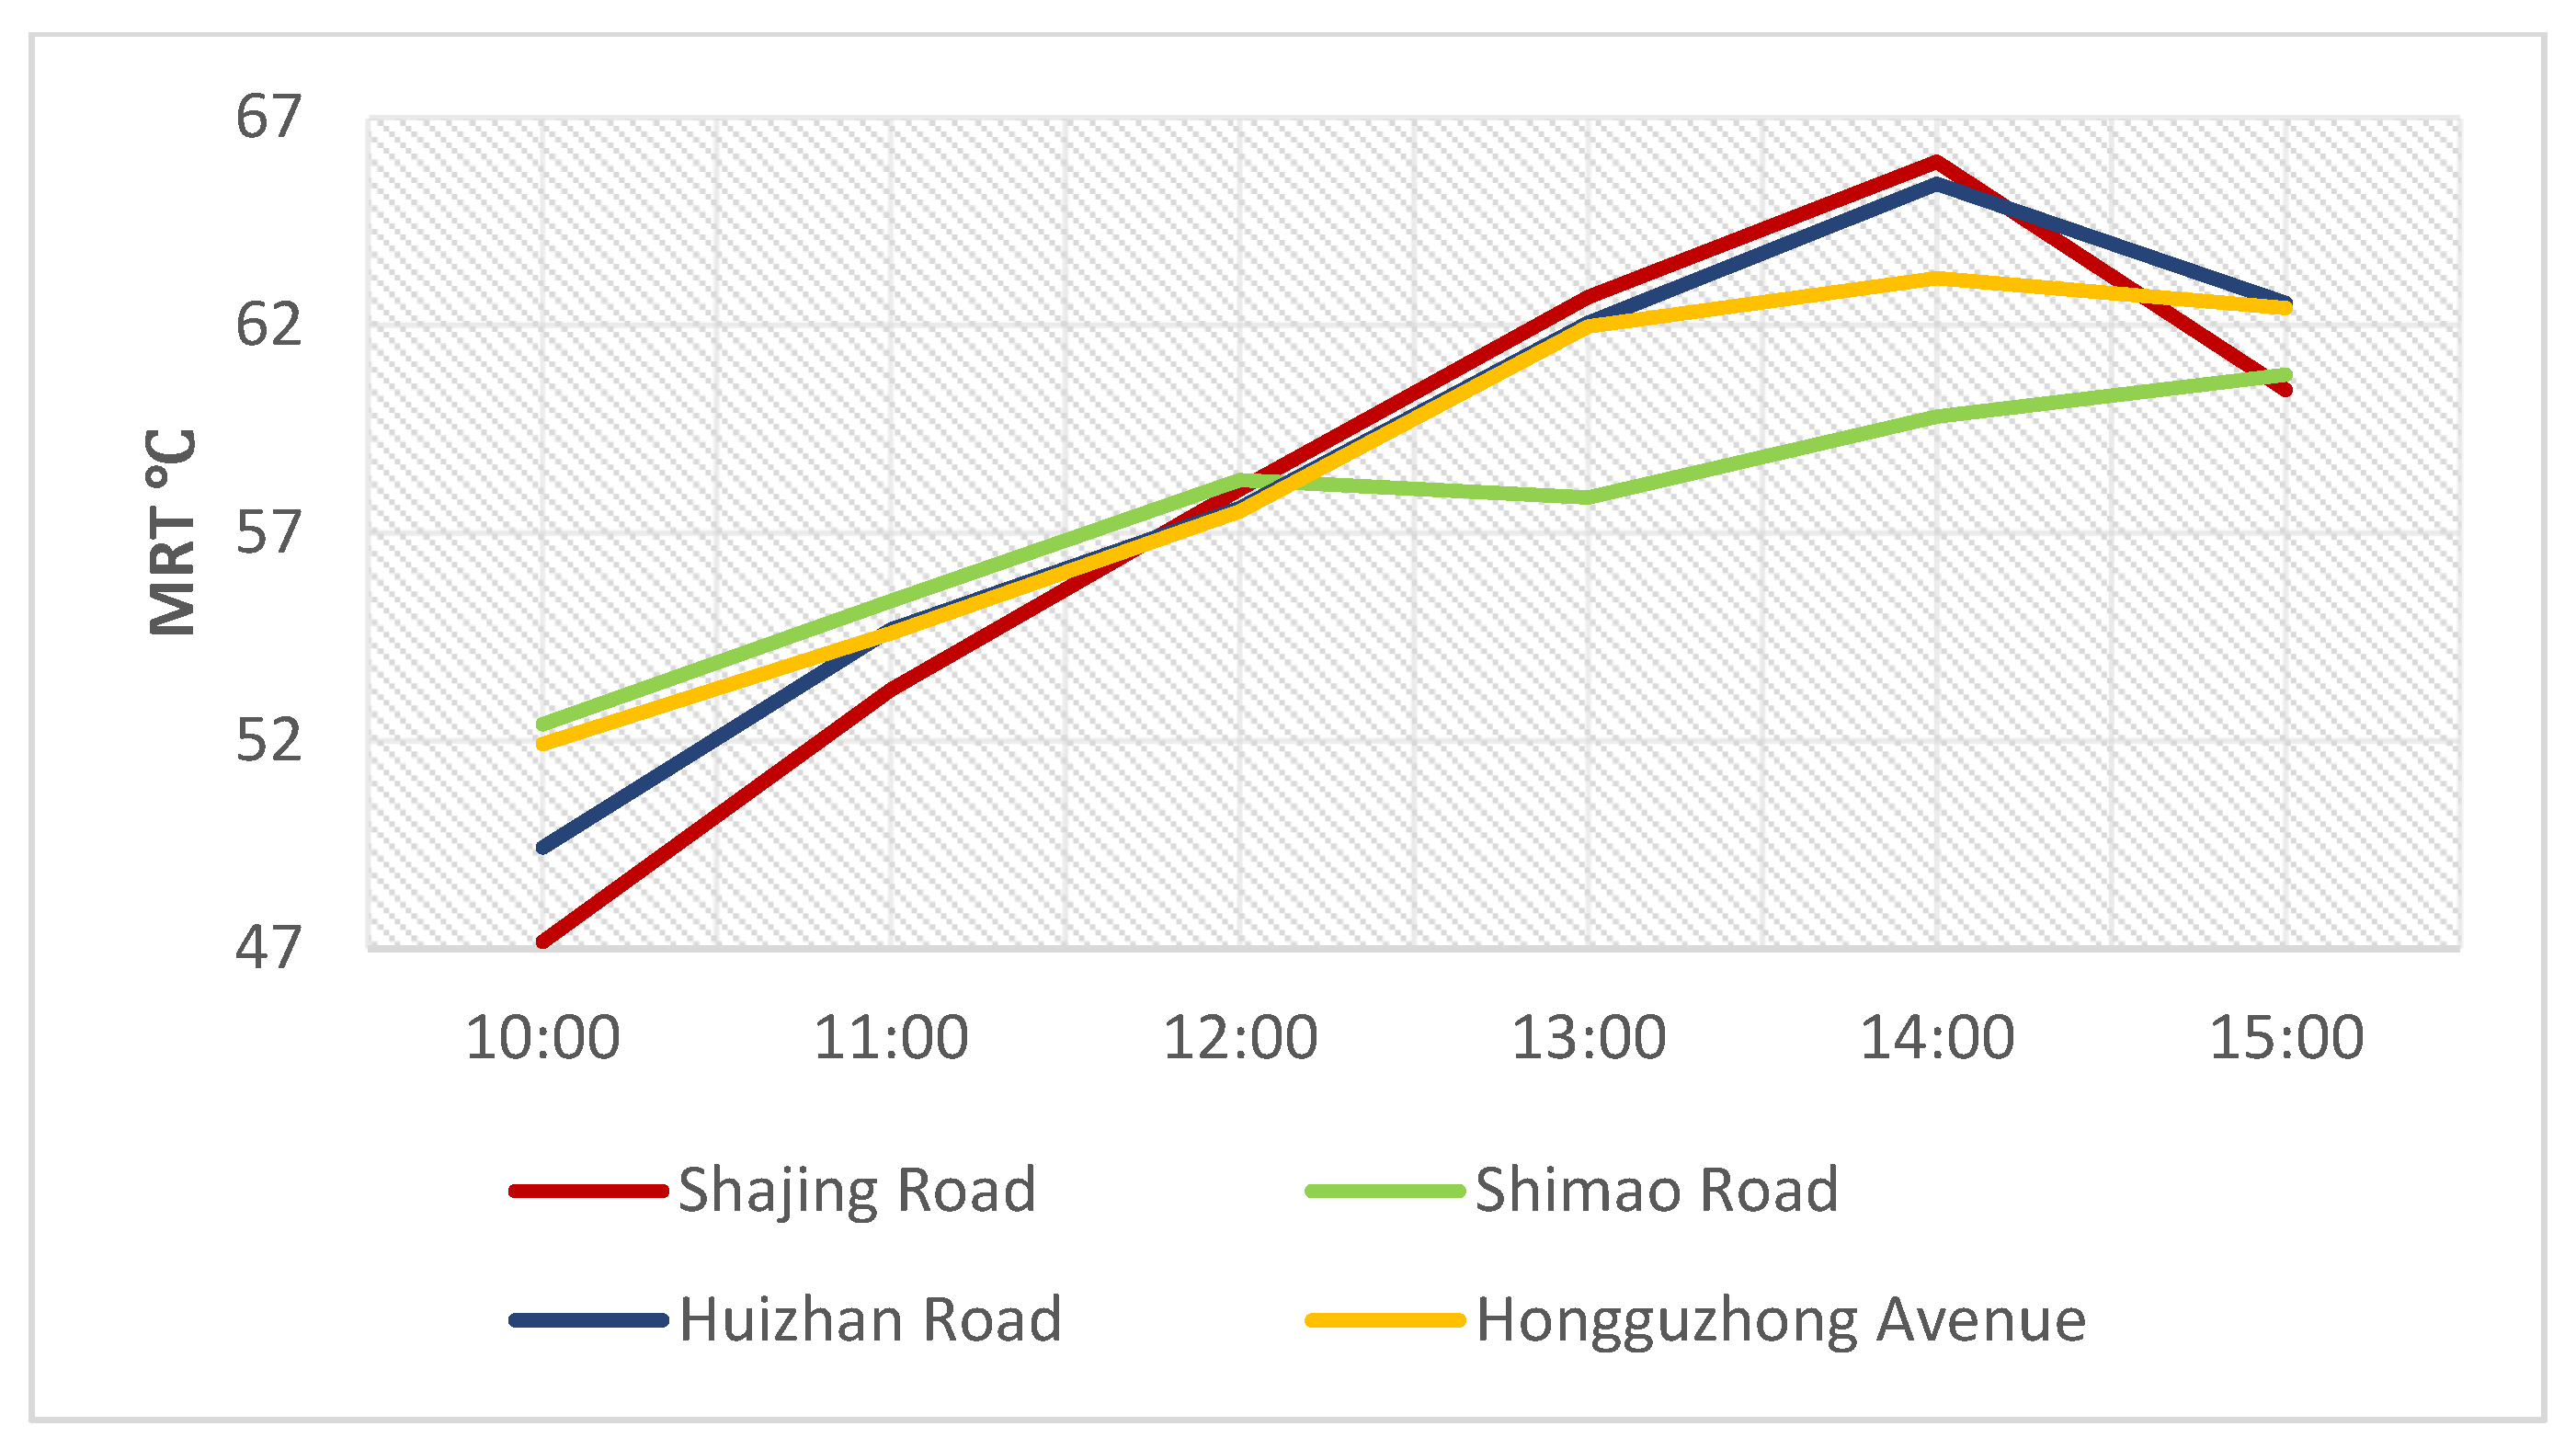
In this paper, 24 streets were chosen from the representative urban streets of Nanchang using Google Earth and Street View, and a sample plot survey was conducted in March 2023 on Hongguzhong Avenue, Shimao Road, Huizhan Road, and Shajing Road (Table 1). Because the distance between two intersections in downtown Nanchang is typically 100–260 m, the length of the street valley is chosen to be approximately 150 m to eliminate the influence of intersection morphological characteristics on the microclimate of the street valley. As the heights of buildings along the street vary, the research objects were selected to be as symmetrical as possible. The height calculation was based on the average building height of a uniformly continuous 150 m section. The sample plot survey was primarily concerned with street layout form, which had no correlation with survey time, so the actual survey had no impact on the simulation data.

2.3. Physical Models

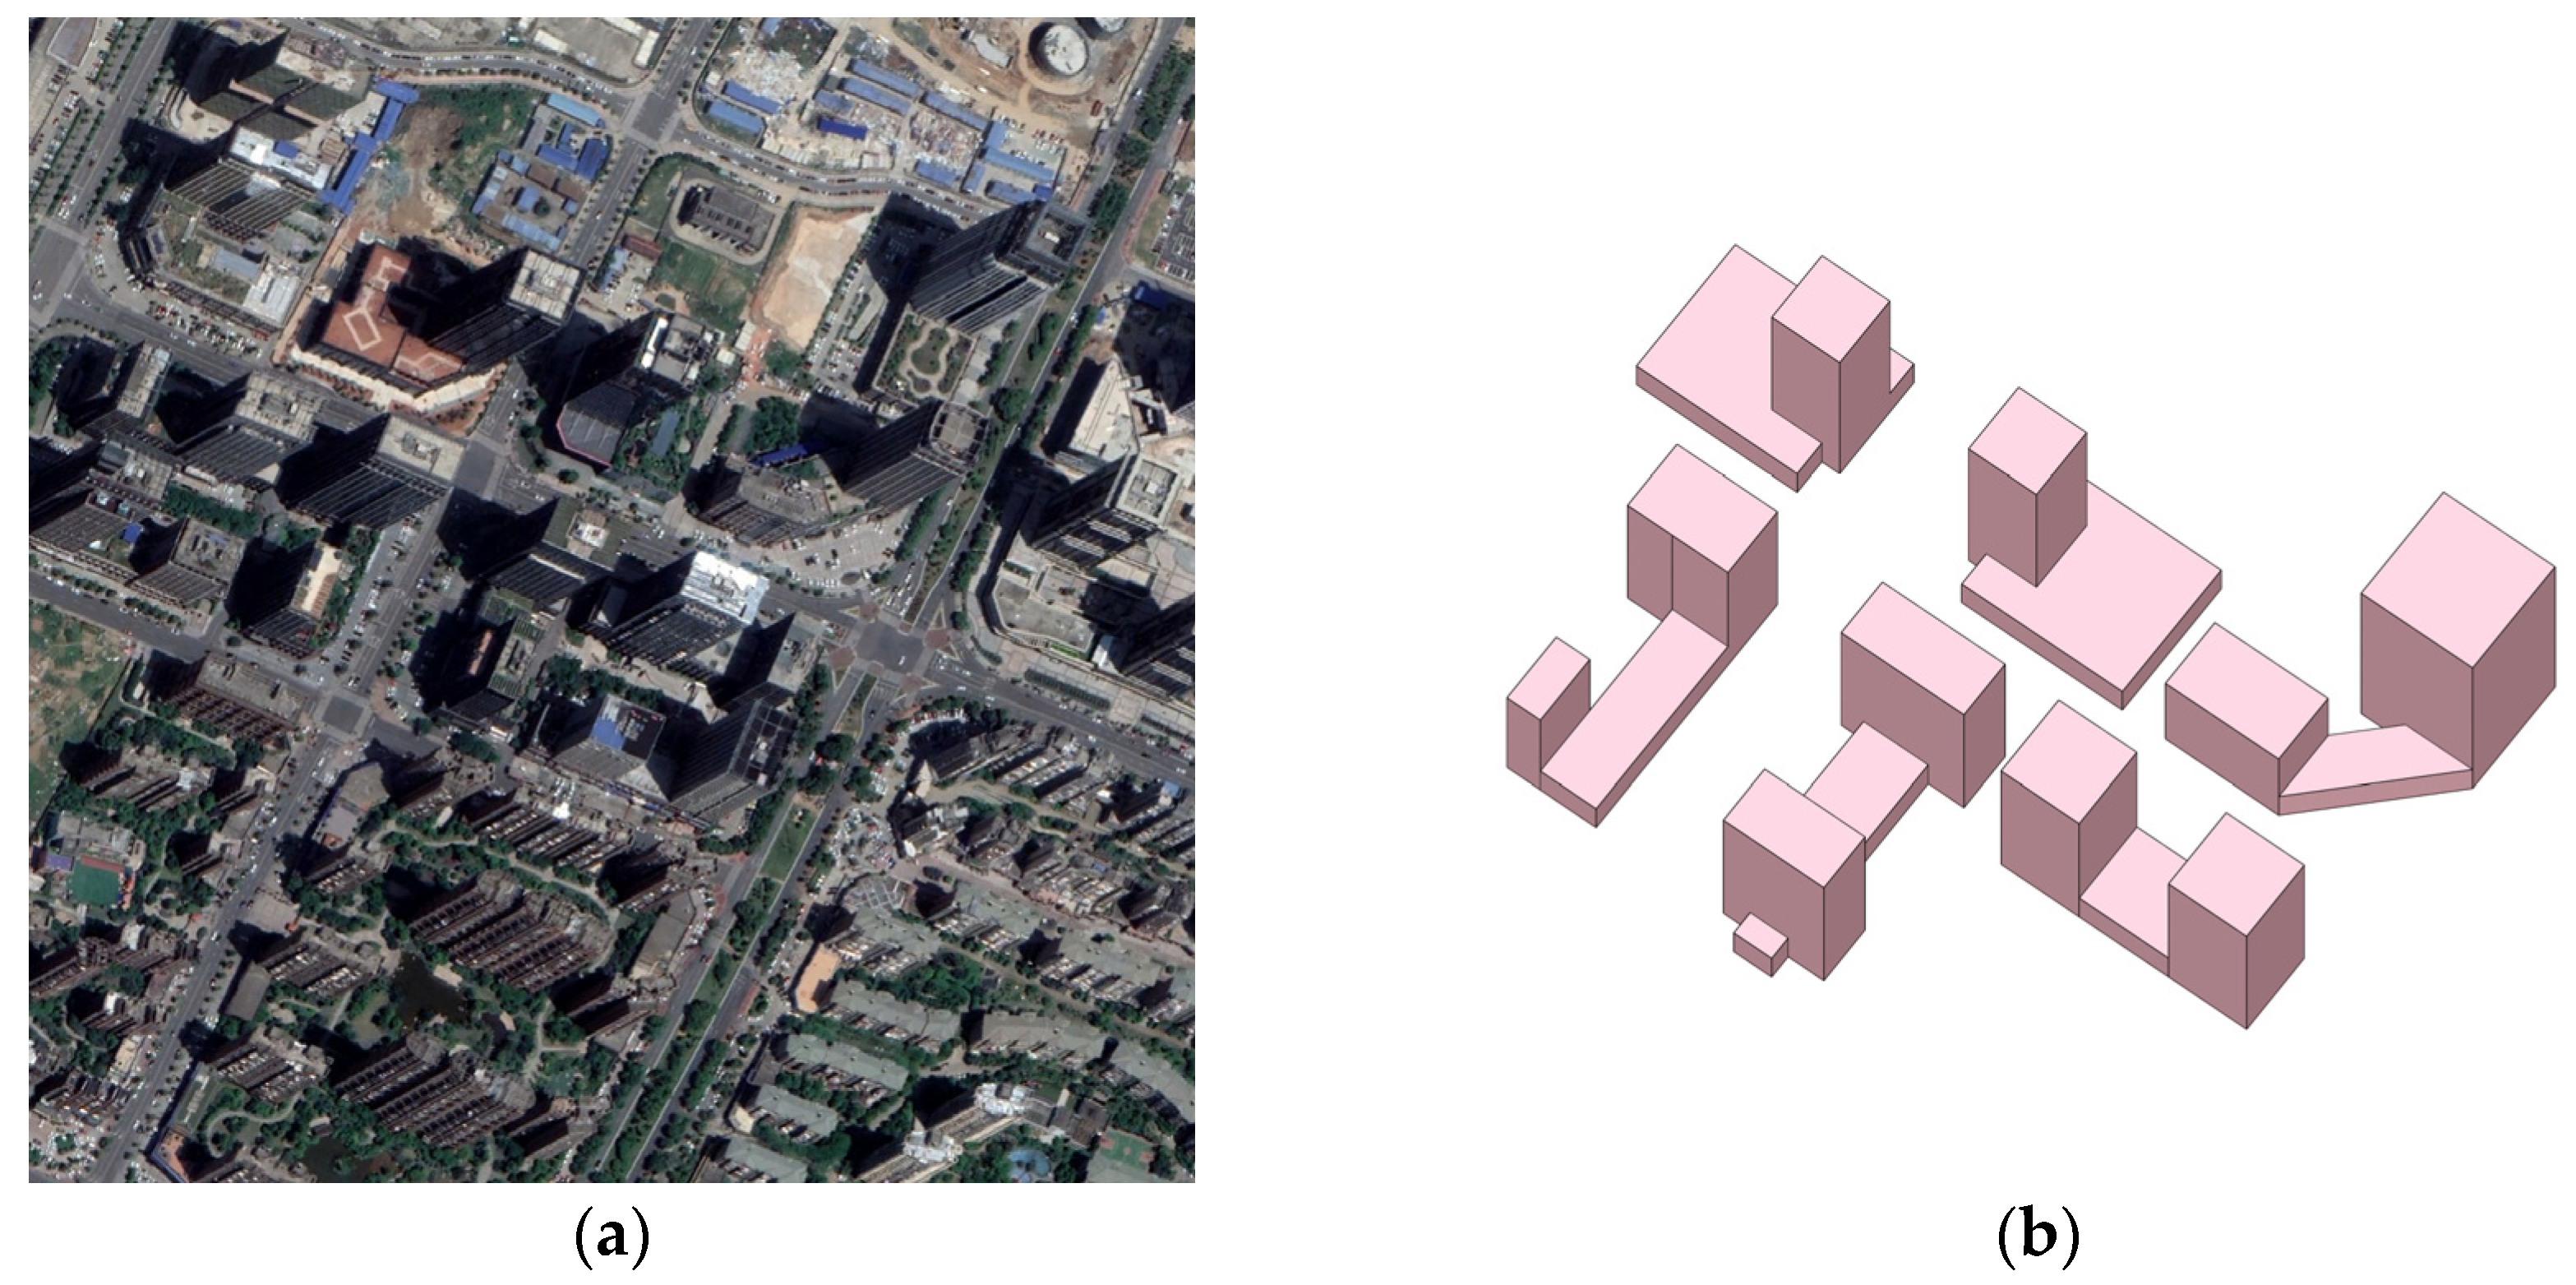
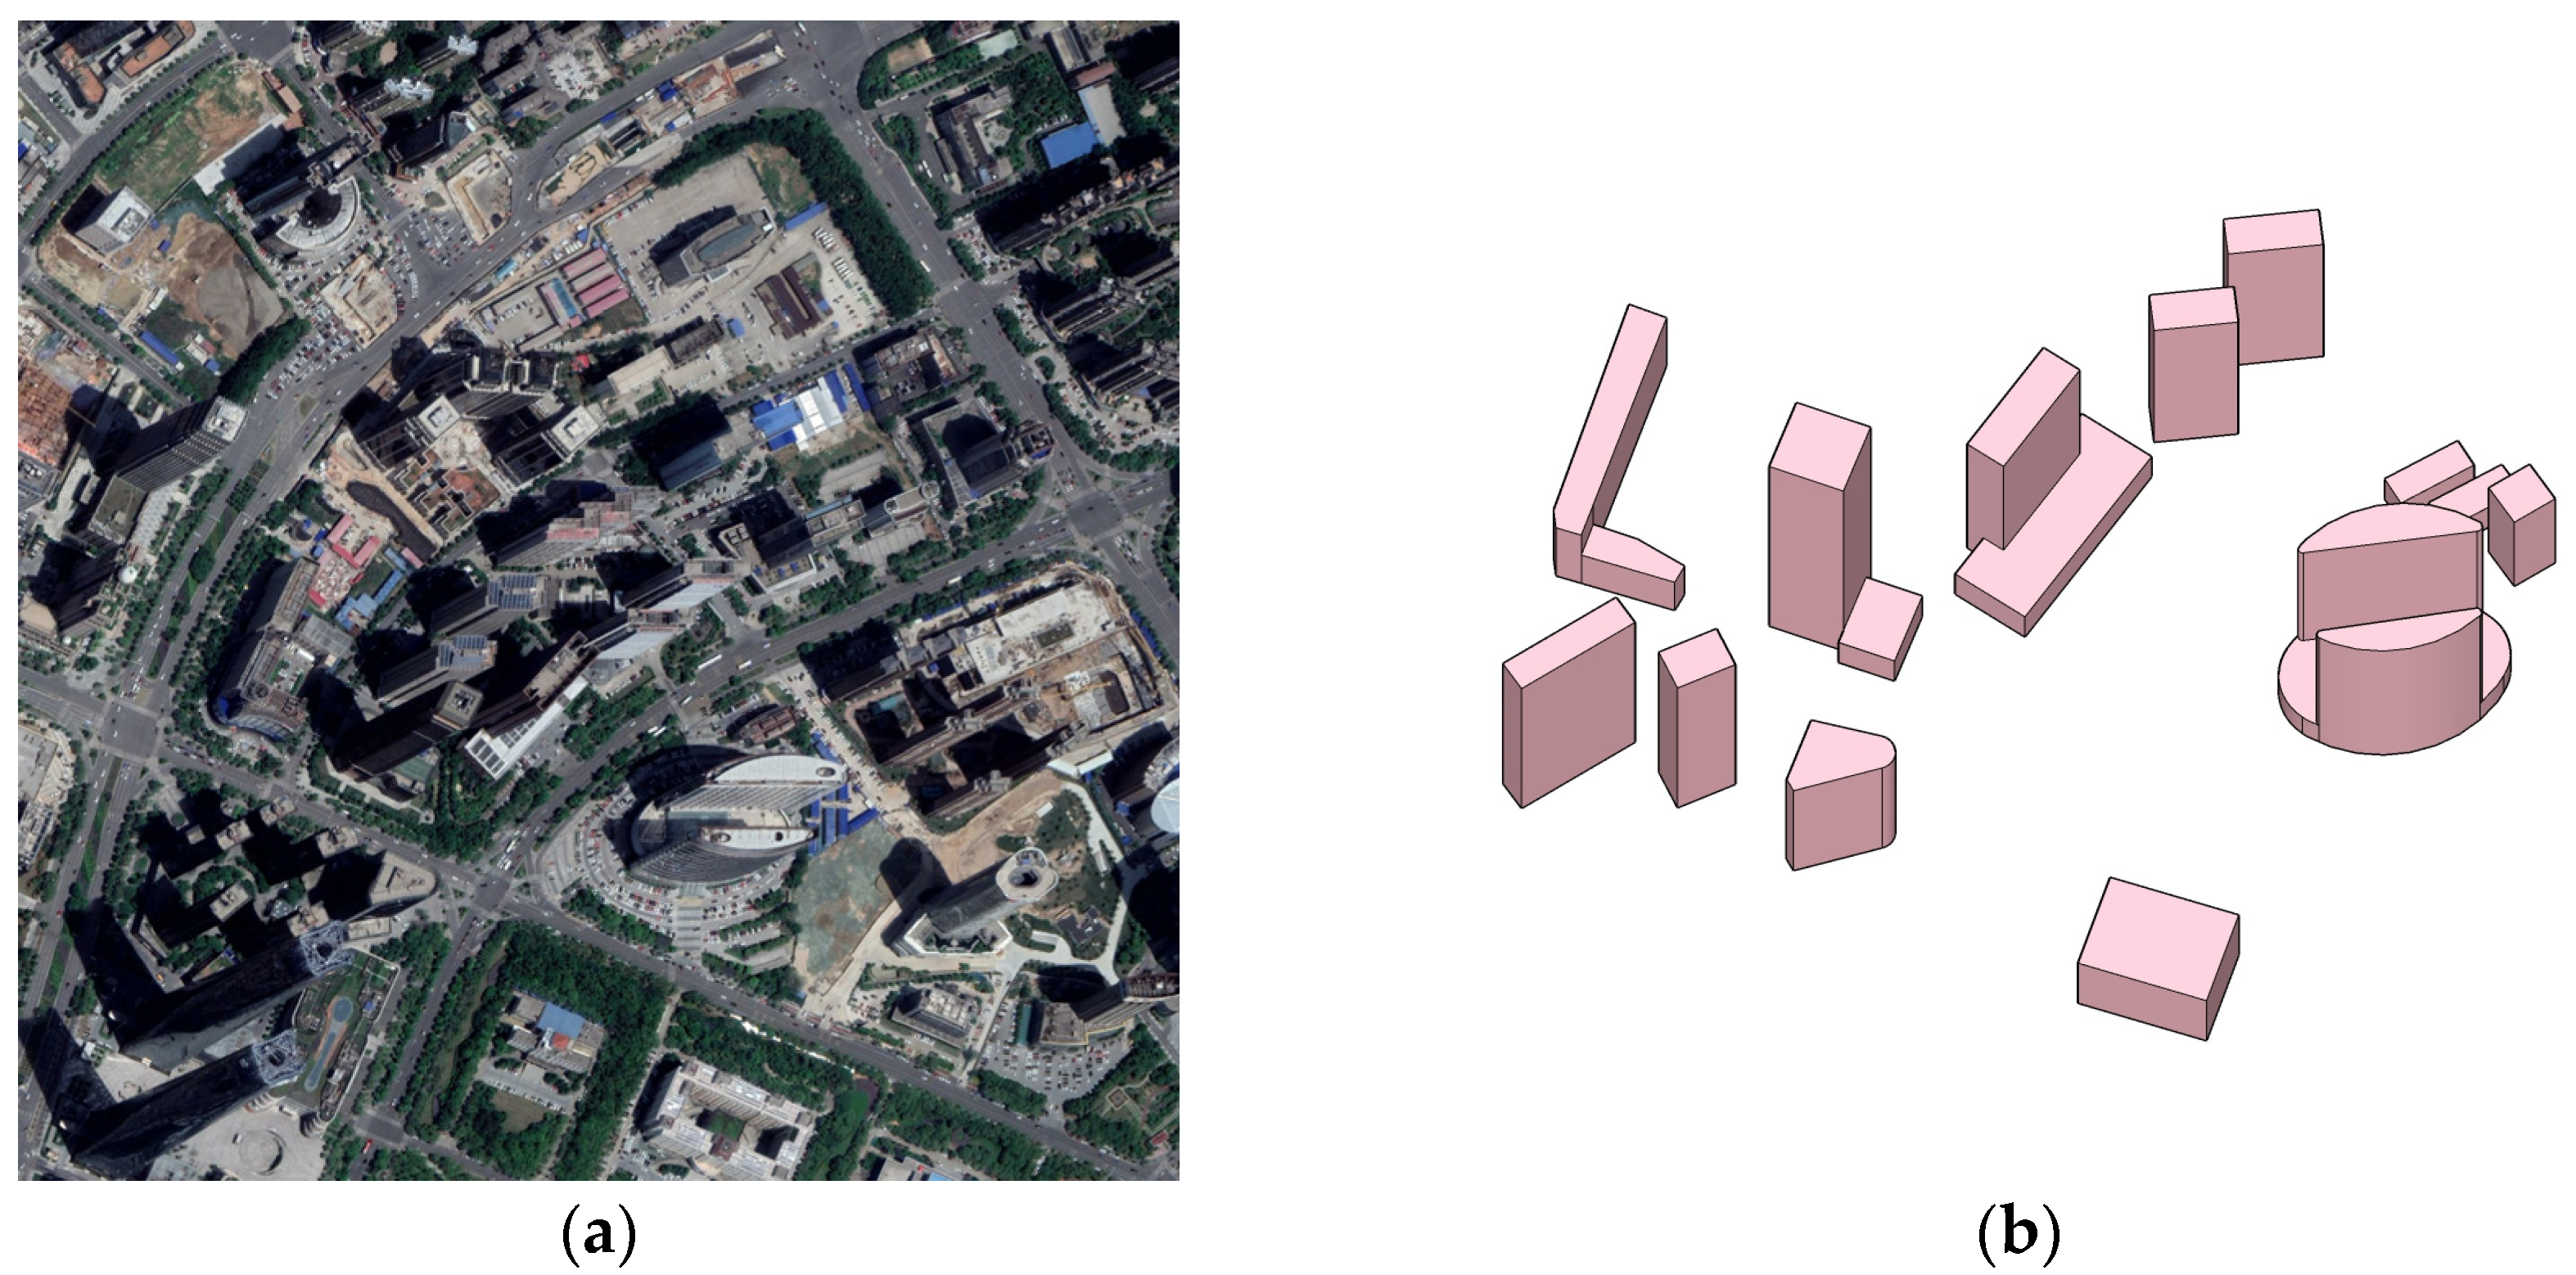
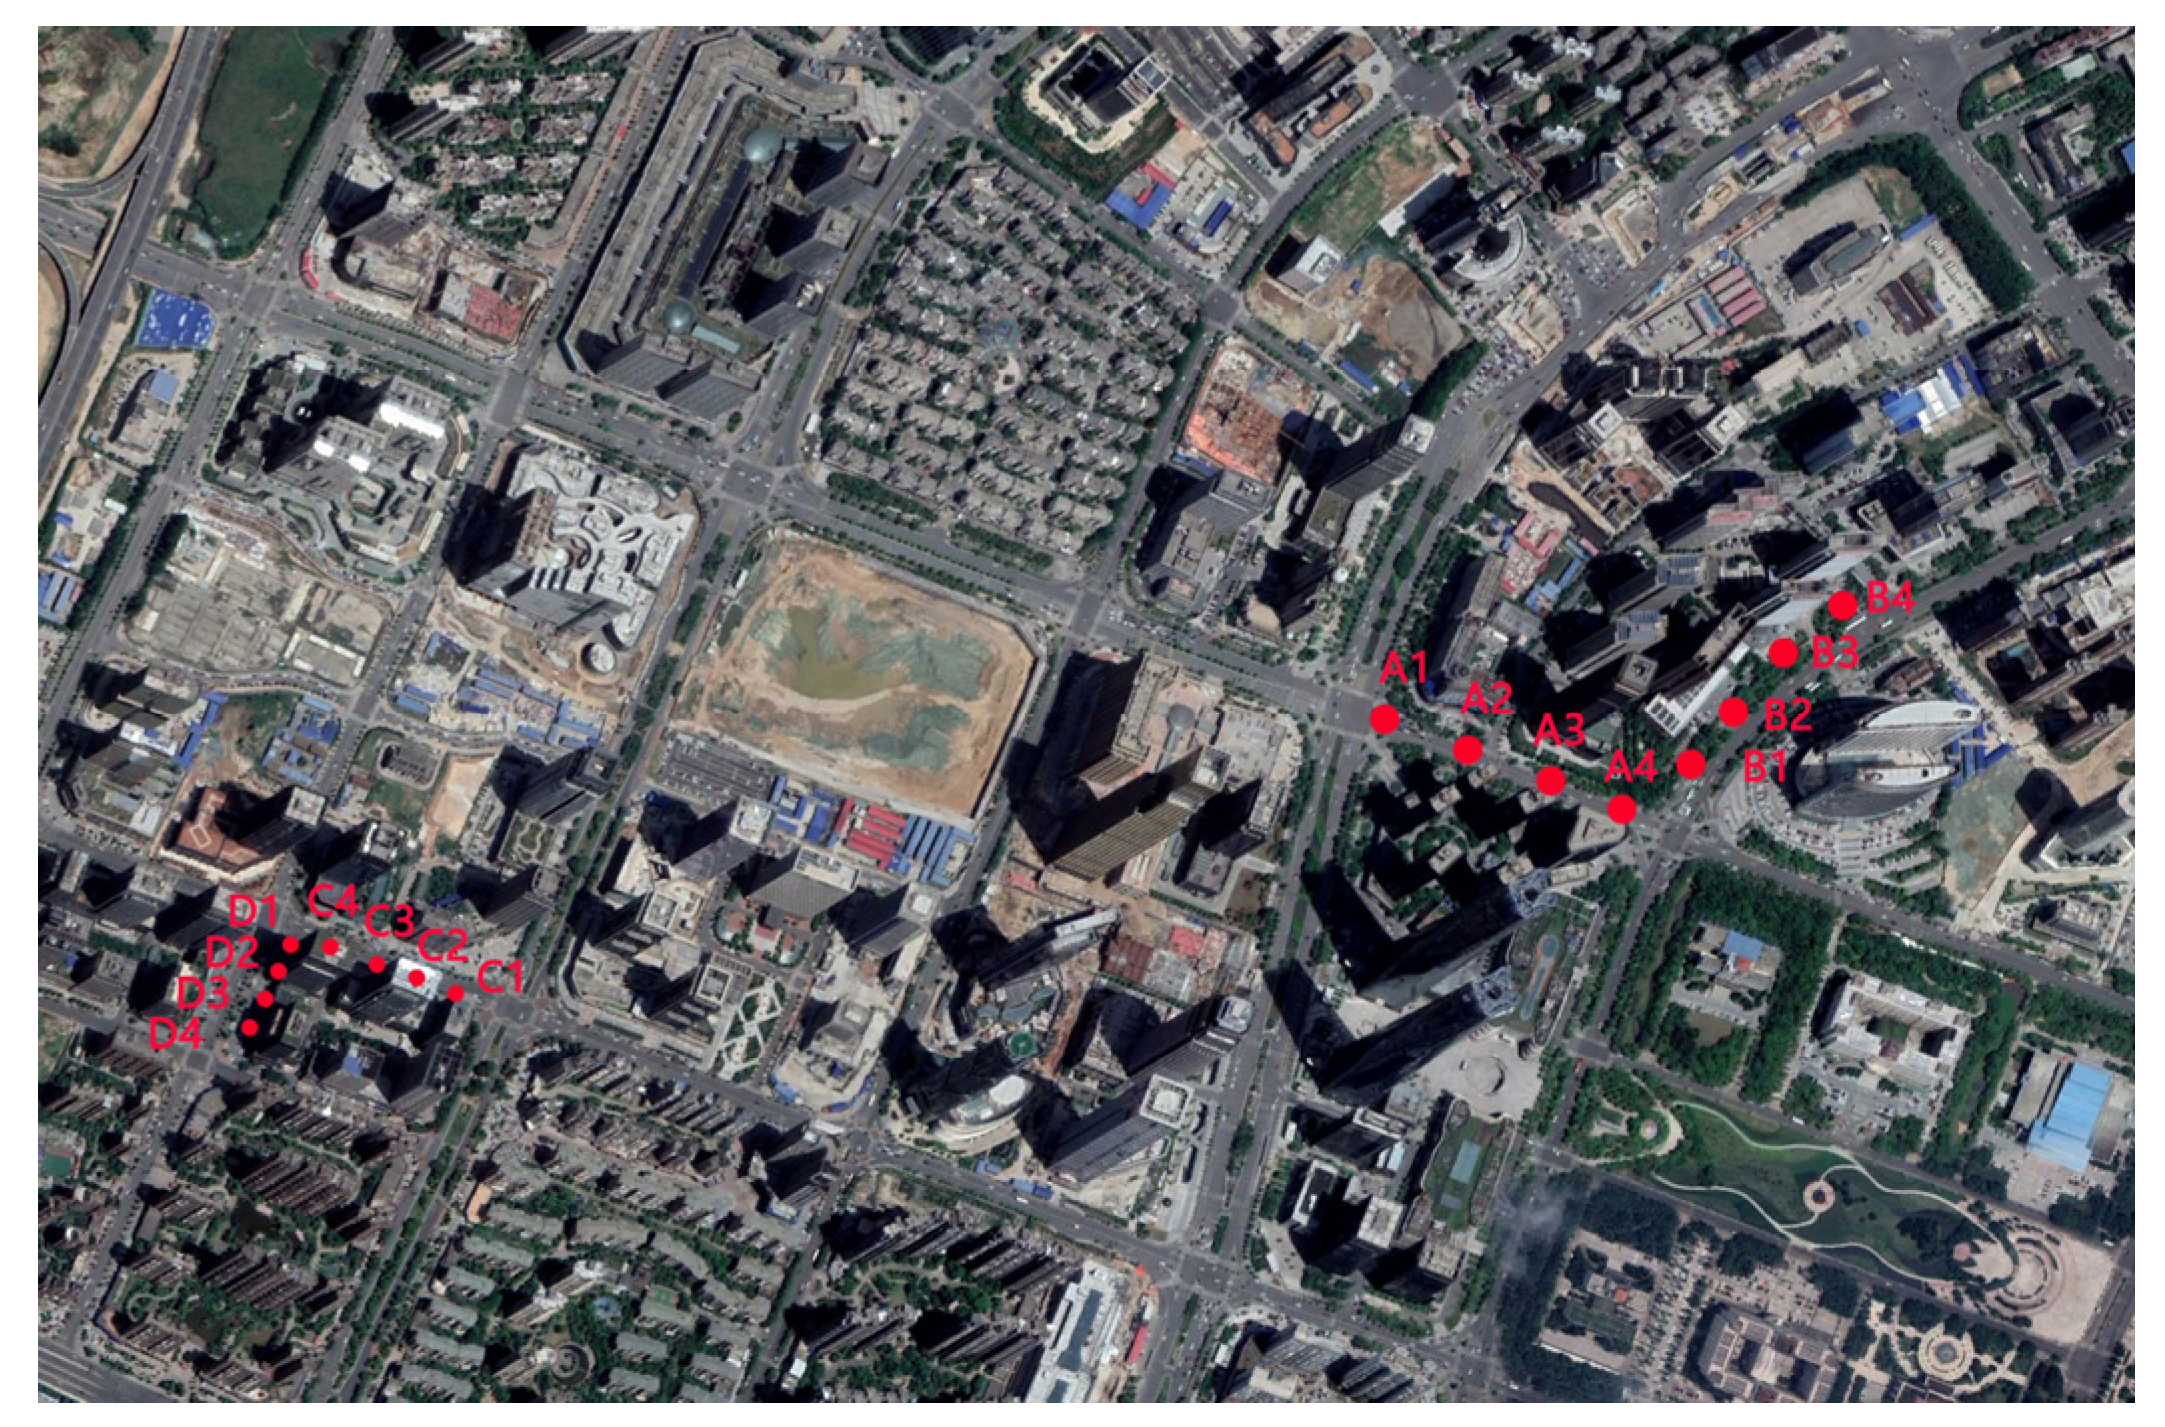
Based on on-site investigations, 2 east–west streets and 2 north–south street valleys were selected for simulation from 24 streets. For operability in the actual measurement process, adjacent roads are preferred (Figure 1). Finally, four representative roads were selected as the study’s simulated streets: Hongguzhong Avenue and Shajing Road in the north–south direction, and Huizhan Road and World Trade Road in the east–west direction (Figure 2). Sketchup creates a street model based on the actual width and height of the four selected streets (Figure 3). Due to the limited performance of computers, the experiment appropriately simplified the internal details of the street model while maintaining accuracy. Simultaneously, to ensure the simulation’s effectiveness, the simulation scale was set to 540 m. This paper mainly investigated the impact of street layout on microclimate using the aspect ratio and street orientation.

3. Materials and Methods

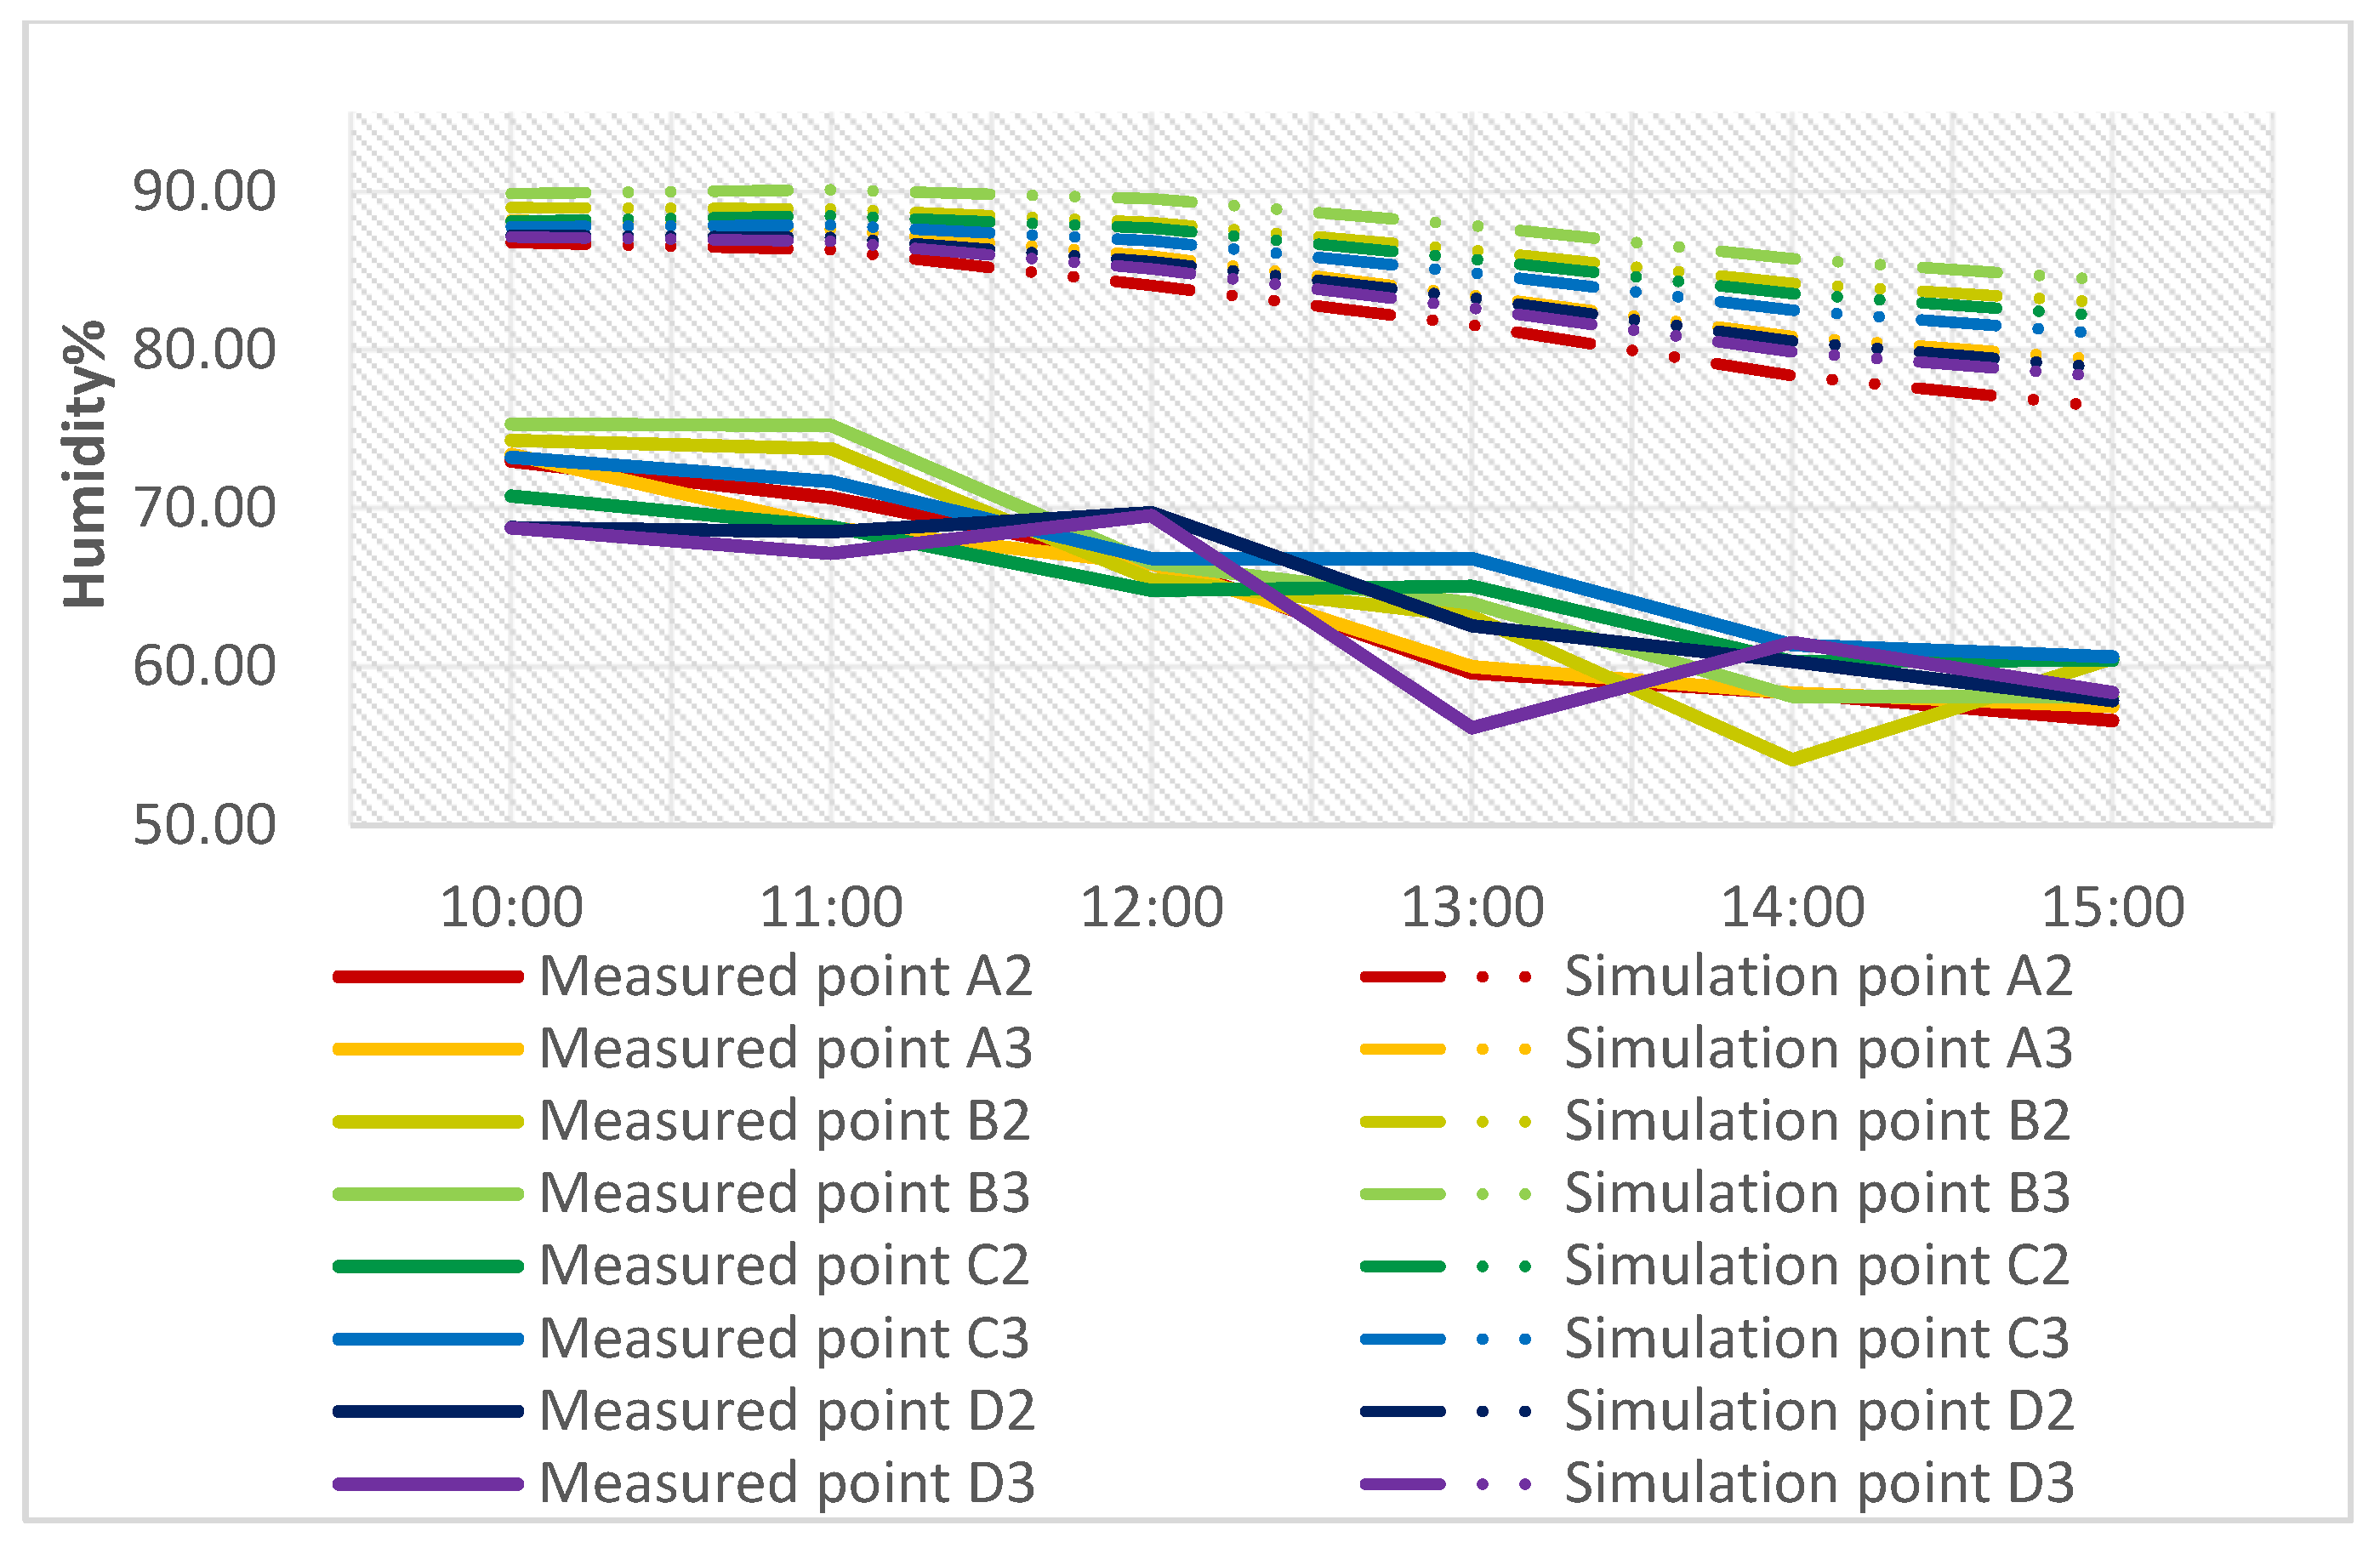
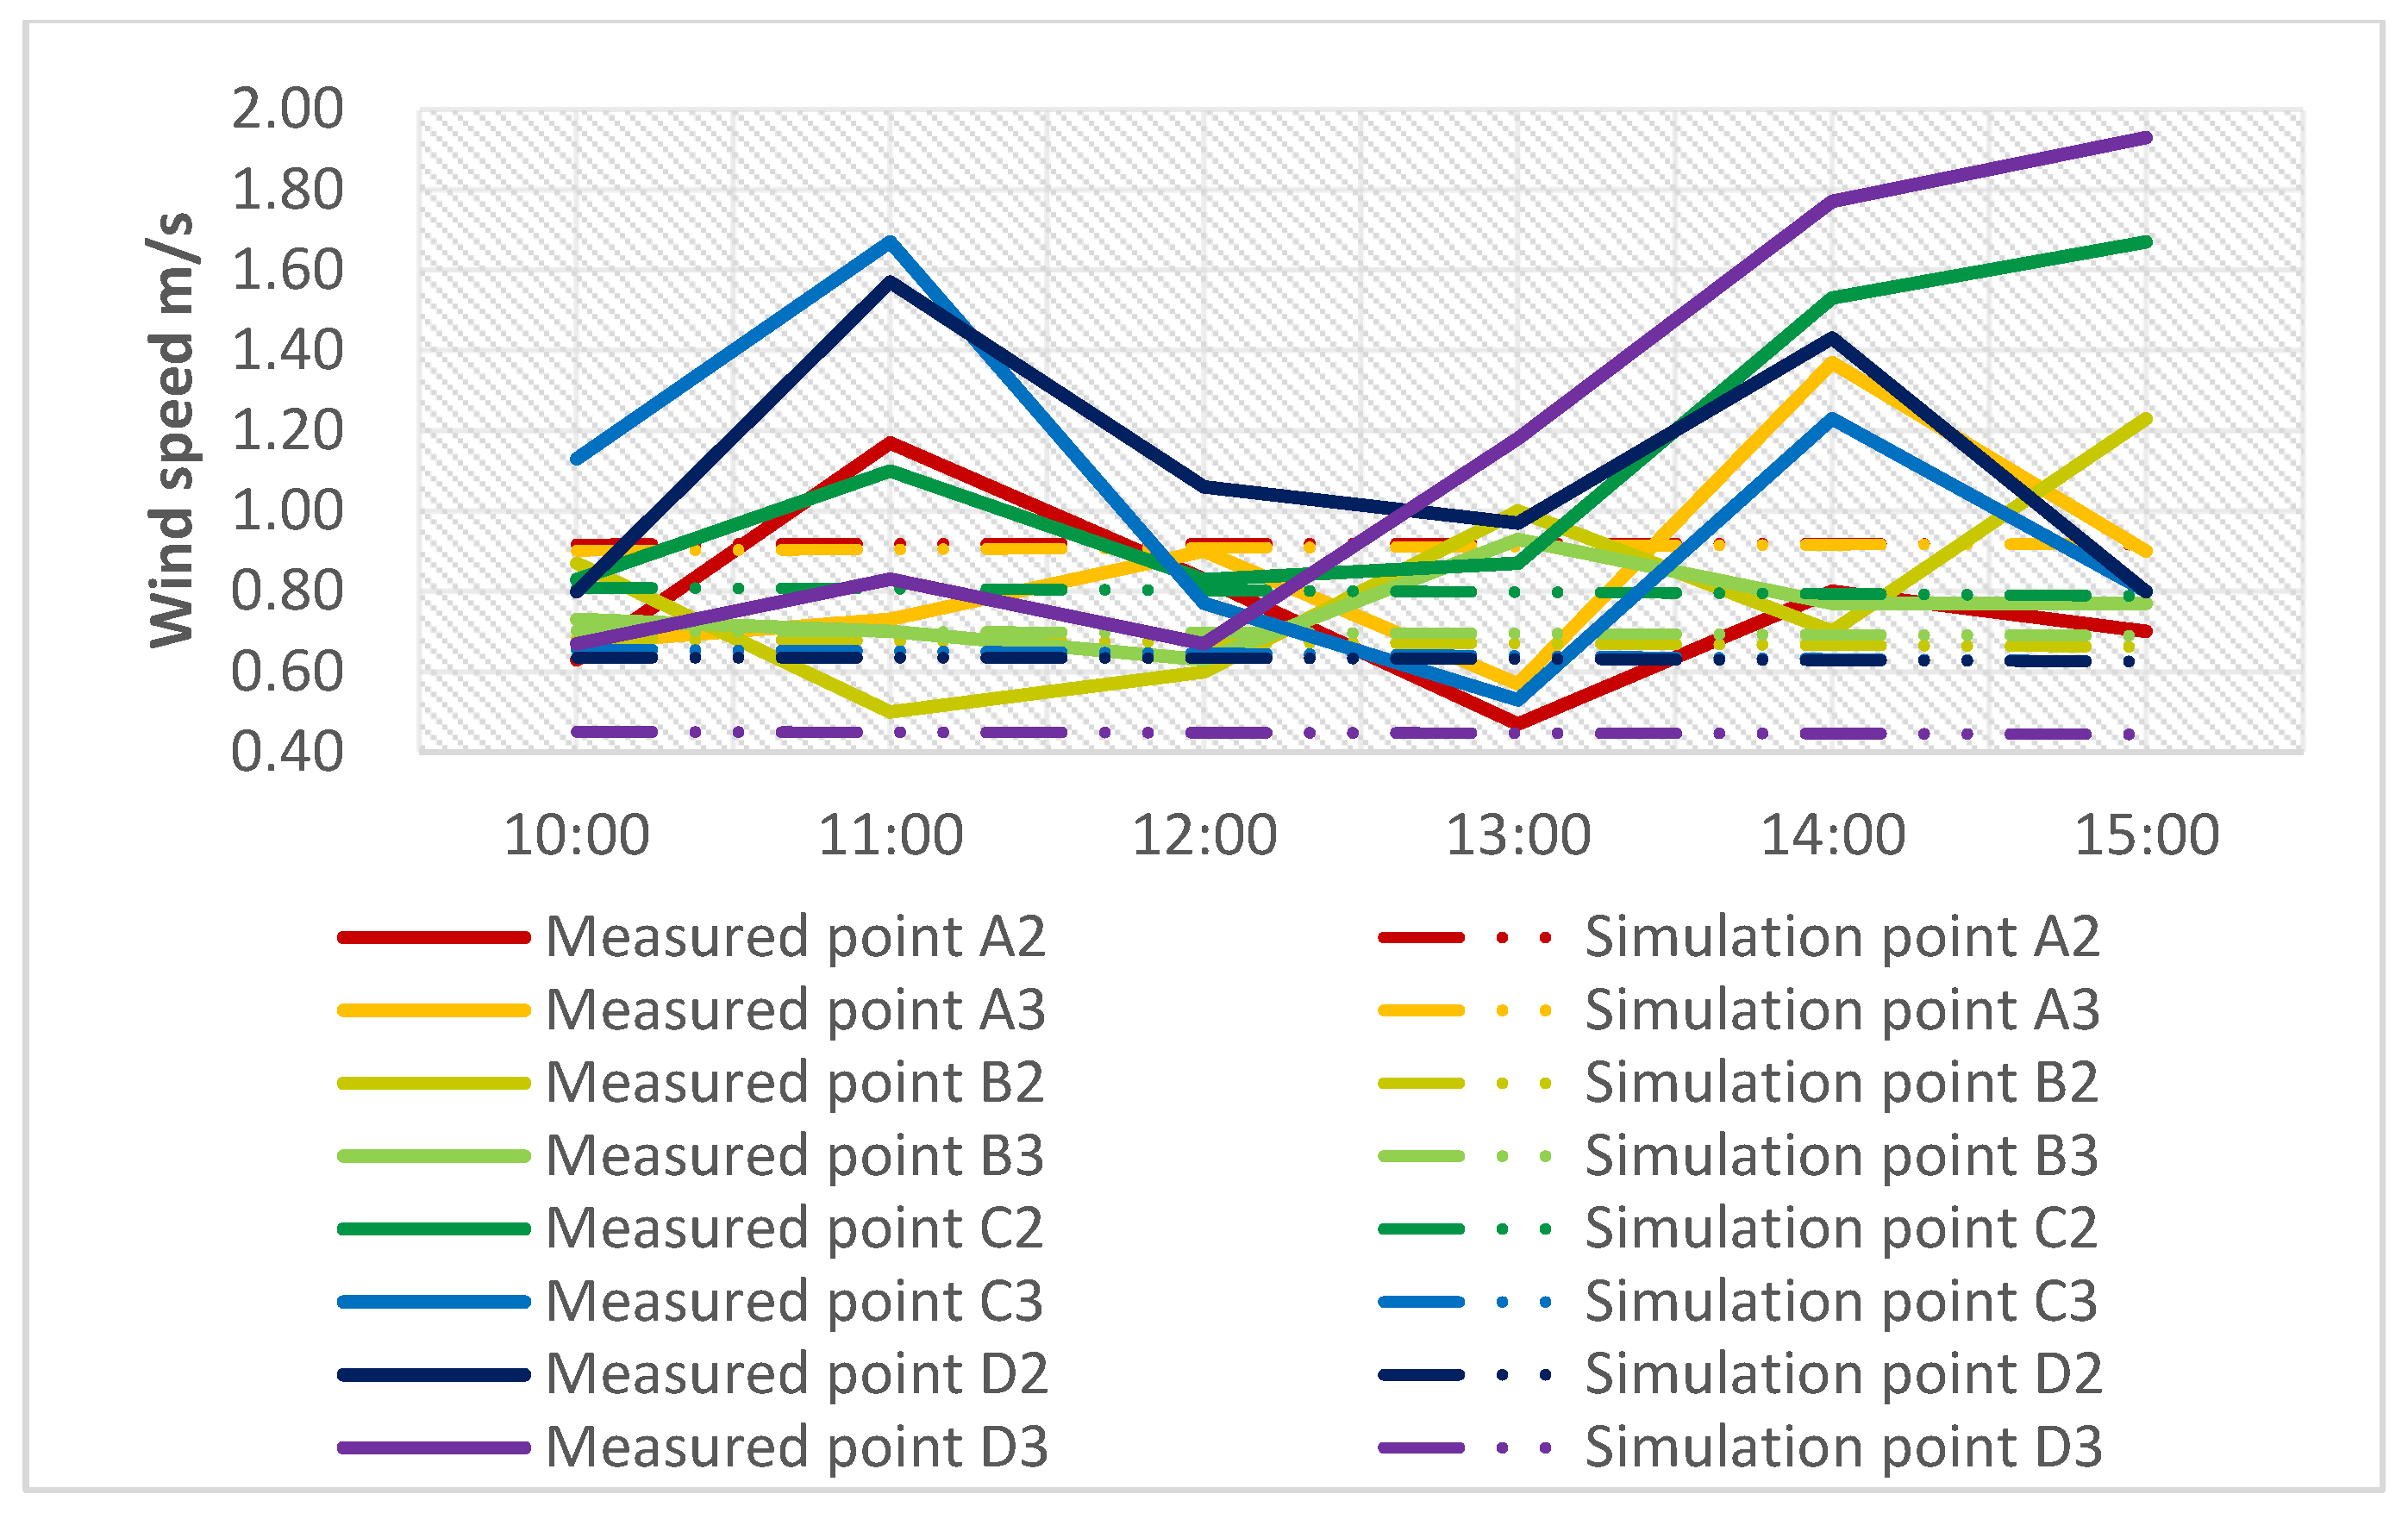
The geometric data of street morphology (street width, building height, and orientation) were collected through field investigations and used to study the influence of street canyon morphological factors on the urban thermal environment. Simultaneously, the open space of the research site was monitored using data measuring instruments, and the data were compared with those of Jiangxi Meteorological Bureau to ensure the instruments’ accuracy. On this basis, the thermal environment model of typical street valleys was established using climate data from field investigations and measurements, such as temperature, humidity, and wind speed, and the original thermal environment of each street valley without greening was obtained by importing ENVI-met software for simulation operation. The simulation’s accuracy was then validated by comparing the measured and simulated data. Finally, based on the simulation results, PET was used as a human thermal comfort evaluation index to measure the comfort within each street valley.

3.1. Field Measurement

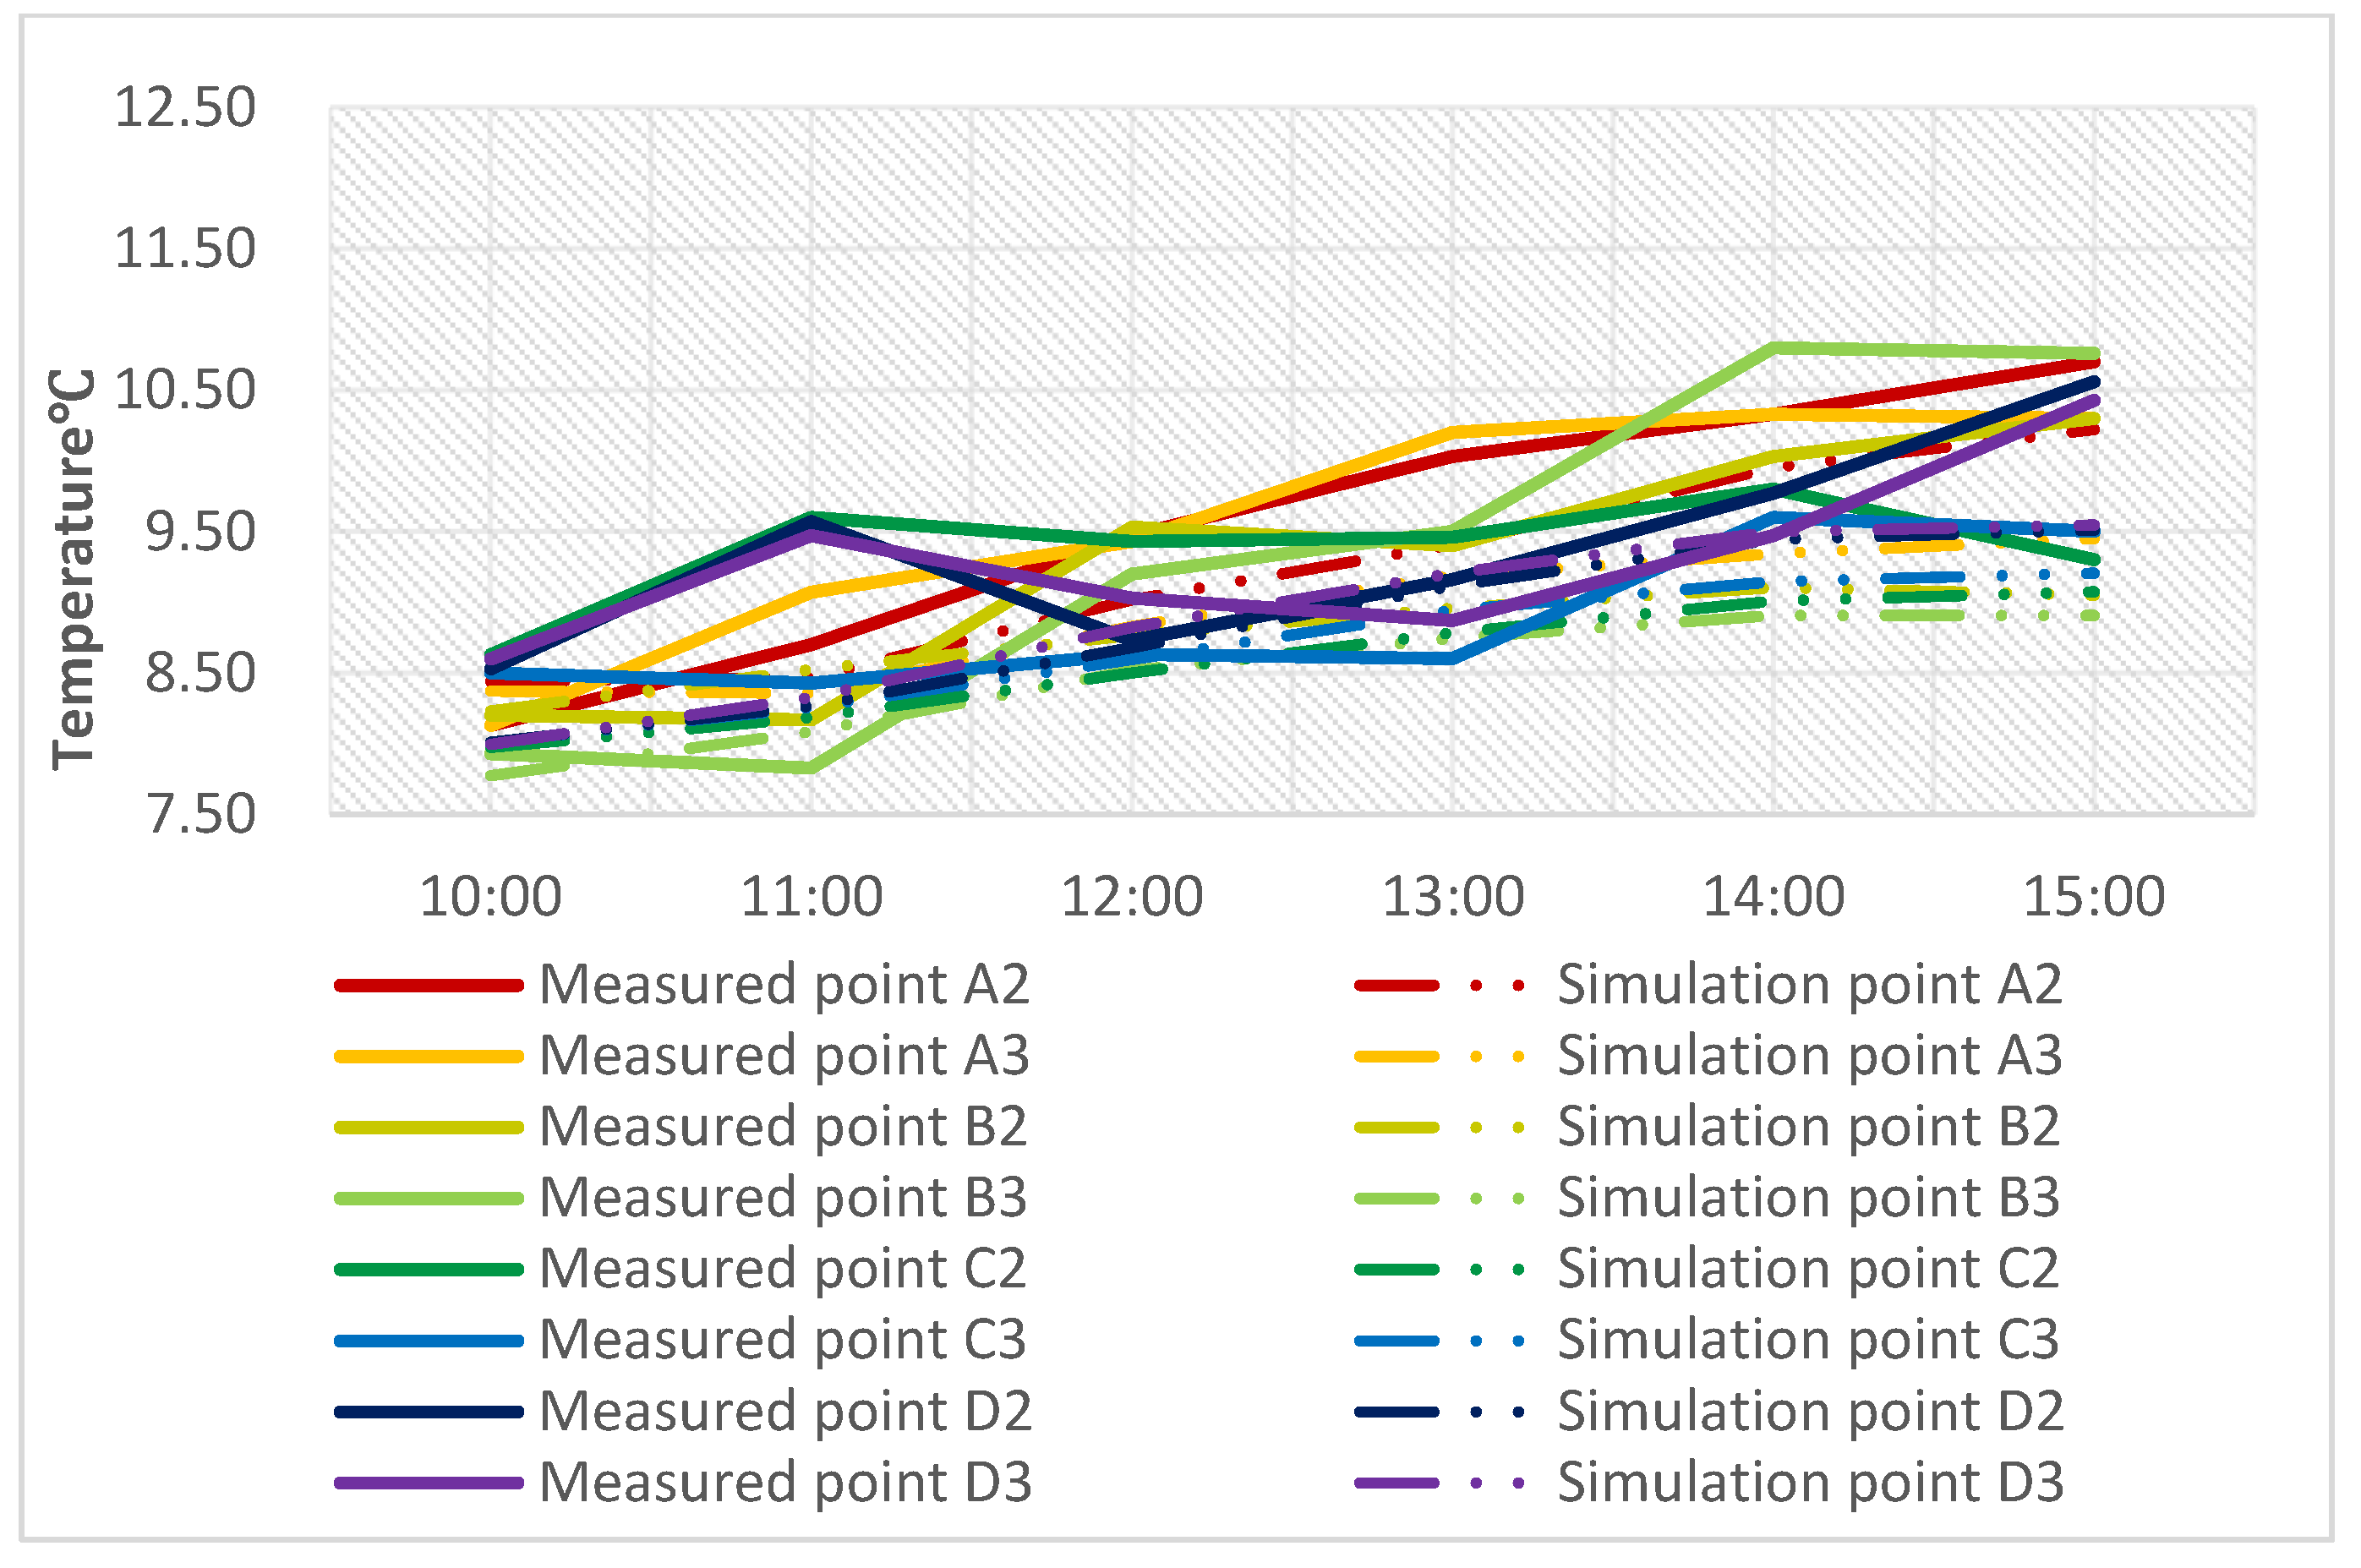
At the moment, software simulation is used to study the outdoor street thermal environment. During the simulation experiment, the model can be appropriately simplified, such as by simplifying the scale and shape of buildings in street valleys, taking into account the computing capacity of the computer. However, no fixed standard for the model’s simplification degree has been given in the past, and different simplification degrees produced different errors in the experimental results, so the accuracy of the simplified model had to be verified. Field measurement and simulation, on the other hand, have a sequential relationship and should be used repeatedly to verify the problem after determining the problem, so field measurement is critical in this study.
To compare the current situation of street microclimates under different street orientations and street aspect ratios, four measuring points were arranged on four streets, with a 40 m interval between each measuring point, for a total of 16 measuring points (Figure 1).
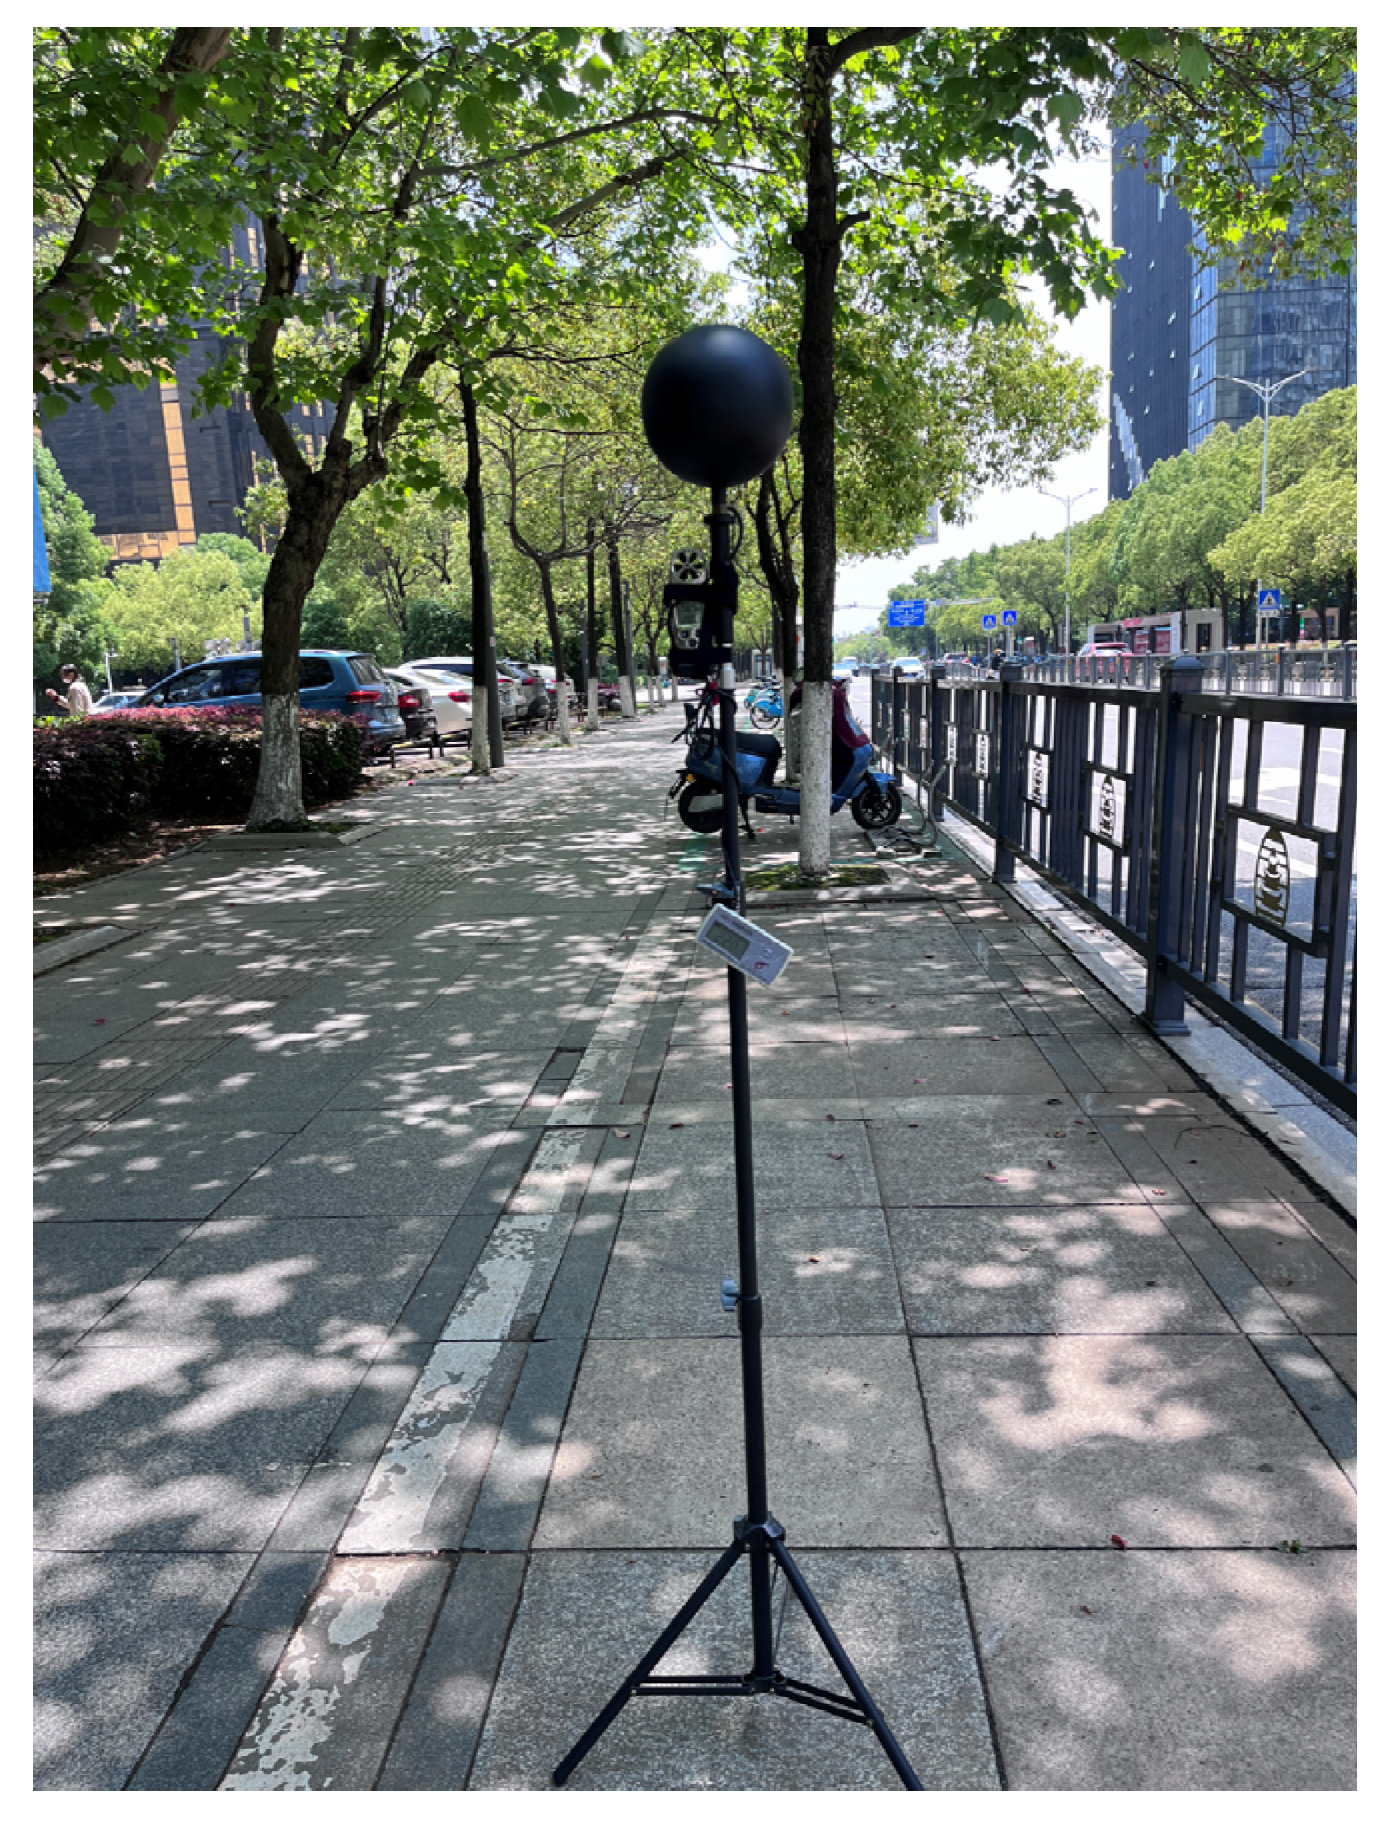
The research thoroughly considered the influence of air temperature, humidity, wind, and solar radiation on the street thermal environment, and adopted data on air temperature, humidity, and wind speed given by a TESTO-410 handheld temperature and humidity recorder, with the measurement ranges of −10 + 50 °C, 0.4–20 m/s, and 0–100% RH, and measurement accuracies of ±0.5 °C, ±0.2 m/s, and ±1.5% RH. HQZY-1 was used to measure black ball temperature, with a measuring range of −20 °C to +80 °C and a measuring accuracy of 0.3 °C.
Because the research focused on pedestrian thermal comfort, the test instruments were mounted on tripods so that the black ball of the temperature acquisition recorder and the sensor of the hand-held temperature and humidity anemometer were 1.5 m above the ground (Figure 4), and the test data recording interval was 1 min. At each measuring point, three groups of data were measured, and the average value of the three groups of data was used to calculate the average data per hour.
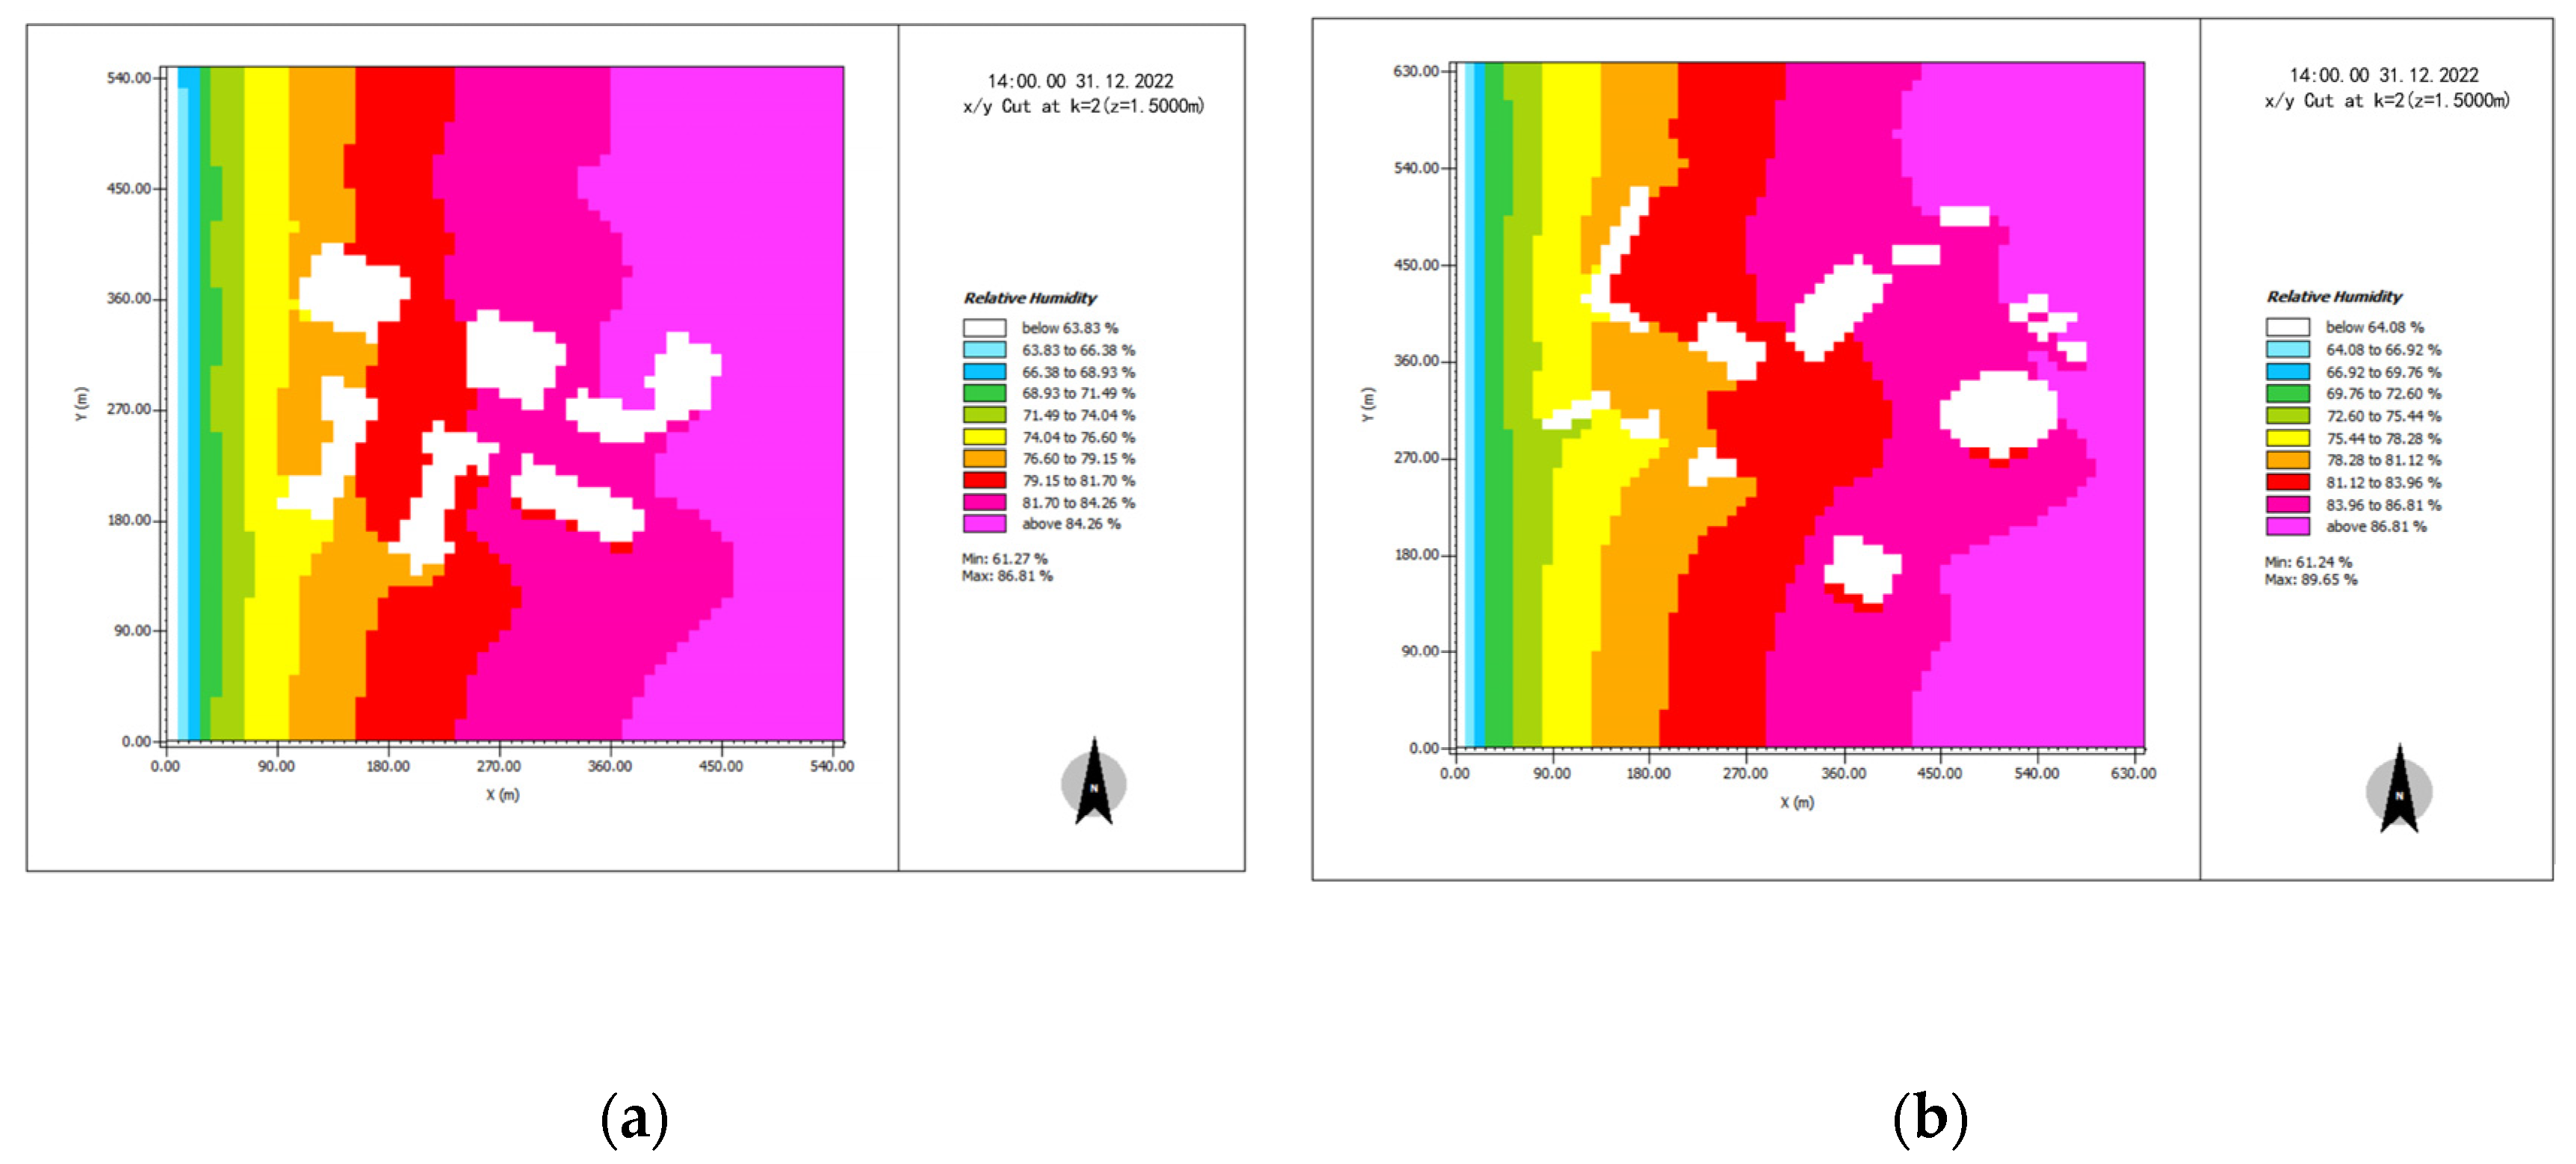
On 31 December 2022, the instrument collected 9–15 points of climate data in the open space near the measurement area, including temperature, humidity, and wind speed. The accuracy of instrument measurement was verified by comparing the meteorological bureau average data to the field measurement data.

3.2. Computational Settings and Parameters

3.2.1. Setting of Boundary Conditions

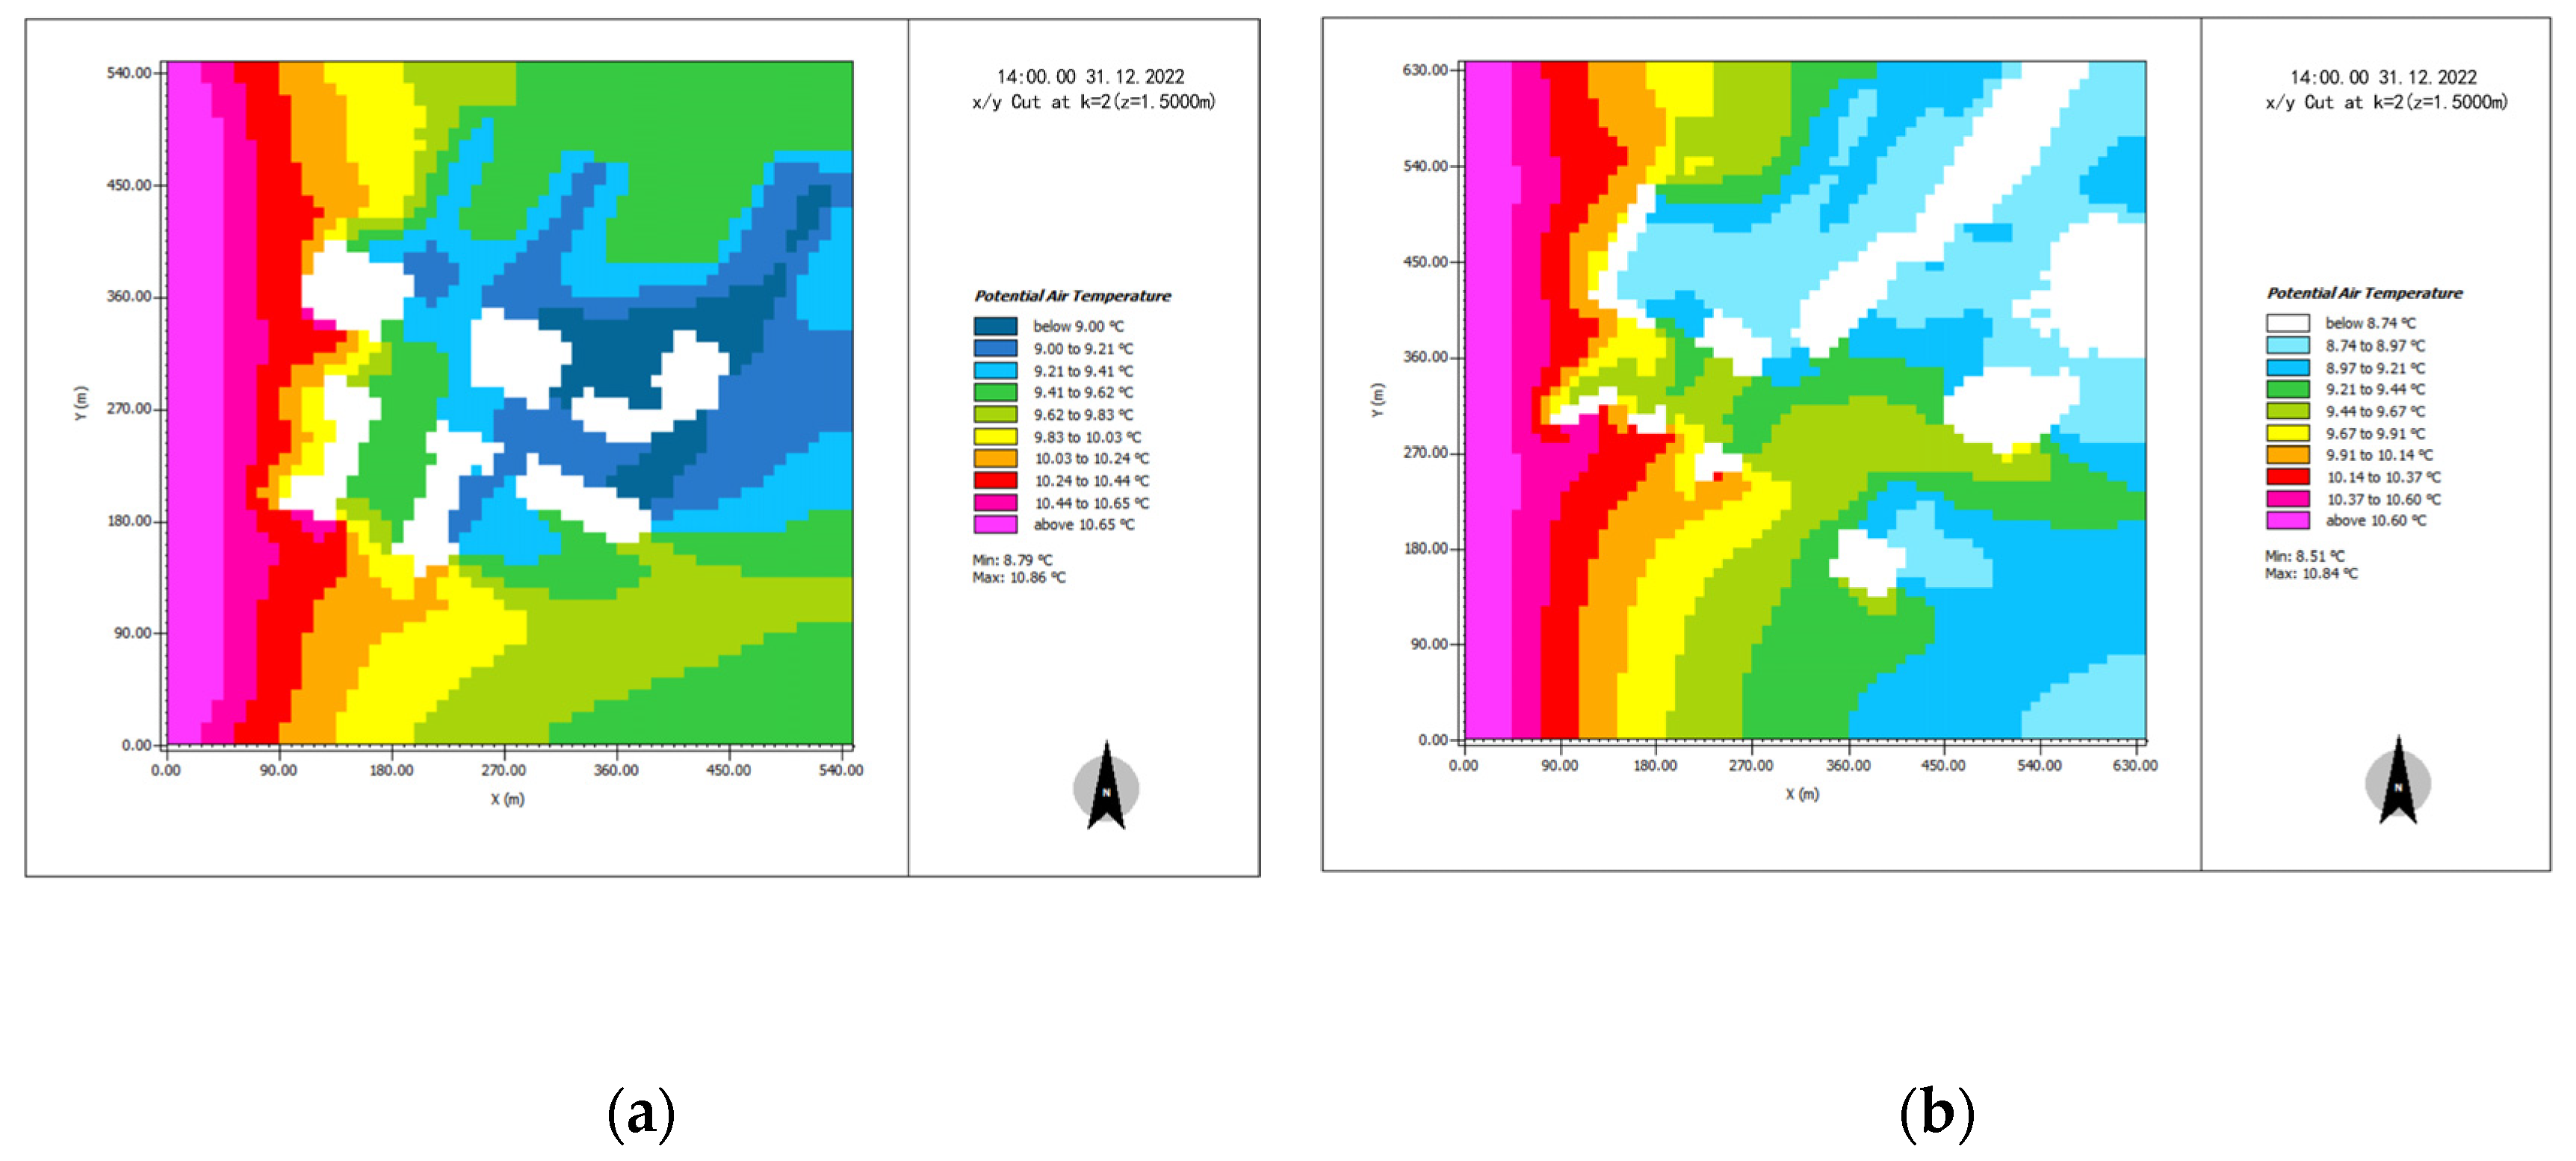
Shimao Road–Hongguzhong Avenue has a calculated horizontal area of 639 m × 639 m. Because the tallest building in the area is a super highrise, the calculation area’s height should be double or more, so the vertical area dimension is 330 m, and the overall simulation environment is 639 m × 639 m × 330 m. There are 71 × 71 × 110 modeling grids with grid resolutions of dx, dy, and dz of 9 m, 9 m and 3 m, respectively.
The calculated horizontal area in the Huizhan Road–Shajing Road area is 540 m × 540 m. Because the tallest building in the area is a super-highrise, the calculation area’s height should be double or more, so the vertical area height is 210 m, and the modeling grids with the entire simulation environment of 540 m × 540 m × 210 m are 60 × 60 × 70, with grid resolutions dx, dy, and dz of 9 m, 9 m and 3 m, respectively.
Field measurement data were used to simulate the initial temperature, humidity, wind speed, and black ball temperature during the simulation feasibility verification process. The initial temperature, humidity, wind speed, and black ball temperature were substituted for data from typical meteorological days in the subsequent analysis and research. A typical meteorological day, as defined in the Standard for Design Standard for Thermal Environment of Urban Residential Areas (JGJ286-2013), is a day chosen in a typical meteorological year to represent seasonal climate characteristics [
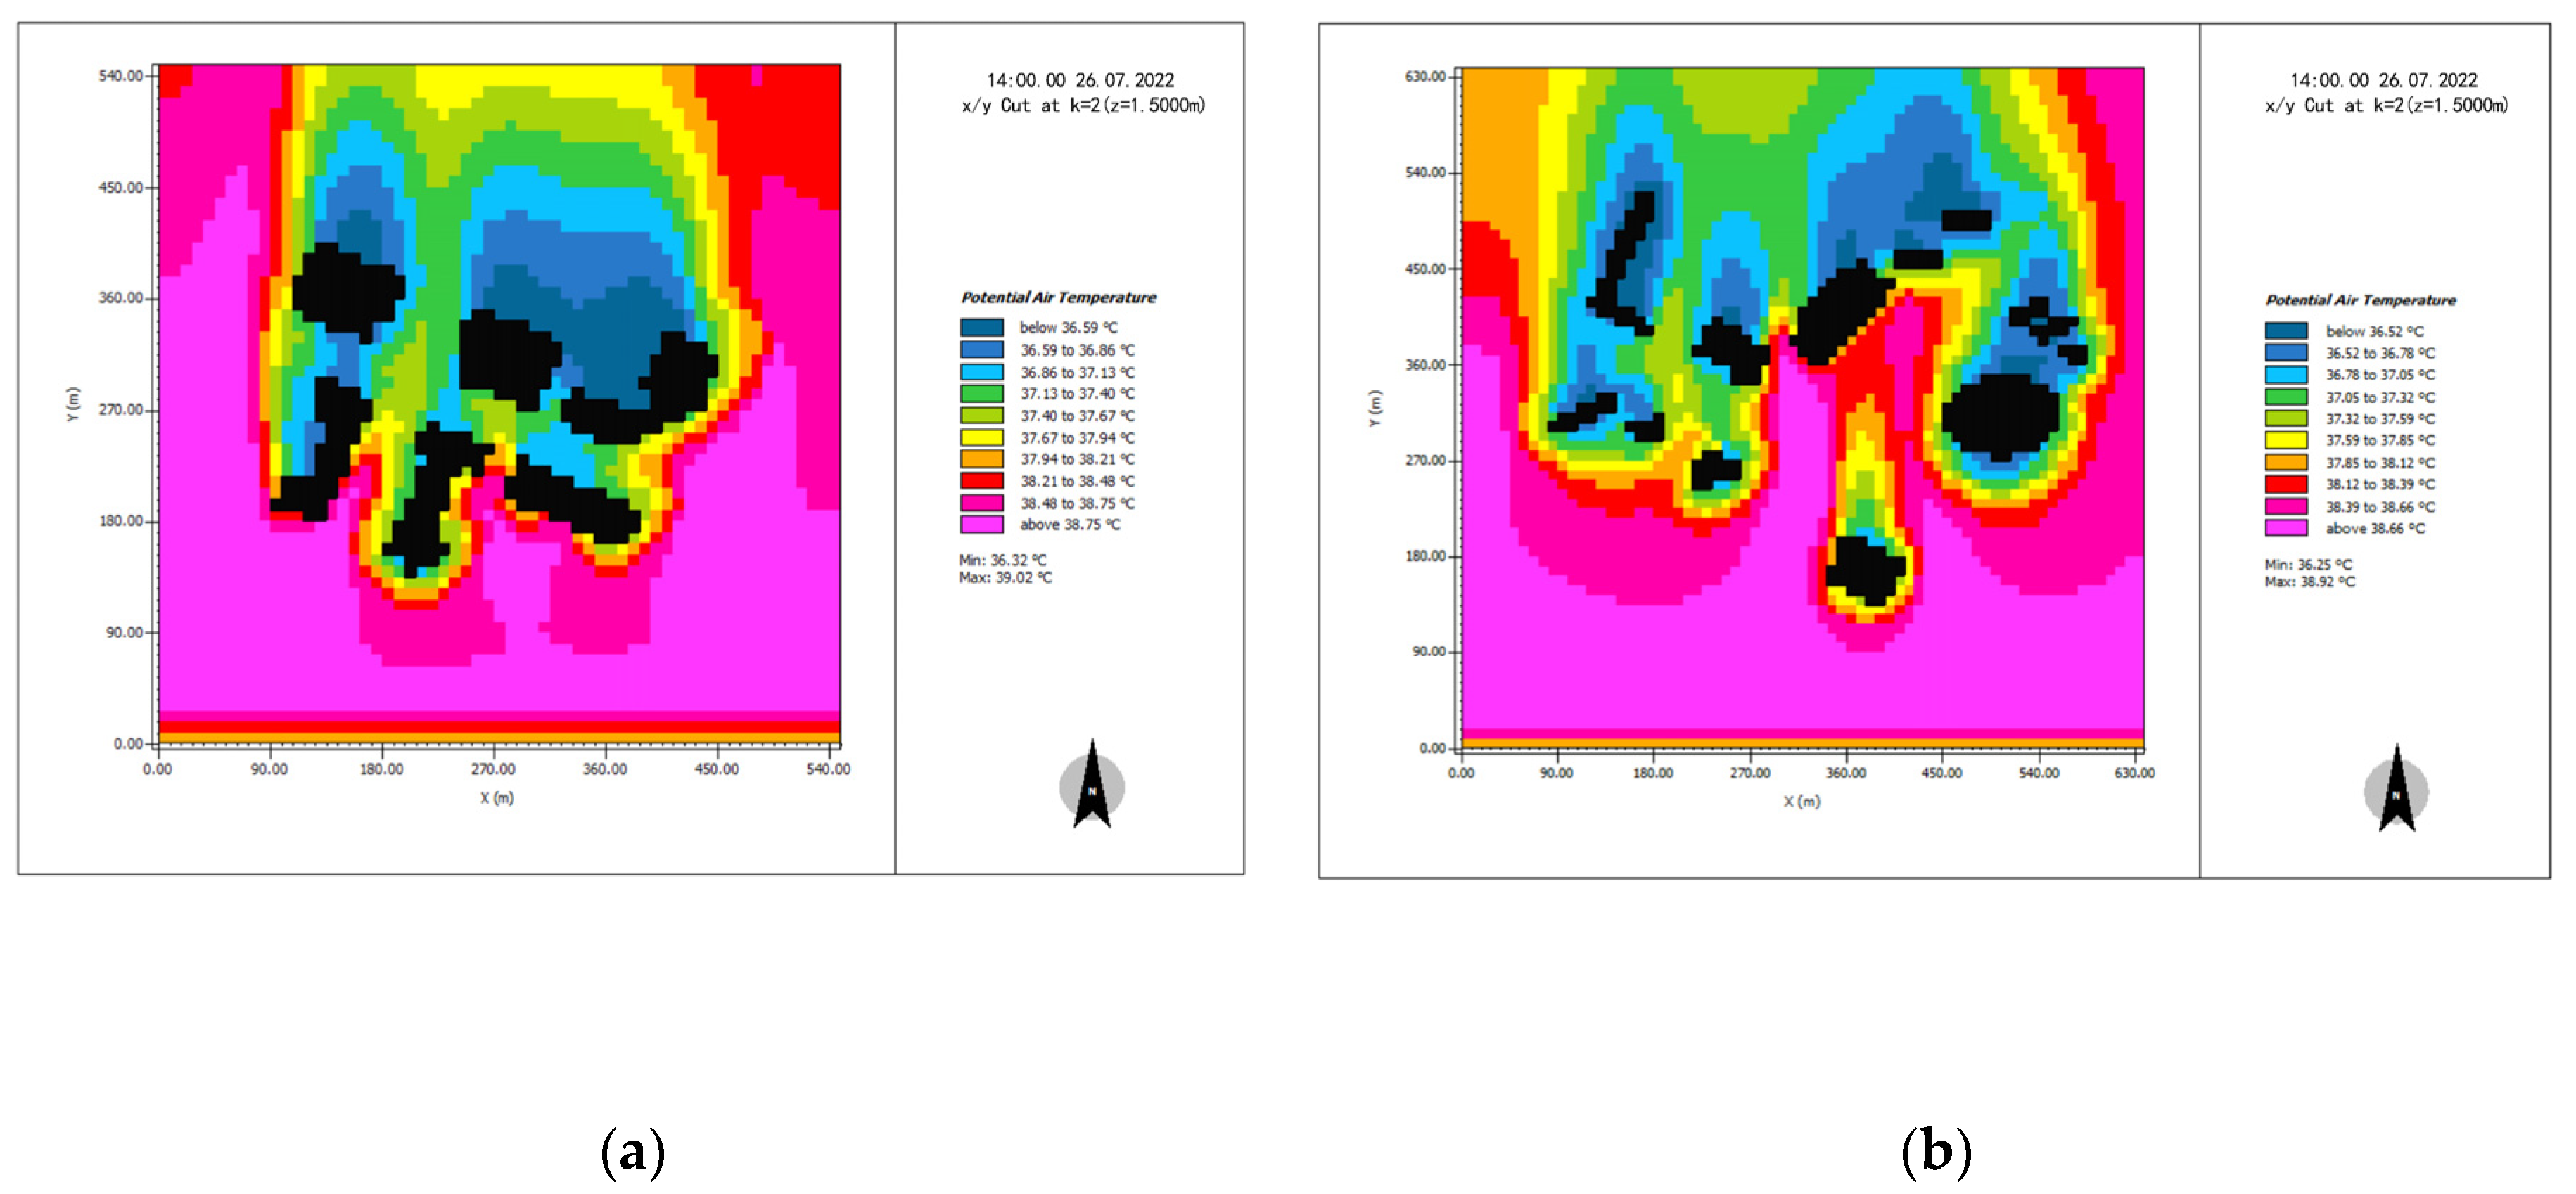
26]. A typical meteorological day in summer is the day when the daily average of temperature, daily range, humidity, and solar irradiance in the hottest month of a typical meteorological year is the closest to that of that month, so the data from 26 July 2022 were chosen for research.
When using ENVI-met to calculate PET, men with a height of 175 cm, weight of 70 kg, age of 35 years, clothing thermal resistance of 0.9 clo, and walking speed of 1.34 m/s were used as the human thermal environment perception parameters.

3.2.2. Data Processing Method

(1) Formula of the human thermal balance:
M W = Q c v + Q r + E s k + Q r e s + S
(2) Thermal comfort equation:
M W = f c l h c T c l T a + 3.96 × 10 8 f c l [ T c l + 273 4 T m r t + 273 4 ] + 3.05 [ 5.73 0.007 M W P a ] + 0.42 [ M W 58.15 ] + 0.0173 M 5.87 P a + 0.0014 M 34 T a
(3) The average radiation temperature, Tmrt, is calculated as:
T m r t = T g + 273.15 4 + 1.10 × 10 8 v a 0.6 ε D 0.4 × T g T a 0.25 273.15
Remark 1.
M —Metabolic quantity (w/ m 2 ). W —Workload (w/ m 2 ). Q c v —Convective heat dissipation on the skin surface (w/ m 2 ). Q r —Radiation heat dissipation on skin surface (w/ m 2 ). E s k —Evaporative heat dissipation on skin surface (w/ m 2 ). Q r e s —Breathing heat dissipation (w/ m 2 ). S —heat storage capacity of human body (w/ m 2 ). f c l —Clothing area coefficient (%). h c —Convective heat transfer coefficient (w/( m 2 °C)). T c l —The average temperature of the outer surface of human body or clothing (°C) .   P a —water vapor partial pressure (kPa). T a —Ambient temperature (c). T m r t is the average radiation temperature (°C) ;   T g is the black ball temperature (°C); ε Is is emissivity (black sphere takes 0.95); D is the diameter of the black ball (150 mm).

4. Results and Discussion

4.1. Verification of the Measured Results

To test the consistency of ENVI-met software simulation and actual measurements, the winter parameters of four street valleys in the actual measurement area were simulated hourly from 10 am to 3 pm, and the simulation results of temperature, humidity, and wind speed were compared to the actual measurement values. At the same time, the measuring points near the intersection in the street valley would inevitably be disturbed during the actual measurement. So, the measuring points connected to the middle were taken for data comparison during verification, and the measuring points on Huizhan Road were named A1, A2, A3 and A4. Those on Hongguzhong Avenue were named B1, B2, B3 and B4. Those on Shimao Road were named C1, C2, C3 and C4, and those on Shajing Road were named D1, D2, D3 and D4, with Huizhan Road and Shimao Road running east–west, while Hongguzhong Avenue and Shajing Road run north–south.

4.1.1. Air Temperature

The figure depicts the air temperature distribution 1.5 m above the ground at 10 a.m. and 2 p.m., as well as the statistics of the measured and simulated temperatures at each measuring point (Figure 5). The difference between the simulated temperature and the measured temperature during the day was small, as shown in the figure, and the temperature in the east–west direction was obviously higher than that in the north–south direction, while the temperature on the east–west street was higher than that in the north–south direction. The difference was mostly within 1 °C, but at 2 pm, there was a deviation of about 1.8 °C at the measured temperature (Figure 6).

4.1.2. Air Humidity

By comparing the measured and simulated air humidity data of each measuring point at 10:00 and 15:00 in streets (see Figure 7 and Figure 8), we can determine that the measured and simulated air humidity values were not closely coupled, and the errors between the measured and simulated values were about 20%, which may be due to the influence of greening on both sides of the road during actual measurement, but the measured and simulated values of the overall air humidity distribution were roughly consistent.

4.1.3. Wind Speed

By comparing the measured and simulated wind speed data of each measuring point at 10:00 and 15:00 in the streets, it was found that the difference between the simulated and measured wind speed lay in its stability, and the measured values were more volatile, while the simulated values tended to be more stable. However, the measured values of the change trend of the overall wind speed were roughly consistent with the simulated values (see Figure 9 and Figure 10).
In order to verify the accuracy of the average value of the measurement input in the simulation, the root mean square error (MRSE) operation was performed on the measured values of each measuring point. The results show that the maximum MRSE value of the wind speed in each measuring point is 1.78, and the maximum value of the MRSE temperature is 0.78, indicating that the measurement errors of individual measuring tend to be stable for both wind speed and temperature measurements, which proves that the average values of individual measuring points are reliable.
In order to further analyze the errors between the measured values and the simulated values, an analysis was performed using the mean absolute percentage error (MAPE). The results show that the MAPE values of the wind speed and temperature measured in winter and the simulated values when the models were used for simulation analysis were mostly between 1% and 12%; a few of them were above 15%, and many groups were below 1%.
Through simulation verification, it can be concluded that ENVI-met is a climate simulation software with certain accuracy in simulating the microclimate environment in street valleys. So it is of certain significance to use this software to simulate and predict the microclimate environment in different street valleys.

4.2. Analysis of Simulation Results

ENVI-met, a simulation analysis software that can couple the outdoor wind, heat, humidity and sunshine environment of the city, was mainly used to simulate the street and valley environment of the research object in summer, and four main indexes, air temperature, wind speed, average radiation temperature and thermal comfort PET, were compared. Because the large amount of simulation data and the changing trends of individual data were consistent from 10:00 to 15:00, and they reached their maximum values for the whole day at 14:00, the following were selected (see Figure 11, Figure 12, Figure 13 and Figure 14).

4.2.1. Air Temperature

The incoming flow temperature of the Shimao Road–Shajing Road area and Huizhan Road–Hongguzhong Avenue area was around 38.70 °C, according to the simulation results, and their internal temperatures were lower than the incoming flow temperatures (Figure 15). The temperatures of Shajing Road in the Shimao Road–Shajing Road area were 37.13–38.75 °C in the north–south direction and 36.59–37.67 °C in the east–west direction. The temperature of Hongguzhong Dadao in the north–south direction in the Huizhan Road–Hongguzhong Avenue area was 37.05–38.66 °C, while that at Huizhan Road in the east–west direction was 36.52–37.32 °C, with a difference of 0.00–2.14 °C. Overall, the simulation results for the Huizhan Road–Hongguzhong Avenue area are comparable to those for the Shimao Road–Shajing Road area. The east–west street valley had a lower average temperature than the north–south street valley, and the high-temperature area of the east–west street was primarily concentrated in the gap between the buildings along the street. Although the temperature of the north–south street varied, the high-temperature area appeared primarily at the intersection in the inflow direction, and the temperatures of the other areas were within 1.00 °C of the temperature of the east–west street.

4.2.2. Wind Speed

The simulation results show that the areas of Shimao Road–Shajing Road and Huizhan Road–Hongguzhong Avenue were all southerly, with wind speeds ranging from 1.68 to 2.10 m/s. Inside the street, the wind environment was relatively large, with noticeable differences between regions (Figure 16). Among them, the north–south Shajing Road in the Shimao Road–Shajing Road area conformed to the incoming wind direction, and most of the wind speeds were 1.65–1.95 m/s, but it is easy to form a wind field with wind speeds of 2.32–2.98 m/s with the blocking of buildings on both sides, which had a significant environmental impact. However, the east–west World Trade Road deviated from the incoming wind. The north–south direction of Hongguzhong Avenue in the Huizhan Road–Hongguzhong Avenue area also conformed to the incoming wind direction, with a relatively high wind speed. However, because the road is relatively wide, the blocking effect of buildings was minimal, and there was no wind field with high wind speeds, as there was on Shajing Road. The overall wind speeds were 1.26–2.10 m/s, with a local increase to 2.10–2.52 m/s. However, the east–west layout of Huizhan Road is fundamentally similar to that of the World Trade Road. The wind speeds were relatively high in the gaps between buildings along the street, reaching 2.10–2.52 m/s, while the wind speeds were relatively low in other areas, with overall wind speeds of 0.42–1.26 m/s.

4.2.3. Mean Radiation Temperature MRT

According to the simulation results, the average radiation temperatures outside the Shimao Road–Shajing Road area and the Huizhan Road–Hongguzhong Avenue area were about 63.75–64.82 °C, while the average radiation temperature inside the street was significantly higher than that in the external environment, and the street temperatures in all directions were similar, with the only relatively low-temperature area being near the north of the building (Figure 17). The average radiation temperatures of Shajing Road in the north–south direction in the area of Shimao Road–Shajing Road were between 65.24 and 66.44 °C. The average radiation temperatures of World Trade Road in the east–west direction were 56.86–59.25 °C in the area near the north of the building, while the rest were between 65.24 and 66.44 °C. The average radiation temperatures of Hongguzhong Avenue in the north–south direction were between 64.67 and 65.82 °C in the area from Huizhan Road to Hongguzhong Avenue, and the average radiation temperatures of Huizhan Road in the east–west direction were 56.65–57.79 °C in the area near the north of the building, while the rest were between 64.67 and 65.82 °C. The area of Huizhan Road–Hongguzhong Avenue was slightly better than that of Shimao Road–Shajing Road, and the average radiation temperatures at the intersection in the middle were between 64.04 and 65.24 °C.

4.2.4. Thermal Comfort PET

The simulation results show that the external PET temperatures were roughly 51.75–52.90 °C, but the average radiation temperatures inside the street were clearly different (Figure 18). The north–south street temperatures were similar to the external environment, and the east–west street temperatures were obviously lower than the external environment, but the entire street was in an extreme thermal stress reaction environment (Table 2). The average radiation temperatures of the east–west Shimao Road in the Shimao Road–Shajing Road area were 48.62–51.86 °C, but there would be a local high-temperature area in the west, and the temperatures could reach 56.18–57.26 °C. Shajing Road’s average radiation temperatures in the north–south direction ranged between 50.78 and 51.86 °C. The average radiation temperatures of the east–west Huizhan Road in the Huizhan Road–Hongguzhong Avenue area were 50.44–51.65 °C, with a high-temperature area on the west side ranging from 52.87 °C to 54.09 °C. In the north–south direction, the average radiation temperatures of Hongguzhong Avenue were between 50.44 °C and 52.87 °C. Inside the street, the temperatures dropped as one moved further north of the building, and the average radiation temperatures of World Trade Road’s continuous street surface were also lower than those of Huizhan Road’s relatively discontinuous street surface. The average radiation temperatures at the intersection of Huizhan Road and Hongguzhong Avenue were clearly higher than 26.71 °C.

4.2.5. Description of Experimental Results

Through ENVI-met numerical simulation, the following information can be obtained.
(1) As the air temperature changed, the north–south streets conformed to the incoming flow direction, and the ventilation cooling effect improved. The air velocity would increase in the gap between the buildings along the east–west street, causing it to cool down. The roads in the area of Huizhan Road–Hongguzhong Avenue are wider, with an aspect ratio of 2.7. Hongguzhong Avenue has the smallest aspect ratio among the four streets, which can better utilize the cooling effect of natural ventilation.
(2) In response to the wind direction, continuous building surfaces are prone to a narrow tube effect, which leads to localized wind enhancement and is not conducive to normal pedestrian activity. At building breaks, on the other hand, they are relatively empty and the flow tends to level off. On streets facing away from the wind direction, continuous building surfaces can also cause large areas of static wind, which is not conducive to the natural dispersion and reduction of household waste and pollutants.
(3) In terms of changes in average radiant temperature, the buildings, as substantial walls in a street canyon, have a significant impact on thermal radiation. The heating of building surfaces by sunlight leads to a significant increase in the mean radiant temperature in the surrounding area. The average radiant temperature on the north side of the building is relatively low due to the shading effect of the building. On the one hand, it reduces the direct radiation from the sun. On the other hand, hot air is also blown from the south, and the radiation propagation process is asymmetrical between the windward and leeward sides.
(4) According to the change in the value of the thermal comfort indicator PET, it could be seen that the temperatures of the four streets in the order of high to low were Shimao Road > Huizhan Road > Shajing Road > Hongguzhong Avenue. This order of arrangement is the same as the order of the sizes of the aspect ratios of the four streets. The relatively high temperature in the space area indicates that the buildings have some shading effect on the solar radiation. The shading of buildings could effectively reduce the average radiant temperature within the street. The larger the aspect ratio of the building, the better the shading provided by the building.

5. Conclusions

The main contribution of this study is to investigate the thermal comfort of street canyon space in typical medium to large cities in a hot summer and cold winter region from the aspects of neighborhood morphology. Based on the foregoing, we can conclude that street orientation, aspect ratio, and interface continuity had significant effects on the thermal environment. We can make the following conclusions and recommendations in light of these findings:
(1) The street aspect ratio should be maintained between 0.5 and 1.0 to ensure optimal thermal comfort in the summer. Extremely low ratios fail to block direct sunlight, while high ratios create excessive shadow areas, affecting fluid dynamics and reducing comfort;
(2) North–south streets should be positioned between 30 degrees east of south to due south. This helps buildings and streets receive favorable sunlight in Nanchang, a low-latitude area in the southern hemisphere. It also accommodates the local southeast monsoon and enhances ventilation in the summer, while resisting the cold north wind in winter;
(3) Street design should avoid long continuous interfaces and incorporate localized open spaces. Discontinuous interfaces in north–south streets delay the narrow tube effect, while discontinuous interfaces in east–west streets reduce the coverage area of static wind zones. Additionally, expanding the south side of east–west streets accommodates wind patterns in winter and summer;
(4) Adopting a pattern of lower buildings on the south side and taller buildings on the north side for east–west streets aids air flow when the summer monsoon blows from the south to the east. This arrangement also creates a comfort zone on the south side during winter winds from the north, due to the asymmetric heat transfer process.

Author Contributions

Conceptualization, Z.Z.; methodology, K.M.; software, P.W. and J.D.; validation, P.W. and J.D.; formal analysis, C.O.; investigation, Y.X. and J.D.; writing—original draft preparation P.W.; writing—review and editing K.M.; supervision, W.J. All authors have read and agreed to the published version of the manuscript.

Funding

This research received no external funding.

Institutional Review Board Statement

Not applicable.

Informed Consent Statement

Not applicable.

Data Availability Statement

Not applicable.

Conflicts of Interest

The authors declare no conflict of interest.

References

  1. Lee, H.; Calvin, K.; Dasgupta, D.; Krinner, G.; Mukherji, A.; Thorne, P.; Trisos, C.; Romero, J.; Aldunce, P.; Barrett, K.; et al. Climate Change 2023: Sixth Assessment Report Synthesis Report, 2nd ed.; IPCC: Geneva, Switzerland, 2023; pp. 35–115. [Google Scholar]
  2. Liu, J.N.; Chen, T.; Wang, L.Y. Thermal Health Risk Identification, Asessment and Urban Design lntervention in High-Density Cities from the Perspective of Climate Change: A Case Study of Macao. Landsc. Urban Plan. 2022, 1, 1–14. [Google Scholar]
  3. Abbass, K.; Qasim, M.Z.; Song, H.M.; Murshed, M.; Mahmood, H.; Younis, I. A Review of the Global Climate Change Impacts, Adaptation, and Sustainable Mitigation Measures. Environ. Sci. Pollut. Res. 2022, 29, 42539–42559. [Google Scholar] [CrossRef] [PubMed]
  4. Zhang, H. China’s Carbon Peak and Carbon Neutrality Progress Report (2021) Released in Beijing. China Natl. Cond. Natl. Strength 2022, 1, 79. [Google Scholar]
  5. Chen, J.; Yao, S.; Tian, Y. Morphological Typology Theory and the Localisation of its Exploration. Int. Urban Plan 2015, 2, 57–64. [Google Scholar]
  6. Nunez, M.; Oke, T.R. The Energy Balance of an Urban Canyon. J. Appl. Meteorol. Climatol. 1977, 1, 11–19. [Google Scholar] [CrossRef]
  7. Busato, F.; Lazzarin, R.M.; Noro, M. Three Years of Study of the Urban Heat Island in Padua: Experimental Results. Sustain. Cities Soc. 2014, 10, 251–258. [Google Scholar] [CrossRef]
  8. Bourbia, F.; Awbi, H.B. Building Cluster and Shading in Urban Canyon for Hot Dry Climate. Renew. Energy 2004, 2, 291–301. [Google Scholar] [CrossRef]
  9. Deng, Y.; Zheng, X.; Wong, N.H. The Effect of Street Level Isthmus Morphology on Outdoor Air Temperature and Thermal Comfort in Summer. J. Zhejiang Univ. Eng. 2018, 5, 873–885. [Google Scholar]
  10. Kja, B.; Vmnab, C. Interactions Between Extreme Climate and Urban Morphology: Investigating the Evolution of Extreme Wind Speeds from Mesoscale to Microscale. Urban Clim. 2020, 31, 100544. [Google Scholar]
  11. Wu, Z.; Yan, T.; Fu, X. Analysis of Urban Wind Environment in Shenzhen Based on CFD Simulation. Constr. Qual. 2009, 11, 49–53. [Google Scholar]
  12. Feng, W.; Fei, M.; Zhen, M.; Feng, S. Research on Numerical Simulation of Wind Environment in Typical Neighbourhoods of Xi’an and Urban Optimization Design Strategy. Mod. Urban Res. 2019, 8, 35–40. [Google Scholar]
  13. Ying, X.; Kan, Q. Impacts of Key Elements of Spatial Layout Patterns of Hangzhou Commercial Streets on the Surrounding Wind Environment. Sci. Geogr. Sin. 2018, 12, 2093–2099. [Google Scholar]
  14. Han, Y.; Taylor, J.E.; Pisello, A.L. Toward Mitigating Urban Heat Island Effects: Investigating the Thermal-energy Impact of Bio-Inspired Retro-reflective Building Envelopes in Dense Urban Settings. Energy Build. 2015, 102, 380–389. [Google Scholar] [CrossRef]
  15. Kousis, I.; Pisello, A.L. Evaluating the Performance of Cool Pavements for Urban Heat Island Mitigation under Realistic Conditions: A Systematic Review and Meta-Analysis. Urban Clim. 2023, 49, 101470. [Google Scholar] [CrossRef]
  16. Fabiani, C.; Pisello, A.L.; Bou-Zeid, E.; Yang, J.; Cotana, F. Adaptive Measures for Mitigating Urban Heat Islands: The Potential of Thermochromic Materials to Control Roofing Energy Balance. Appl. Energy 2019, 247, 155–170. [Google Scholar] [CrossRef]
  17. Li, X.; Ratti, C. Mapping the Spatial Distribution of Shade Provision of Street Trees in Boston Using Google Street View Panoramas. Urban For. Urban Gree. 2018, 32, 109–119. [Google Scholar] [CrossRef]
  18. Yang, X. Research on the Typology of Thermal Comfort Shade Regulation of Urban Streets in Xi’an under the Influence of Solar Radiation. Master’s Thesis, Xi’an University of Architecture and Technology, Xi’an, China, 2018. [Google Scholar]
  19. Li, D. Research on Microclimate Analysis of Xi’an City Square and Street Space under the Influence of Solar Radiation. Master’s Thesis, Xi’an University of Architecture and Technology, Xi’an, China, 2016. [Google Scholar]
  20. Wang, Z. Research on Climate Adaptability Design Strategy of Block Gorge Based on Urban Micro-climate in Hot Summer and Cold Winter Areas. Master’s Thesis, Huazhong University of Science and Technology, Wuhan, China, 2008. [Google Scholar]
  21. Limor, S.B.; Tzamir, Y.; Milo, E.H. Thermal Effects of Building Geometry and Spacing on the Urban Canopy Layer Microclimate in a Hot-humid Climate in Summer. Int. J. Climatol. 2004, 13, 1729–1742. [Google Scholar]
  22. Sun, X.; Yang, J.Y.; Wen, S.S. Research on Spatial Morphology and Thermal Environment of Urban Center Area Based on ENVI-met Simulation-The Case of Nanjing Xinjiekou, 2nd ed.; China, ACP. 60 Years of Planning: Achievements and Challenges—Proceedings of the 2016 Annual Conference on Urban Planning in China; China Building Industry Press: Beijing, China, 2016; pp. 124–140. [Google Scholar]
  23. Yang, X.; He, S.; Lu, X. Research on the Evaluation of Thermal Comfort of Public Space in the Old City of Beijing Based on Software Simulation—Taking 6 Hutongs in Baita Temple Area as an Example. Urban Archit. 2018, 6, 51–56. [Google Scholar]
  24. Du, H.; Shi, Y.; Zhang, Y. The Measured Study on Thermal Environment of Typical Living Street Valleys in Guangzhou. Build Sci. 2015, 12, 8–13. [Google Scholar]
  25. Du, H. Study on Thermal Environment Design Strategy of Living Street Valleys in Guangzhou. Master’s Thesis, South China University of Technology, Guangzhou, China, 2015. [Google Scholar]
  26. Ministry of Housing and Urban-Rural Development of the People’s Republic of China. Design Standard for Thermal Environment of Urban Residential Areas JGJ 286-2013, 3rd ed.; China Architecture & Building Press: Beijing, China, 2014; pp. 44–52.
  27. Hppe, P.R. The Physiological Equivalent Temperature, a Universal Index for the Biometeorological Assessment of the Thermal Environment. Int. J. Biometeorol. 1999, 2, 71–75. [Google Scholar] [CrossRef] [PubMed]
Figure 1. Schematic representation of the road measurement points.
Buildings 13 02433 g001
Figure 2. (a) Satellite aerial view of Shajing–Shimao Road. (b) Simplified model of the measured site of Shajing–Shimao Road.
Buildings 13 02433 g002
Figure 3. (a) Satellite aerial view of the actually measured site of Huizhan–Hongguzhong Avenue. (b) Schematic simplified model of the actually measured site of Huizhan–Hongguzhong Avenue.
Buildings 13 02433 g003
Figure 4. Measurement schematic of instrument placement.
Buildings 13 02433 g004
Figure 5. (a) Simulation of the air temperature in Shajing–Shimao Road at 14:00 in winter. (b) Simulation of the air temperature at 14:00 in winter on Huizhan–Hongguzhong Avenue.
Buildings 13 02433 g005
Figure 6. Comparison of the simulated and actual measured hourly temperatures at individual measuring points.
Buildings 13 02433 g006
Figure 7. (a) Simulation of the air humidity in Shajing–Shimao Road at 14:00 in winter. (b) Simulation of the air humidity at 14:00 in winter on Huizhan–Hongguzhong Avenue.
Buildings 13 02433 g007
Figure 8. Comparison of the simulated and actual measured hourly humidity at individual measuring points.
Buildings 13 02433 g008
Figure 9. (a) Simulation of the air wind speed on Shajing–Shimao Road at 14:00 in winter. (b) Simulation of the air wind speed at 14:00 in winter on Huizhan–Hongguzhong Avenue.
Buildings 13 02433 g009
Figure 10. Comparison of the simulated and actual measured hourly wind speed at individual measuring points.
Buildings 13 02433 g010
Figure 11. Average temperatures of four streets.
Buildings 13 02433 g011
Figure 12. Average wind speeds in four streets.
Buildings 13 02433 g012
Figure 13. Average MRTs of four streets.
Buildings 13 02433 g013
Figure 14. Average PETs of four streets.
Buildings 13 02433 g014
Figure 15. (a) Simulation of the air temperature in Shajing–Shimao Road at 14:00 in summer. (b) Air temperature simulation of Huizhan–Hongguzhong Avenue at 14:00 in summer.
Buildings 13 02433 g015
Figure 16. (a) Simulation of the air wind speed at 14:00 in Shajing–Shimao Road in summer. (b) Simulation of the air wind speed at 14:00 in summer on Huizhan–Hongguzhong Avenue.
Buildings 13 02433 g016
Figure 17. (a) Simulation of the MRTs at 14:00 in Shajing–Shimao Road in the summer. (b) MRT simulation of Huizhan–Hongguzhong Avenue at 14:00 in the summer.
Buildings 13 02433 g017
Figure 18. (a) Simulation of the PET at 14:00 in Shajing–Shimao Road in summer. (b) Simulation of the PET at 14:00 in summer on Huizhan–Hongguzhong Avenue.
Buildings 13 02433 g018
Table 1. Statistical table of road conditions.
Road NameRoad NatureRoad OrientationAverage Building Height
(/m)
Road Width
(/m)
Aspect Ratio
Jinrong Avenueminor roadNorth–south78174.6
Hongguzhong Avenue64232.7
Fenghuangnan Avenue58183.2
Shajing Road52182.8
Supu Road1963.1
Taohua Road46222.1
Fusheng Road42221.9
Chuanshan Road25122.0
Yuanming North Road9100.9
Huizhan RoadEast–west82184.5
Lijing Road18161.2
Lingkou Road42221.9
Shimao Road62144.4
Yongshu Road22102.2
Zhongshan Road4066.7
Dieshan Road28181.5
Minde Road2363.8
Ziyun Roadbranch roadNorth–south20102.0
Cuilin Road38103.8
Jiangbao Road36103.6
Minde West RoadEast–west1963.1
Jiandeguan Road2245.5
Fanglin Road2564.2
Yindu Road46104.6
Table 2. Physiological equivalent temperatures and the corresponding human sensations [27].
Physiologically Effective Temperature (°C)Thermal Sensation and Thermal ComfortPhysiological Stress Level
<4Quite coldExtreme cold stress reaction
4–8ColdStrong cold stress reaction
8–13CoolModerate cold stress response
13–18Slightly coolMild cold stress reaction
18–23ComfortableNo cold stress reaction
23–29Slightly warmMild thermal stress reaction
29–35WarmModerate heat stress reaction
35–41HotStrong thermal stress reaction
>41Very hotExtreme heat stress reaction
Disclaimer/Publisher’s Note: The statements, opinions and data contained in all publications are solely those of the individual author(s) and contributor(s) and not of MDPI and/or the editor(s). MDPI and/or the editor(s) disclaim responsibility for any injury to people or property resulting from any ideas, methods, instructions or products referred to in the content.

