Article

Spatiotemporal Differentiation and Influencing Factors of Green Technology Innovation Efficiency in the Construction Industry: A Case Study of Chengdu–Chongqing Urban Agglomeration

1
School of Civil Engineering and Architecture, Southwest University of Science and Technology, Mianyang 621010, China
2
College of Environmental and Civil Engineering, Chengdu University of Technology, Chengdu 610059, China
3
School of Economics and Management, Southwest University of Science and Technology, Mianyang 621010, China
*
Authors to whom correspondence should be addressed.
Buildings 2023, 13(1), 73; https://doi.org/10.3390/buildings13010073
Submission received: 10 November 2022 / Revised: 11 December 2022 / Accepted: 23 December 2022 / Published: 28 December 2022
(This article belongs to the Special Issue Tradition and Innovation in Construction Project Management)

Abstract

:
In order to support the green and low-carbon transformation of China’s construction industry and accomplish the dual carbon objective, it is vital to accelerate green technology innovation. Therefore, this paper takes the Chengdu–Chongqing urban agglomeration of China as the study area, using the super-efficiency slacks-based measure (SBM)model and the gravity model to assess the efficiency of green technology innovation in the construction industry, utilizing geographical detectors to investigate the drivers of green technology innovation in the construction industry further. Additionally, we consider each influencing factor’s level of impact on the efficiency of green technology innovation in the construction sector both under the single factor and double factor scenarios. The findings indicate that there is a considerable difference in the efficiency of green technology innovation in the Chengdu–Chongqing metropolitan agglomeration’s construction industry, and the trend is upward. In addition, the research area exhibited spatially heterogeneous characteristics in terms of the efficiency of green technology innovation in the construction industry, and the spatial spillover effect was significantly limited by distance. Further research revealed that environmental legislation, economic development, public environmental concern, urbanization level, and foreign direct investment were the primary driving factors of green technology innovation efficiency in the construction sector, and industrial size was the potential driving factor. The spatial and temporal differentiation of the green technology innovation efficiency in the construction industry was also more affected by the interaction between the dominating factor and the prospective factor than by either factor acting alone. The research’s findings are useful in advancing the green and low-carbon transformation of the construction sector in the Chengdu–Chongqing metropolitan agglomeration by offering theoretical support and decision-making reference.

1. Introduction

Reducing carbon emissions has become a top priority for many nations due to the state of the environment, and the development of “carbon neutral” awareness is accelerating globally. The accomplishment of China’s “dual carbon” objective is significant on a worldwide scale and presents new opportunities and challenges for the growth of China’s economic structure. China’s environmental quality ranks 120th out of 180 countries and regions in the world with major ecological and environmental issues, according to the 2020 Global Environmental Performance Index study jointly released by Yale University and other institutions [1]. At the same time, figures show that, in 2019, China was responsible for 27.92% of the world’s carbon emissions. The problem of carbon emissions is very prominent, and excessive carbon emissions will cause serious harm to the environment [2]. The development of green technology innovation is an important factor to promote the transformation of an economic development mode [3] and also an important means to achieve sustainable development [4]. To achieve the “double carbon” objective in the face of difficult environmental issues, it is imperative to speed up the promotion of green transformation in the new era.
According to data released by the China Building Energy Efficiency Association, the total carbon emission from the whole process of construction is more than half of the total carbon emission in China [5], which seriously hinders the green development of the economy. The construction industry, a pillar of the national economy, is crucial to raising the level of the country’s economy. However, with the rapid development of the construction industry, problems such as large resource consumption and extensive construction methods in the construction industry have become increasingly prominent [6], which will also cause irreversible damage to resources and the environment such as carbon dioxide emission [7]. Construction companies urgently need to follow the path of green and low-carbon development due to serious environmental issues, the need to reduce carbon emissions, and the need to actively explore the new model of low-carbon development, which is of great significance for controlling total carbon emissions, realizing green development, and guiding and promoting the conclusion of the Paris Agreement [8]. To achieve the decoupling of green economic development from resource consumption and environmental pollution, green technology innovation seeks to maximize economic, ecological, and social benefits with minimal cost and pollution [9]. When conducting innovation activities, consideration should be given to the efficiency of green technology innovation in order to realize the sustainable and high-quality development of the construction sector [10].
This study examined the spatial and temporal differential characteristics and key influencing elements of green technology innovation efficiency in the construction industry, using the construction industry as the research topic. In order to further share knowledge and make policy recommendations for enhancing the efficiency of green technology innovation in the construction sector, this paper used the following framework: Section 2 outlines the study’s theoretical basis; Section 3 introduces the research area, research methods, and selection and measuring of variables; Section 4 summarizes the research findings; Section 5 discusses the research results and draws conclusions.

2. Theoretical Review

Joseph A. Schumpeter (1991) was the first to put forward the theory of technological innovation. Technological innovation can boost productivity, deliver competitive advantages and good economic benefits to society, an industry, or an organization, and alleviate numerous difficulties that humans encounter. The traditional model of technological innovation, however, is overly simplistic, and rapid economic growth results in a shortage of natural resources and environmental pollution, severely impeding the path to sustainable development and impeding the transition to a greener form of economic development. Green and sustainable development is a crucial tool for advancing ecological civilization and superior economic growth [11,12,13,14]. Green technology innovation was proposed in 1960 to efficiently address the difficult environmental pollution issues that Western nations were facing and to offer technical help [15]. Green technology was formally defined by Braun and Wield [16] in 1994, who argued that it was important for improving environmental quality [17]. Most academics agree that green technology innovation is one of the key steps to take into account both the ecological environment and a low-carbon economy in order to address the internal conflict between economic expansion and environmental pollution [18,19,20]. Additionally, the advancement of green technology has emerged as a crucial element in advancing sustainable development [21,22]. Under the background of sustainable development, the relevant policies for green technology innovation have been continuously introduced and implemented, promoting the development of green technology innovation. Green technology innovation is distinct to traditional technology innovation, as it is theoretically based on ecology, information science, sociology, current management, etc. [23]. It pays attention to saving circulation, efficient utilization, and reducing pollution, and plays an important role in realizing sustainable development [24]. Research on green technological innovation is currently focused primarily on connotation, assessment, and influencing variables both domestically and internationally.
Various scholars have different meanings for the meaning of “green technology innovation efficiency” in their research. Pedro (2004) [25], Werf (2003) [26], and others consider “green technology innovation” as technological innovation that takes full account of environmental factors on top of traditional innovation. Hellstm (2007) [27] believed that “green technology innovation” should consider reducing the impact on the environment while meeting product innovation. Manral (2018) [28] and Yudietal et al. (2019) [29] defined the term “green technology innovation” as a process that starts with the goals of preserving the environment, conserving energy, and reducing emissions as the premise and achieves financial gain. Though there is not yet a common definition of “green technology innovation” in academia, it typically refers to novel technologies that can enhance environmental performance [30]. Acemoglu (2012) [21] and Wang et al. (2021) [31] believed that “green technology innovation” is a new technology that can inhibit energy consumption while reducing pollutant emissions, improving environmental quality, and promoting green economic development [32] and is widely recognized by the general public.
The evaluation of green technology innovation focuses on its efficiency, primarily through the development of indicators, stochastic frontier analysis (SFA), and data envelopment analysis (DEA). Sun et al. (2017) [33] applied the entropy weighting method in order to assess green technology innovation from the standpoint of its ecological and economic performance. Li et al. (2022) [34] created a system health evaluation index system to assess the state of green technology innovation. SFA is not suited to complicated systems, with many inputs and multiple outputs since it is a typical parametric analytic technique with little room for error in function selection and parameter configuration [35]. The data envelopment analysis method can overcome the defects caused by the ratio method and index system calculation method. Early data envelopment analysis techniques, such as BCC (Banker-Charnes-Cooper) and CCR (Charnes-Cooper-Rhodes), were used to gauge how well green technology was able to innovate. Lin et al. (2018) [36] used the ideal window width DEA window analysis method to assess the efficiency of green technology innovation. When the results were compared, it was thought that the obtained results were more realistic than the calculation results of the conventional DEA model. The measurement results are not accurate, because the conventional model overlooks the relaxation of variables [37]. In 2001, Tone constructed a DEA-SBM model considering the relaxation of output and input factors [38]. The DEA-SBM model was employed by Feng et al. (2013) [39] to assess the effectiveness of green technology innovation. As research has continued to advance, many academics have taken unwanted output into account when calculating the efficiency of green technology innovation. They have also developed the super-efficiency SBM model [40,41] that incorporates unwanted output in order to increase the precision of efficiency assessment.
The government, the market, the general public, and the industry itself are the primary players in the study of the factors that affect the development of green technologies. The research perspectives of green technology innovation range from macro to micro, mainly focusing on regional, industrial, and enterprise levels [42]. With different perspectives and methods, abundant research results have been obtained on the influencing factors of green technology innovation [43]. Behera et al. (2022) [44] used the mixed mean group, random effect, generalized mixed models, and gaussian mixture model models to analyze Organization for Economic Co-operation and Development (OECD) countries. They felt that effective environmental regulation and foreign direct investment inflow might stimulate the development of green technology. Zhang (2022) [37] built a spatial econometric model to examine the influencing variables and came to the conclusion that environmental regulation, government support, educational attainment, and industry scale all played an important role in fostering the efficiency of green technology innovation. Li (2022) [45] used microfirms as the research subject and employed evolutionary game theory to support the contention that manufacturing companies can be encouraged to promote green technology innovation through subsidies and fair environmental legislation. Green technology innovation efficiency is a typical indicator that has both economic and ecological qualities [37], and it is influenced by a wide range of variables such as environmental regulation [46,47,48], government subsidies [49], economic development level [50], foreign direct investment [43], education level [51], industrial scale [52], and other aspects factors.
As mentioned above, first of all, the design of an assessment system that takes into account input, output, and undesirable output is the main method of the current measurement of the efficiency of green technology innovation. Secondly, when choosing research methodologies for green technology innovation, multiple linear regression, spatial econometric models, evolutionary games, and other techniques are used. However, only linear influence is taken into account when studying the influencing factors of green technology innovation. Finally, existing research perspectives mostly focus on manufacturing, high-tech industries, and industry. Green technology innovation in the construction business is very important, because it has a reputation for being high-consumption, high-pollution, and one of the most carbon-generating industries in China. As a result, this study examines the efficiency of green technology innovation and the factors that drive it, using the construction sector as its focus. The super-efficiency model is used in this study to quantify the efficiency value by combining the methods of econometrics, geography, and physics. Furthermore, tools such as the gravitational model and geographic detector are brought into the field of green technology innovation in the construction industry to evaluate and affect elements of green technology innovation efficiency. This paper delves into green technology innovation in the construction industry, expanding and enriching the relevant content and helping to foster the coordinated development of the regional economy and regional environment. It also provides a theoretical basis for the development of targeted and regionally differentiated countermeasures for the efficiency of green technology innovation in the construction industry.

3. Materials and Methods
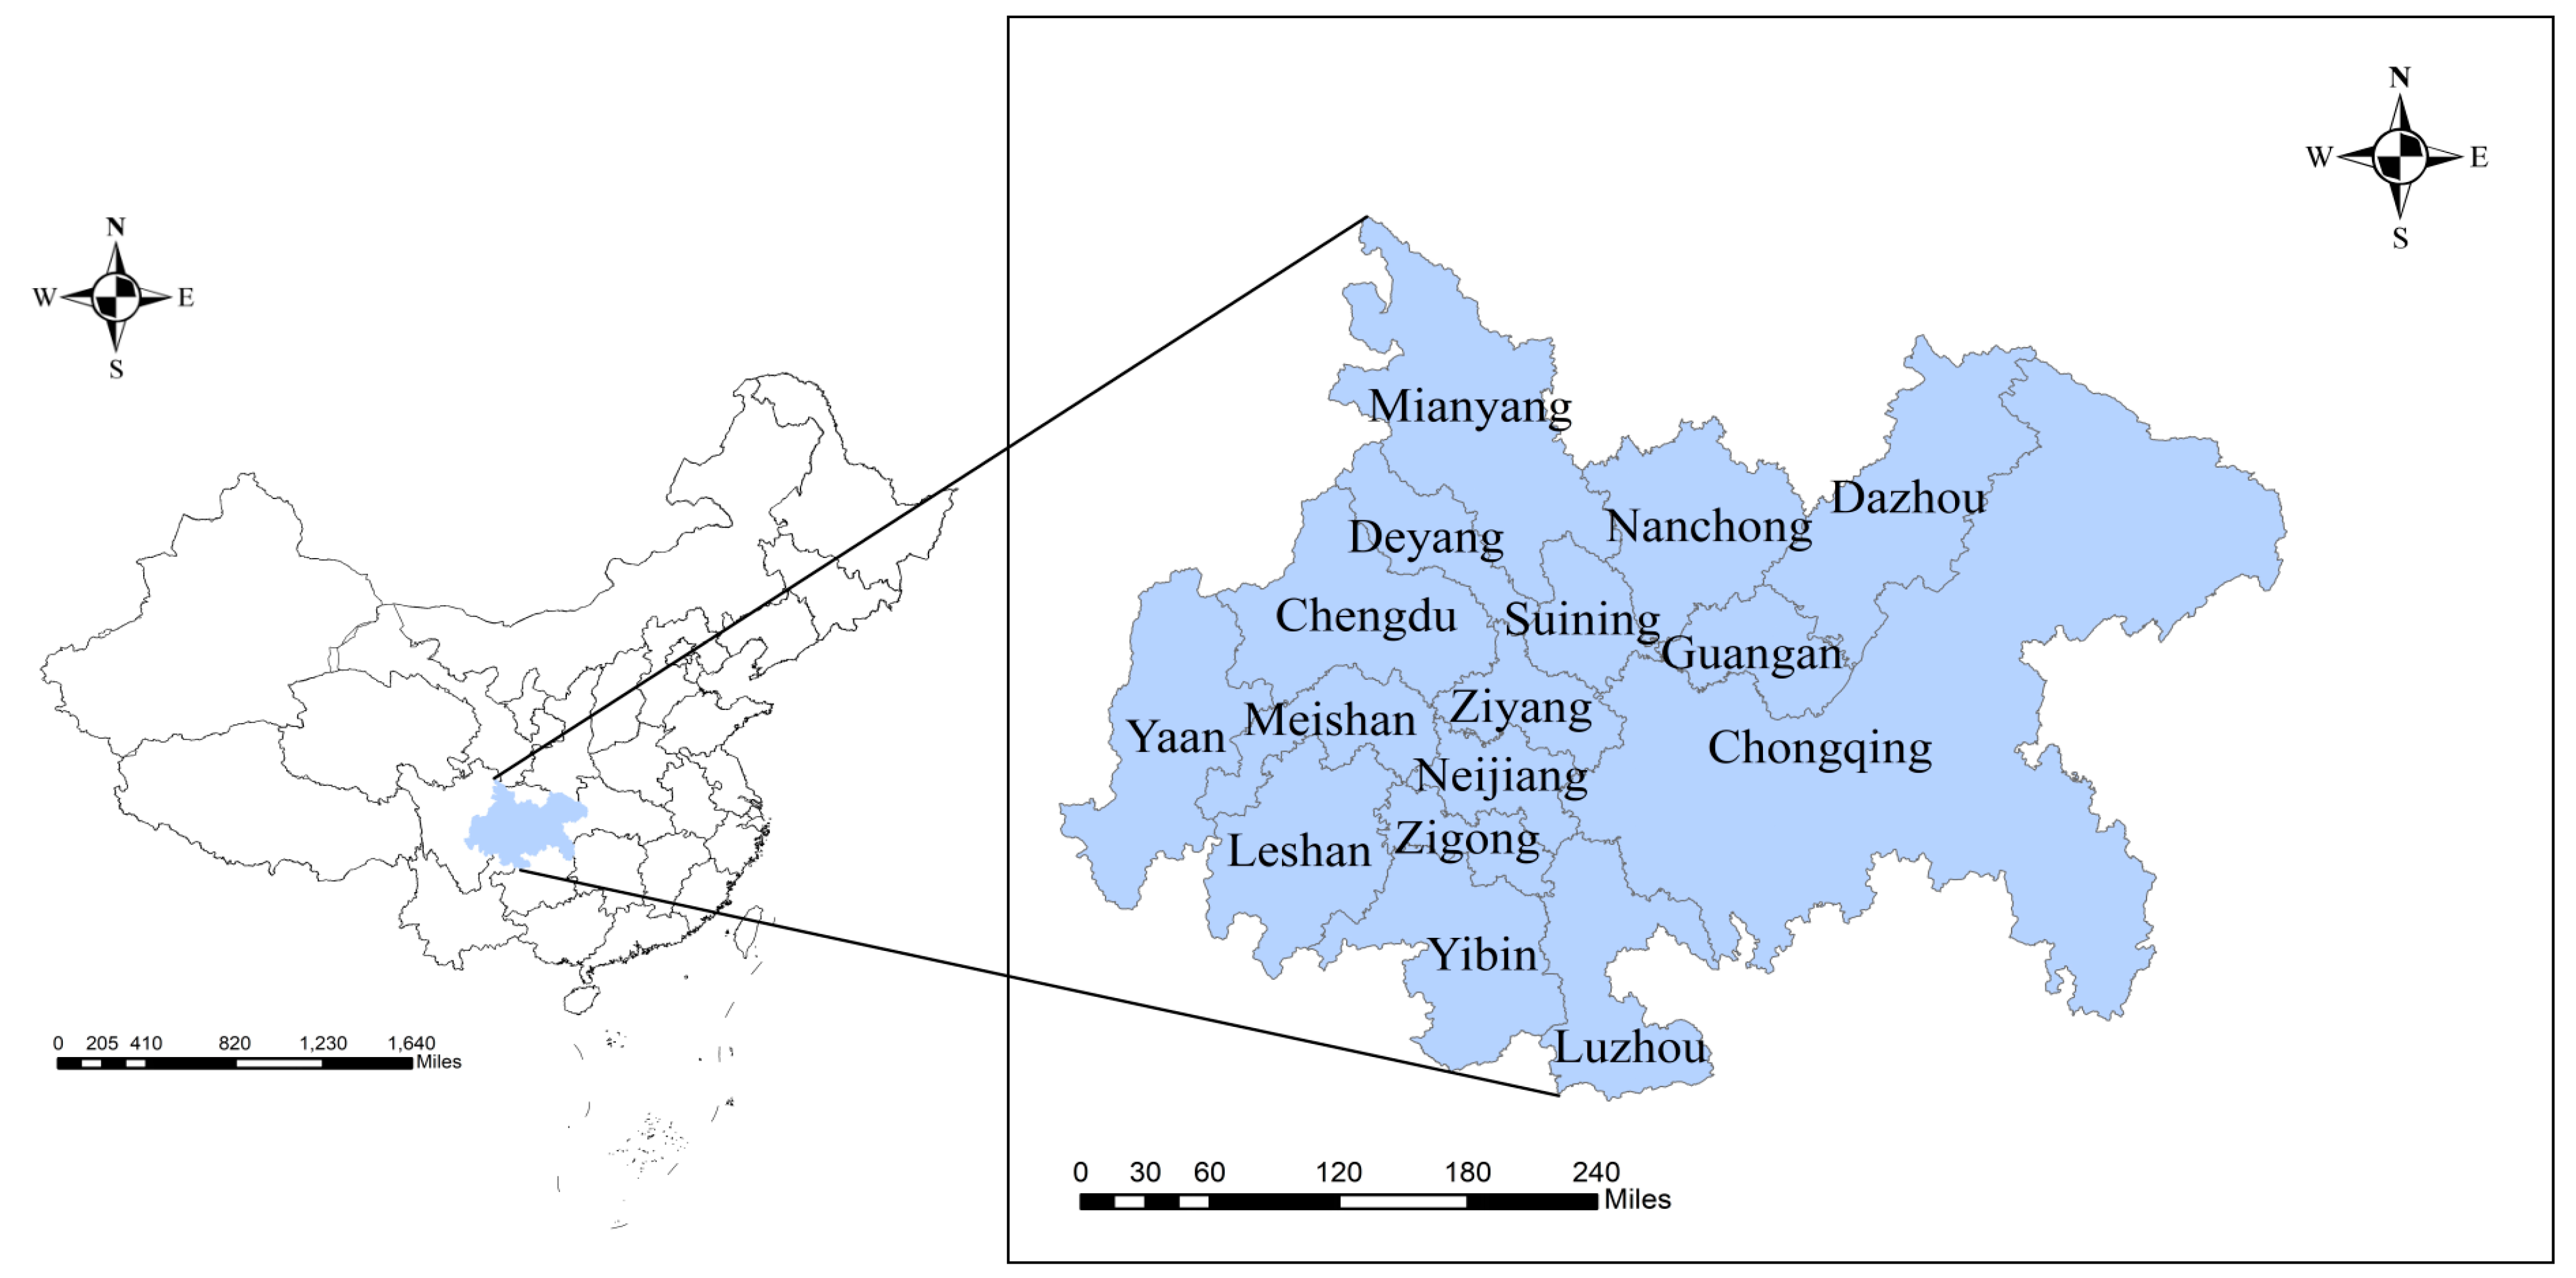
3.1. Study Area

The urban agglomeration of Chengdu–Chongqing is situated in the junction zone of China’s “two horizontal and three vertical” urbanization strategic pattern, which benefits from its advantageous location by linking the east and west with the north and south. It is one of the western regions with the best economic foundation and greatest economic power, and it contributes to the promotion of the west’s development. To achieve the green, coordinated, and sustainable growth of China, it is crucial to accelerate the development of the construction sector in the Chengdu–Chongqing urban agglomeration. The urban agglomeration of Chengdu–Chongqing was chosen as the research object in this study. According to the Development Planning of the Chengdu–Chongqing Urban Agglomeration, this urban agglomeration specifically includes 16 cities, including Chengdu, Zigong, Luzhou, Deyang, Mianyang, Meishan, Yibin, Neijiang, Leshan, Suining, Nanchong, Ya’an, Dazhou, Guang’an, Ziyang, and Chongqing, as shown in Figure 1.

3.2. Methodology

3.2.1. Super-Efficiency SBM Model

The super-efficiency SBM model is one of the most commonly employed models for efficiency measurement. It combines the benefits of the super-efficiency DEA and SBM models and takes the undesirable output into account to create a super-efficiency model. This addresses the shortcoming of the static DEA model, which cannot measure panel data. Assuming there exist n decision-making units (DMU), each consisting of m input factors, q 1 desired outputs, and q 2 undesired outputs, ρ * is the efficiency value. The specific model of the SBM model is as follows.
min ρ * = 1 1 m i = 1 m s i x i k 1 + 1 q 1 + q 2 ( r = 1 q 1 s r + y r k + t = 1 q 2 s t b b t k )
s . t . { j = 1 , j k n x i j λ j + s i = x i k j = 1 , j k n y r j λ j s r + = y r k j = 1 , j k n b t j λ j + s t b = b t k λ j , s i , s r + , s t b 0 ; i = 1 , 2 , , m ; r = 1 , 2 , , q 1 t = 1 , 2 , , q 2 ; j = 1 , 2 , , n ( j k )
A distinction between decision units that have an efficiency value of 1 as determined by the SBM model is necessary in order to more effectively compare efficiency values. Therefore, this paper further selects the super-efficient SBM model to calculate the efficiency of green technology innovation in the construction industry. The specific model of the super-efficient SBM model is as follows.
min ρ = 1 + 1 m i = 1 m s i x i k 1 1 q 1 + q 2 ( r = 1 q 1 s r + y r k + t = 1 q 2 s t b b t k )
s . t . { j = 1 , j k n x i j λ j s i x i k j = 1 , j k n y r j λ j + s r + y r k j = 1 , j k n b t j λ j s t b b t k 1 1 q 1 + q 2 ( r = 1 q 1 s r + y r k + t = 1 q 2 s t b b t k > 0 λ j , s i , s r + , s t b 0 ; i = 1 , 2 , , m ; r = 1 , 2 , , q 1 t = 1 , 2 , , q 2 ; j = 1 , 2 , , n ( j k )
The ρ in Formula (3) is the green technology innovation efficiency of the construction industry. x i j denotes the i-th input variable of the k-th DMU, and y r k denotes the r-th expected output variable of the k-th DMU, b t k denotes the t-th unexpected output variable of the k-th DMU. Where x i j is the total input of the j-th DMU of the i-th type input, y r j is the total expected output of the j-th DMU of the r-th type expected output, and b t j is the total unexpected output of the j-th DMU of the t-th type unexpected output. s i , s r + , and s t b are the slack variables of input, expected output, and undesired output indicators, respectively, and λj is the weight variable.

3.2.2. The Gravity Model

As the fundamental theory of physics, Newton’s universal gravity formula is employed extensively in the gravity model to examine and analyze the strength of spatial interaction. Subsequently, the gravity model has been gradually applied to economics [53], economic geography [54], urban and regional planning [55], and other fields. The traditional gravity model’s coefficient is adjusted after taking into account how geographic distance between cities affects the spatial spillover impact of green technology innovation efficiency. The gravity intensity of the city is proportional to the product of Gz and Gt, and inversely proportional to the distance [56]. The specific modified gravity model formula is as follows:
V z t = G z × G t D z t 2
Gz and Gt are the green technology innovation efficiencies of city z and city t, Dzt is the geographical distance between city z and city t, and Vzt is the spatial spillover intensity of the green technology innovation efficiencies of city z to that of city t.

3.2.3. Geographic Detector

The geographic detector is a statistical technique for analyzing geographic spatial differentiation that can detect spatial differences and reveal the driving factors behind them [57]. Because the influencing elements in the spatiotemporal development characteristics of green technology innovation efficiency cover a wide range of areas, their driving force and influencing mechanisms can be scientifically and logically recognized by geographic detectors [58]. This paper primarily employs the factor detection and interaction detection methods of the geographical detector model to investigate the degree to which each influencing element explains the efficiency of green technology innovation in the construction sector as well as the interactions between various influencing variables.
Factor detection is to calculate the q-value of each influence factor and detect the degree of explanation of the spatial variation of each influence factor on the efficiency of green technology innovation in the construction industry. The specific formula is as follows:
q = 1 ( h = 1 L N h σ h 2 ) / N σ 2
where h = 1, 2, 3 …, L is the stratification or zoning of influencing factor X and green technology innovation efficiency Y of the construction industry; Nh and N are the number of units in layer h and the whole area, respectively; σ h 2 and σ 2 are the variance of Y value of layer h and the whole area, respectively; the q value represents the explanatory power of the influencing factors, and its range is 0 to 1. The larger the q value is, the stronger the explanatory power of the influencing factor X on the green technology innovation efficiency Y of the construction industry is, and the weaker it is otherwise.
Interaction detection is to identify the interaction between different influencing factors, and then consider if this interaction has strengthened or weakened the case for the efficiency of green technology innovation in the construction sector or whether each influencing factor X has a separate impact on the construction industry’s efficiency Y to innovate and use green technology. The relationship between the influencing factors can be divided into five categories by comparing the result sizes of q(X1), q(X2), and q(X1X2), and then the relationship between the influencing factors is examined. These categories are nonlinear weakening, single factor nonlinear weakening, double factor enhancement, independent enhancement, and nonlinear enhancement. The specific judgment basis is shown in Table 1.

3.3. Index System

The indicator system is separated into input indicators and output indicators, and output indicators are further divided into desired and non-desired outputs for the selection of indicators for green technology innovation. The construction industry’s green technology innovation input–output index system is further formed (as shown in Table 2), and the SBM model with unexpected output super-efficiency is used to gauge the efficiency of green technology in the construction industry.

3.3.1. Input Indicators

(1) Research and development personnel. Since the number of industrial research and development (R&D) personnel was only systematically counted in 2009, data were seriously missing. Therefore, the construction industry was employed to replace the R&D personnel. (2) Research and development capital. R&D capital is usually measured by R&D capital stock or R&D expenditure. Due to the fact that the data on R&D expenditures of different industries were only counted in the second resource inventory of Sichuan Province in 2009, there were not enough pertinent statistics from prior years. In 2009, the R&D expenditure of the construction industry accounted for 1.4% of the internal R&D expenditure of Sichuan Province. The R&D expenditure of each prefecture level city in Sichuan Province in each year was therefore calculated in this study by multiplying this proportion by the internal R&D expenditure of each prefecture level city in Sichuan Province in each year [59]. The expenditure data of Chongqing’s subindustries were only counted in the second national resource inventory in 2009, lacking relevant statistical data from other years. The R&D expenditure of the Chongqing construction sector in 2009 was 0.17% of the city’s internal R&D expenditure. To determine the R&D spending of Chongqing in the construction sector each year, the product of this ratio and the internal expenditure of R&D funds in Chongqing were employed. (3) Resource investment. In this paper, the electricity consumption of the whole society each year was selected as the input index.

3.3.2. Output Indicators

(1) Expected output. The building’s finished area and the industry’s overall output value are chosen as the expected output indicators based on the data‘s availability. (2) Undesired output. Carbon dioxide emissions were selected as an indicator of undesirable output from the standpoint of environmental contamination. The United Nations’ Intergovernmental Panel on Climate Change carbon dioxide emission accounting method was used as a result of the lack of data on carbon dioxide emissions. According to the various energy consumptions of the construction industry, as well as their respective carbon emission coefficients, carbon oxidation factor for the provincial construction industry carbon emissions accounting. The corresponding indicators of the construction industry at the municipal level were used for the top-down conversion, and the carbon emissions of the construction industry at the provincial level were converted into the carbon emissions of the construction industry at the municipal level [60].
Table 2. Green technology innovation efficiency index system.
Indicator CategoryIndexDescribeUnit
Input indexPersonnel input [61] Full time equivalent of R&D personnel in construction industry104 persons
Capital input [59]R&D expenditure of construction industry108 CNY
Resource input [62] Total electricity consumption104 kWh
Expected output indexOutput value [63]Total output value of construction industry104 CNY
Area output [63]Completed area of housing construction104 m2
Unexpected output indexPollution emission output [64]Carbon dioxide emission from construction industry104 t

3.4. Influence Factors

Based on the previous research, considering the current situation and characteristics of the development of the construction industry, the influencing factors can be summarized into three aspects: construction industry resource endowment, social economy, and environmental awareness. The resource endowment of the construction industry mainly includes the scale of the industry, the rate of technical equipment, and the degree of industrial agglomeration. The socioeconomic factors mainly include the level of economic development, scientific and technological innovation, urbanization, and foreign direct investment. Environmental awareness mainly includes environmental regulation, education level, and public environmental concern. Specific variables are explained as shown in Table 3 below.

3.4.1. Industrial Scale

The industrial scale reflects the economic operation ability of the industry. The size of the industrial scale determines the capital strength of the industry, the number of scientific researchers, and the output of scientific research innovation. It will significantly affect the effective preservation of the ecological environment and the effective use of resources, and it is a crucial factor in advancing the development of green technology. The industrial scale is chosen to be the proportion of the entire production value of the construction industry above the scale toward the majority of construction firms.

3.4.2. Technical Equipment Rate

The ratio between the net value of machinery and equipment and related employees in the construction industry is known as the rate of technical equipment, and it somewhat indicates the degree of technical input in the sector. It has an impact on the advancement of technological innovation in the construction sector and serves as a crucial foundation for green technological innovation. The rate of technical equipment in the construction industry is measured by the coefficient of technical equipment or the degree of technical equipment.

3.4.3. Industrial Agglomeration

On the one hand, it will bring positive external benefits, such as resource sharing and technology spillover, in the process of industrial agglomeration, which contributes to the innovation of green technology in the region. On the other hand, when industrial agglomeration grows, pollutants are concentrated, increasing environmental pressure and the risk of a crowding-out effect, which are detrimental to the advancement of new green technologies. The location entropy is used to gauge the degree of concentration in the building business. It reflects the occupancy of an industry and can accurately and reasonably reflect the agglomeration level of enterprises. The proportion of the overall output value of the construction industry to the regional gross domestic product (GDP) of each city is divided by the proportion of the total output value of the construction industry to the regional GDP of the Chengdu–Chongqing urban agglomeration to calculate the location entropy of the construction industry.

3.4.4. Economic Development Level

While the funding of green technology research and development is highly tied to the level of economic development, the development of the construction sector is directly related to the external economic environment of the region [65]. As a result, the degree of regional economic prosperity has a significant impact on the adoption of green technologies in the construction sector. The level of the region’s economic development is expressed by the gross regional product.

3.4.5. Scientific and Technological Innovation Level

A strong basis for growth and innovation is provided by the level of scientific and technological innovation, which is a reflection of the region’s overall capacity for invention and creativity. It is the industry’s main engine for innovation in green technologies. The level of regional innovation in science and technology is assessed by the turnover of the technology market.

3.4.6. Urbanization Level

Urbanization is a process of gathering talent and labor force capital against the backdrop of sustainable development. In addition, it creates a conducive atmosphere for innovation to promote the advancement of green industrial technologies while funding scientific and technological advancement. The level of urbanization is determined by dividing the population of cities by the overall population.

3.4.7. Foreign Direct Investment

Capital, cutting-edge machinery and technology, seasoned management expertise, and other factors will be brought to the region via foreign direct investment [43]. It is conducive to making up for industrial deficiencies through green technology innovation and creating a good environment. The real amount of foreign capital utilized in that year is used to calculate regional foreign direct investment.

3.4.8. Environmental Regulation

Environmental regulation belongs to social regulation, which is the power to restrict the behavior of economic subjects by means of tangible rules and regulations or intangible consciousness. It is mainly aimed at improving the environment by realizing the coordination between the rational utilization of resources and economic and social development [66]. The comprehensive intensity indicator of sulfur dioxide emission, smoke dust emission, and industrial wastewater emission of each prefecture-level city is used to measure environmental control while taking data accessibility into account. The specific calculation steps of environmental regulation are as follows:
(1)
Calculate the relative intensity of environmental pollution emission:
E R n , i t = e n , i t z i t / i = 1 16 e n , i t z i t
where E R n , i t (i = 1, 2, …, 16) is the relative intensity of environmental pollution emissions, e n , i t is the emission of the n-th pollutant in the i-th municipality, and zit denotes the total industrial output value of the i-th municipality.
(2)
Calculate the comprehensive index of environmental regulation:
E R i t = 1 3 n = 1 3 E R n , i t
The sum of the relative intensities of pollution emissions from sulfur dioxide, smoke, and dust emissions, as well as industrial wastewater emissions, is represented by n = 1 3 E R n , i t , while E R i t stands for the comprehensive index of environmental regulation.
(3)
Calculate the intensity index of environmental regulation:
E R Y i t = 1 / E R i t
where E R Y i t is the environmental regulation intensity index.

3.4.9. Education Level

A key assurance for the growth of green technology innovation is the degree of a high-quality labor force, which is directly impacted by education levels. The proportion of full-time teachers in primary, middle, and high schools in the resident population at the end of the school year is used to gauge educational levels.

3.4.10. Public Environmental Concern

Public environmental concern is a nonmandatory regulatory measure. When the public is aware of the negative impact of environmental pollution on public welfare, its opinion will be formed through relevant measures and means. In this way, there will be a certain pressure on the relevant construction industry to protect its own interests and demands [67] and urge the industry or government departments to carry out green environmental protection behaviors. The number of searches on Baidu’s index websites for selected relevant keywords is a measure of the public’s environmental concern. The search times of each prefecture-level city in the Chengdu–Chongqing urban agglomeration in each year can be obtained by entering keywords related to environmental issues such as “environmental pollution”, “environmental governance”, and “carbon emission”. The value obtained by accumulating the number of keyword searches is used as a proxy for the public’s concern about environmental issues in that city.
Table 3. Influencing factors and classification of green technology innovation efficiency in the construction industry.
Characterization TypeInfluence FactorVariable DescriptionSymbolic Representation
Resource endowment of construction industryIndustrial scale [4]Total output value of construction industry above designated size/number of construction enterprises (%)X1
Technical equipment rate [68]Technical equipment coefficient or technical equipment degree (%)X2
Industrial agglomeration degree [69]Location entropy of construction industryX3
Social economic factorsEconomic development level [50]Regional GDP (108 CNY)X4
Scientific and technological innovation level [70]Technology market turnover (104 CNY)X5
Urbanization level [71]Urban population/total population (%)X6
Foreign direct investment [43] Actual amount of foreign capital used in the current year (104 USD)X7
Environmental awareness factorsEnvironmental regulation [48] Reciprocal of the comprehensive index of environmental pollution emissionsX8
Education level [51]The sum of full-time teachers in primary, middle, and high schools/the proportion of the last permanent resident population (%)X9
Public environmental concern [72]The number of searches of “environmental pollution”, “environmental governance”, and “carbon emissions” on Baidu index website (times)X10

3.5. Data Sources

This study used a research sample of urban statistics data from 2011 to 2019 and 16 cities in the Chengdu–Chongqing urban agglomeration as its research target. The data for the study were obtained from the China City Statistical Yearbook, the Sichuan Statistical Yearbook, the Chongqing Statistical Yearbook, the China Energy Statistical Yearbook, and the statistical yearbooks of other cities in the region as well as statistics from the Sichuan Provincial Department of Science and Technology. For individual missing datasets, linear interpolation was performed in this paper to ensure the integrity and validity of the data.

4. Results

4.1. Space–Time Characteristics of Green Technology Innovation Efficiency

The MATLAB software was employed to determine the green technology innovation efficiency of the construction industry in 16 cities within the study area from 2011 to 2019 using the efficiency evaluation index system developed above. The efficiency value reflects the level of innovation in green technology and differences in the construction industry in each city. The mean and ranking of green technology innovation efficiency in cities from 2011 to 2019 are shown in Table 4 below. By referring to the dividing standards of efficiency measurement in existing studies, the essential values for green technology innovation efficiency are 0.25, 0.5, and 0.75, which are separated into four tiers. Ultra-low efficiency is defined as being less than or equal to 0.25, low efficiency is defined as being between 0.25 and 0.5 (including 0.5), medium efficiency is defined as being between 0.5 and 0.75 (including 0.75), and high efficiency is defined as being greater than 0.75. The geographical and temporal evolution traits of green technology innovation efficiency in the construction industry in the Chengdu–Chongqing urban agglomeration were further examined based on the grade division of efficiency value.

4.1.1. Time Series Evolution Characteristics of Green Technology Innovation Efficiency

As can be seen from Table 4, in all the prefecture-level cities of the Chengdu–Chongqing urban agglomeration, the level of green technology innovation in the construction industry shows an overall upward trend from 2011 to 2019, while there are clear disparities between cities. From the perspective of the change in efficiency level, Chengdu, Zigong, Luzhou, Neijiang, Nanchong, Guang’an, Ya’an, and Chongqing are eight cities that have improved in the green technology innovation efficiency level. Among them, Guang’an saw a continual two-level increase in the level of green technology innovation, from low efficiency to high efficiency. It is the city with the largest increase in green technology innovation efficiency among the Chengdu–Chongqing urban agglomeration, with an annual growth rate of 26.34%. Zigong’s green technology innovation has improved from an ultra-low efficiency level to a medium efficiency level, and its annual growth rate is second only to Guang’an, reaching 20.32%. This might be the result of Zigong having a low value for green technology innovation efficiency in 2011 and a lot of potential for development. The efficiency of green technology innovation has significantly increased with the growth of the city’s green ecological economy. The green technology innovation efficiency of Chengdu and Chongqing improved from the medium efficiency level to the high-efficiency level. Chengdu and Chongqing’s green technology innovation efficiency was at the forefront of the Chengdu–Chongqing metropolitan agglomeration, but the annual growth rate was low, at 7.95% and 5.31%, respectively. Compared to the average level of the Chengdu–Chongqing economic circle, green technology innovation is higher in Chengdu and Chongqing, and the relative improvement space is limited. They work toward comprehensive and integrated development while also serving as the metropolitan agglomeration’s core development cities in the Chengdu–Chongqing region. A range of factors ought to be taken into account when enhancing the efficiency of green technology innovation. Consequently, this improvement has been relatively flat.
Based on the overall average, the green technology innovation efficiency of the construction industry in the study area is primarily at the low and medium efficiency levels, and the efficiency value gap between cities is significant. Overall, there is still room for improvement. Chongqing has the highest efficiency of green technology innovation, with an average efficiency of 0.936. The average efficiency of green technology innovation in Chengdu ranks second only to Chongqing, and its efficiency value is 0.807. Chengdu and Chongqing are the two central cities in Southwest China, and they are the backbone of promoting green technology innovation and development. They have established the groundwork for green technology innovation in the two cities’ construction industries by relying on their solid economic bases and technological advantages. The green technology innovation efficiency of Guang’an, Suining, and Nanchong ranked third, fourth, and fifth, and the average value of their overall green technology innovation efficiency from 2011 to 2019 was 0.791, 0.732, and 0.709, respectively. They are the main drivers behind the advancement of efficient green technology innovation in the research domain. However, the green technology innovation efficiency of Yibin and Leshan is relatively low, lower than 0.4, and the efficiency value is in the least developed state among the Chengdu–Chongqing urban agglomeration, with low efficiency and serious solidification.

4.1.2. Spatial Evolution Characteristics of Green Technology Innovation Efficiency

Due to the different conditions of social and economic development levels, geographical location, construction industry resource endowment, and other aspects, the characteristics of spatial heterogeneity of green technology innovation efficiency are easily brought about within the study area. ArcGIS 10.7 software was used to draw spatial distribution maps of the green technology innovation efficiency of the Chengdu–Chongqing urban agglomeration in 2011, 2014, 2017, and 2019, as shown in Figure 2 below.
On the whole, firstly, cities in the study area’s prefecture level exhibit glaring discrepancies in the efficiency of green technology innovation. The number of areas with high and medium efficiency has improved, with the share increasing from 31.25% in 2011 to 50% in 2019. At the same time, places with ultra-low levels of efficiency just started to exist in 2011, and the number of areas with ultra-low efficiency levels and low efficiency levels showed a downward trend, accounting for 50% in 2019 from 68.75% in 2011. Secondly, the west and northeast are where green technology innovation in the building industry is quite efficient, whereas the southwest and northwest are where it is reasonably low. The spatial distribution pattern of Chengdu-Ya’an and Chongqing-Guang’an-Nanchong, which are the main axes of the high-efficiency level area, and Yibin-Leshan-Meishan and Mianyang-Deyang, which are the two wings of the low-efficiency level area, are gradually formed. Finally, the regions with higher levels of efficiency primarily extended from the midwest and north central to the west and northeast, whereas the regions with lower levels of efficiency were concentrated in the southwest and northwest, demonstrating a tendency of narrowing regional reach.
This study created the spatial correlation strength matrix by applying the modified gravity model in order to further investigate and analyze the spatial distribution features of the green technology innovation efficiency of the construction sector in the Chengdu–Chongqing urban agglomeration. The geographical spillover network structure chart of green technology innovation efficiency in the construction sector was created using the ArcGIS software, and it efficiently and clearly highlighted the spillover characteristics of various spatial units. Five classes were used to categorize the spatial spillover intensity (V) of the green technology innovation efficiency in the construction industry: ultra-high (V ≥ 6), high (4.5 ≤ V < 6), medium (3 ≤ V < 4.5), low (1.5 ≤ V < 3), and ultra-low (0 ≤ V < 1.5), and combined with the ArcGIS software for visual expression, as shown in Figure 3.
The spatial network structure of green technology innovation efficiency exhibits the features of layer-level, accessibility, and multi-threaded spillover when viewed from the standpoint of the total spatial spillover network structure. It overcomes the conventional regional restrictions, broadens the radiation range, achieves the fusion of nearby and cross-regional radiation, enhances the spillover effect of green technology innovation on the construction sector of the Chengdu–Chongqing urban agglomeration, and narrows the regional divide even further. Chongqing in the east and Chengdu in the northwest form the key connections in the network spillover structure of green technology innovation efficiency in the construction sector. Among them, the network spillover structure of the main linkage objects in Chengdu is closely distributed. There is a significant amount of spatial spillover across cities, and there are more regional point pairs with high spatial correlation. Secondly, the spatial network with Chongqing as the main linkage object is relatively sparse. There are many regional point pairs with poor spatial correlation, and the spatial network structure made up of cities has a generally weak spillover link. The adoption of green technologies in Chongqing and the surrounding cities’ construction sectors exhibits erratic growth, and the growth trend is typically slowing down, which has an unequal spatial spillover effect on a global scale.
From a local viewpoint, consider Chengdu and Chongqing the “leading goose” cities in the area, exploit the head goose effect to the fullest extent possible, and encourage the development of multi-wing radiation and diffusion to neighboring cities. Green technology innovation in the building sector gradually formed a space overflow area with high efficiency, including Chengdu-Meishan, Chengdu-Deyang, Luzhou-Zigong-Neijiang-Ziyang-Suining-Nanchong, and Chongqing-Guang’an-Nanchong, among others. These organizations make up the central network framework for the spatial spillover of green technology innovation efficiency in the Chengdu–Chongqing metropolitan agglomeration’s construction sector. With the development of these groups, the structure is constantly strengthened, and the initial structure of the spatial overflow network is formed. The agglomeration effect of these groups will cause significant local and territorial differences in the efficiency of green technology innovation. In the short term, high-efficiency agglomeration has a “siphon effect” on surrounding cities, absorbing innovation resources from the surrounding areas, achieving rapid local development, and impeding technological innovation efficiency improvement in low-efficiency surrounding areas. However, high-efficiency agglomeration areas such as Chengdu-Meishan, Chongqing-Guang‘an, and Nanchong show a strong spillover effect of space technology on surrounding cities in the long run. As the distance increases, there is a spillover strength limit in terms of external expansion, which mostly manifests as low-strength spatial links across regions.

4.2. Analysis on the Influencing Factors of Spatial and Temporal Differentiation of Green Technology Innovation Efficiency

This paper selects the factors that may affect the spatial differentiation of green technology innovation efficiency in the construction industry from three dimensions: resource endowment, social economy, and environmental awareness, and detects the dominant factors of spatial and temporal variation in green technology innovation efficiency in the construction industry and the interaction between related influencing factors by using geographic detectors.

4.2.1. Analysis of Influencing Factors

In this paper, we use the factor detector to obtain and rank the q-values for the three time points of 2011, 2015, and 2019. Every component chosen in the preceding research that had explanatory power passed the 1% significance level test. Table 5 displays the specific outcomes.
The impact of resource endowment, social and economic factors, and environmental awareness factors on the efficiency of green technology innovation in the construction industry can be seen as having substantial disparities from the perspective of factor classification. Overall, socioeconomic and environmental awareness factors have a greater effect on efficiency values than resource endowment in the construction industry, which has a relatively lesser effect on them. The q-values of all factors, taken in the context of the 10 driving factors, range from 0.14 to 0.84, demonstrating that there are clear distinctions between the effects of various driving factors on the effectiveness of green technology innovation in the construction sector. According to rankings and q-values for 2011, 2015, and 2019, environmental regulation, economic development level, public environmental concern, urbanization level, and foreign direct investment have a significant impact on the efficiency of green technology innovation in the construction industry. The total q-value is greater than 0.5, and these influencing factors are the main driving factors. Among the remaining influencing factors, the explanatory power of industry scale decreased slightly and then increased. The efficiency of green technology innovation moved up to the second spot in the construction sector in 2019, and its q-value was 0.75, indicating a persistent increasing trend. Therefore, the scale of the industry is chosen as a potential variable affecting the efficiency of green technology innovation in the construction sector. In addition, the influence of education level and technical equipment rate on green technology innovation efficiency in the construction industry is relatively weak.
From the time dimension, the driving factors fluctuated to different degrees during 2011–2019. The explanatory power revealed a general rising trend that the influence of leading factors and potential variables on the spatial difference of green technology innovation efficiency in the construction industry gradually increased. Among them, there has been a noticeable increase in the degree of economic development, foreign direct investment, and environmental regulation. The industrial scale, urbanization level, and public environmental attention show V-shaped fluctuations, which first decline and then rise. The construction industry generally exhibits an increase in the explanatory power of green technology innovation efficiency. The education level and the rate of technical equipment both increased first and then decreased. The explanatory power of education level on the efficiency of green technology innovation in the construction industry is unstable and fluctuates greatly. However, in terms of explanatory power, the rate of technical equipment revealed a declining tendency.

4.2.2. Analysis on the Interaction of Spatial-Temporal Differentiation of Green Technological Innovation Efficiency

To further investigate the variation of explanatory power on green technology innovation efficiency in the construction industry when different driving factors interact, the dominant factors and potential factors after factor detection were selected to analyze their interaction mechanisms affecting the spatial divergence of green technology innovation efficiency in the construction industry. Due to the interaction between the two driving factors, it is not a simple linear addition [73]. Therefore, the q-value of the interaction influence of two drivers on green technology innovation in the construction industry is studied using the interaction detection of geographic detectors.
Table 6 displays the findings from the interactive detection investigation using the data from 2011 through 2019: There is a close relationship between the selected leading factors and the potential factors, and the q-value of each influencing factor shows different degrees of improvement after complex interaction. There are two modes of combination: double factor enhancement and nonlinear enhancement, and the interaction of all influencing variables has a greater impact on the geographic and temporal diversity of green technology innovation efficiency in the construction sector than any single factor. The interaction between industrial scale and urbanization level, foreign direct investment, and environmental regulation degree is explained by more than 60%, showing a stable growth trend over time. The level of economic development interacts with foreign direct investment, the degree of environmental regulation, and the public’s environmental concern, respectively, and the explanatory force is above 50%. As for the interaction between foreign direct investment and public environmental concern, the explanation strength is more than 80%, and the impact degree on the spatial and temporal differentiation of green technology innovation efficiency in the construction industry shows a continuous increasing trend from 2011 to 2019. The interaction effect of industrial scale and public environmental concern with urbanization level and environmental regulation degree is obvious, and the explanatory power is relatively strong. The explanatory power of the interaction between environmental regulation and public environmental attention is significantly improved compared with the single factor, and its explanatory power is relatively stable and above 90%, which is larger than the pairwise interaction result between other types of factors. From 2011 to 2019, each influencing factor experienced a transition between double-factor enhancement and nonlinear enhancement. The last mode of action stabilized at twofold factor enhancement in order to strengthen the justification of interaction factors on the efficiency of green technology innovation in the construction sector.

5. Discussion and Conclusions

5.1. Research Conclusions

The Chengdu–Chongqing urban agglomeration is a crucial growth pole for developing high-quality economic development in western China. This research assessed the green technology innovation efficiency of the construction sector in each city using data over the period of 16 cities in the Chengdu–Chongqing urban agglomeration from 2011 to 2019. Using a gravity model and a geographic detector, the geographical and temporal development characteristics of green technology innovation efficiency in the construction sector were explored. At the same time, the pertinent driving factors were identified, and the extent to which each driving element affects the efficiency of green technology innovation in the construction sector was explored for both single-factor and double-factor analyses. The ensuing conclusions were reached: (1) Within the Chengdu–Chongqing urban agglomeration, there are considerable regional variations in the efficiency of green technology innovation in the construction industry, and the overall trend is upward. (2) The research area exhibits spatially heterogeneous characteristics in terms of the efficiency of green technology innovation in the construction industry. Additionally, it demonstrates the tendency whereby the area with high efficiency levels gradually spreads to the surrounding areas with lower efficiency levels, and the area with low efficiency levels gradually decreases in scope. (3) The Chengdu–Chongqing urban agglomeration’s geographical spillover impact is undoubtedly constrained by distance. Additionally, the western region’s spatial spillover impact is superior to that of Chongqing’s eastern region. The western portion of the Chengdu–Chongqing urban agglomeration has a better spatial spillover impact than the eastern portion, which is represented by Chongqing. Moreover, the spatial spillover effect is significantly limited by distance. (4) Environmental regulation, the level of economic development, public environmental concern, the level of urbanization, and foreign direct investment, as the dominant factors of green technology innovation efficiency in the construction industry, and the industry’s scale as a potential factor, all have significant effects on the efficiency of green technology innovation in the construction industry. (5) In comparison to the single component, the interaction between the leading factor and the potential factor has a greater influence on the regional and temporal differentiation of green technology innovation efficiency in the construction sector.

5.2. Theoretical Contribution

This paper’s theoretical contribution, as compared to previous studies, focuses primarily on three areas:
Firstly, prior to measuring the efficiency of green technology innovation in the research area’s construction industry, the undesirable output is fully taken into account. It is discovered that the research area’s overall innovation efficiency in green technology is notably different and exhibits an upward trend. This confirms the opinion of Qian et al. (2022) [74] that there is an imbalance in green technology innovation in inland areas and that there are obvious differences between regions. Additionally, it was discovered that places distant from the central cities were more likely to have severe solidification and ultra-low efficiency, which was in line with the findings of Xu et al. (2020) [75]. Based on these findings, this study investigates and analyzes the characteristics of the green technology innovation efficiency of the construction sector in the study area over time and space, as well as further examining the variations between cities and the degree of spatial connectivity.
Secondly, green technology innovation in the construction sector has had an optimistic spillover effect in the study area, gradually transferring from the high-efficiency-level to the neighboring low-efficiency-level areas, and the low-efficiency-level area’s scope gradually exhibiting a trend of narrowing. The findings of Hu et al. (2022) [76], Wang et al. (2022) [77], and Zhao et al. (2021) [78] are in agreement with this finding. They believe that high-efficiency areas have radiation effects on low-efficiency areas and narrow the gap between cities. In order to intuitively reveal the spillover effect between different spatial units, this paper introduces the gravity model and utilizes the spatial spillover network structure diagram. As a result, the research findings on the efficiency of green technology innovation in the construction industry are further enhanced.
Thirdly, this research analyzes the factors that affect the efficiency of green technology innovation in the construction sector. The results are consistent with those of Zhao et al. (2022) [72], Li et al. (2022) [45], and Stucki et al. (2018) [79] and indicate that environmental regulation and economic development levels have a significant impact on green technology innovation efficiency in the sector. According to Porter’s theory, environmental regulation, to some extent, has a favorable effect on the development of green technology [80]. High economic development locations typically have enough funding for green technology innovation activities, which can significantly encourage the improvement of green technology innovation efficiency. Existing studies consider the influencing factors to be thin and do not include multiple influencing factors in the same space for interaction impact analysis. In order to make up for these deficiencies, based on the characteristics of geographic detectors, factors of multicollinearity can be included in the same framework system for discussion. This paper expands the influencing factor system of green technology innovation efficiency in the construction industry and enriches the research findings by taking into account and examining the driving role of related influencing factors from the three aspects of the construction industry’s resource endowment, social economy, and environmental awareness.

5.3. Management Inspiration

The Chengdu–Chongqing City cluster is situated at the intersection of the “Belt and Road” and the Yangtze River Economic Belt, which has considerable regional advantages and serves as an essential platform for the development of the western province. With the continuous promotion of the “double carbon” policy, the construction industry is in urgent need of green and low-carbon transformation. Therefore, the following suggestions are put forward:
Firstly, develop differentiated environmental regulation policies to enhance the institutional environment for the development of green technology innovation. The Chengdu–Chongqing region’s construction industry’s use of green technology innovation is best explained by environmental regulation, which has the strongest overall impact. Increase government involvement, bolster the administration’s commitment to environmental protection, develop local conditions-specific environmental regulation laws, enhance the relevance and efficiency of environmental regulation, and facilitate the balanced development of green technology innovation efficiency.
Secondly, focus on bringing in top-notch foreign funding and promoting the advancement of green technology innovation in the construction industry. The spillover impact of technology, funding, resources, and knowledge delivered by foreign direct investment is fully utilized through the infusion of high-quality foreign investment by the government. This is a significant technique to increase the efficiency of green technology innovation in the research domain and is conducive to accelerating the transition of green technology innovation accomplishments in the construction sector.
Thirdly, encourage the public’s excitement about environmental issues and fully utilize the public’s oversight role. Develop policies to support and encourage public participation in environmental governance while continuously improving and standardizing the format of letters and media reports. This supports modernizing and scientifically validating environmental governance, ensures the timely and efficient implementation of public supervision and management, and is a crucial building block for attaining green, sustainable, and healthy development in the construction industry.
Finally, strengthen coordinated development among regions to narrow the imbalance. An efficient method of coordinating and promoting the growth of green technology innovation in the construction sector in each prefecture-level city in the Chengdu–Chongqing region is to improve the level of technical openness among cities. Give large cities such as Chengdu and Chongqing their due as “leading goose”, radiate these cities’ advantages in cutting-edge technology and resources to neighboring cities with low rates of green technology innovation, and encourage the integration and sustainable growth of the construction sector in this area.

5.4. Limitations and Deficiencies

In this study, the efficiency of green technology innovation in the construction sector is evaluated. The gravity model and geographic detector are used to investigate the characteristics of the spatial and temporal evolution of efficiency and its affecting elements. It expands and enriches the research theory of green technology innovation in the construction industry and helps to promote the green and low-carbon transformation of the construction industry. This study may have several shortcomings, which should be addressed and resolved in further studies. First of all, only the Chengdu–Chongqing urban agglomeration in China is used as the research region for this work, which focuses on the efficiency and impact variables of green technology innovation in the construction industry of 16 of those cities. However, there might be regional differences in the construction industry’s use of green technology innovation in various metropolitan agglomerations. In the future, a comparison study of typical regions such as the Beijing-Tianjin-Hebei urban agglomeration and the Yangtze River Delta urban agglomeration will be necessary. Explore in further detail the regulations for green technology innovation in the construction industry in various urban agglomerations. Secondly, the research object is not sufficiently detailed. The construction industry of each city in the region is the research object of this paper, and the research scope is broad. It can be refined further in future research, and the city can be refined further for each construction enterprise or county for more in-depth research. Last but not least, this essay primarily focuses on the effects of resource abundance, social economics, and environmental consciousness in light of the influencing variables of green technology innovation and efficiency in the construction industry. It might also be impacted by factors such as the energy consumption structure, ancillary industries, and management levels, among others, which will require more investigation and in-depth debate in the future.

Author Contributions

Conceptualization, B.W.; methodology, H.C.; software, H.C.; formal analysis, Y.A.; investigation, F.L.; resources, B.W.; data curation, F.L. and B.W.; writing—original draft preparation, H.C.; writing—review and editing, F.L. and B.W.; supervision, Y.A. All authors have read and agreed to the published version of the manuscript.

Funding

This research was funded by National Social Science Foundation of China (22BJY142).

Institutional Review Board Statement

Not applicable.

Informed Consent Statement

Not applicable.

Data Availability Statement

Not applicable.

Conflicts of Interest

The authors declare no conflict of interest.

Abbreviations

SBM: slacks-based measure. SFA: stochastic frontier analysis. DEA: data envelopment analysis. BCC: Banker-Charnes-Cooper. CCR: Charnes-Cooper-Rhodes. OECD: Organization for Economic Co-operation and Development. DMU: decision-making units. R&D: research and development. GDP: gross domestic product.

References

  1. Zhang, L.L. Environmental Regulation, Government R & D Funding and Green Technology Innovation. Master’s Thesis, Anhui University of Finance and Economics, Bengbu, China, 2020. [Google Scholar]
  2. Friedlingstein, P.; O’Sullivan, M.; Jones, M.W.; Andrew, R.M.; Hauck, J.; Olsen, A.; Peters, G.P.; Peters, W.; Pongratz, J.; Sitch, S.; et al. Global Carbon Budget 2020. Earth Syst. Sci. Data 2020, 12, 3269–3340. [Google Scholar] [CrossRef]
  3. Du, K.; Li, P.Z.; Yan, Z.M. Do green technology innovations contribute to carbon dioxide emission reduction? Empirical evidence from patent data. Technol. Forecast. Soc. Chang. 2019, 146, 297–303. [Google Scholar] [CrossRef]
  4. Hong, M.; Li, Z.; Drakeford, B. Do the Green Credit Guidelines Affect Corporate Green Technology Innovation? Empirical Research from China. Int. J. Environ. Res. Public Health 2021, 18, 1682. [Google Scholar] [CrossRef] [PubMed]
  5. Sun, S.S. Research on the Spatial Network Structure Effect of the Construction Industry and Its Carbon Dioxide Emissions. Ph.D. Thesis, Xi’an University of Architecture and Technology, Xi’an, China, 2017. [Google Scholar]
  6. Xiao, L.; Gong, Y.C. Spatial agglomeration analysis of gross output value of construction industry in East China. Coop. Econ. Technol. 2013, 3, 24–25. [Google Scholar] [CrossRef]
  7. Suki, N.M.; Sharif, A.; Afshan, S.; Jermsittiparsert, K. The role of technology innovation and renewable energy in reducing environmental degradation in Malaysia: A step towards sustainable environment. Renew. Energy 2022, 182, 245–253. [Google Scholar] [CrossRef]
  8. Lu, Y.Z. Green energy-saving buildings are extremely urgent in China. China Real Estate 2011, 06, 29–32. [Google Scholar]
  9. Wurlod, J.D.; Noailly, J. The impact of green innovation on energy intensity: An empirical analysis for 14 industrial sectors in OECD countrie. Energy Econ. 2018, 71, 47–61. [Google Scholar] [CrossRef] [Green Version]
  10. Sun, X.T.; Gao, J.H.; Fan, D. Analysis on Regional Differences and Efficiency Improvement of China’s Green Technology Innovation. Sci. Technol. Dev. 2018, 14, 1092–1098. [Google Scholar]
  11. Wei, W.D.; Cai, W.Q.; Guo, Y.; Bai, C.Q.; Yang, L.Z. Decoupling relationship between energy consumption and economic growth in China’s provinces from the perspective of resource security. Resour. Policy 2020, 68, 101693. [Google Scholar] [CrossRef]
  12. Feng, Y.; Chen, H.; Chen, Z.J.; Wang, Y.N.; Wei, W.D. Has environmental information disclosure eased the economic inhibition of air pollution? J. Clean. Prod. 2021, 284, 125412. [Google Scholar] [CrossRef]
  13. Chen, H.; Guo, W.; Feng, X.; Wei, W.D.; Liu, H.B.; Feng, Y.; Gong, W.Y. The impact of low-carbon city pilot policy on the total factor productivity of listed enterprises in China. Resour. Conserv. Recycl. 2021, 169, 105457. [Google Scholar] [CrossRef]
  14. Wei, W.D.; Hao, S.J.; Yao, M.T.; Chen, W.; Wang, S.S.; Wang, Z.Y.; Wang, Y.; Zhang, P.F. Unbalanced economic benefits and the electricity-related carbon emissions embodied in China’s interprovincial trade. J. Environ. Manag. 2020, 263, 110390. [Google Scholar] [CrossRef] [PubMed]
  15. Ren, K.; Kong, Y.S.; Imran, M.; Bangash, A.K. The Impact of the Voluntary Environmental Agreements on Green Technology Innovation: Evidence from the Prefectural-Level Data in China. Front. Environ. Sci. 2022, 10, 833724. [Google Scholar] [CrossRef]
  16. Wang, D. Research on the Motivation and Economic Consequences of Green Technological Innovation. Ph.D. Thesis, Zhejiang Business University, Hangzhou, China, 2022. [Google Scholar]
  17. Braun, E.; Wield, D. Regulation as a means for the social control of technology. Technol. Anal. Strateg. Manag. 1994, 6, 259–272. [Google Scholar] [CrossRef]
  18. Sun, Y.; Anwar, A.; Razzaq, A.; Liang, X.; Siddique, M. Asymmetric role of renewable energy, green innovation, and globalization in deriving environmental sustainability: Evidence from top-10 polluted countries. Renew. Energy 2022, 185, 280–290. [Google Scholar] [CrossRef]
  19. Tolliver, C.; Fujii, H.; Keeley, A.R.; Managi, S. Green Innovation and Finance in Asia. Asian Econ. Policy Rev. 2021, 16, 67–87. [Google Scholar] [CrossRef]
  20. Du, K.; Li, J.L. Towards a green world: How do green technology innovations affect total-factor carbon productivity. Energy Policy 2019, 131, 240–250. [Google Scholar] [CrossRef]
  21. Acemoglu, D.; Aghion, P.; Bursztyn, L.; Hemous, D. The Environment and Directed Technical Change. Am. Econ. Rev. 2012, 102, 131–166. [Google Scholar] [CrossRef] [Green Version]
  22. Bai, C.Q.; Feng, C.; Yan, H.; Yi, X.; Chen, Z.J.; Wei, W.D. Will income inequality influence the abatement effect of renewable energy technological innovation on carbon dioxide emissions? J. Environ. Manag. 2020, 264, 110482. [Google Scholar] [CrossRef]
  23. Yang, F.T. Institutional Research on Green Technological Innovation—Based on the Perspective of Ecological Civilization. Ph.D. Thesis, Party School of the CPC Central Committee, Beijing, China, 2014. [Google Scholar]
  24. Peneder, M.; Arvanitis, S.; Rammer, C.; Stucki, T.; Wörter, M. Policy instruments and self-reported impacts of the adoption of energy saving technologies in the DACH region. Empirica 2022, 49, 369–404. [Google Scholar] [CrossRef]
  25. Conceição, P.; Heitor, M.V.; Vieira, P.S. Are environmental concerns drivers of innovation? Interpreting Portuguese innovation data to foster environmental foresight. Technol. Forecast. Soc. Chang. 2004, 73, 266–276. [Google Scholar] [CrossRef]
  26. VandeWerf, F. Management of acute myocardial infarction in patients presenting with ST-segment elevation. Eur. Heart J. 2003, 24, 28–66. [Google Scholar] [CrossRef] [PubMed]
  27. Hellström, T. Dimensions of environmentally sustainable innovation: The structure of eco-innovation concepts. Sustain. Dev. 2007, 15, 148–159. [Google Scholar] [CrossRef]
  28. Manral, L. An evolutionary theory of demand-side determinants of strategy dynamics. Manag. Res. Rev. 2018, 41, 314–344. [Google Scholar] [CrossRef]
  29. Fernando, Y.; Chiappetta Jabbour, C.J.; Wah, W.X. Pursuing green growth in technology firms through the connections between environmental innovation and sustainable business performance: Does service capability matter? Resour. Conserv. Recycl. 2019, 141, 8–20. [Google Scholar] [CrossRef]
  30. Zhang, M.L.; Liu, Y. Influence of digital finance and green technology innovation on China’s carbon emission efficiency: Empirical analysis based on spatial metrology. Sci. Total Environ. 2022, 838, 156463. [Google Scholar] [CrossRef]
  31. Wang, X.Y.; Wang, Q. Research on the impact of green finance on the upgrading of China’s regional industrial structure from the perspective of sustainable development. Resour. Policy 2021, 74, 102436. [Google Scholar] [CrossRef]
  32. Wang, M.Y.; Li, Y.M.; Li, J.Q.; Wang, Z.T. Green process innovation, green product innovation and its economic performance improvement paths: A survey and structural model. J. Environ. Manag. 2021, 297, 113282. [Google Scholar] [CrossRef]
  33. Sun, L.Y.; Miao, C.L.; Yang, L. Ecological-economic efficiency evaluation of green technology innovation in strategic emerging industries based on entropy weighted TOPSIS method. Ecol. Indic. 2017, 73, 554–558. [Google Scholar] [CrossRef]
  34. Liu, L.; Zhang, Z.S.; Wang, Z.; Xu, J.G. Health evaluation and key influencing factor analysis of green technological innovation system. Environ. Sci. Pollut. Res. 2022, 29, 77482–77501. [Google Scholar] [CrossRef]
  35. Zhu, L.; Wang, Y.; Shang, P.P.; Qi, L.; Yang, G.C.; Wang, Y. Improvement path, the improvement potential and the dynamic evolution of regional energy efficiency in China: Based on an improved nonradial multidirectional efficiency analysis. Energy Policy 2019, 133, 110883. [Google Scholar] [CrossRef]
  36. Lin, S.F.; Sun, J.; Marinova, D.; Zhao, D.T. Evaluation of the green technology innovation efficiency of China’s manufacturing industries: DEA window analysis with ideal window width. Technol. Anal. Strateg. Manag. 2018, 30, 1166–1181. [Google Scholar] [CrossRef]
  37. Zhang, L.Y.; Ma, X.; Ock, Y.S.; Qing, L.L. Research on Regional Differences and Influencing Factors of Chinese Industrial Green Technology Innovation Efficiency Based on Dagum Gini Coefficient Decomposition. Land 2022, 11, 122. [Google Scholar] [CrossRef]
  38. Tone, K. A slacks-based measure of efficiency in data envelopment analysis. Eur. J. Oper. Res. 2001, 130, 498–509. [Google Scholar] [CrossRef] [Green Version]
  39. Feng, Z.J. Research on Green Innovation Efficiency of Chinese Industrial Enterprises. China Sci. Technol. Forum 2013, 2, 82–88. [Google Scholar] [CrossRef]
  40. Shen, T.T.; Li, D.J.; Jin, Y.Y.; Li, J. Impact of Environmental Regulation on Efficiency of Green Innovation in China. Atmosphere 2022, 13, 767. [Google Scholar] [CrossRef]
  41. Li, J.; Du, Y.X. Spatial effect of environmental regulation on green innovation efficiency: Evidence from prefectural-level cities in China. J. Clean. Prod. 2021, 286, 125032. [Google Scholar] [CrossRef]
  42. Miao, C.L.; Fang, D.B.; Sun, L.Y.; Luo, Q.L. Natural resources utilization efficiency under the influence of green technological innovation. Resour. Conserv. Recycl. 2017, 126, 153–161. [Google Scholar] [CrossRef]
  43. Liu, C.Y.; Gao, X.Y.; Ma, W.L.; Chen, X.T. Research on regional differences and influencing factors of green technology innovation efficiency of China’s high-tech industry. J. Comput. Appl. Math. 2020, 369, 112597. [Google Scholar] [CrossRef]
  44. Behera, P.; Sethi, N. Nexus between environment regulation, FDI, and green technology innovation in OECD countries. Environ. Sci. Pollut. Res. 2022, 29, 52940–52953. [Google Scholar] [CrossRef]
  45. Li, M.Y.; Gao, X. Implementation of enterprises’ green technology innovation under market-based environmental regulation: An evolutionary game approach. J. Environ. Manag. 2022, 308, 114570. [Google Scholar] [CrossRef] [PubMed]
  46. Nazli, T.; Janice, C.; Vedat, V. Strategic supply chain decisions under environmental regulations: When to invest in end-of-pipe and green technology. Eur. J. Oper. Res. 2020, 283, 601–613. [Google Scholar] [CrossRef]
  47. Sung, B. Do government subsidies promote firm-level innovation? Evidence from the Korean renewable energy technology industry. Energy Policy 2019, 132, 1333–1344. [Google Scholar] [CrossRef]
  48. Rubashkina, Y.; Galeotti, M.; Verdolini, E. Environmental regulation and competitiveness: Empirical evidence on the Porter Hypothesis from European manufacturing sectors. Energy Policy 2015, 83, 288–300. [Google Scholar] [CrossRef] [Green Version]
  49. Wang, P.; Dong, C.; Chen, N.; Qi, M.; Yang, S.; Nnenna, A.B.; Li, W. Environmental Regulation, Government Subsidies, and Green Technology Innovation—A Provincial Panel Data Analysis from China. Int. J. Environ. Res. Public Health 2021, 18, 11991. [Google Scholar] [CrossRef]
  50. Adewale Alola, A.; Ozturk, I.; Bekun, F.V. Is clean energy prosperity and technological innovation rapidly mitigating sustainable energy-development deficit in selected sub-Saharan Africa? A myth or reality. Energy Policy 2021, 158, 112520. [Google Scholar] [CrossRef]
  51. Muhammad, A.N.; Toan, L.D.H.; Huong, T.X.T. Role of financial development, economic growth & foreign direct investment in driving climate change: A case of emerging ASEAN. J. Environ. Manag. 2019, 242, 131–141. [Google Scholar] [CrossRef]
  52. Zhang, D.Y.; Vigne, S.A. How does innovation efficiency contribute to green productivity? A financial constraint perspective. J. Clean. Prod. 2021, 280, 124000. [Google Scholar] [CrossRef]
  53. Lei, S.Y.; Pan, Z.L.; Niu, C.Q. Analysis of the China-Eurasian Economic Union Trade Potential Based on Trade Gravity Model; Springer International Publishing: Cham, Switzerland, 2022; pp. 288–297. [Google Scholar] [CrossRef]
  54. Michele, F.; Francesco, M. Trade Costs and Economic Development. Econ. Geogr. 2012, 88, 137–163. [Google Scholar] [CrossRef]
  55. Wu, G.C.; Li, J.; Chong, D.; Niu, X. Analysis on the Housing Price Relationship Network of Large and Medium-Sized Cities in China Based on Gravity Model. Sustainability 2021, 13, 4071. [Google Scholar] [CrossRef]
  56. Lourenço, D.; Sá, C. Estimating the Effect of Distance on the Migration of Higher Education Candidates. B. E. J. Econ. Anal. Policy 2022, 22, 739–761. [Google Scholar] [CrossRef]
  57. Wang, J.F.; Xu, C.D. Geographic detector: Principles and prospects. J. Geogr. 2017, 72, 116–134. [Google Scholar]
  58. Xin, L.; Sun, H.; Wang, H.; Xiao, H.Y. Research on Spatial and Temporal Differentiation and Driving Forces of Green Economic Efficiency Based on Geographic Detector. China’s Popul. Resour. Environ. 2020, 30, 128–138. [Google Scholar]
  59. Zhang, J.X.; Ouyang, Y.; Ballesteros-Pérez, P.; Li, H.; Philbin, S.P.; Li, Z.L.; Skitmore, M. Understanding the impact of environmental regulations on green technology innovation efficiency in the construction industry. Sustain. Cities Soc. 2021, 65, 102647. [Google Scholar] [CrossRef]
  60. Shan, Y.L.; Guan, D.B.; Liu, J.H.; Mi, Z.F.; Liu, Z.; Liu, J.R.; Schroeder, H.; Cai, B.F.; Chen, Y.; Shao, S.; et al. Methodology and applications of city level CO2 emission accounts in China. J. Clean. Prod. 2017, 161, 1215–1225. [Google Scholar] [CrossRef] [Green Version]
  61. Shen, T.; Chen, H.H.; Zhao, D.H.; Qiao, S. Examining the impact of environment regulatory and resource endowment on technology innovation efficiency: From the microdata of Chinese renewable energy enterprises. Energy Rep. 2022, 8, 3919–3929. [Google Scholar] [CrossRef]
  62. Xie, C.; Wang, Q. Analysis on the spatio-temporal pattern evolution and influencing factors of China’s new energy industry’s technological innovation capability. Geogr. Res. 2022, 41, 130–148. [Google Scholar]
  63. Ye, G.; Fu, Y.; Wang, Y.H.; Mou, P.; Tang, X.Y. Overview of Research on Total Factor Productivity Measurement in the Construction Industry. Constr. Econ. 2019, 40, 24–28. [Google Scholar] [CrossRef]
  64. Peng, Y.F.; Fan, Y.Y.; Liang, Y. A Green Technological Innovation Efficiency Evaluation of Technology-Based SMEs Based on the Undesirable SBM and the Malmquist Index: A Case of Hebei Province in China. Sustainability 2021, 13, 11079. [Google Scholar] [CrossRef]
  65. Deng, Y.L.; You, D.M.; Wang, J.J. Research on the nonlinear mechanism underlying the effect of tax competition on green technology innovation—An analysis based on the dynamic spatial Durbin model and the threshold panel model. Resour. Policy 2022, 76, 102545. [Google Scholar] [CrossRef]
  66. Zhang, X.M.; Wu, N.; Wu, J.; Feng, Q.; Fu, Z.Q. Review on the connotation, characterization and application of environmental regulation. J. Environ. Eng. Technol. 2021, 11, 1250–1257. [Google Scholar]
  67. Khosla, R.; Sagar, A.; Mathur, A. Deploying Low-carbon Technologies in Developing Countries: A view from India’s buildings sector. Environ. Policy Gov. 2017, 27, 149–162. [Google Scholar] [CrossRef] [Green Version]
  68. Hua, J.N.; Wang, Y. Analysis of green total factor productivity of China’s construction industry based on panel data of 30 provinces. Pract. Understand. Math. 2020, 50, 297–305. (In Chinese) [Google Scholar]
  69. Li, X.; Lai, X.D.; Zhang, F.C. Research on green innovation effect of industrial agglomeration from perspective of environmental regulation: Evidence in China. J. Clean. Prod. 2021, 288, 125583. [Google Scholar] [CrossRef]
  70. Mormina, M. Science, Technology and Innovation as Social Goods for Development: Rethinking Research Capacity Building from Sen’s Capabilities Approach. Sci. Eng. Ethics 2018, 25, 671–692. [Google Scholar] [CrossRef] [Green Version]
  71. Dong, X.; Fu, W.; Yang, Y.; Liu, C.; Xue, G. Study on the Evaluation of Green Technology Innovation Efficiency and Its Influencing Factors in the Central Plains City Cluster of China. Sustainability 2022, 14, 11012. [Google Scholar] [CrossRef]
  72. Hunt, K.; Gruszczynski, M. The influence of new and traditional media coverage on public attention to social movements: The case of the Dakota Access Pipeline protests. Inf. Commun. Soc. 2021, 24, 1024–1040. [Google Scholar] [CrossRef]
  73. Han, J.J.; Wang, J.P.; Chen, L.; Xiang, J.Y.; Ling, Z.Y.; Li, Q.K.; Wang, E.L. Driving factors of desertification in Qaidam Basin, China: An 18-year analysis using the geographic detector model. Ecol. Indic. 2021, 124, 107404. [Google Scholar] [CrossRef]
  74. Wang, Q.; Ren, S.M. Evaluation of green technology innovation efficiency in a regional context: A dynamic network slacks-based measuring approach. Technol. Forecast. Soc. Chang. 2022, 182, 121836. [Google Scholar] [CrossRef]
  75. Xu, S.R.; Wu, T.; Zhang, Y. The spatial-temporal variation and convergence of green innovation efficiency in the Yangtze River Economic Belt in China. Environ. Sci. Pollut. Res. Int. 2020, 27, 26868–26881. [Google Scholar] [CrossRef]
  76. Hu, B.; Yuan, K.; Niu, T.Y.; Zhang, L.; Guan, Y.Q. Study on the Spatial and Temporal Evolution Patterns of Green Innovation Efficiency and Driving Factors in Three Major Urban Agglomerations in China—Based on the Perspective of Economic Geography. Sustainability 2022, 14, 9239. [Google Scholar] [CrossRef]
  77. Wang, X.; Wang, S.; Zhang, Y. The Impact of Environmental Regulation and Carbon Emissions on Green Technology Innovation from the Perspective of Spatial Interaction: Empirical Evidence from Urban Agglomeration in China. Sustainability 2022, 14, 5381. [Google Scholar] [CrossRef]
  78. Zhao, N.; Liu, X.J.; Pan, C.F.; Wang, C.Y. The performance of green innovation: From an efficiency perspective. Soc.-Econ. Plan. Sci. 2021, 78, 101062. [Google Scholar] [CrossRef]
  79. Stucki, T.; Woerter, M.; Arvanitis, S.; Peneder, M.; Rammer, C. How different policy instruments affect green product innovation: A differentiated perspective. Energy Policy 2018, 114, 245–261. [Google Scholar] [CrossRef]
  80. Porter, M.E.; Linde, C. Toward a New Conception of the Environment-Competitiveness Relationship. J. Econ. Perspect. 1995, 9, 97–118. [Google Scholar] [CrossRef]
Figure 1. Study area.
Buildings 13 00073 g001
Figure 2. Spatial distribution pattern of green technology innovation efficiency in the Chengdu–Chongqing urban agglomeration. (a) 2011. (b) 2014. (c) 2017. (d) 2019.
Buildings 13 00073 g002
Figure 3. Spatial spillover network structure of green technology innovation efficiency in the Chengdu–Chongqing urban agglomeration. (a) 2011. (b) 2014. (c) 2017. (d) 2019.
Buildings 13 00073 g003
Table 1. Types of interaction between two covariates.
Basis of JudgmentInteraction
q(X1X2) < Min(q(X1), q(X2))Nonlinear attenuation
Min(q(X1), q(X2)) < q(X1X2) < Max(q(X1), q(X2))Single factor nonlinear attenuation
q(X1X2) > Max(q(X1), q(X2))Double factors enhancement
q(X1X2) = q(X1) + q(X2)Independent enhancement
q(X1X2) > q(X1) + q(X2)Nonlinear enhancement
The q value represents the explanatory power of the influencing factors on the efficiency of green technology innovation in the construction industry and the same below.
Table 4. Green technology innovation efficiency of 16 cities in the Chengdu–Chongqing urban agglomeration.
City201120192011–2019
ScoresRankScoresRankAverage ScoresRank
Chengdu0.59051.01320.8072
Zigong0.235150.66450.45812
Luzhou0.32990.59170.47310
Deyang0.320100.418130.47011
Mianyang0.295130.47790.45213
Suining1.02920.61860.7324
Neijiang0.225160.459110.41314
Leshan0.300120.341150.31816
Nanchong0.60141.00340.7095
Meishan1.03510.415140.5019
Yibin0.256140.311160.36515
Guang’an0.313111.05510.7913
Dazhou0.46670.462100.5028
Ya’an0.35880.57180.6576
Ziyang0.57960.435120.6217
Chongqing0.68031.00530.9361
Table 5. Factor detection results of space-time differentiation of green technology innovation efficiency in the Chengdu–Chongqing urban agglomeration.
Factor201120152019
qRankqRankqRank
Industrial scale (X1)0.3960.14100.752
Technical equipment rate (X2)0.4630.5240.2810
Industrial agglomeration degree (X3)0.2880.4850.558
Economic development level (X4)0.4630.5630.714
Scientific and technological innovation level (X5)0.4350.3480.677
Urbanization level (X6)0.520.3290.743
Foreign direct investment (X7)0.3770.4560.686
Environmental regulation (X8)0.2690.720.841
Education level (X9)0.16100.7510.369
Public environmental concern (X10)0.5510.3570.695
Table 6. Interactive detection results of spatial differentiation of green technology innovation efficiency of construction industry.
Factor Interaction201120152019
qTypeqTypeqType
X1 ∩ X40.802DE0.759NE0.781DE
X1 ∩ X60.763DE0.774NE0.872DE
X1 ∩ X70.611DE0.657NE0.939DE
X1 ∩ X80.713NE0.888NE0.931DE
X1 ∩ X100.778DE0.999NE0.873DE
X4 ∩ X60.82DE0.698DE0.939DE
X4 ∩ X70.507DE0.702DE0.786DE
X4 ∩ X80.794NE0.947DE0.994DE
X4 ∩ X100.574DE0.618DE0.901DE
X6 ∩ X70.794DE0.787NE0.831DE
X6 ∩ X80.781NE0.964DE0.888DE
X6 ∩ X100.966DE0.473DE0.756DE
X7 ∩ X80.807NE0.874DE0.992DE
X7 ∩ X100.718DE0.782DE0.768DE
X8 ∩ X100.944NE0.938DE0.916DE
DE: Double enhancement; NE: nonlinear enhancement.
Disclaimer/Publisher’s Note: The statements, opinions and data contained in all publications are solely those of the individual author(s) and contributor(s) and not of MDPI and/or the editor(s). MDPI and/or the editor(s) disclaim responsibility for any injury to people or property resulting from any ideas, methods, instructions or products referred to in the content.

