1. Introduction
Accounting for approximately 40% of total energy consumption and significantly contributing to global warming [
1], buildings are at the core of the European strategy towards a zero-emission and fully decarbonized stock by 2050 [
2]. The European Green Deal and the Renovation Wave further point to the strategic role of buildings in creating jobs, improving security, boosting green technologies, and fostering a circular economy [
3,
4]. The strategy foresees regulatory and financing measures that will at least double the annual energy renovation rate of buildings by 2030 and foster deep energy retrofit [
5]. Within that framework, comprehensive energy and climate policy packages are progressively making the EU energy performance of buildings more efficient [
6]. In particular, the Energy Performance of Buildings Directive recast (2010/31/EU—EPBD [
7]) and its recent revision [
8] comprise important provisions for a long-term improvement of the EU building stock [
9]. Among them is the stipulation that Member States must calculate and establish cost-optimal levels of minimum energy performance requirements for new and existing buildings following the established comparative methodology framework [
10] and related Guidelines [
11].
The EPBD also requires Member States to develop appropriate policies and provide the necessary financing measures to foster the transition to nearly zero-energy buildings (NZEBs) [
12,
13], a status mandatory for all new buildings since 2021 [
14,
15]. The EPBD does not advocate a uniform approach for implementing NZEBs throughout Europe, requiring Member States to draw up national roadmaps that account for the variety of building types and climates [
16,
17,
18,
19].
In this context, the cost-optimal methodology appears very effective both for upgrading the energy performance requirements in force at national level and for assessing the effects of policy measures to achieve the NZEB targets [
20]. A previous study [
12] showed that the majority of Member States seem to adopt the cost-optimal approach in appropriate ways and use it to define NZEB requirements.
However, since the release of the cost-optimal methodology, different debates have arisen around the approach [
21]. Reference building definition [
22], energy performance assessment and optimization variables [
23,
24], uncertainty, and sensitivity analysis [
25] are among the most commonly discussed topics in the literature. Recently, the importance of including the indoor environmental quality and the interactions between the building, its systems, and its occupants became evident as a way to complement energy efficiency, as conceived by the cost benefit analysis [
26].
Although it has been pointed out that the methodology has mainly spread theoretically at government and scientific levels, but has not yet disseminated sufficiently among professionals [
27], its introduction unquestionably signifies an important milestone towards the renovation of the existing building stock and a substantial transformation towards a zero-carbon society.
From an early assessment of the cost-optimal methodology, a heterogeneous situation was evident in European countries, as each building type and climate presented varying cost-optimal levels [
21]. Regardless of comparison issues among cost-optimal levels and a non-uniform application across Europe [
28], it is generally agreed that it represents an efficient and complete decision-making tool for building design that considers both energy and economic evaluations. Several literature studies focus on a specific climate or building type [
28,
29,
30,
31,
32,
33,
34,
35,
36,
37,
38,
39,
40,
41,
42,
43,
44], but a thorough overview of the cost-optimal methodology is still missing and undoubtedly necessary.
Accordingly, this paper aims to provide a comprehensive review of the implementation of the cost-optimal methodology in Member States to assess its progress, its strengths and weaknesses, and possible future developments in the light of the recent policy developments. To accomplish this goal, the most recent cost-optimal reports (link provided in the
Supplementary material section) submitted by Member States have been considered as data sources for this policy analysis [
45].
After describing the methodology (
Section 1.1), this paper reports the criteria adopted to assess the cost-optimal reports (
Section 2), and it provides the main assessment results in
Section 3. Discussion and conclusions are presented in
Section 4 and
Section 5, respectively.
1.1. The Cost-Optimal Methodology
The calculation framework of cost-optimal levels to be used by Member States to benchmark their building standards was defined in 2012 by the European Commission [
10]. It is based on the principle of the cost-benefit analysis, and it is calculated from two economic perspectives: the financial and the macroeconomic, which refer to different discount rates (lower in the macroeconomic one) and cost items [
46]. While the financial perspective includes taxes, the macroeconomic perspective considers greenhouse gas emission costs [
47]. The calculation approach can be summarized in the following steps [
6]:
Establishment of reference buildings. Real or virtual buildings representing the building stock must be selected. Member States must define at least three categories, for both new and existing buildings (residential single-family, residential multi-family, offices). According to [
10] (Annex I), Member States must also define reference buildings for other building categories, for which specific energy performance requirements exist. For new buildings, the standard energy performance in force can be assumed as base case. For the existing stock, at least two reference buildings must be considered, which can be established on the basis of size, age, cost, structure, construction material, use pattern, or climatic zone.
Identification of energy efficiency and renewable measures. These must be implemented in new or existing buildings, including different packages of measures or measures of different levels (e.g., from lower to higher insulation levels), which must respect the EU and national legislation. The impact of applying packages of measures on reference buildings (starting with the current requirements and beyond, including the NZEB level) should be estimated in the cost-optimal calculation in terms of energy and financial performance.
Calculation of the (net) primary energy consumption. The energy performance calculation must be based on the current national or CEN standard methodologies for each selected building variant. Framework conditions for the calculations must be defined in terms of climate data, performance of energy systems, primary energy factors, and indoor air quality.
Calculation of the global cost. The net present value (NPV) should be used at each step, based on 30 years for residential and 20 years for non-residential buildings. The included cost categories are: initial investment costs, running costs (i.e., energy, operational, maintenance, replacement costs), disposal costs, final value, and the cost associated with CO
2 emissions (only for the macroeconomic perspective). For the assessment of the financial performance (global costs) of the chosen combinations of packages, the European Standards EN 15459 is suggested as reference [
48]. This method results in a discounted value of all costs (present and future) for a defined period of calculation. The global cost formula can be written as in Equation (1)):
where C
G (τ) corresponds to the global cost referred to starting year τ
0 C
I is the initial investment cost; C
a,i(j) is the annual cost for component j at the year i (including running costs and replacement costs);R
d(i) is the discount rate for year i;V
f,τ(j) is the final value of the component j at the end of the calculation period (referring to the starting year τ
0).Identification of cost-optimal levels. This should be expressed in primary energy consumption (in kWh/m
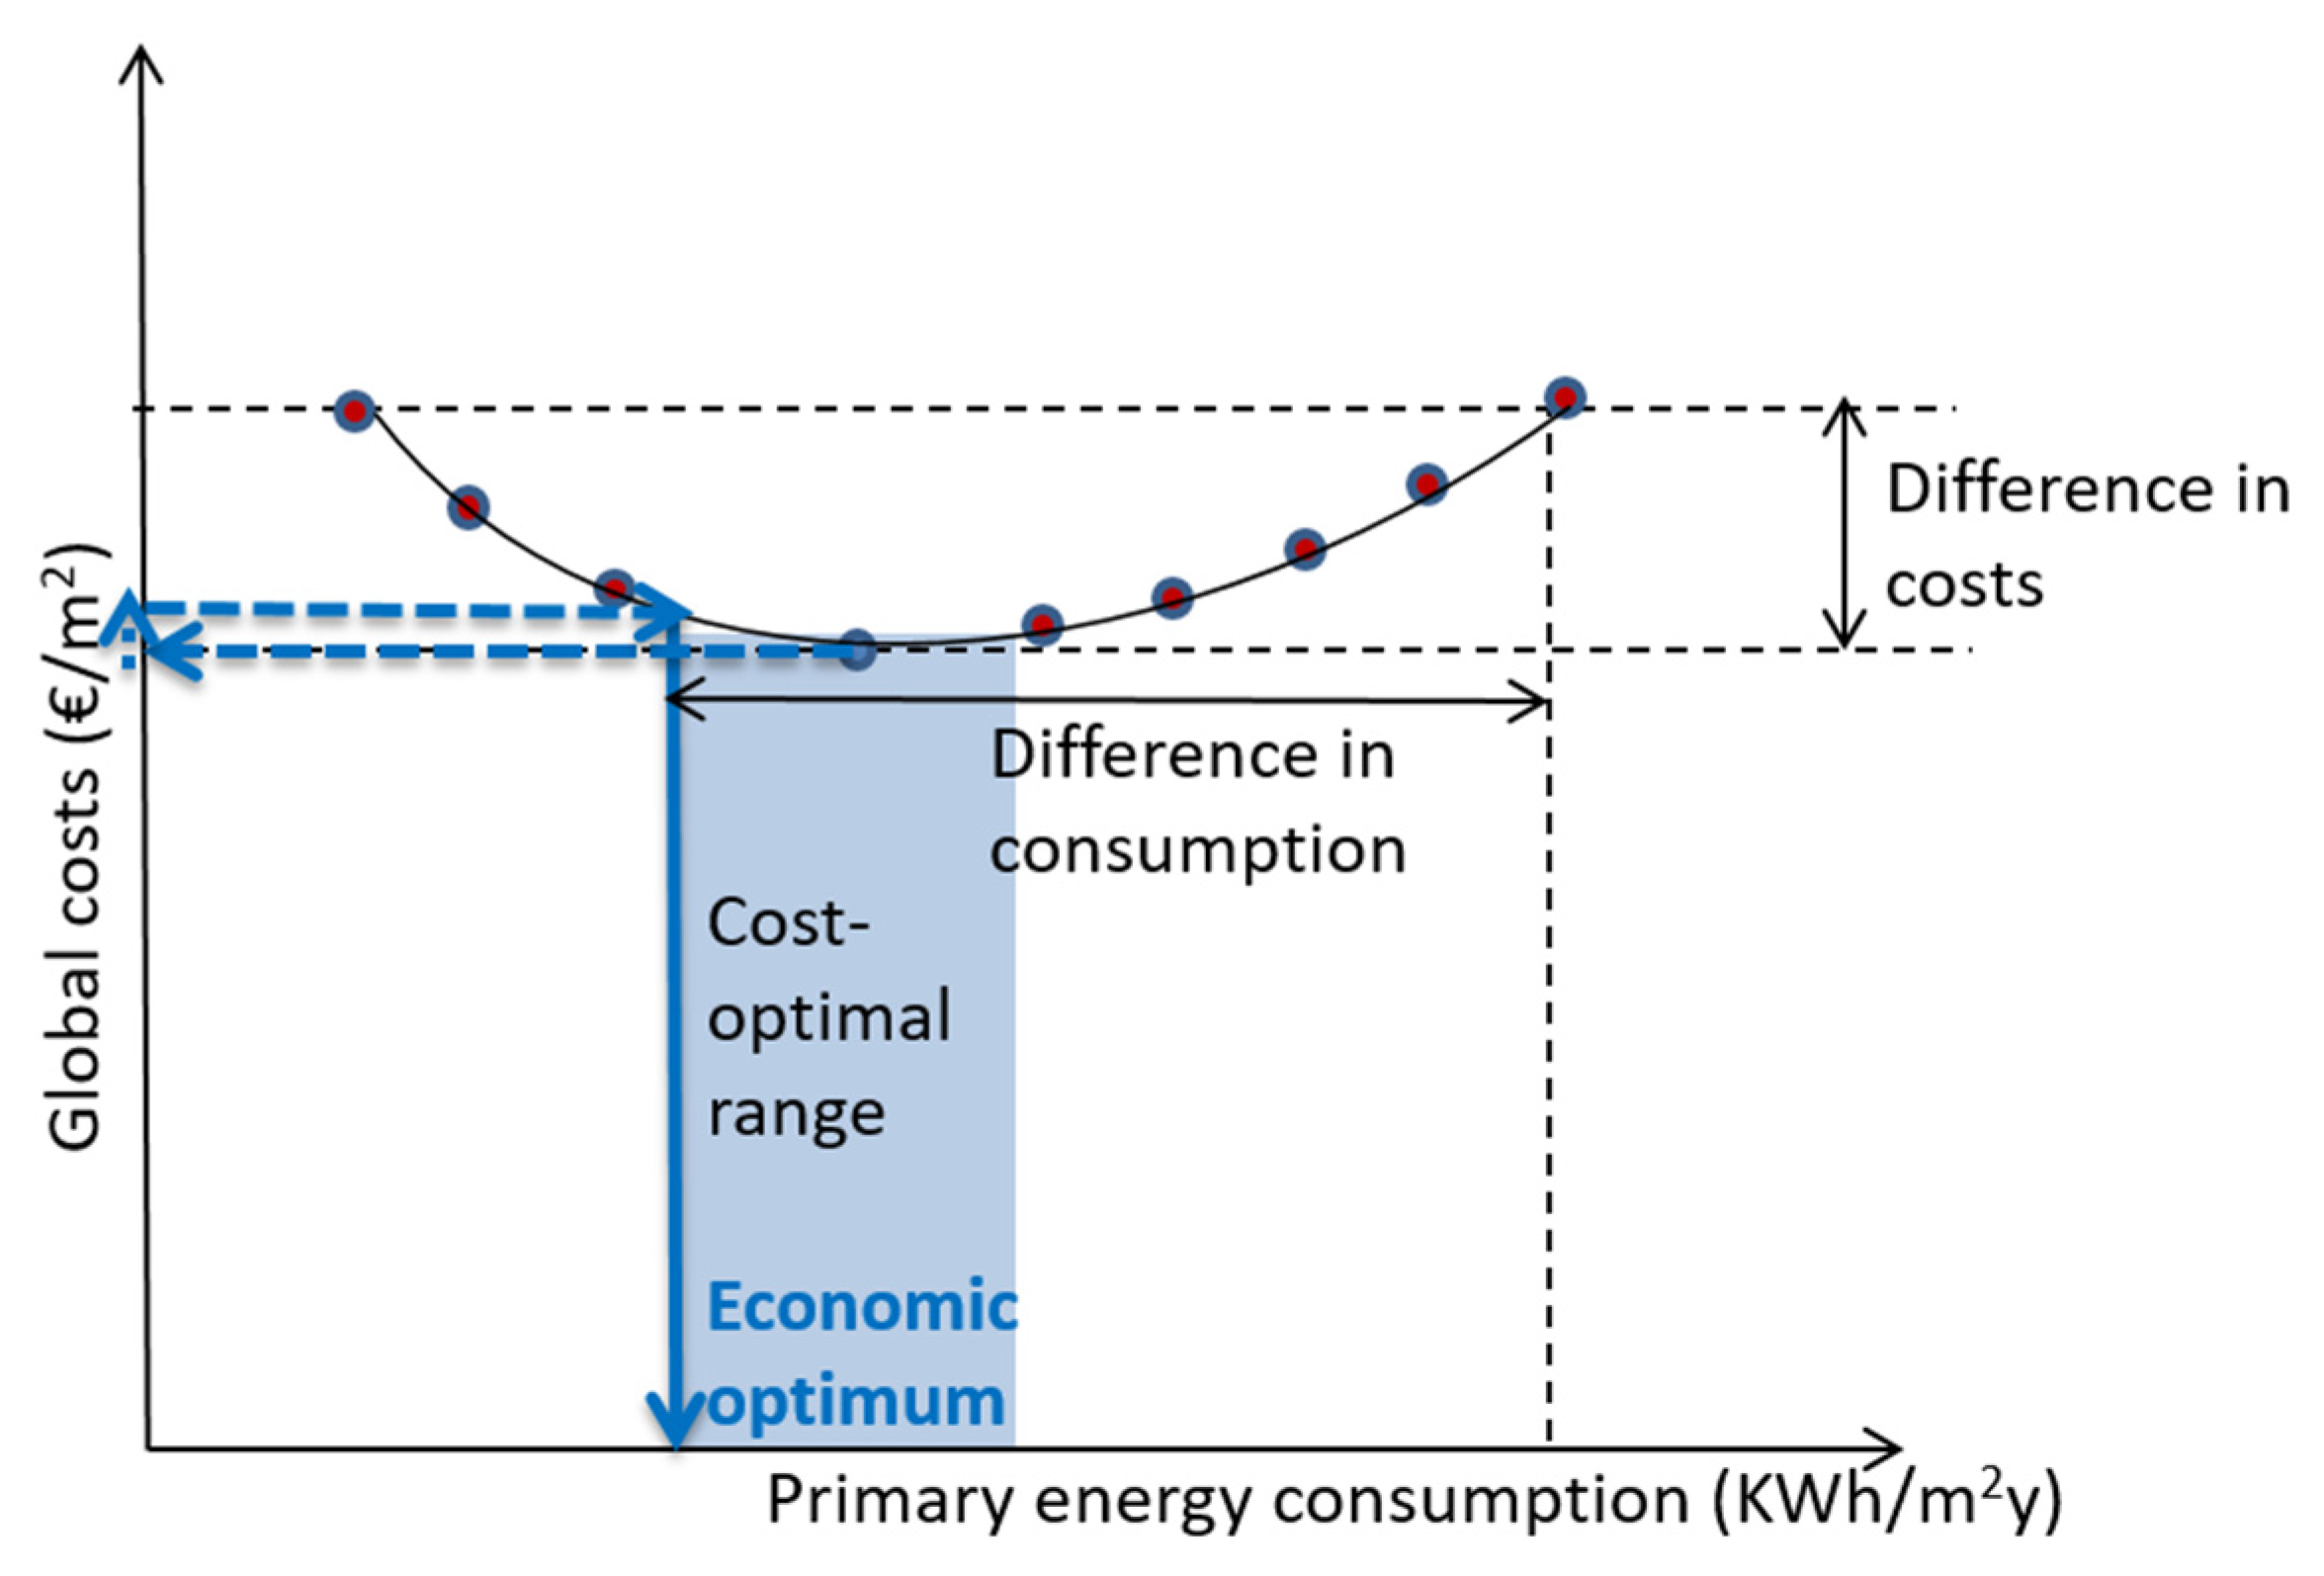
2 per year) for each reference building. The cost-optimal configuration presents the lowest costs maintaining a high performance. It can be identified in the lower part of the curve that reports global costs (Eur/m
2) and energy consumption (kWh/m
2y) (
Figure 1).
Evaluation of the shortfall against current minimum energy performance requirements. If the difference is higher than 15%, Member States must justify the gap or define a plan to reduce it. The national benchmark related to the final outcome of the cost-optimal calculations can be calculated for a financial or a macroeconomic perspective.
Sensitivity analysis can help in evaluating the robustness of key parameters, such as discount/interest rate, the annual increase in energy prices, and primary energy factors associated with different fuels.
Relevant additional information is given in the official Guidelines [
11], as stated in Annex III [
7]. They give methods for establishing reference building types and sub-categories, reducing package combinations, gathering cost data, and deriving cost-optimal levels. They provide a list of CEN standards, cost categorization, indications for sensitivity analysis, equations for the calculation of shortfalls against current requirements, indoor air quality, and comfort. They also clarify the full cost approach, calculation period, replacement, energy and disposal costs, taxation, subsidies, and feed-in tariffs.
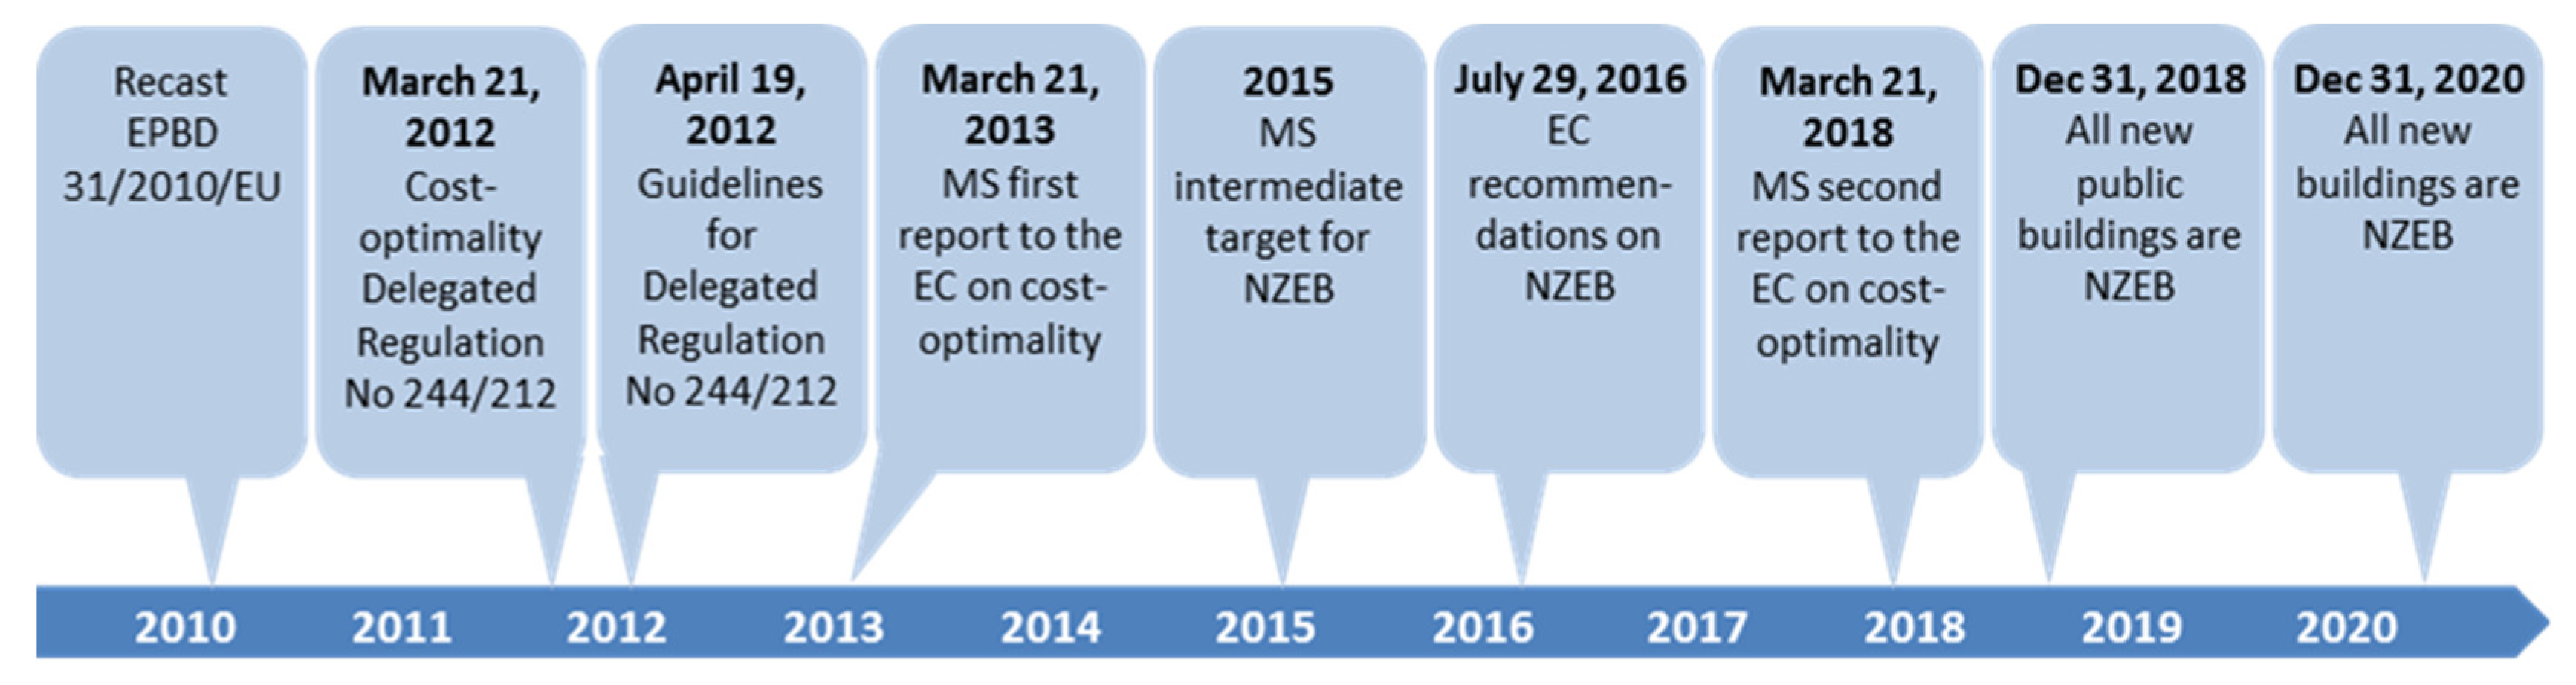
Figure 2 shows the timeline of EPBD recast to implement cost-optimal calculations and NZEB requirements.
In line with the EPBD timeline (
Figure 2), the first cost-optimal calculations were due by 2013. According to the first assessment of 2015 [
28], apart from a few cases, the overall picture seemed rather positive in terms of compliance with the EPBD requirements. Although reports were mainly assessed as plausible, energy performance levels showed space for potential improvement towards more stringent requirements to reduce primary energy use and life-cycle costs. A joint, consistent, and comparable level of ambition was desirable after the first assessment [
49]. The second cost-optimal reports were submitted in 2020. Accordingly, this paper reviews the Member States’ progress in reaching cost-optimal levels of minimum energy performance requirements.
2. Methodology
The methods of this cost-optimal implementation review were divided into the following main steps. In the first step, reports were collected and officially translated. Then, the template for data collection was developed and the reports analyzed (total lengths: around 6000 pages of reports and 4000 pages of annexes). Clarifications and additional information were often requested from Member States in cases of missing or non-extractable information, frequently due to unclear translations, units, tables, figures or explained methodology.
As detailed in
Section 1.1, the cost-optimal methodology can be divided into different steps, to which the reference categories of
Table 1 correspond. The key assessed topics developed to collect data and information for each reference category, assess the cost-optimal calculations, and guide the report evaluation are also reported in
Table 1.
The methodology included the analysis and comparison of key input parameters (discount rate, energy prices, annual increase in energy prices) both for residential and non-residential buildings. Then, the cost-optimal levels were derived in terms of primary energy consumptions and global costs. Gaps between current requirements and cost-optimal levels were also checked, both in terms of primary energy and U-value of building elements. A comparison with previously cost-optimal reports was also made. Finally, an analysis of the conformity with the common methodology as well as of the plausibility of the input parameters and calculated cost-optimal levels was carried out to verify the calculation compliance with the cost-optimal framework based on the policy requirements [
6,
7]. The most recent cost-optimal reports are publicly available [
45]. This review takes into account 30 cost-optimal reports, which were delivered by: Austria (AT), Belgium-Brussels (BEbru), Belgium-Flanders (BEfla), Belgium-Wallonia (BEwal), Cyprus (CY), Czech Republic (CZ), Germany (DE), Denmark (DK), Estonia (EE), Greece (EL), Spain (ES), Finland (FI), France (FR), Hungary (HU), Ireland (IE), Italy (IT), Lithuania (LT), Latvia (LV), Luxembourg (LU), Malta (MT), the Netherlands (NL), Poland (PL), Portugal (PT), Romania (RO), Sweden (SE), Slovenia (SI), Slovakia (SK), and the United Kingdom (UK).
3. Results
The results obtained are discussed in the following sections, as follows:
Section 3.1: analysis and comparison of key input parameters (discount rate, energy prices for both residential and non-residential buildings, annual increase in energy prices for both residential and non-residential buildings).
Section 3.2: analysis of cost-optimal levels (primary energy consumption and global costs).
Section 3.3: comparison with first cost-optimal levels (2013) and consolidated version.
Section 3.4: gaps between current requirements and cost-optimal levels.
3.1. Input Parameters Analysis and Comparison
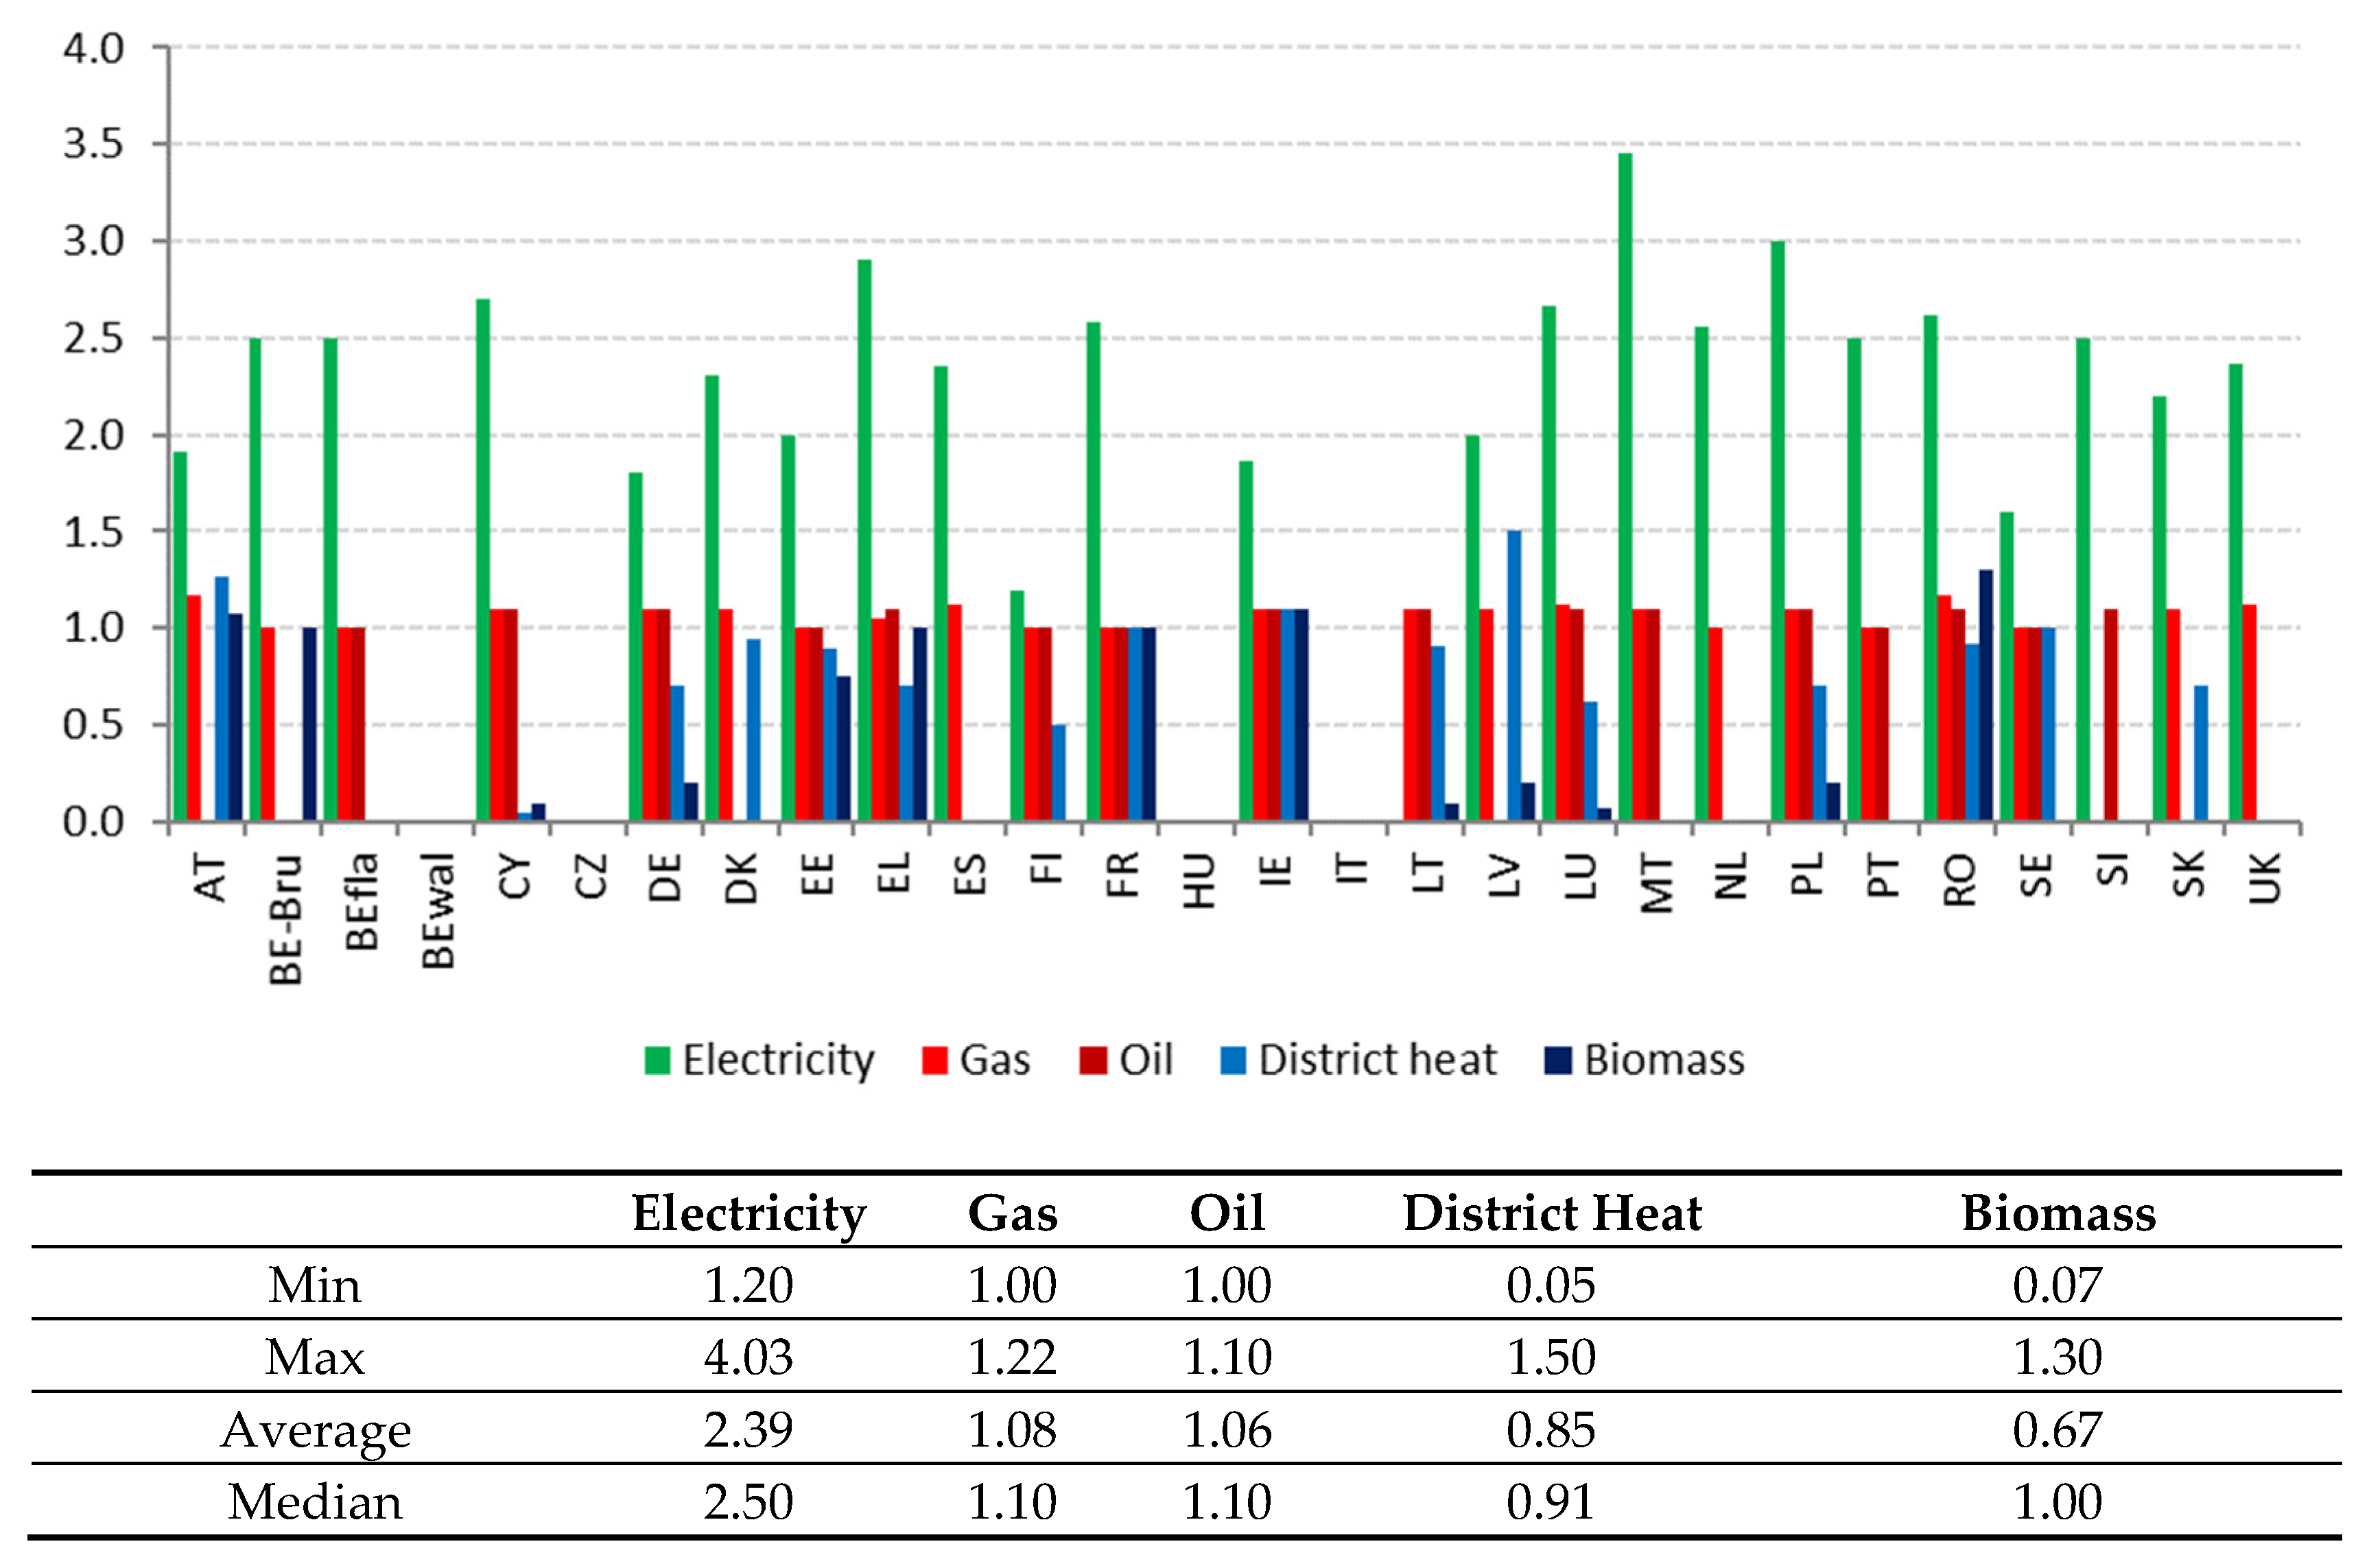
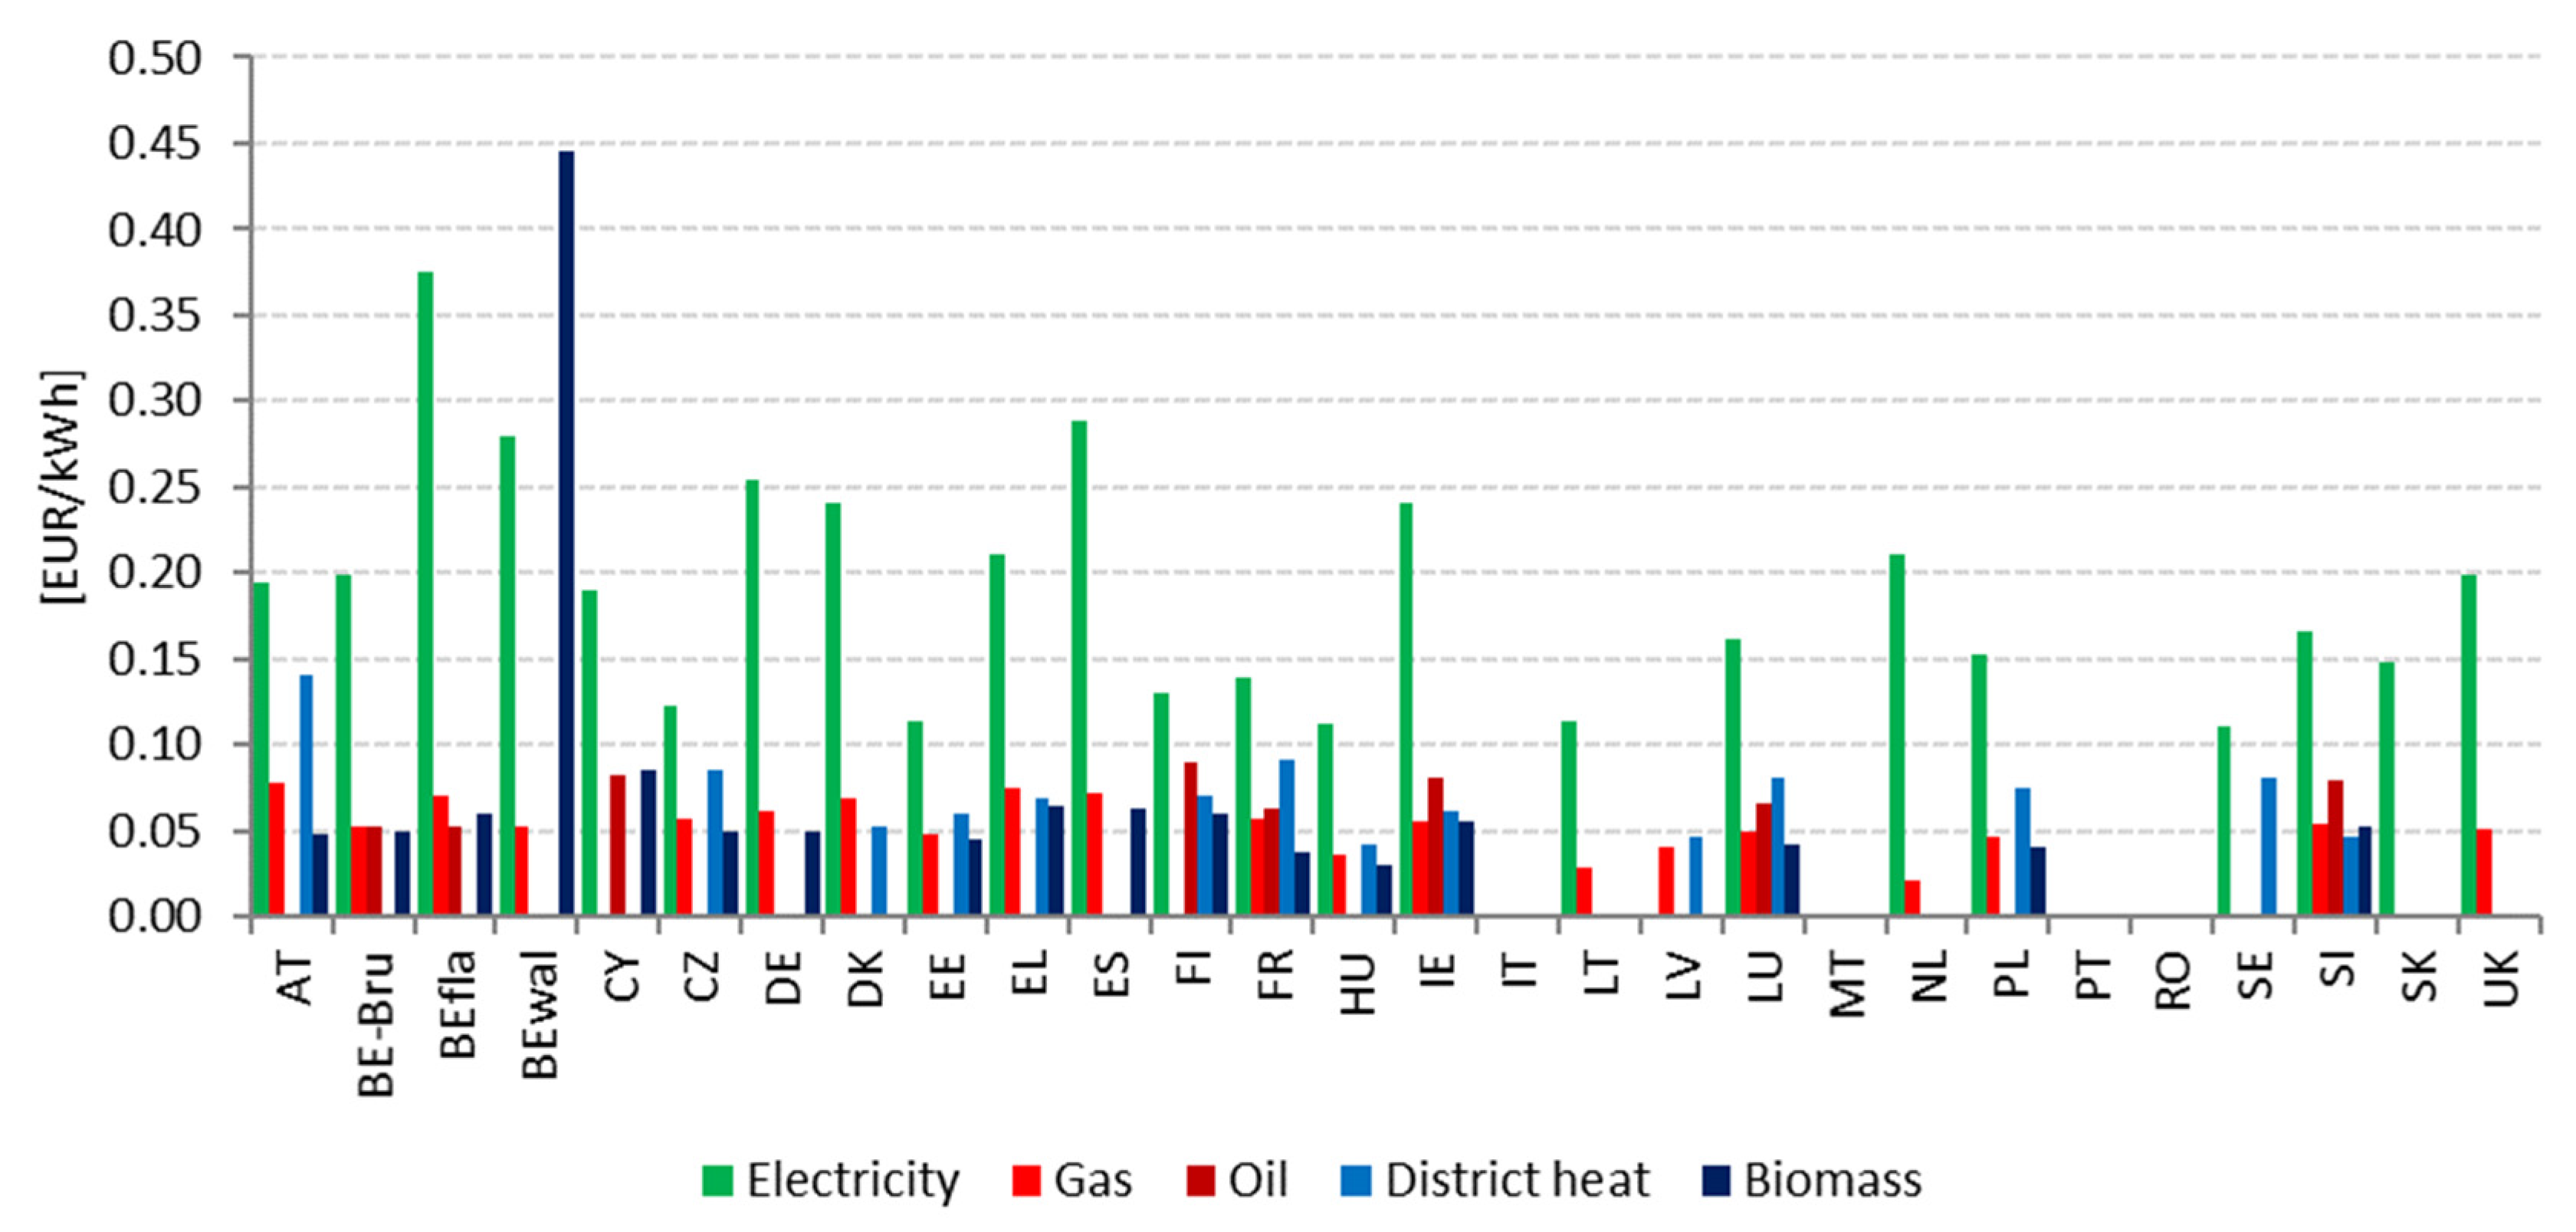
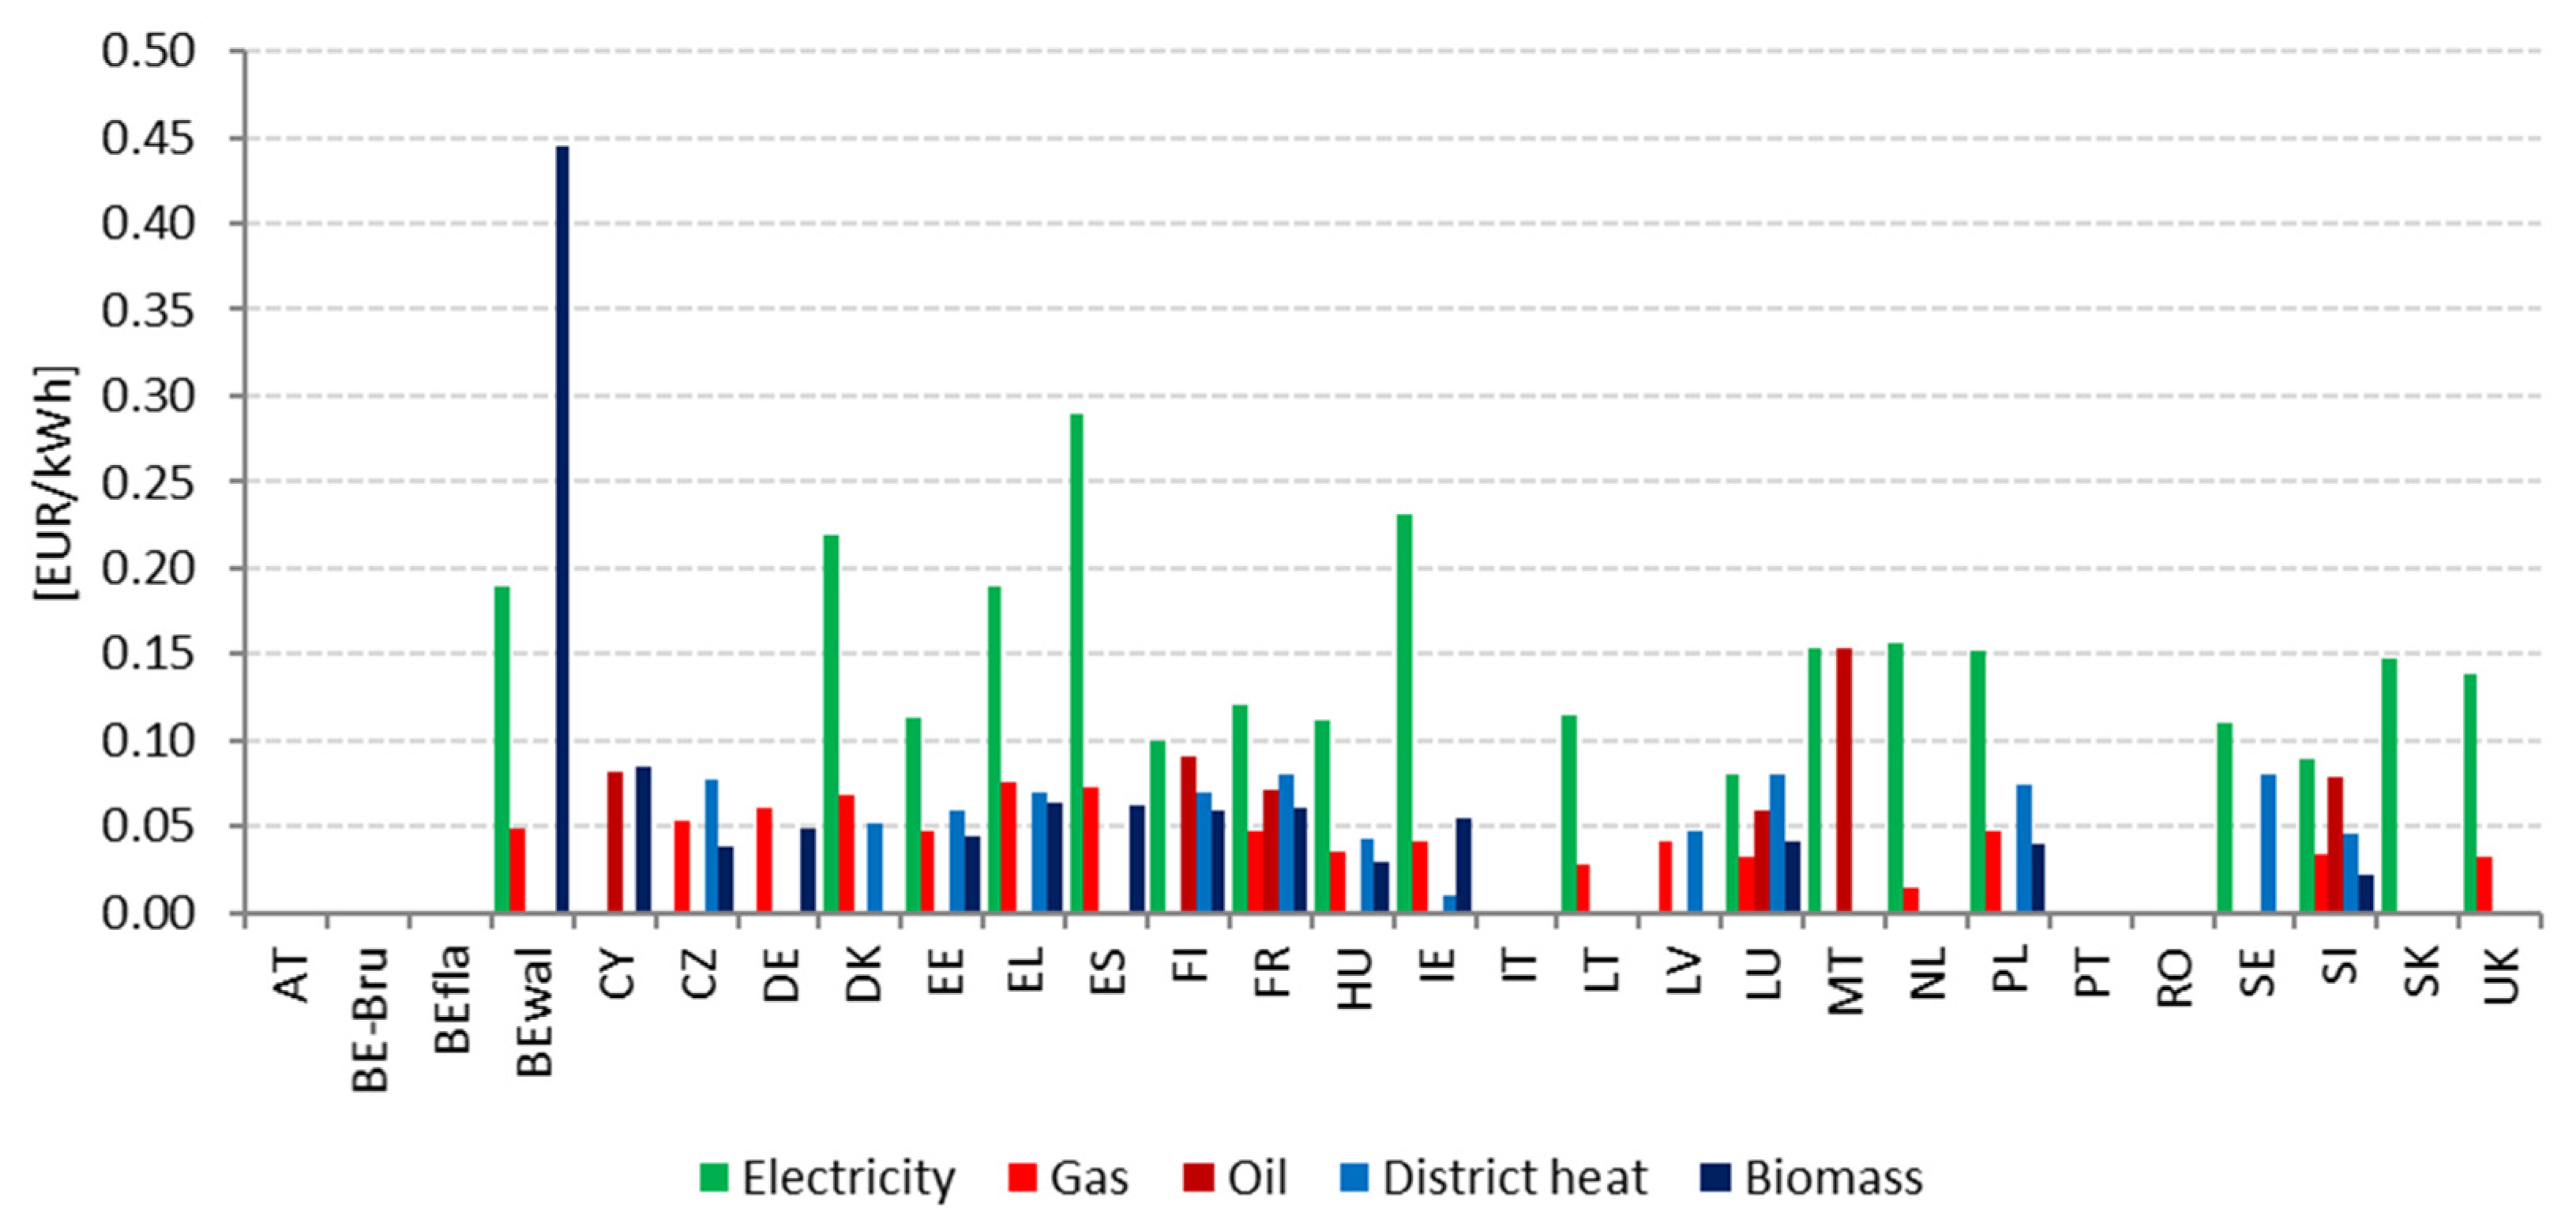
The applied primary energy factors (PEF), the discount rate, the energy prices, and their development over the calculation period have significant impact on the outputs of the cost-optimal calculations. Under the EPBD framework, Member States can adapt them to their context.
Figure 3 shows and compares their choices, and provides some key statistics.
Regarding the Primary Energy Factors applied for the main energy fuels (
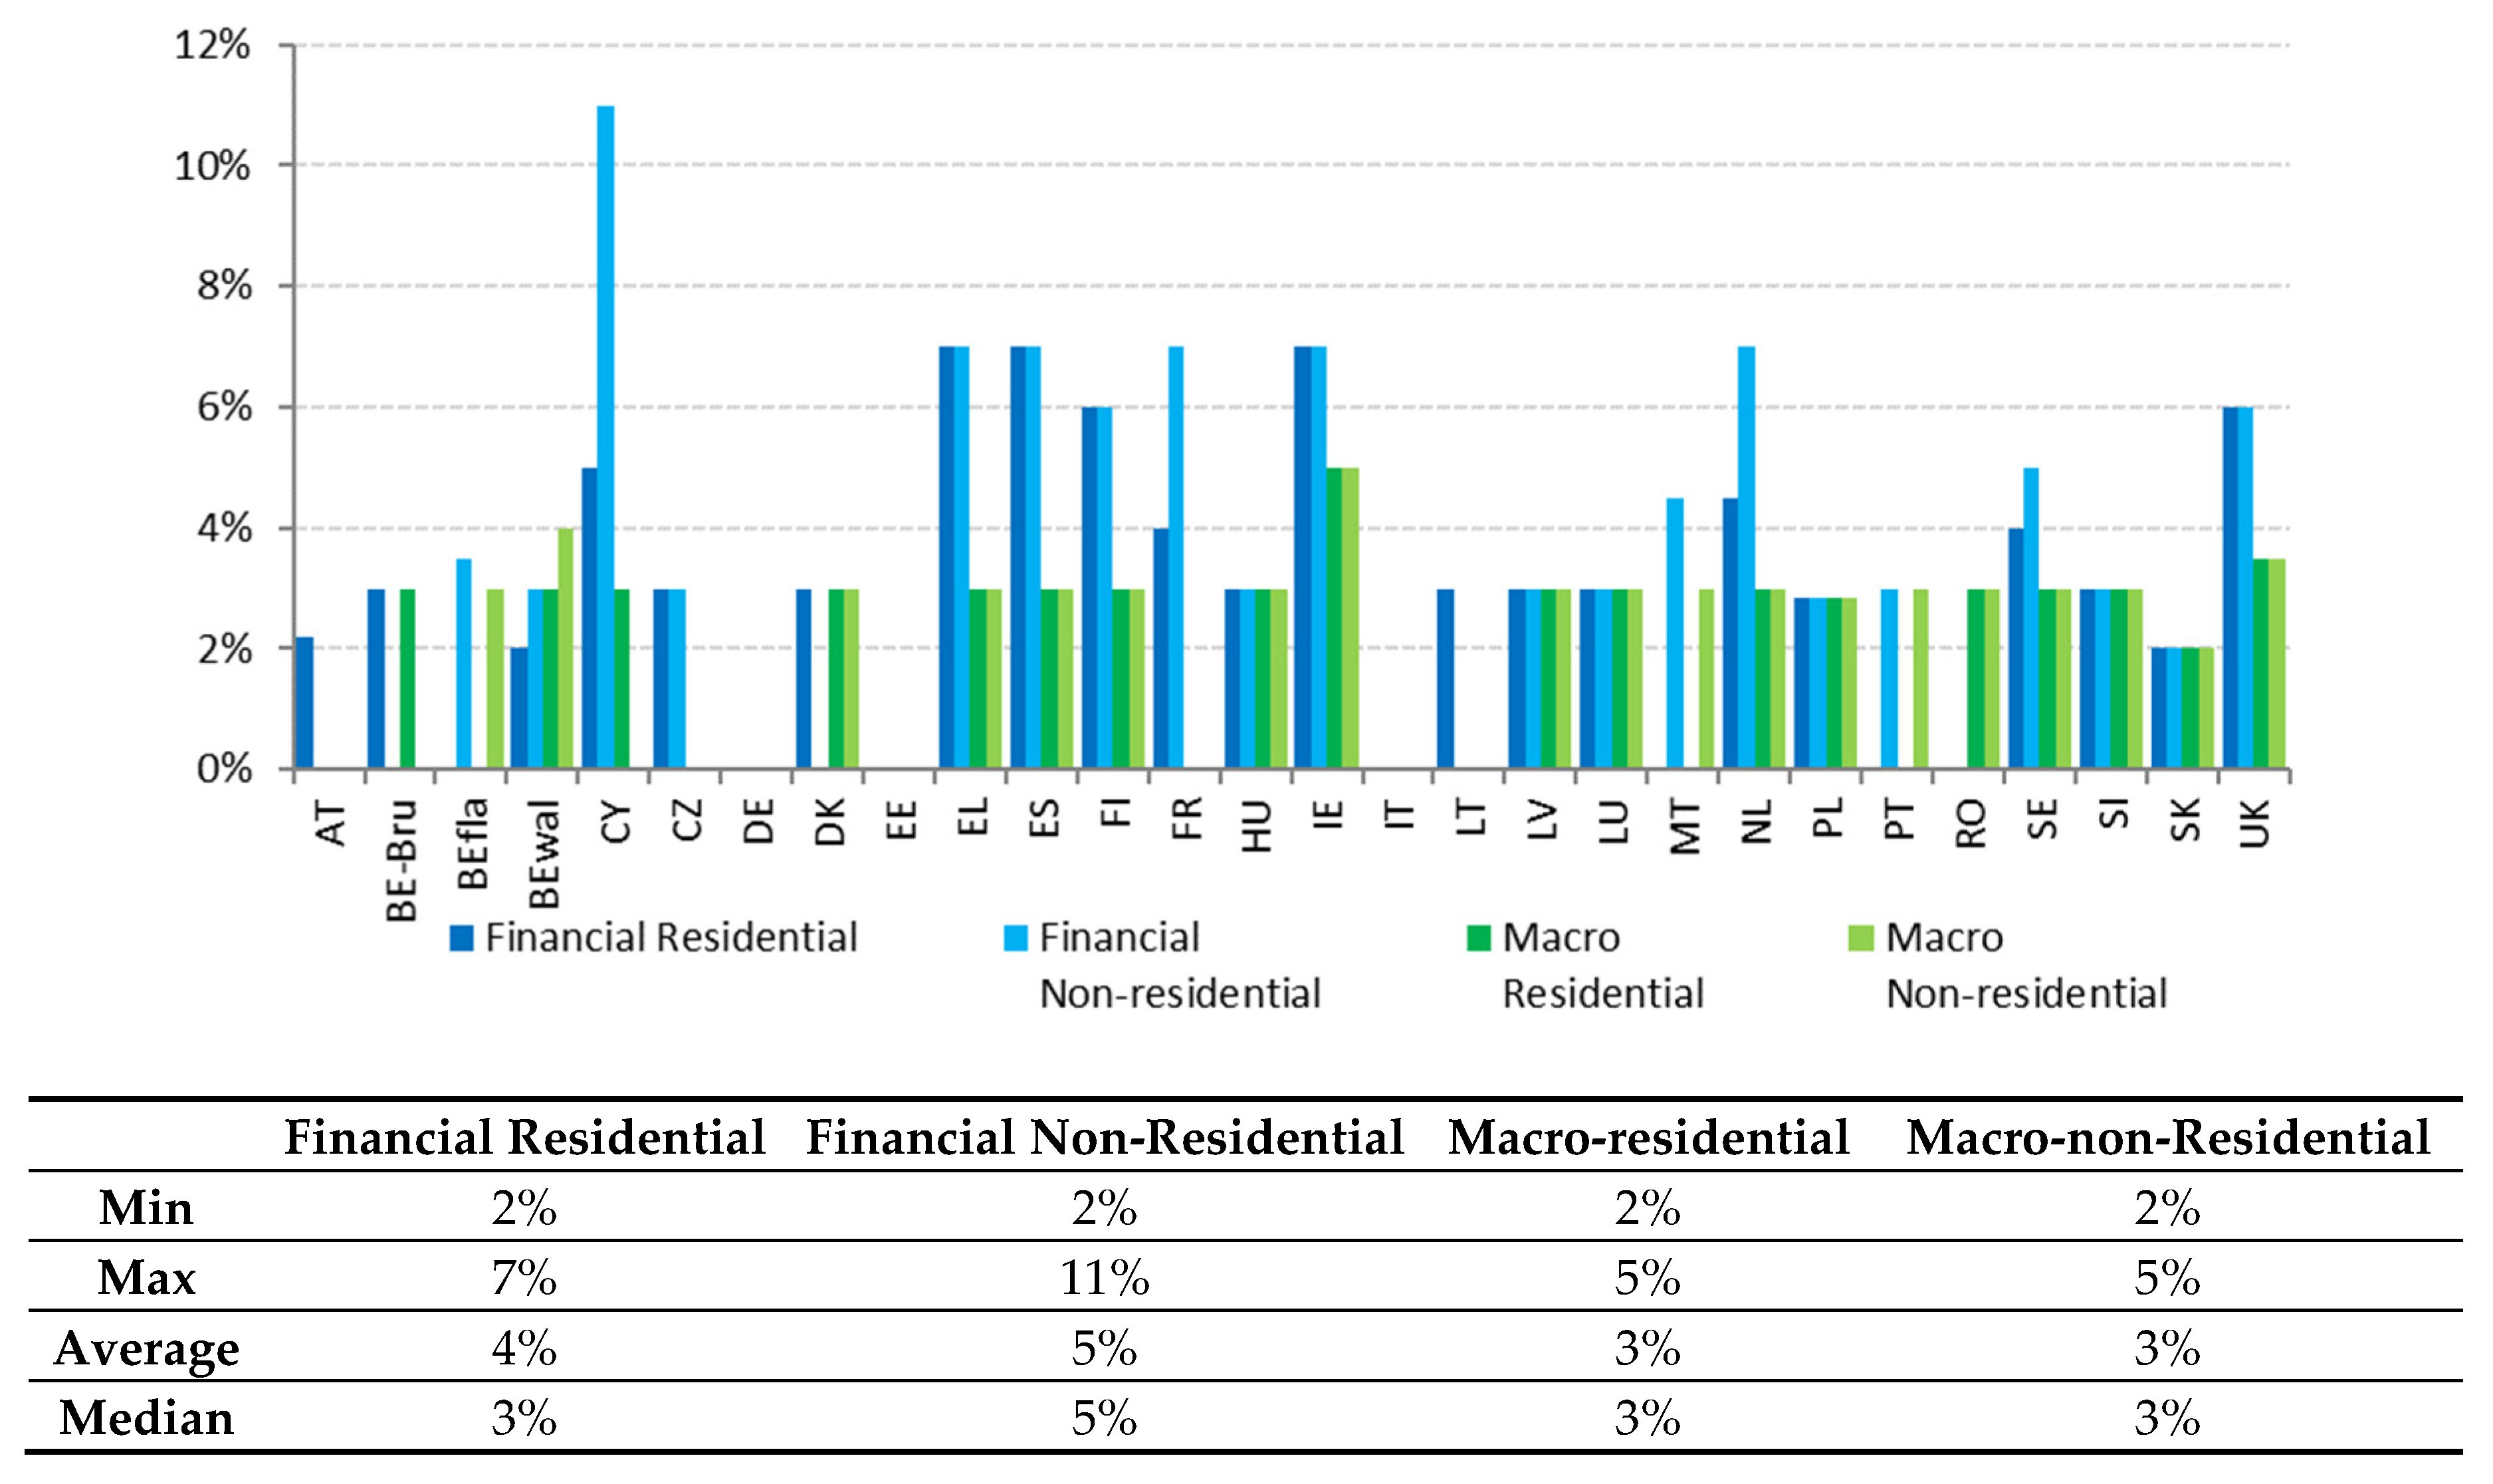
Figure 3), the main differences refer to electricity, with a maximum of 3.5 (Malta) and a minimum of 1.2 (Finland). We also observed good variation for biomass, which some Member States (Cyprus, Germany, Lithuania, Latvia, Luxembourg, and Poland) considered almost fully renewable (PEF close to zero), and some others (Austria, Estonia, Greece, France, Ireland, Romania) assimilated into fossil fuels (PEF close to 1). Discount rates (DR) are reported in
Figure 4.
As shown in
Figure 4, almost all Member States (with a few exceptions) made the same choices for the macro-economic perspective (DR = 3%), following the indication of the official Guidelines [
11]. The picture for the financial perspective is more heterogeneous, with an average of 4% for the residential and 5% of the non-residential sector.
The energy prices and the annual increase in energy price applied by Member States for residential and non-residential building types are shown in
Figure 5 and
Figure 6. Minimum, maximum, average, and median values are reported for both residential and non-residential sectors in
Table 2 and
Table 3.
The figures demonstrate that the divergences are not as relevant for energy prices. Only a few cases (e.g., Flanders, Belgium for electricity and Wallonia, Belgium for biomass) referred to values not close to the averages.
The analysis of the annual increase in energy prices (
Figure 6,
Table 3) showed that the average of the Member States’ values for electricity was closer than gas to the indication of the European Commission (For the estimation of fuels and electricity price development trends, the Commission reference data to Member States:
https://ec.europa.eu/energy/en/data-analysis/market-analysis,
https://ec.europa.eu/energy/en/news/reference-scenario-energy, accessed on 10 June 2022) (respectively 1.4% and 2.8%). However the deviation is quite high for all energy vectors, especially for electricity in the residential sector. For instance, here, Brussels applied only 0.2% against 5.4% for the Netherlands.
3.2. Cost-Optimal Level Assessment
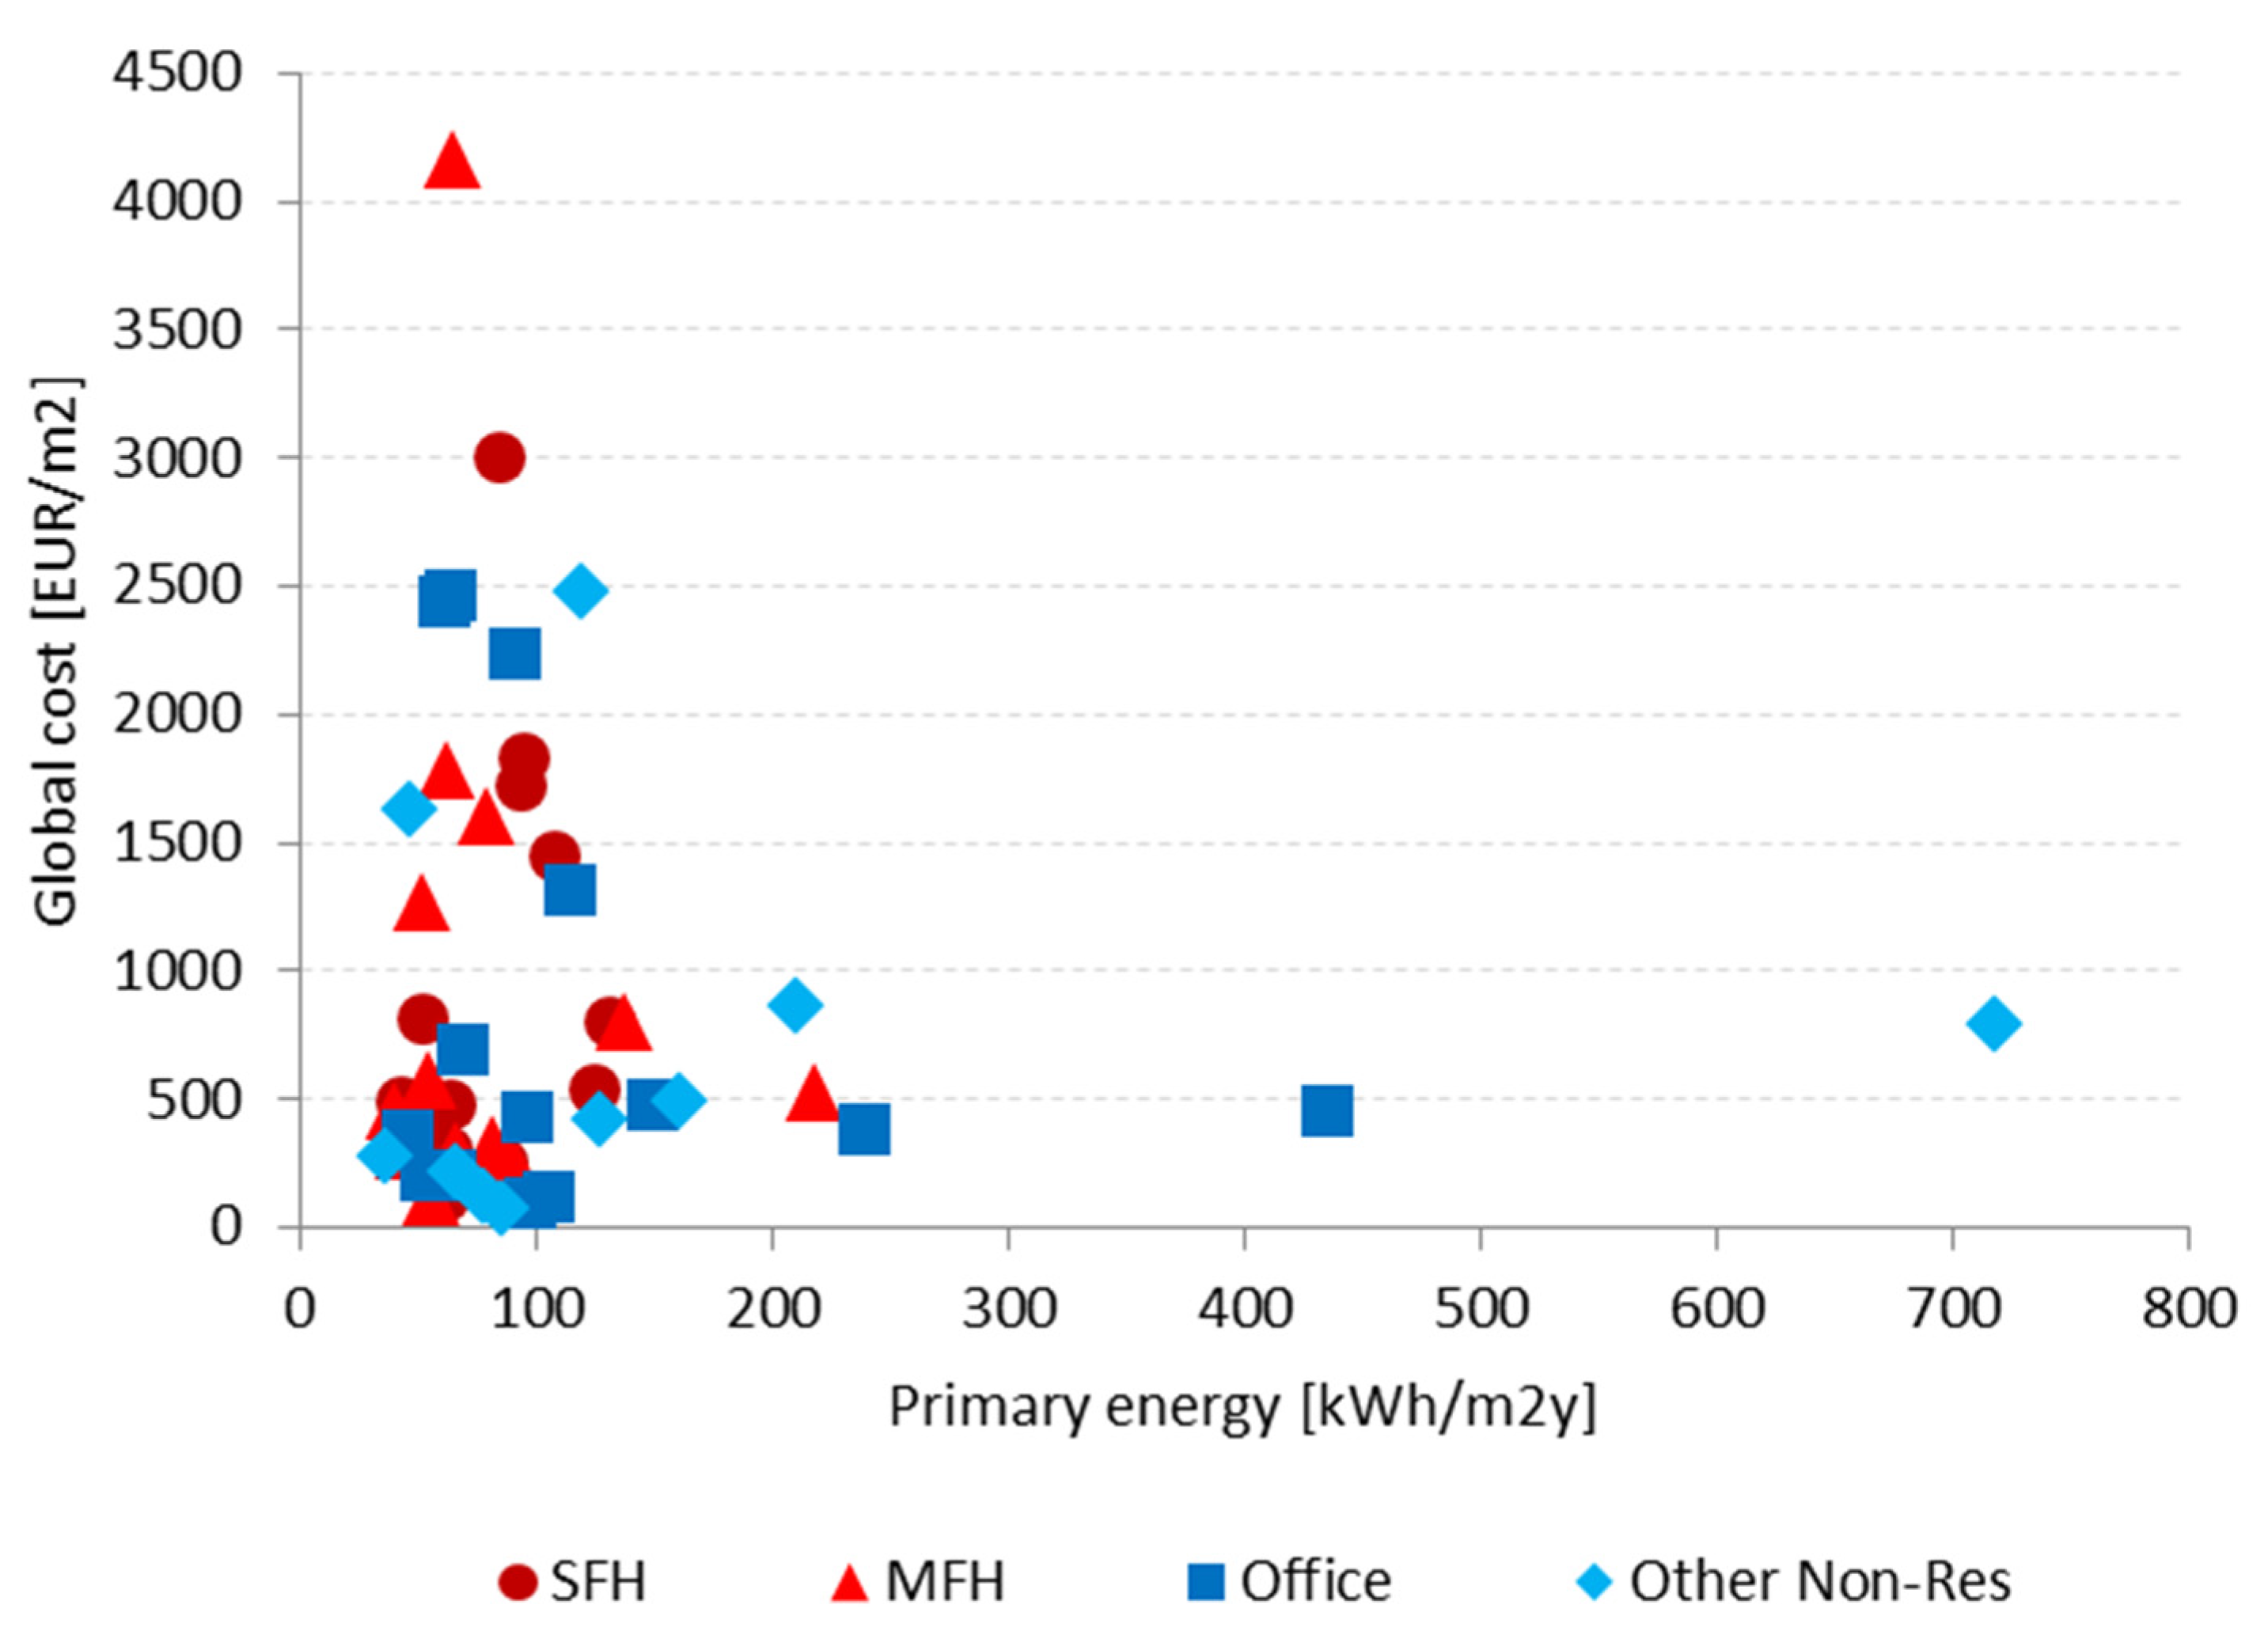
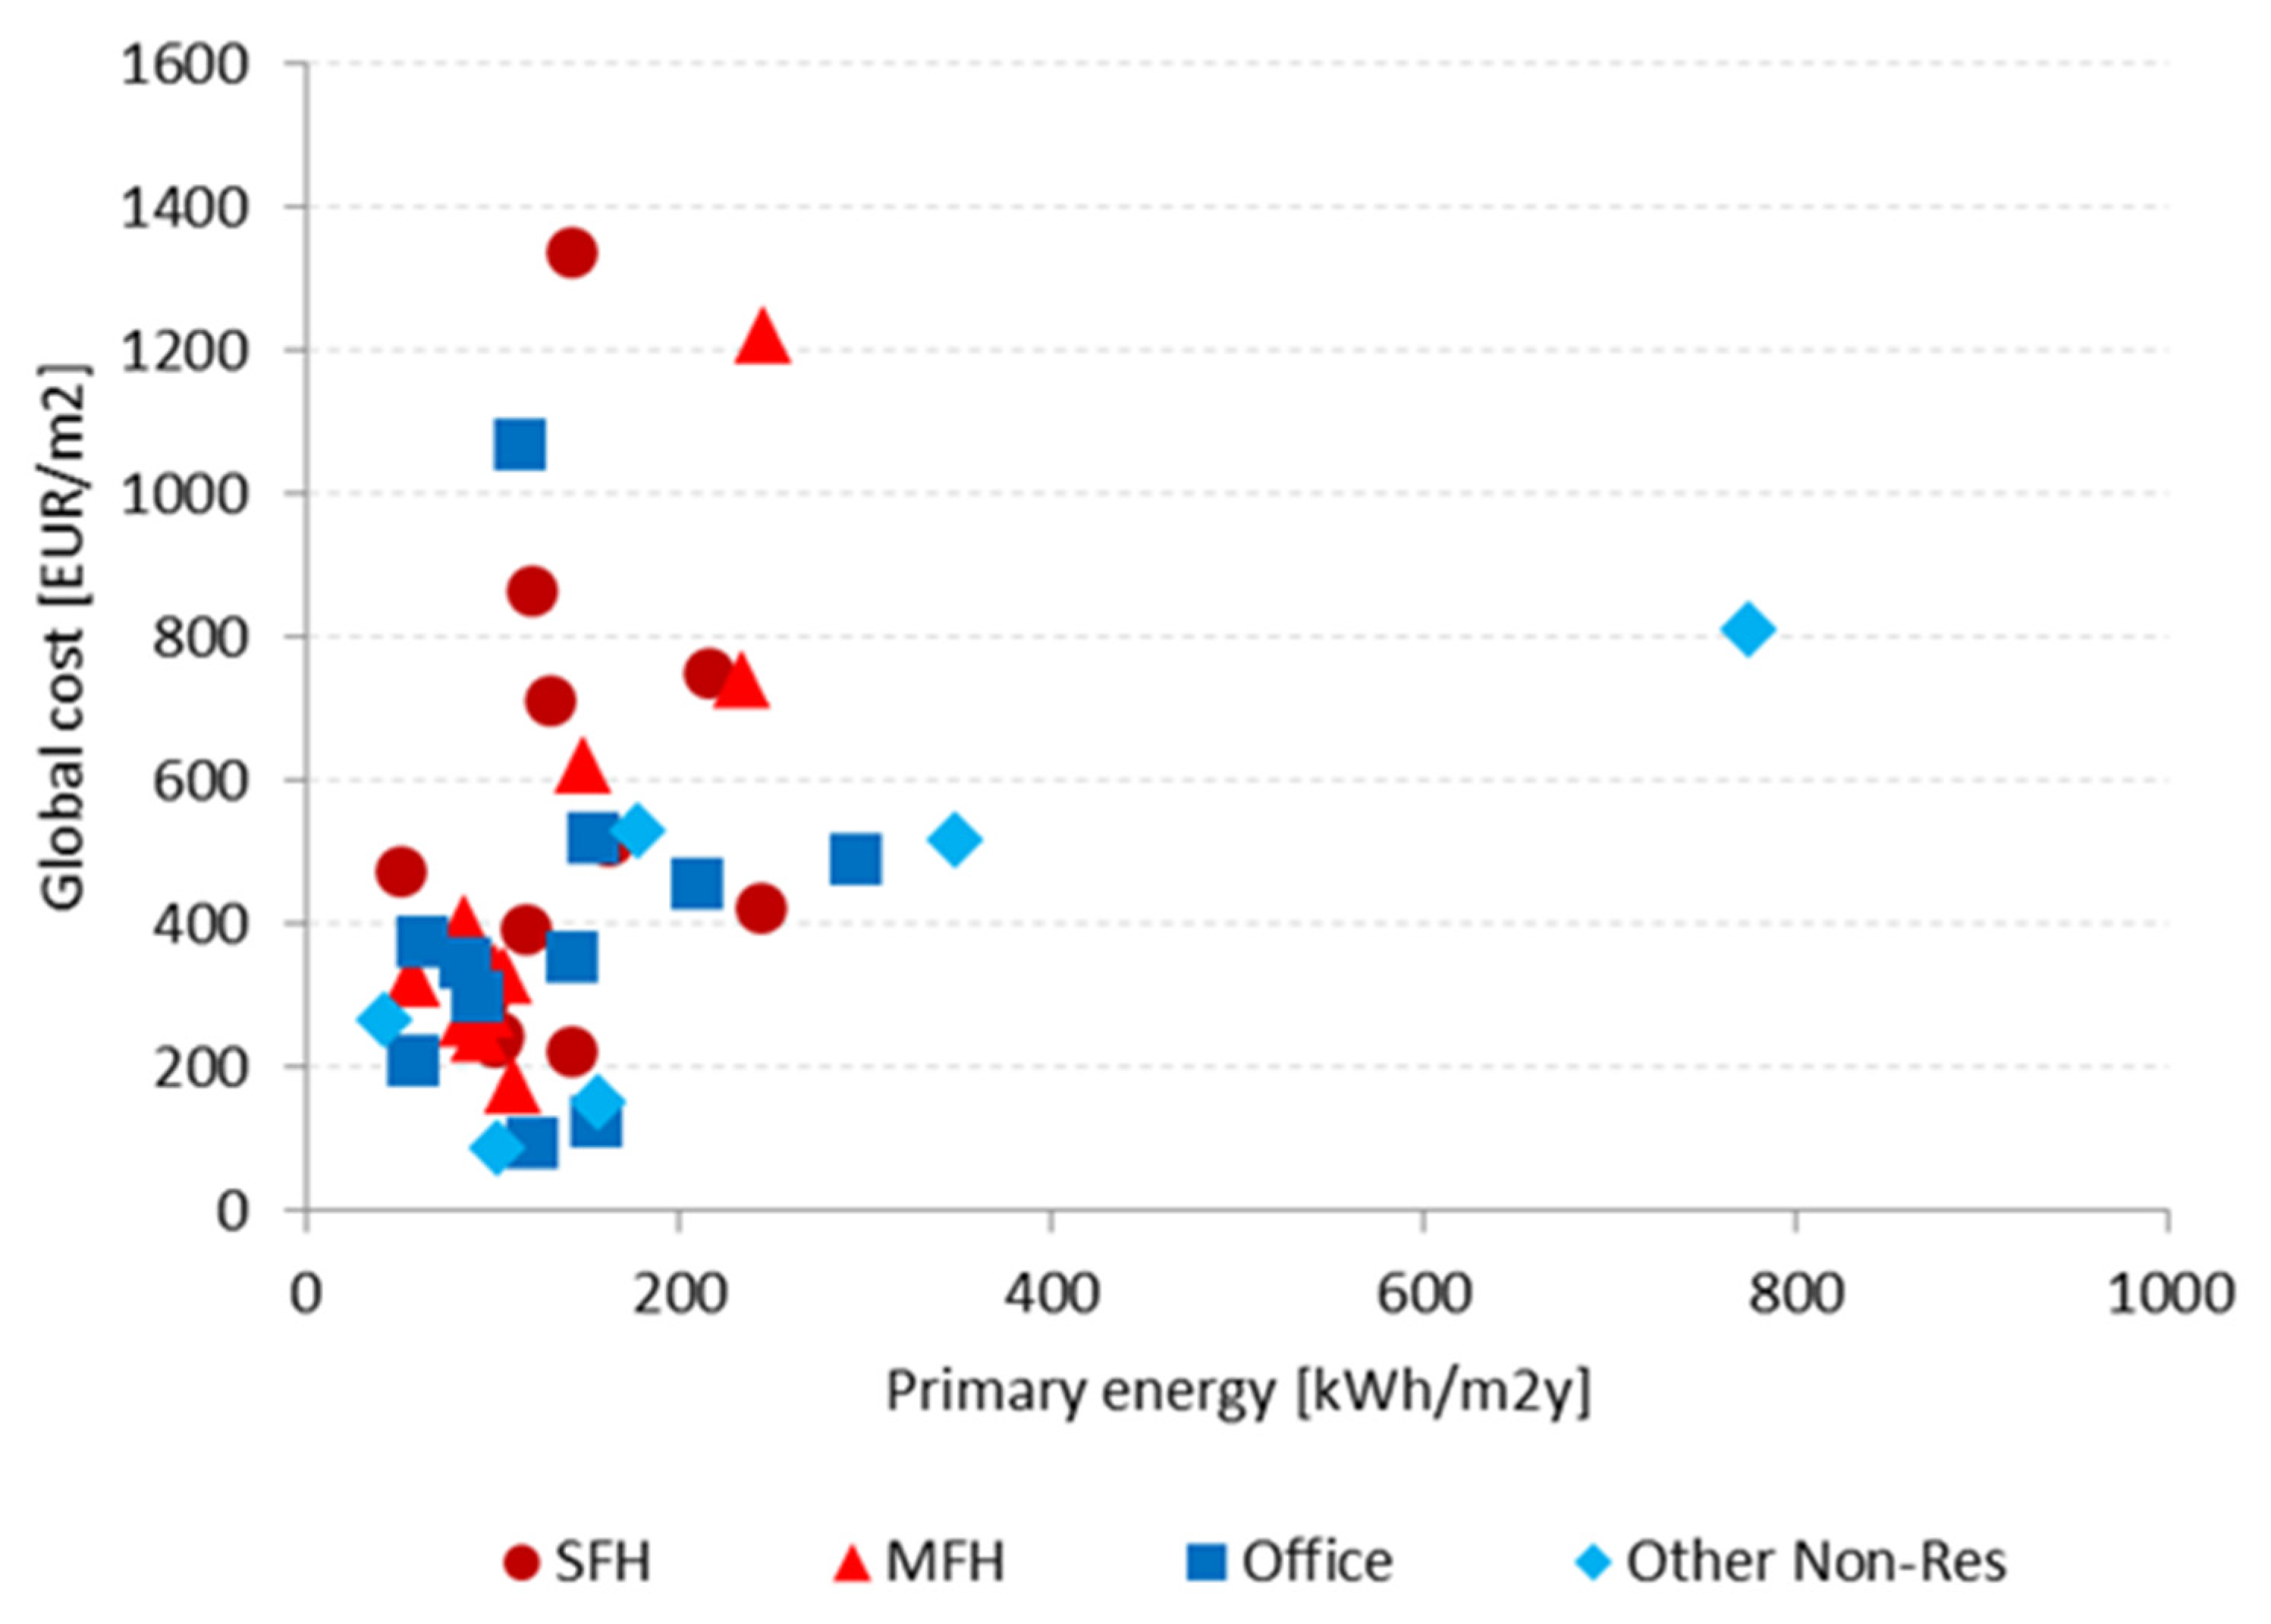
From the reports analyzed, it was not possible to extract all the cost-optimal levels for all Member States, as half of them did not derive them in a clear and complete way. Plotting the values collected in the primary energy/global cost domain (
Figure 7 and
Figure 8), an overall picture was obtained for new and existing buildings. The values pertain to single family houses (SFH), multi-family houses (MFH), and offices and other non-residential (N-R) buildings. The latter is the least-covered category, for which Member States are free to select the reference type. In some cases, these results refer to a particular type (often an educational building), in others to an average among different building types (e.g., school, commercial and hospital). For this reason, the comparison between countries cannot be fully consistent.
For new buildings, the majority of cost-optimal points fell between 50 and 100 kWh/m2y, with an average of 80 kWh/m2y for the residential sector and 140 kWh/m2y for the non-residential sector. Associated global costs were often lower than 1500 EUR/m2, with an average of 925 EUR/m2 for the residential and 800 EUR/m2 for the non-residential sector.
For existing buildings, the majority of cost-optimal levels fell between 75 and 175 kWh/m2y, with an average of 130 kWh/m2y for the residential and 180 kWh/m2y for the non-residential sector. For existing buildings, the global costs were generally lower than 600 EUR/m2, with an average of 500 EUR/m2 for the residential and 385 EUR/m2 for the non-residential sector.
An additional analysis grouped countries per climate zone (
Table 4 and
Table 5) [
50]. We applied an official approach [
51], including:
- -
Mediterranean zone: Cyprus, Greece, Spain, Italy, Malta, and Portugal;
- -
Oceanic zone: Belgium, France, Ireland, Luxembourg, the Netherlands, and the UK;
- -
Continental zone: Austria, Czech Republic, Estonia, Germany, Hungary, Lithuania, Latvia, Poland, Romania, Slovenia, and Slovakia;
- -
Nordic zone: Denmark, Finland, and Sweden.
From this comparison, it is interesting to observe that in in all cases the primary energy consumption associated with cost-optimal levels is lower in the cold zones. Global costs are lower in the Continental zone, which includes the States of Eastern Europe.
3.3. Comparison with First Cost-Optimal Levels (2013)
Table 6 shows a comparison between the primary energy consumption associated with the cost-optimal levels of 2013 and 2020, when both these values were available. A reduction in primary energy consumption associated with the cost-optimal levels (negative percentage) can be observed for almost all building types: about −20% for the residential (new and existing) and new office buildings.
Table 7 displays a consolidated version of cost-optimal energy levels that considers 2013 levels when 2020 ones are missing, for all eight building types previously discussed. Only two Member States (Bulgaria and the Netherlands) did not provide a clear cost-optimal requirement.
3.4. Gaps between Current Requirements and Cost-Optimal Levels
The evaluation of the gaps between cost-optimal levels and current requirements is a relevant step in the calculation, since it should provide useful indications for the update of existing energy performance regulations. National minimum energy performance requirements should not be higher than 15% compared to the outcome of the cost-optimal levels. A plan should be defined to reduce the gaps that cannot be strongly justified.
The gap quantification allows the comparison of results among countries, reference building types, and requirements for renovation of building or components. Therefore, it is important to note that the results are not fully comparable among Member States, since they are free to choose the macroeconomic or financial perspective for deriving the cost-optimal levels and to apply different national standards to calculate the energy performance of buildings. Other differences (e.g., related to investment costs) should reflect national market conditions, and are thus not a limit to, but an integral part of the comparison.
The comparison between the levels assessed in 2013 and 2020 can also be extended to the shortfall against minimum energy performance requirements in force.
Table 8 and
Table 9 collect the available information, providing the gap evolution when data are available from both the 2013 and 2020 reports. A negative percentage means that the analyzed energy requirement is lower than the cost-optimal level. We report a single gap value for cases that were assessed only in a calculation round (by indicating the reference year), and both gap values when available. The Member States for which it was not possible to derive clear figures for any building types are not included in the tables.
Focusing on Member States for which data from both 2013 and 2020 are available, it can be observed that in some cases the gaps decreased, and in others they increased with the second calculation round. This progress can be assessed as quite positive, especially for existing buildings. A key implication of this aspect for a future revision of the methodology is accounting for the developments of the construction market as well as the technological innovation of building products, considering the evolution of energy prices, primary energy factors, and materials. Another important implication is the identification of the most suitable renovation packages that Member States should consider to achieve ZEBs.
4. Discussion
The cost-optimal methodology appears to be currently entrenched at government and scientific levels. It represents a well-established tool that includes both energy and economic evaluations. Progress is clearly assessed in Member States in relation to the analyzed categories. In support of future reviews of the cost-optimal methodology implementation, the following proposals are elaborated.
A future common template would be useful to collect key input data and outputs. A large number of input data may impact final results (e.g., implemented technology costs, normally collected from databases or construction projects), while a common template would allow easier and comparable methodology implementation, and consequently coordinated assessment.
Considering a higher number of variants could be useful, as the current number (10 packages/variants plus the reference case) may not guarantee a comprehensive coverage of applicable technologies. A number of 20 packages/variants appears suitable, as some Member States and other studies [
52,
53,
54,
55] have already shown this figure as feasible.
Indications could be provided for historical buildings. Normally the selected existing building types date from the years 1960s–1980s, and a few Member States also considered historical buildings. Guidance for selecting energy efficiency measures in heritage buildings could be useful [
56].
Currently, a few Member States considered comfort and indoor air quality within their cost-optimal framework, probably due to the complexity of their inclusion in the calculations. Summer comfort is particularly overlooked, and an active air conditioning system is not often included among the selected efficiency measures. One possible procedure would refer to the operative indoor temperature provided by Standard EN 16798 [
57], which replaced EN 15251. According to this set-point, the energy demand for cooling should be calculated for all building variants, and an active cooling system should be considered for variants with an energy demand higher than a certain limit (e.g., 3 or 5 kWh/month).
The cost-optimal framework could take into account additional variables, such as the increase in the building value due to better energy performance, as well as further co-benefits deriving from the application of energy efficiency measures and the use of renewable sources, such as improved comfort, noise reduction, and indoor air quality.
The introduction of a “base refurbishment level” for existing buildings would take these factors into account. It would represent the lower renovation level to be compared with more efficient ones. This base level should comprise building façade and roof rehabilitation, old windows and heating/cooling system replacement, active cooling installation. Its definition would allow the obtainment of harmonized building variants in terms of functionality, aesthetics, and liveability, would recognize which costs could be omitted, and would fix the end-life of the original building components (normally older than 40 years). An example of how the base refurbishment level can be applied with good results is given in the Entranze project [
20].
Member States are free to extend the methodology to full life-cycle costs, although none of them have. As recently discussed [
58], the global cost calculation could follow a revised formula, which includes new savings related to the environmental impacts (C
EN), economic impacts (C
EC, i.e., the change in GDP and the cost savings due to improved energy security), and social impacts (C
SO), as shown in equation 2:
where:
CG (τ) is the life-cycle cost including environmental, economic, and social indicators [€];
CI is the sum of initial investment costs;
Ca,i(j) is the annual cost for component j at the year i;
Rd(i) is the discount term for year i;
Cc,i(j) means carbon cost per measure or set of measures j during year i (not included in the financial perspective methodology);
Vf,τ(j) is the final value of component j at the end of the calculation period.
The inclusion of this approach in the cost-optimal calculation would be relevant to the wider benefits of energy efficiency and policy decisions that shape the market transition.
In relation to the cost-optimal level identification, two aspects deserve more attention:
- -
the application of the “cost-optimal range” is too often ignored, despite affecting the final results;
- -
the choices related to the averaging operation applied to the cost-optimal levels (derived for different building types) to quantify the shortfall against current requirements should always be thoroughly discussed and motivated.
The first point also relates to the wider benefits of energy efficiency previously discussed. If this effect is not explicitly considered in the optimization method, it becomes more important to select the optimum level in a non-conservative way. That is, by applying a tolerance on global costs (3%–5%) and choosing the lowest energy level (in the so called ”left border of the cost-optimal range”).
The selection of input parameters highly influences results. Consequently, sensitivity analysis is of a key importance in controlling their impact and the robustness of related outcomes. This allows quantification of the uncertainty of the data, especially those derived from databases. Two approaches are possible: changing parameters one by one (as done by Member States) or assigning a probabilistic function (e.g., Monte Carlo simulation) to input parameters and obtaining more precise distributions of outcomes. This approach takes into account more fully the heterogeneity of the different data sources, providing results based on intervals. As example of this approach, a study from Becchio et al. [
59] considered, for each identified parameter, a minimum, average, and maximum value in a triangular distribution.
It would be useful to define a cost-optimal approach focused to the district level, where environmental and social impacts are considered in terms of the co-benefits linked to the environment and the involved community [
60]. This could also encourage the development of decarbonization strategies for reducing environmental impacts at local level [
61].
Finally, it is worth underlining that, in compliance with Article 6 of [
8] (ex-Article 5 of the EPBD), the calculation of cost-optimal levels falls within the core of the Green Deal [
3], as costs of greenhouse gas allowances as well as environmental and health aspects of energy use will have to be considered in order to derive the lowest costs [
62]. This is also in line with the update of the NZEB definitions, the introduction of energy requirements and incentive mechanisms for renovation [
63], as stated in the Renovation Wave [
4], and the environmental targets for the building sector. The cost-optimal level shall lie within the range of performance levels where the cost benefit analysis calculated over the estimated economic lifecycle is positive.
5. Conclusions
Reducing the energy demand in buildings is a prerequisite for meeting Europe’s energy efficiency and GHG-emission reduction targets. The cost-optimal and NZEB implementation can support this process and provide useful references to develop policy and incentive measures to retrofit the existing building stock.
This paper gives a comprehensive assessment of the cost-optimal methodology in Member States based on latest reports. This review appears necessary in order to assess the implementation progress and outline weak and strong points as well as future developments. The review outputs highlight how cost-optimality is currently a well-established concept in Member States, and an overall positive development can be acknowledged. Based on the collected data, some statistics can be presented. The average cost-optimal level is assessed at 80 kWh/m2y for the new residential sector and 140 kWh/m2y for the new non-residential sector, while it is 130 kWh/m2yr for the existing residential sector and 180 kWh/m2y for existing non-residential sector. For almost all building types, the primary energy consumptions associated with cost-optimal levels were lower in cold regions, while global costs are normally lower in countries with a warm and mild climate.
The positive assessment achieved by Member States in implementing the cost-optimal methodology implies its potential for adaptation toward the gradual introduction of zero-emission buildings (ZEBs), for both new and existing buildings and at building element level.
The comparison with cost-optimal levels of the previous calculation round (2013) shows that for almost all building types, lower values were obtained in 2020. Looking at the consolidated cost-optimal levels, only two Member States did not clearly provide any cost-optimal requirement. Regarding conformity to the EU policy framework, some gaps can be highlighted:
almost two-thirds of the Member States failed to cover one or more objectives, such as a required building type or the cost-optimal levels for building elements installed in existing buildings.
almost half of the Member States applied derivation methodologies that did not fully conform or did not provide sufficient information to allow assessment of this calculation step.
many Member States did not provide convincing explanations about the existing gaps or clear plans to reduce them, or did not even discuss the shortfalls against current requirements. Only in a few cases was a comparison with NZEB requirements available.
However, the situation looks positive with regard to the plausibility of input parameters and results obtained. As a consequence, the identified areas for improvement of the cost-optimal methodology include modalities of adapting to ZEBs to better enlighten the environmental and externalities aspects. The implications of such adaptations will have to be tested in terms of calculation robustness, confidence level, and sensitivity analysis.
The future cost-optimal framework will enable the calculation of both energy and emission performance, taking into account environmental and health externalities, as well as the emissions trading system (ETS) extension and carbon prices. The update of the calculations of cost-optimal levels will have to be monitored while also considering:
the update of the NZEB definitions for new and renovated buildings;
the introduction of energy requirements and incentive mechanisms for existing buildings in line with the Renovation Wave Strategy;
the environmental targets for 2030 and the carbon neutrality goal for 2050 for the building sector as a whole.
This review also details suggestions on the points that could be considered in the future cost-optimal methodology that will be reviewed by 2026. Among the implications of the results of this review are the introduction of cost-optimality at district level and historical buildings; the use of a common template to collect data; harmonization of results and streamlining of the administrative aspect. A base refurbishment level could be useful to take into account the increased value of energy efficiency implementation in building retrofit. Enhanced importance could be placed on comfort and indoor air quality, as well as on the inclusion of wider energy efficiency benefits, such as a reduced import dependency and a positive impact on the economy (e.g., job creation). In this way, the global cost concept could be more in line with a complete life-cycle assessment that would take into account all environmental impacts throughout the life-cycle. In particular, the introduction of socioeconomic benefits could fulfil ambitious requirements and unlock higher energy and monetary savings. From this perspective, the outcomes of this cost-optimal review assume a strategic value, since they allow a comprehensive comparison among Member States for assessing progress and related strengths and weaknesses. Its future development and implementation will be crucial for the renovation of existing buildings and the achievement of a zero-carbon society in 2050.


