
Computational Aerodynamic Optimization of Wind-Sensitive Irregular Tall Buildings


 ,
,  ,
,
Abstract
:1. Introduction
2. Research Methodology
2.1. CFD Validation
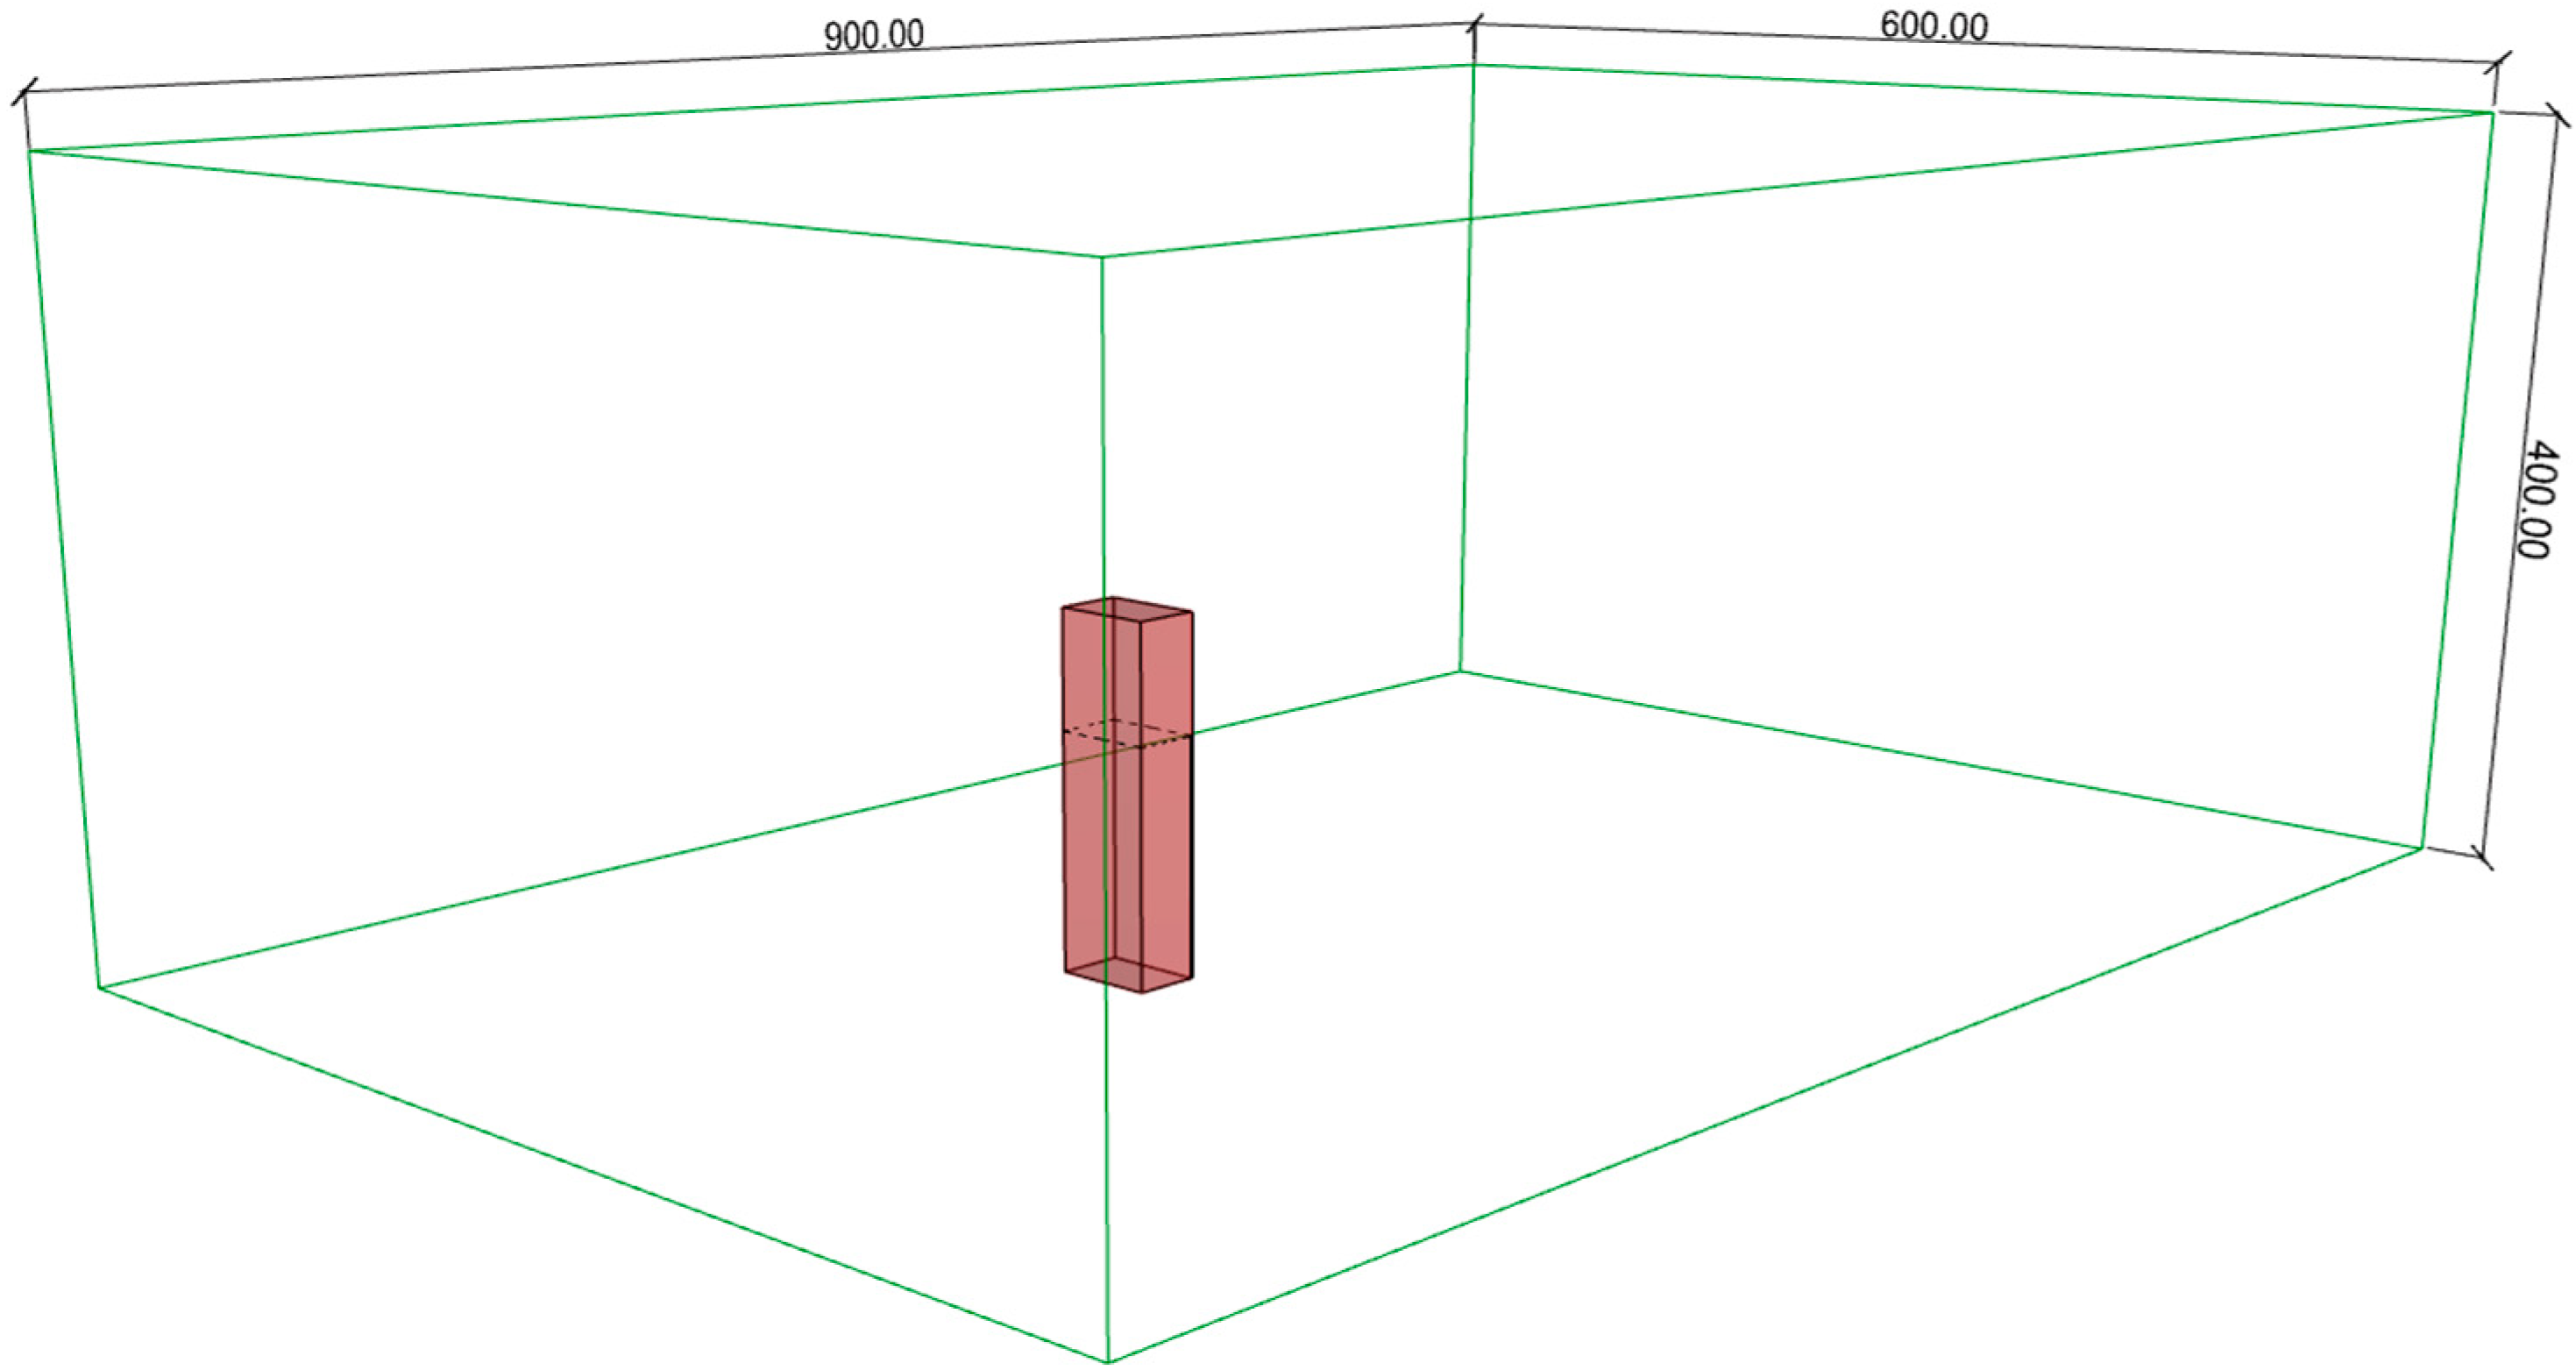
2.1.1. CAARC Building Assembly
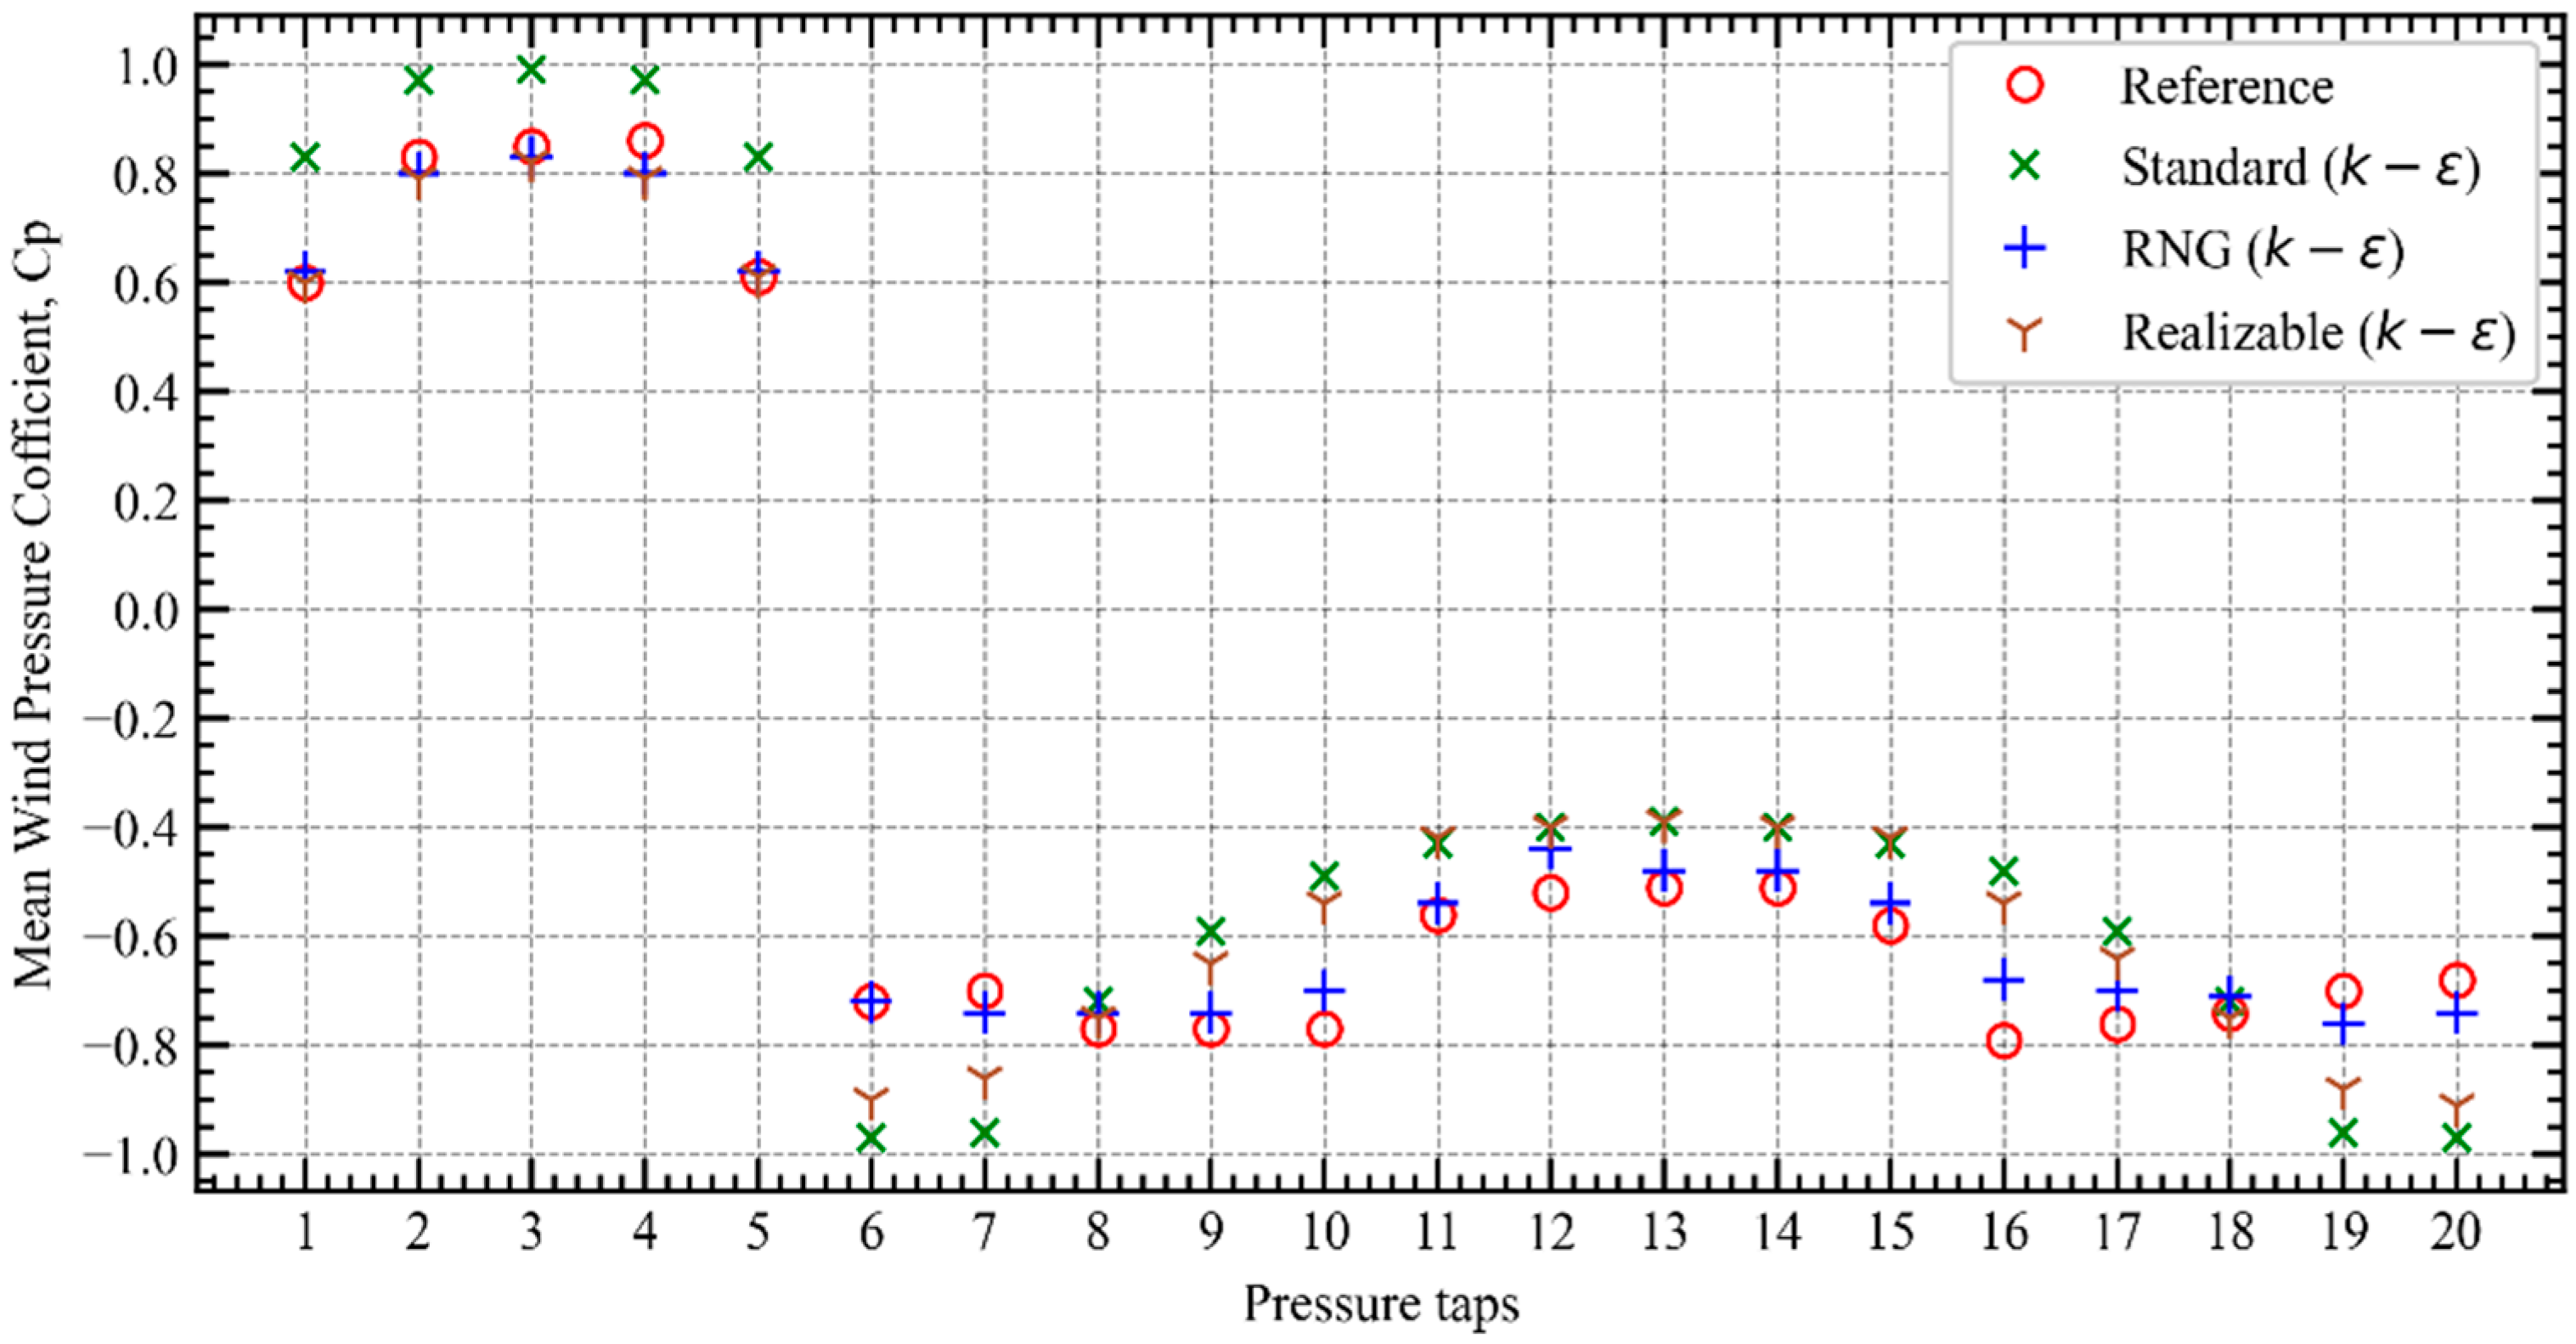
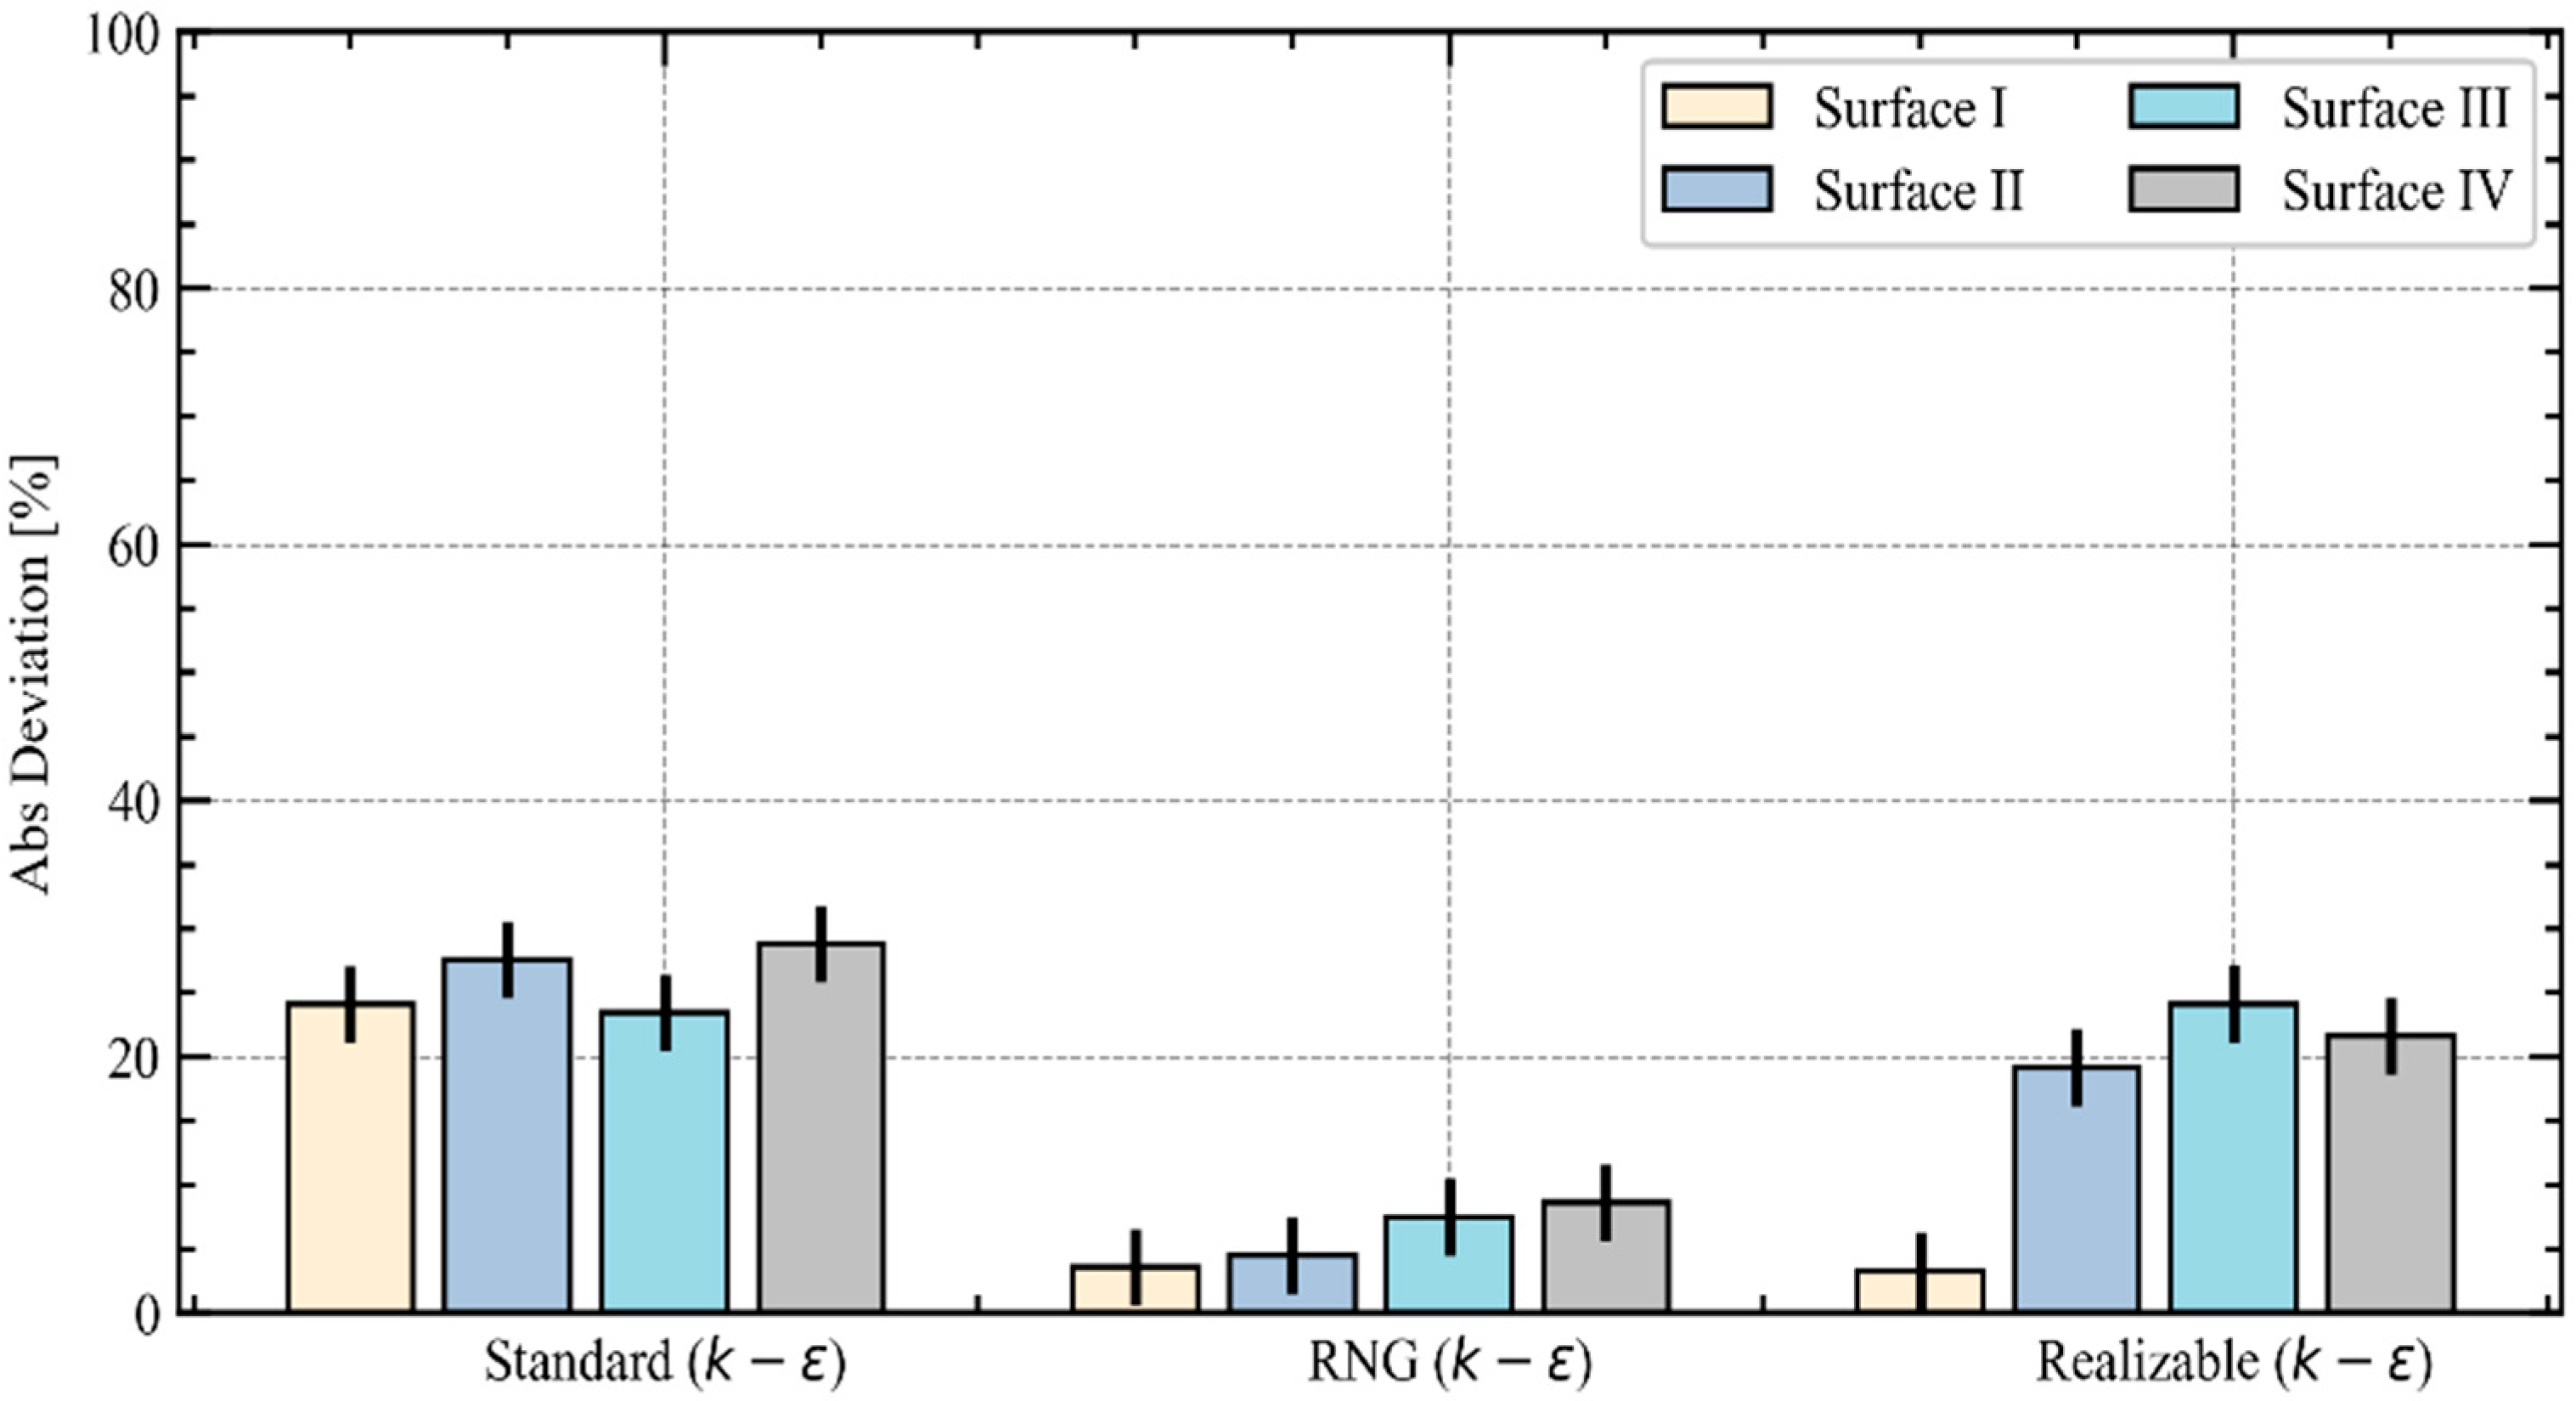
2.1.2. Turbulence Models
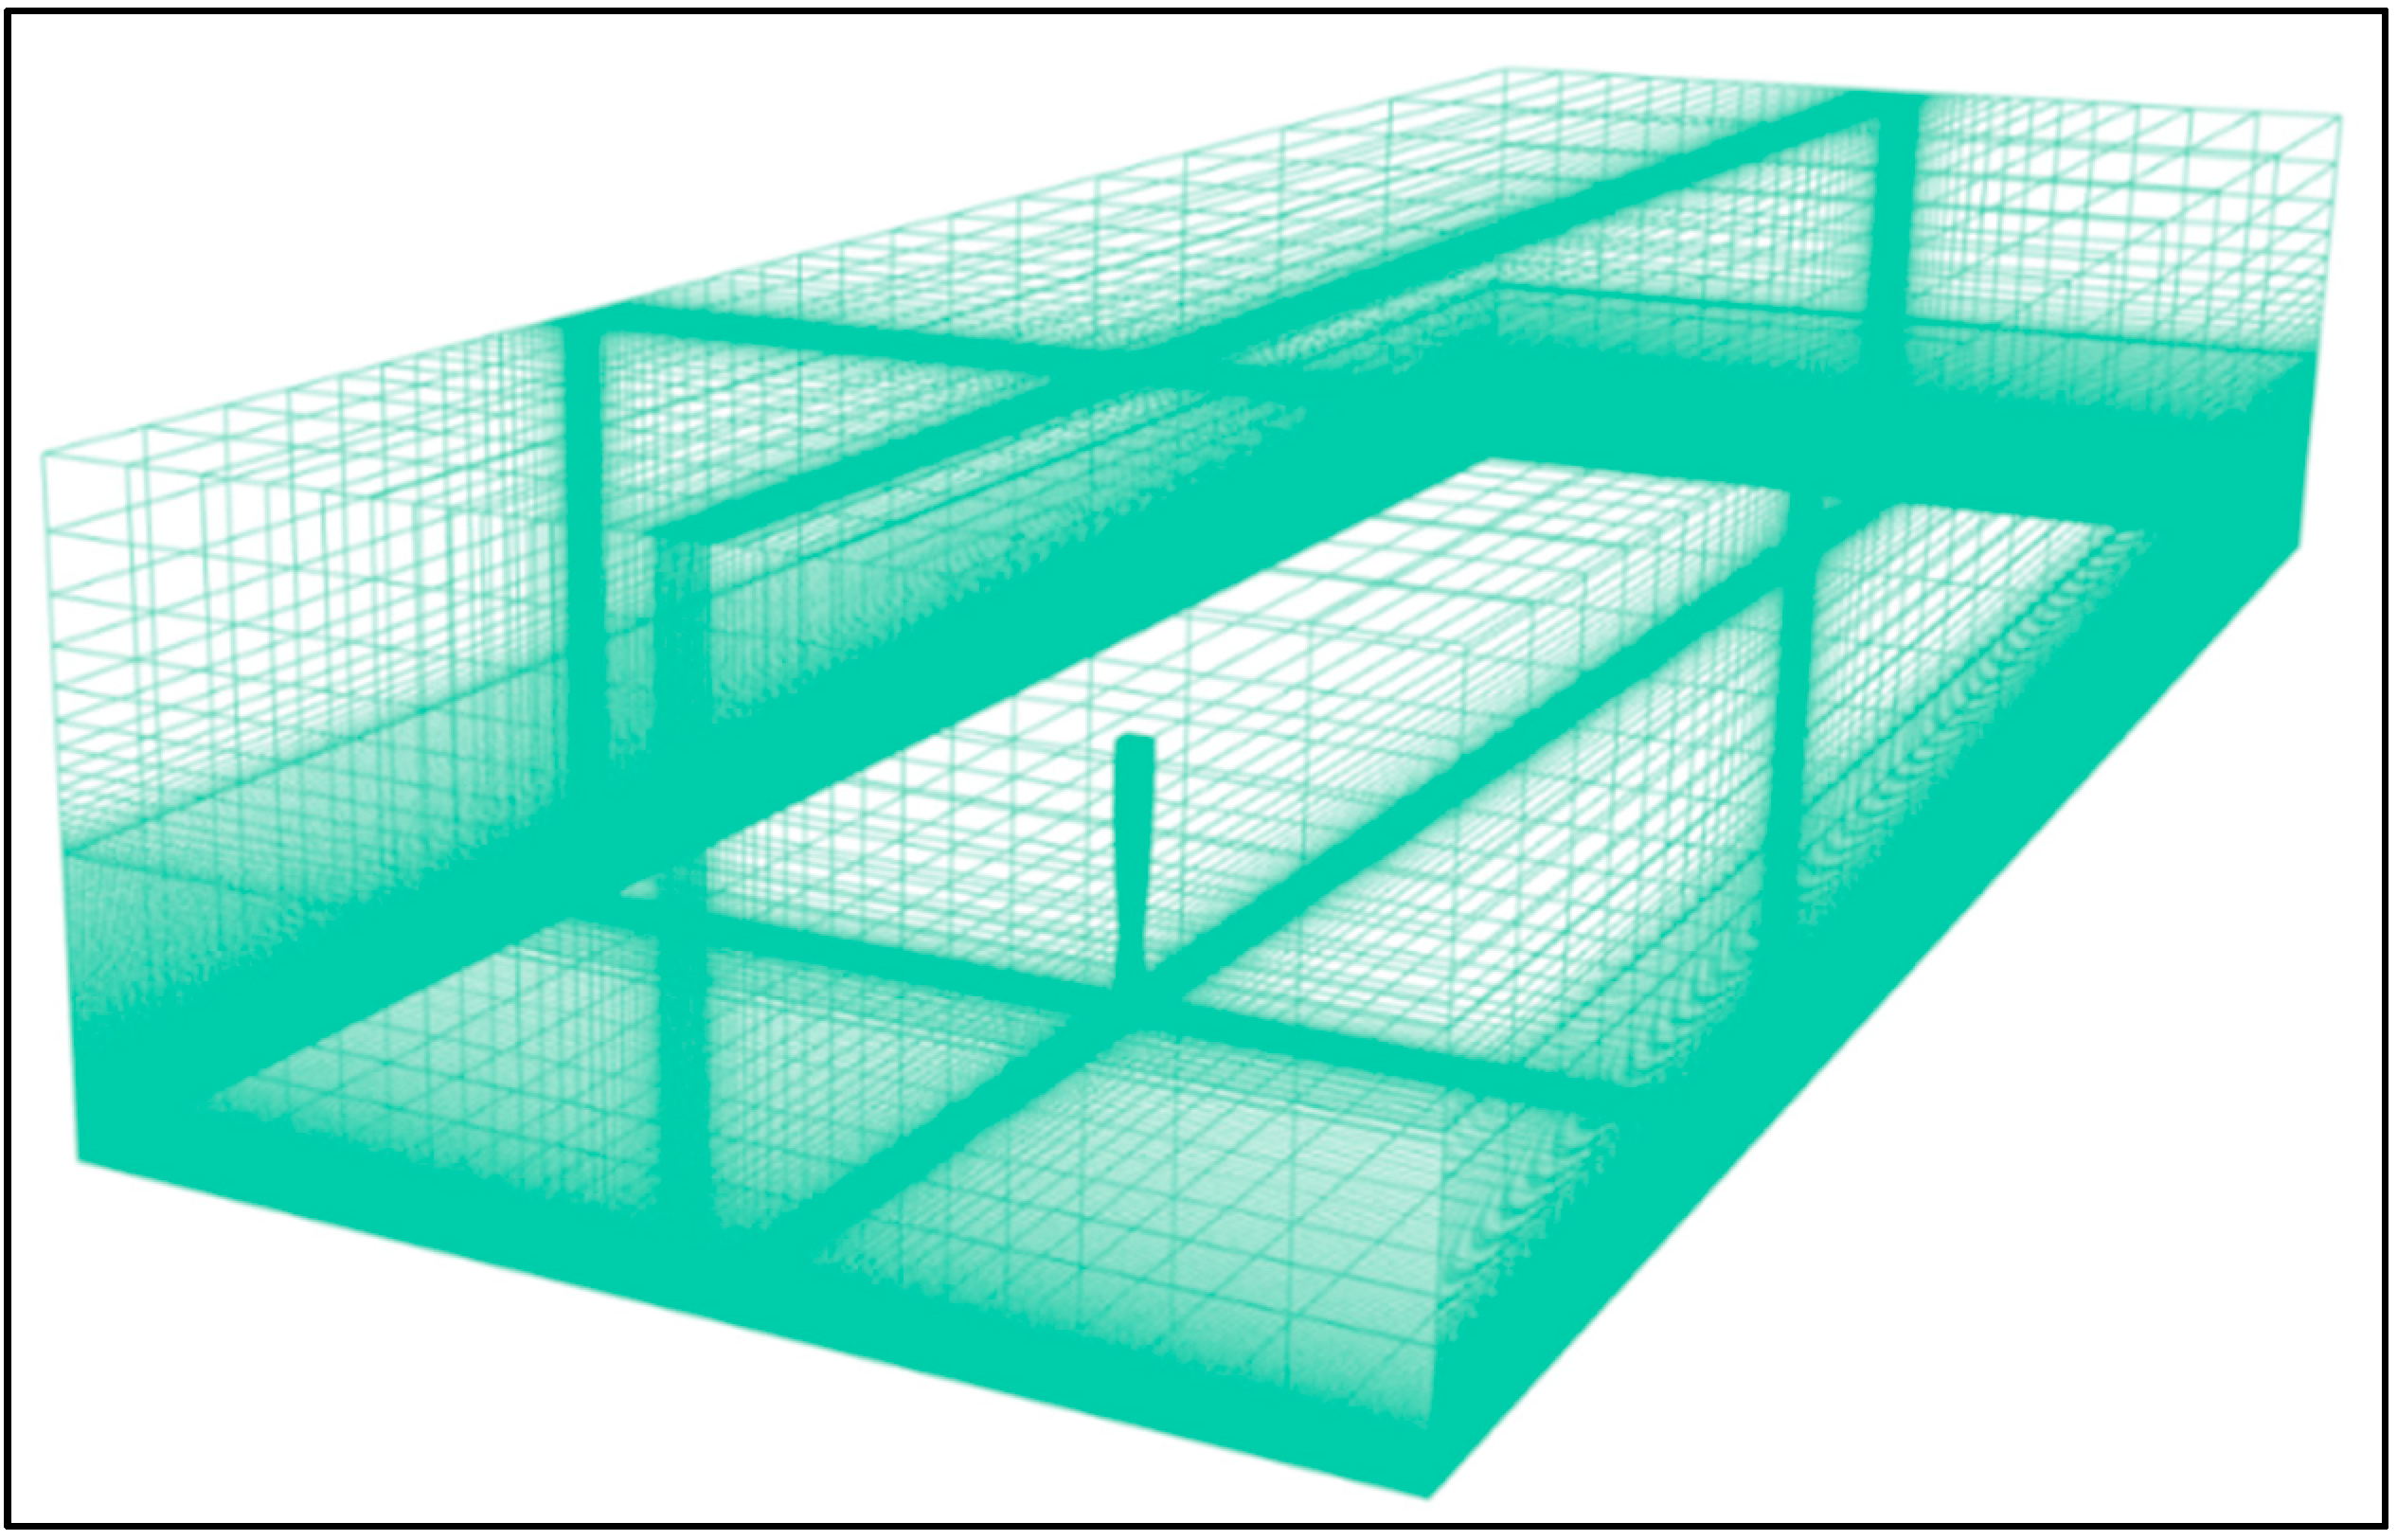
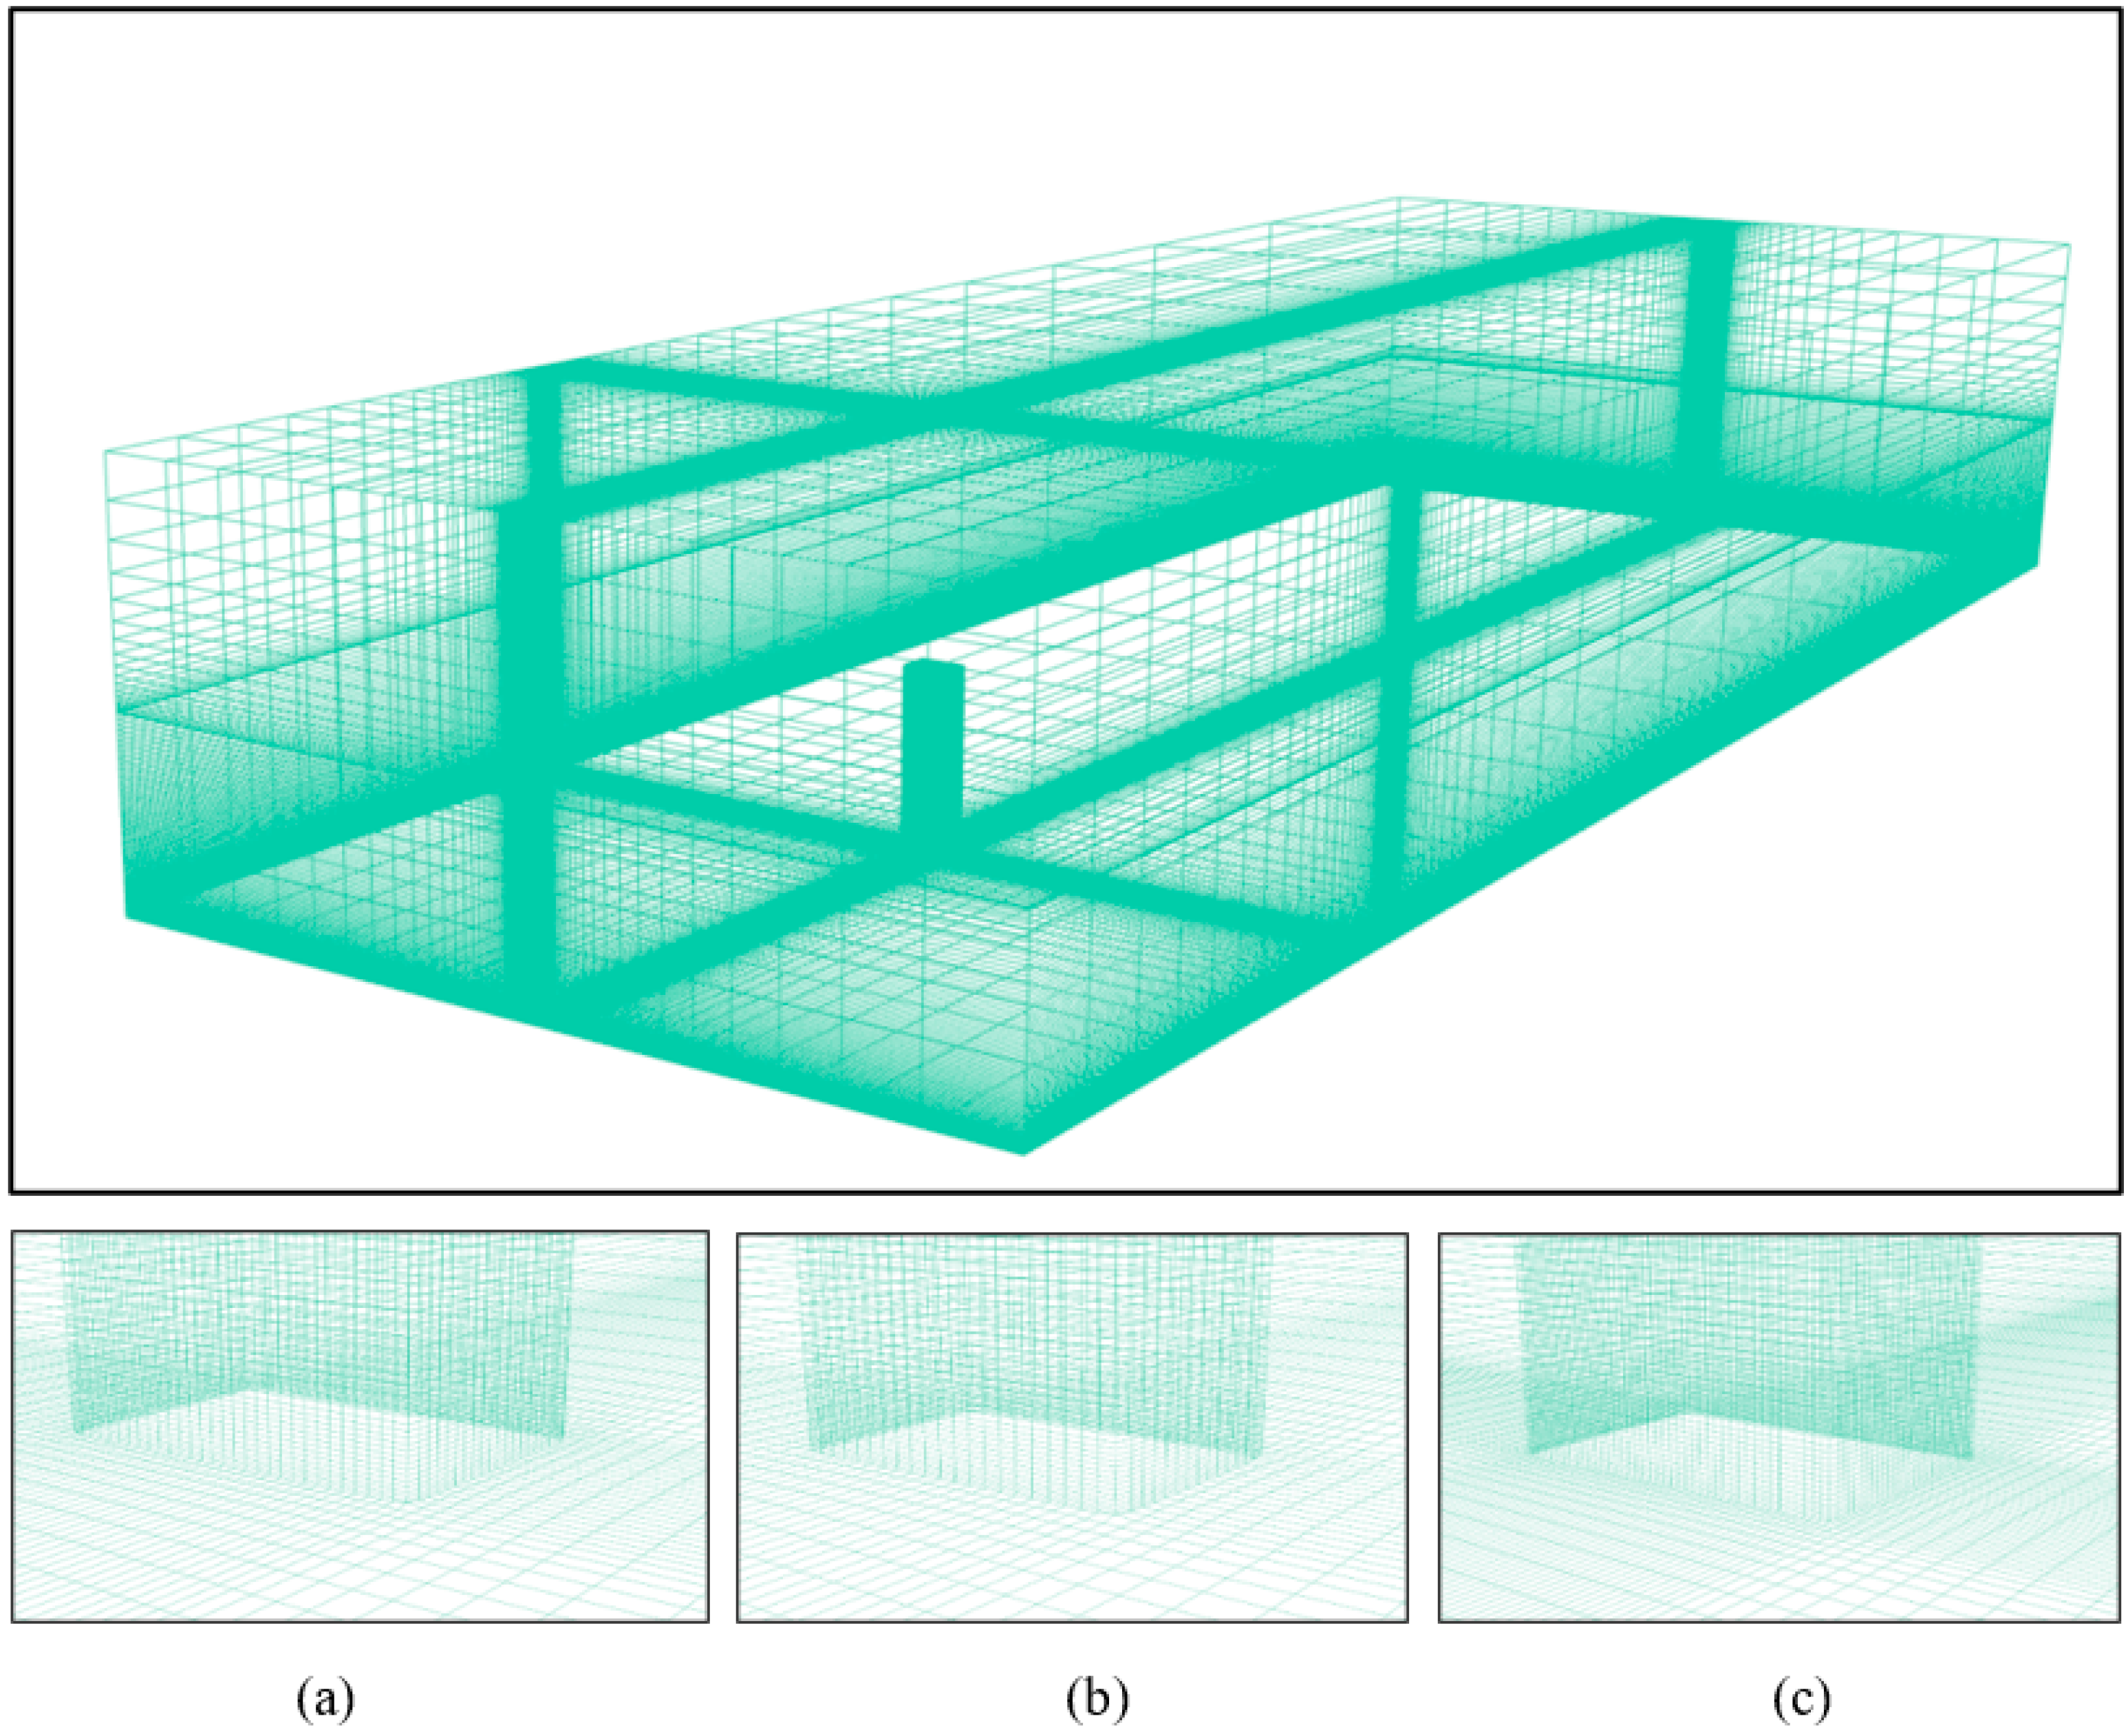
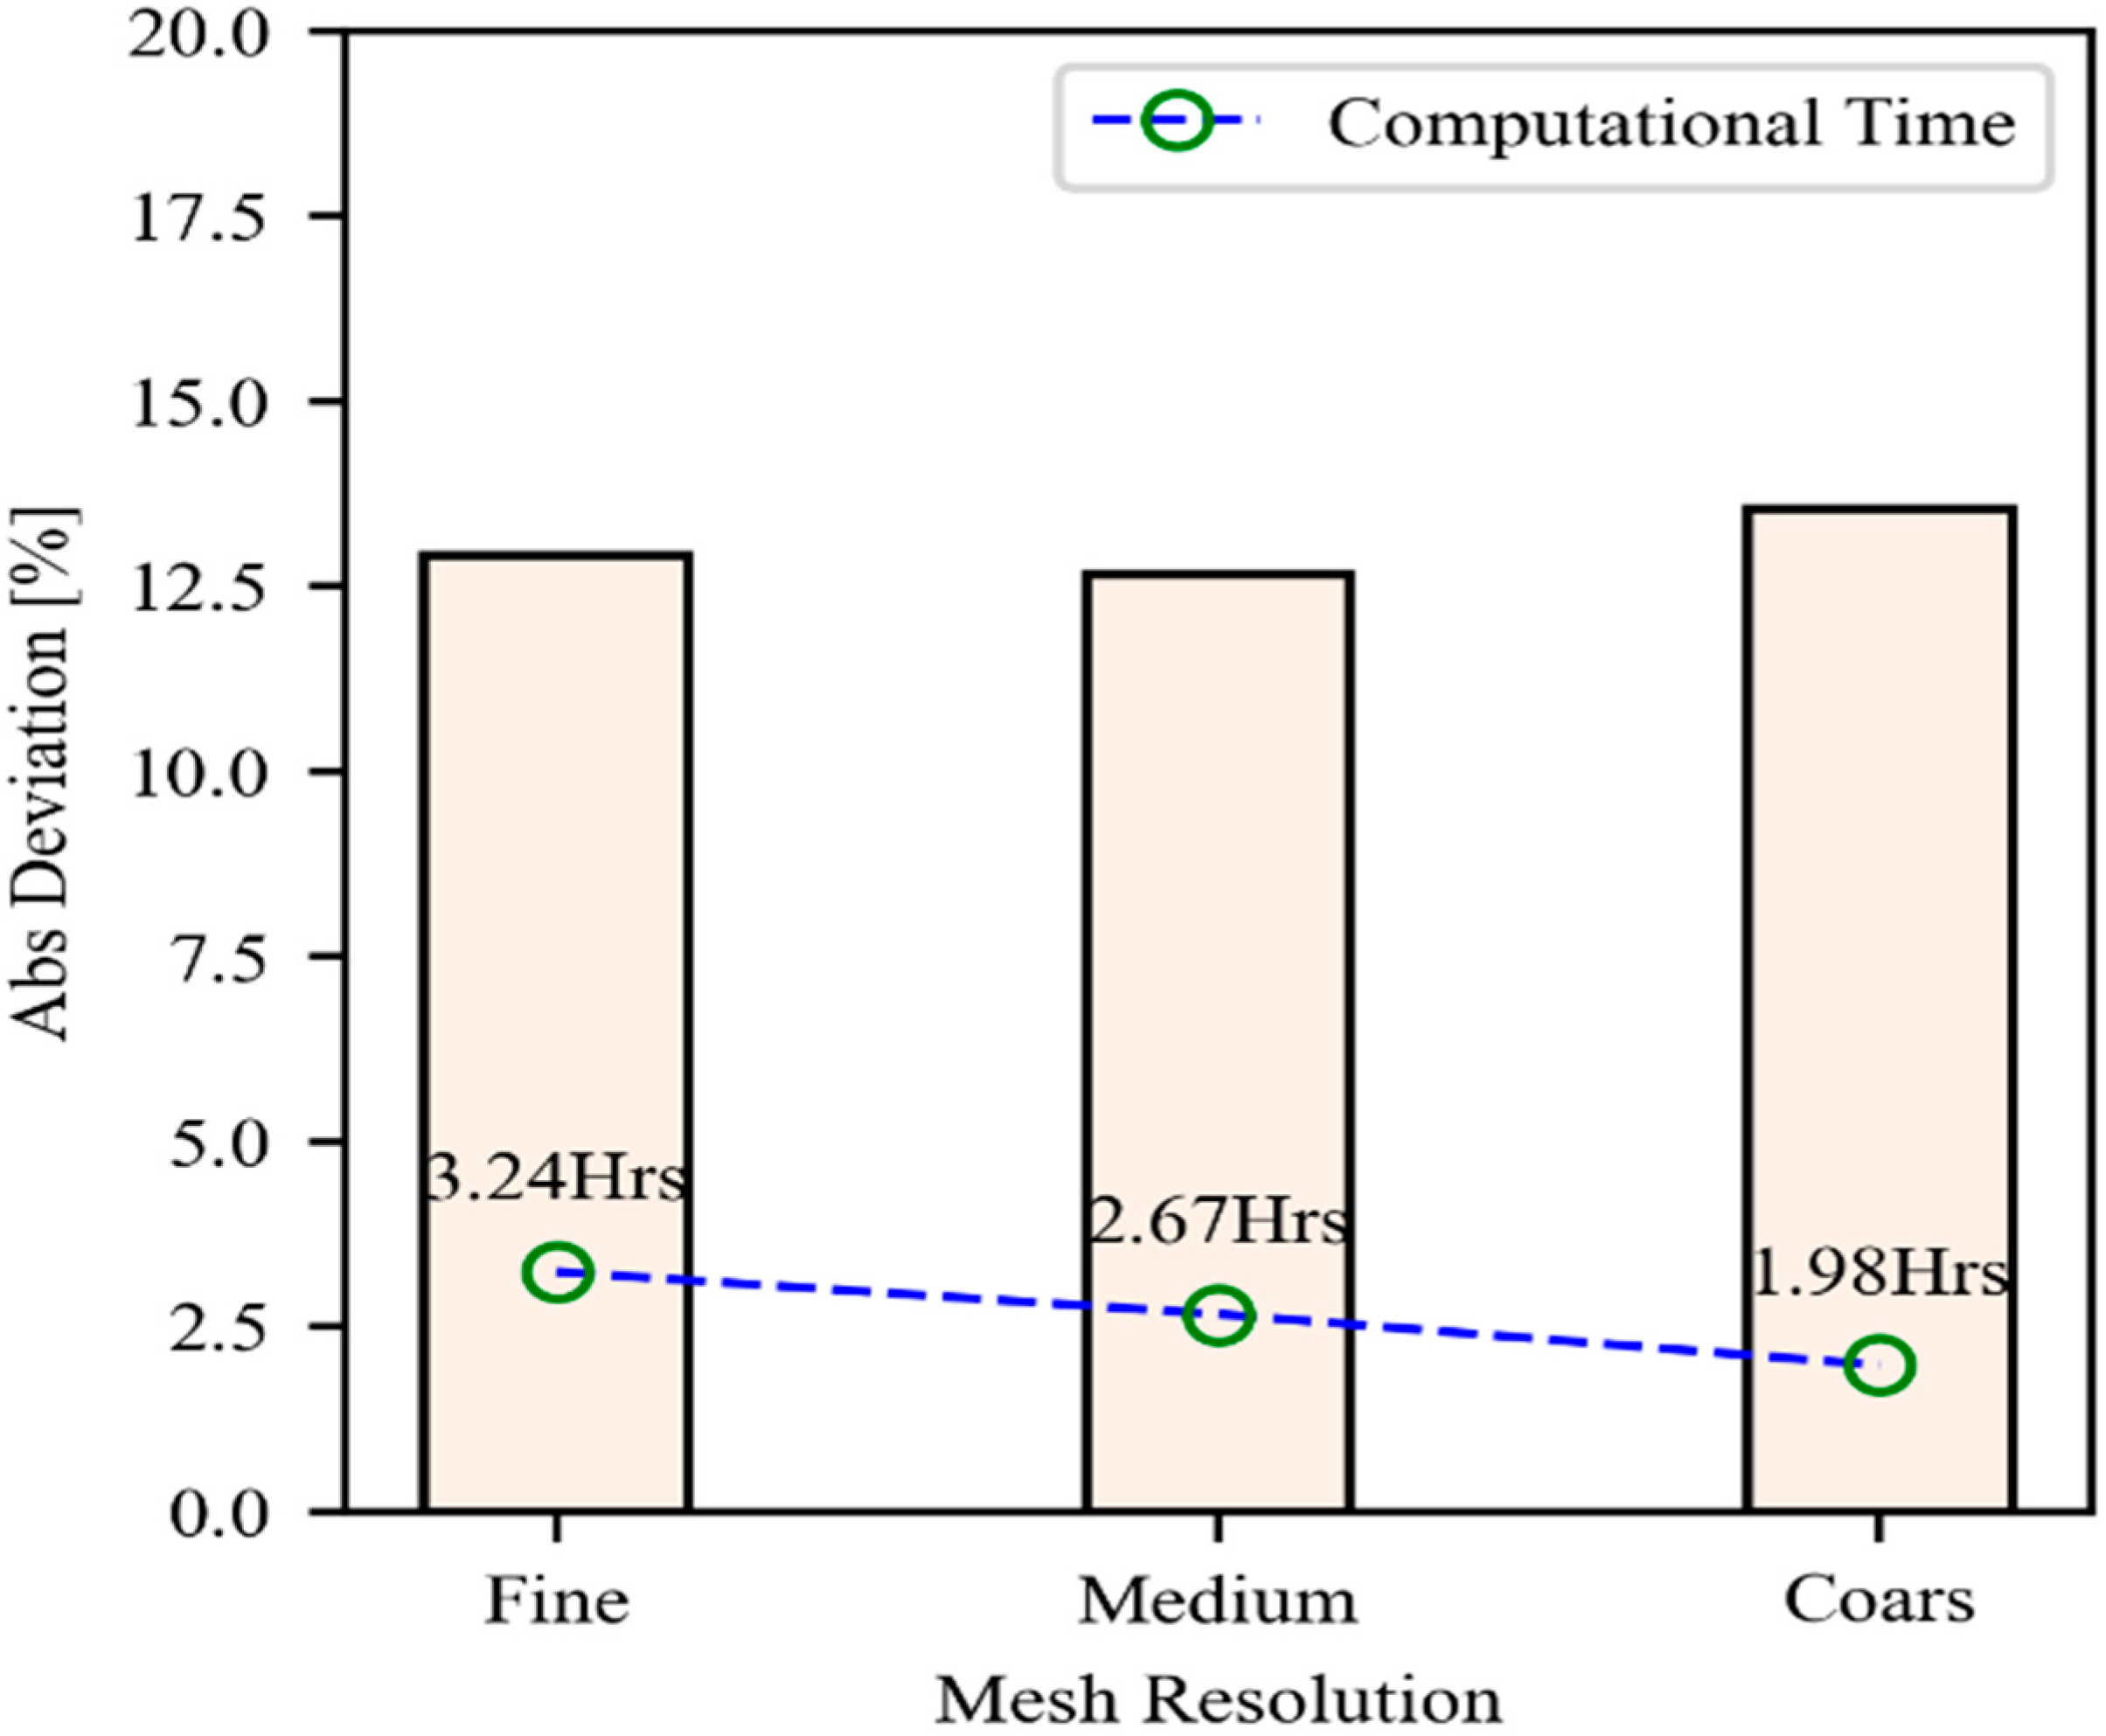
2.1.3. Mesh Resolutions
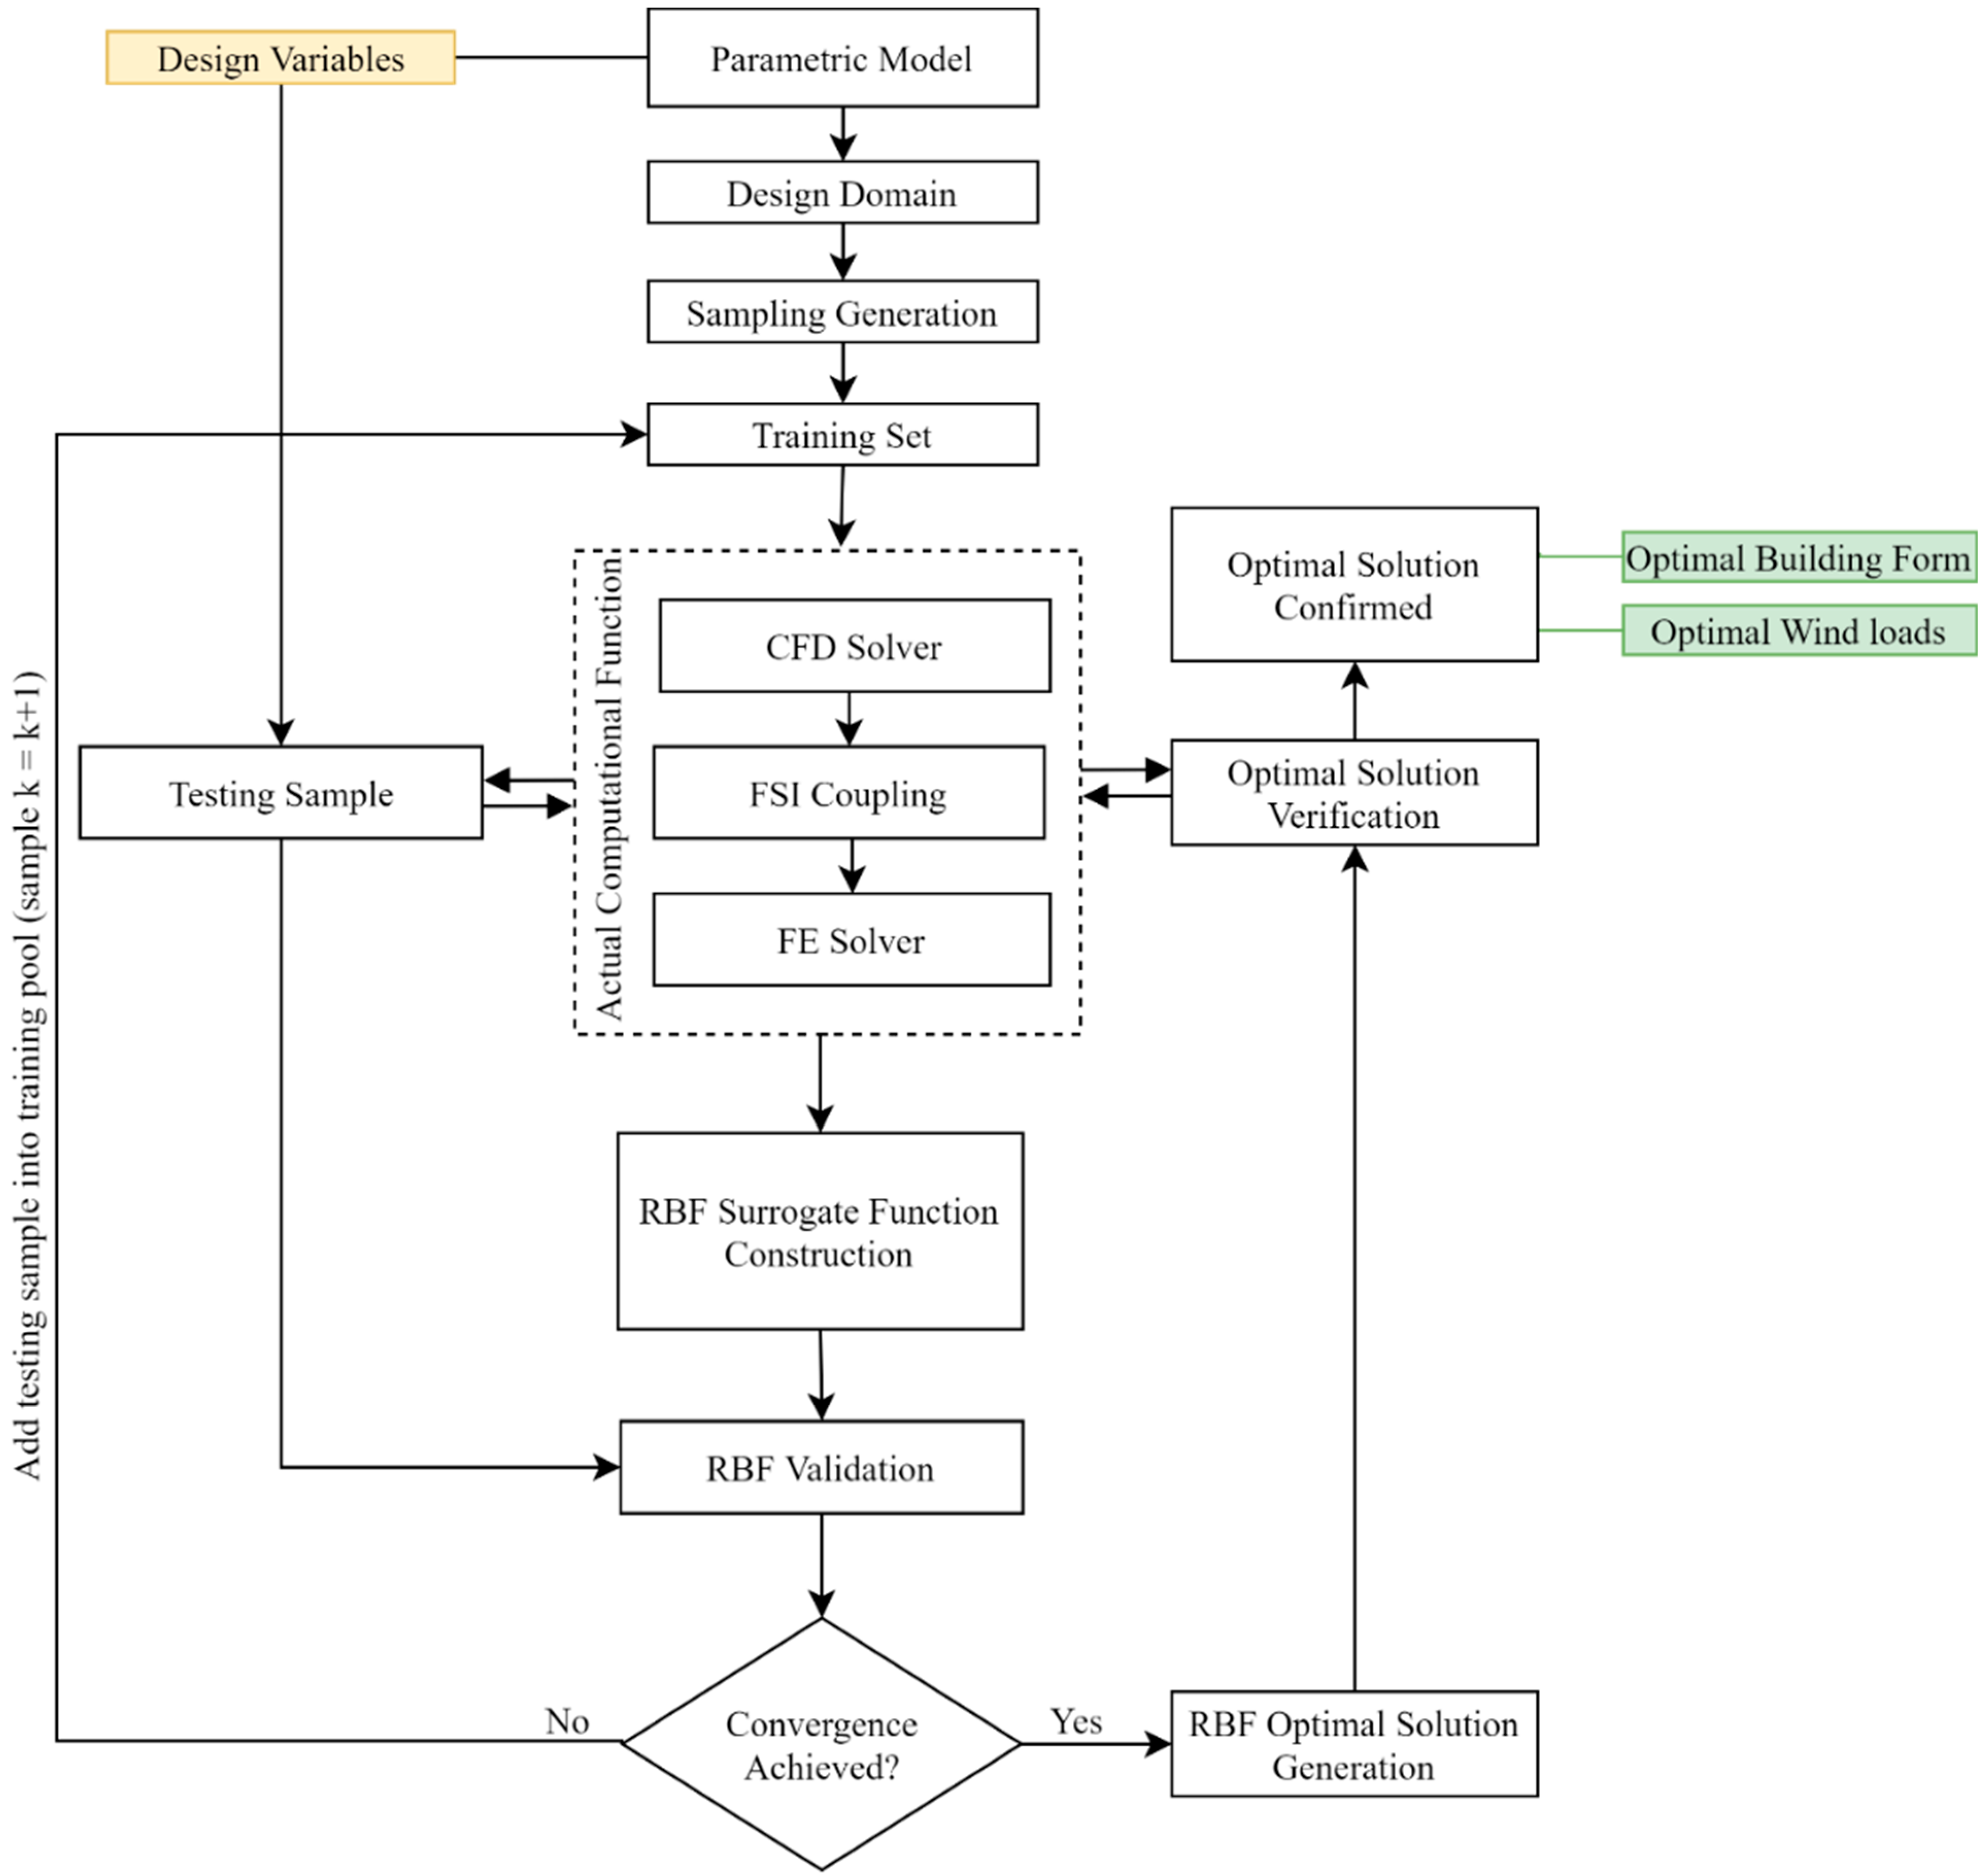
3. Aerodynamic Optimization Procedure
- -
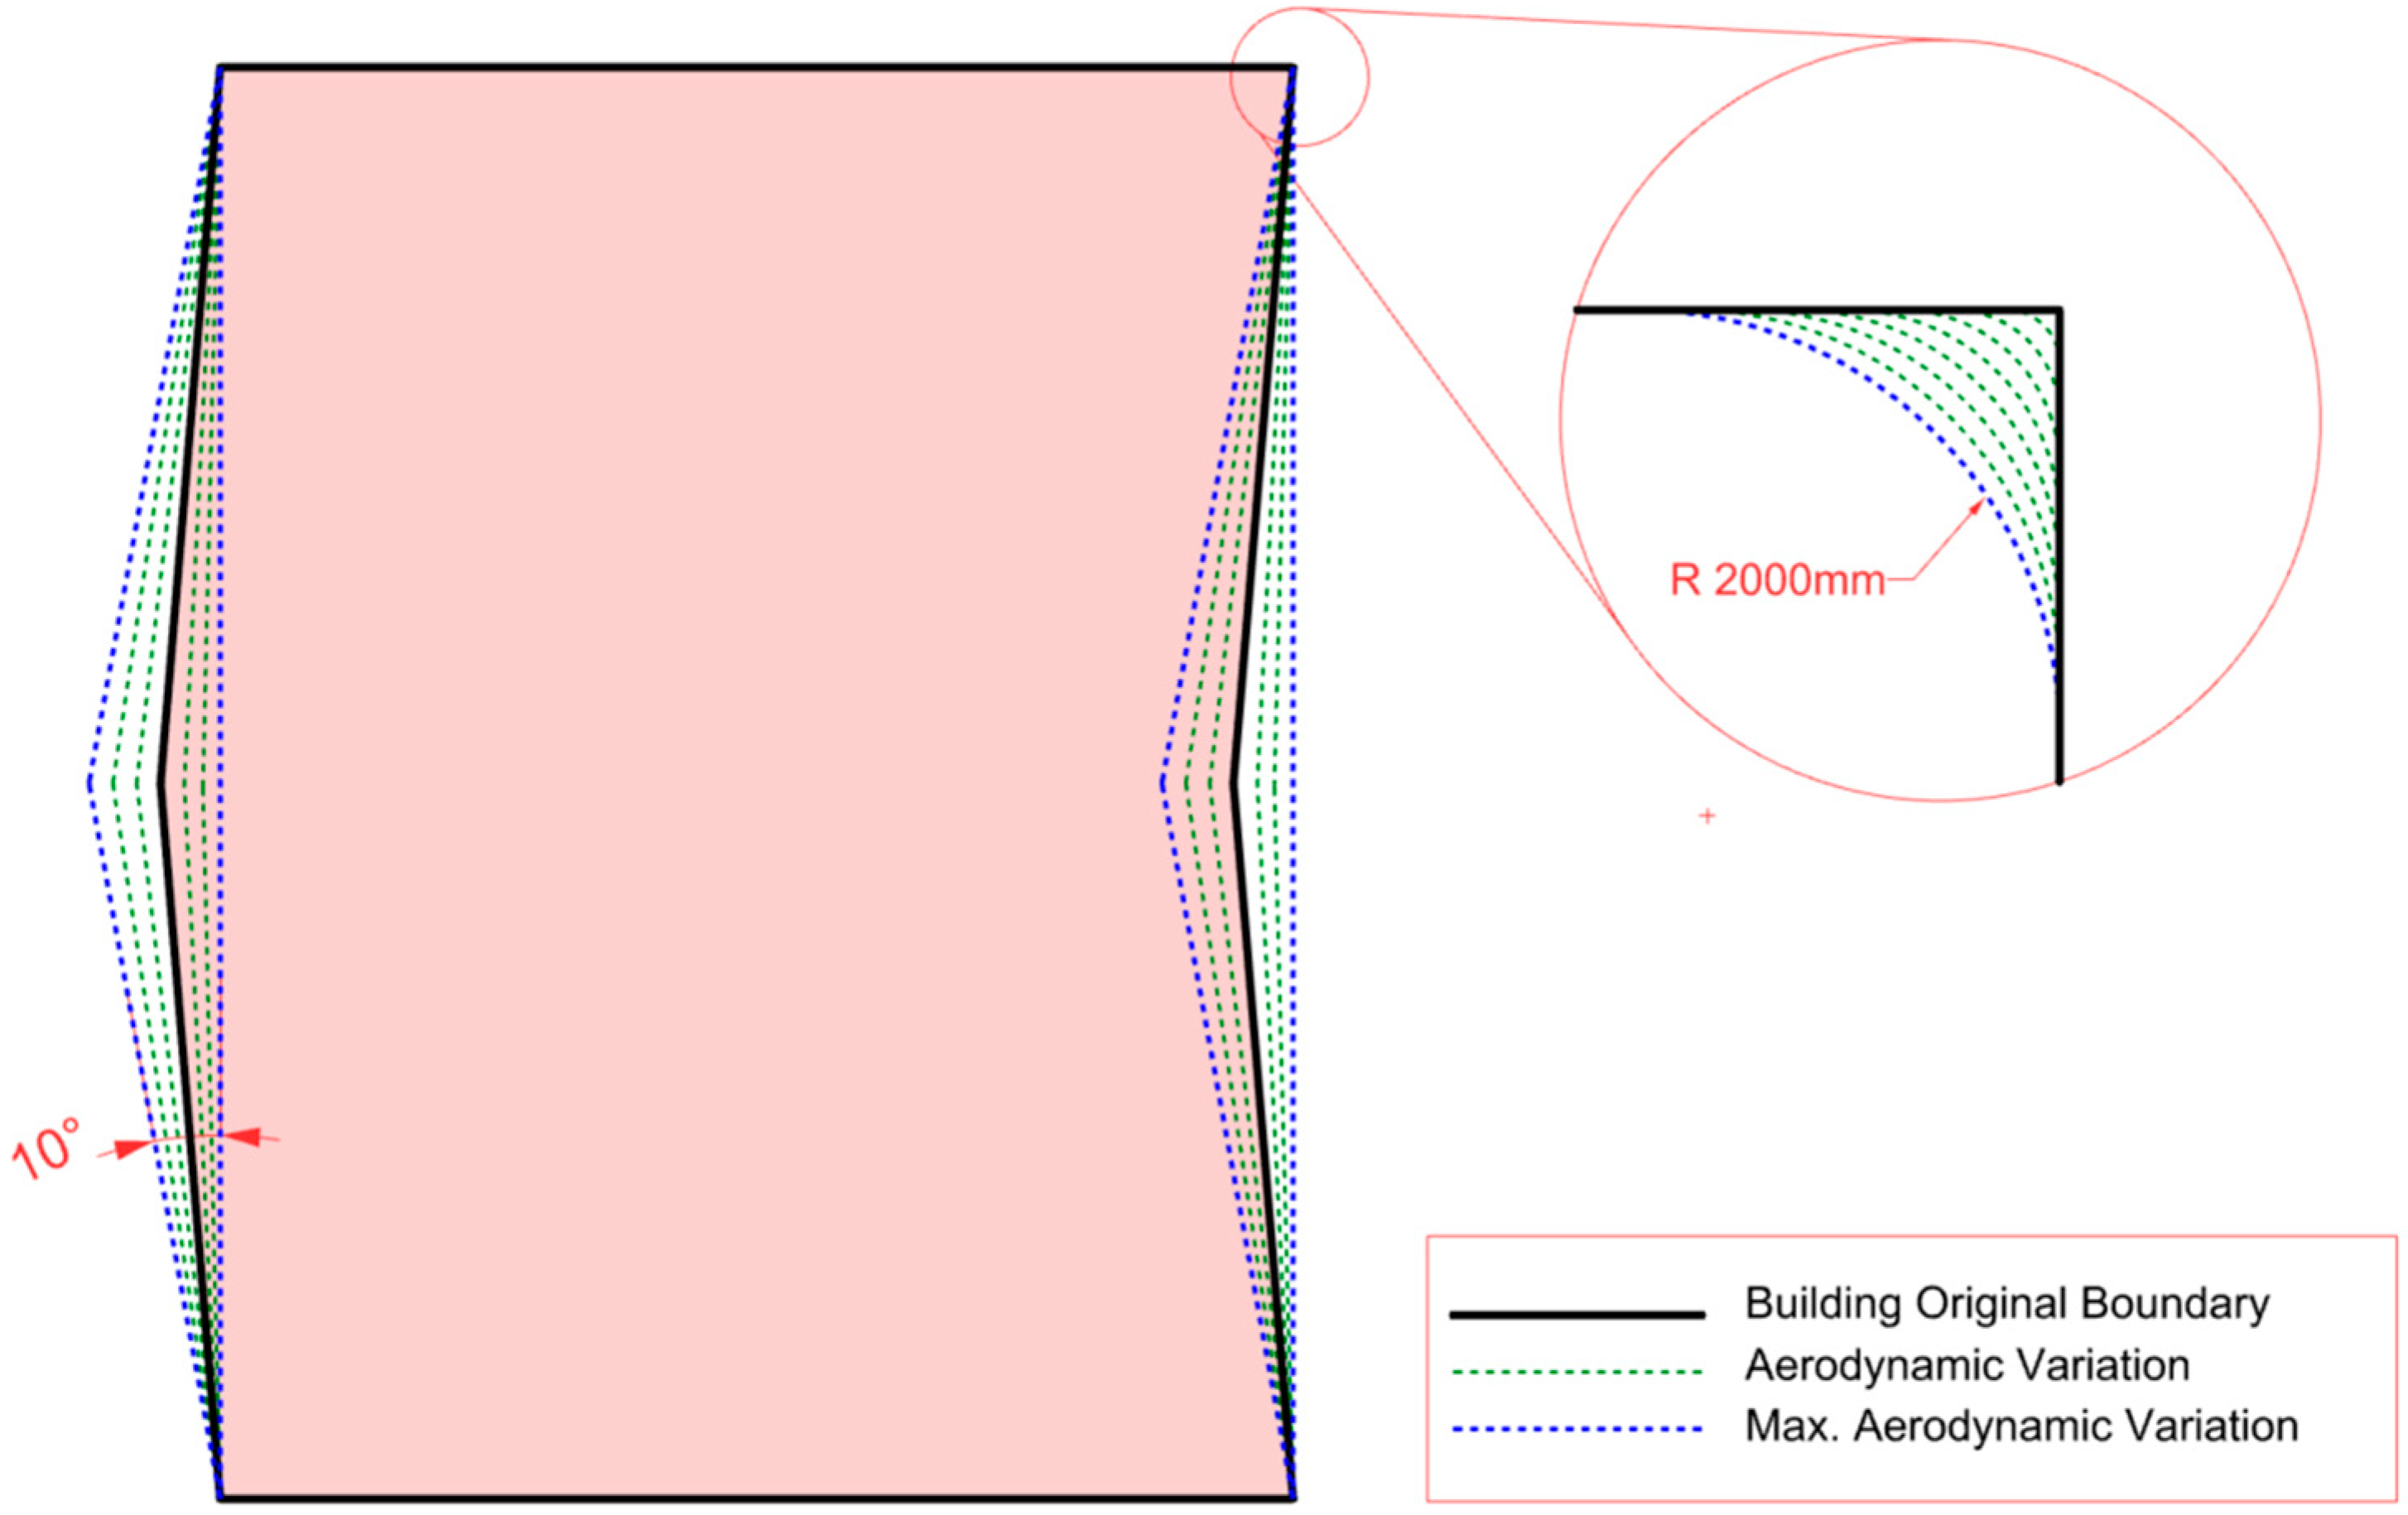
- Three-dimensional parametrical model reflecting the geometries of the building is created and design variables to be manipulated for aerodynamic modifications are identified.
- -
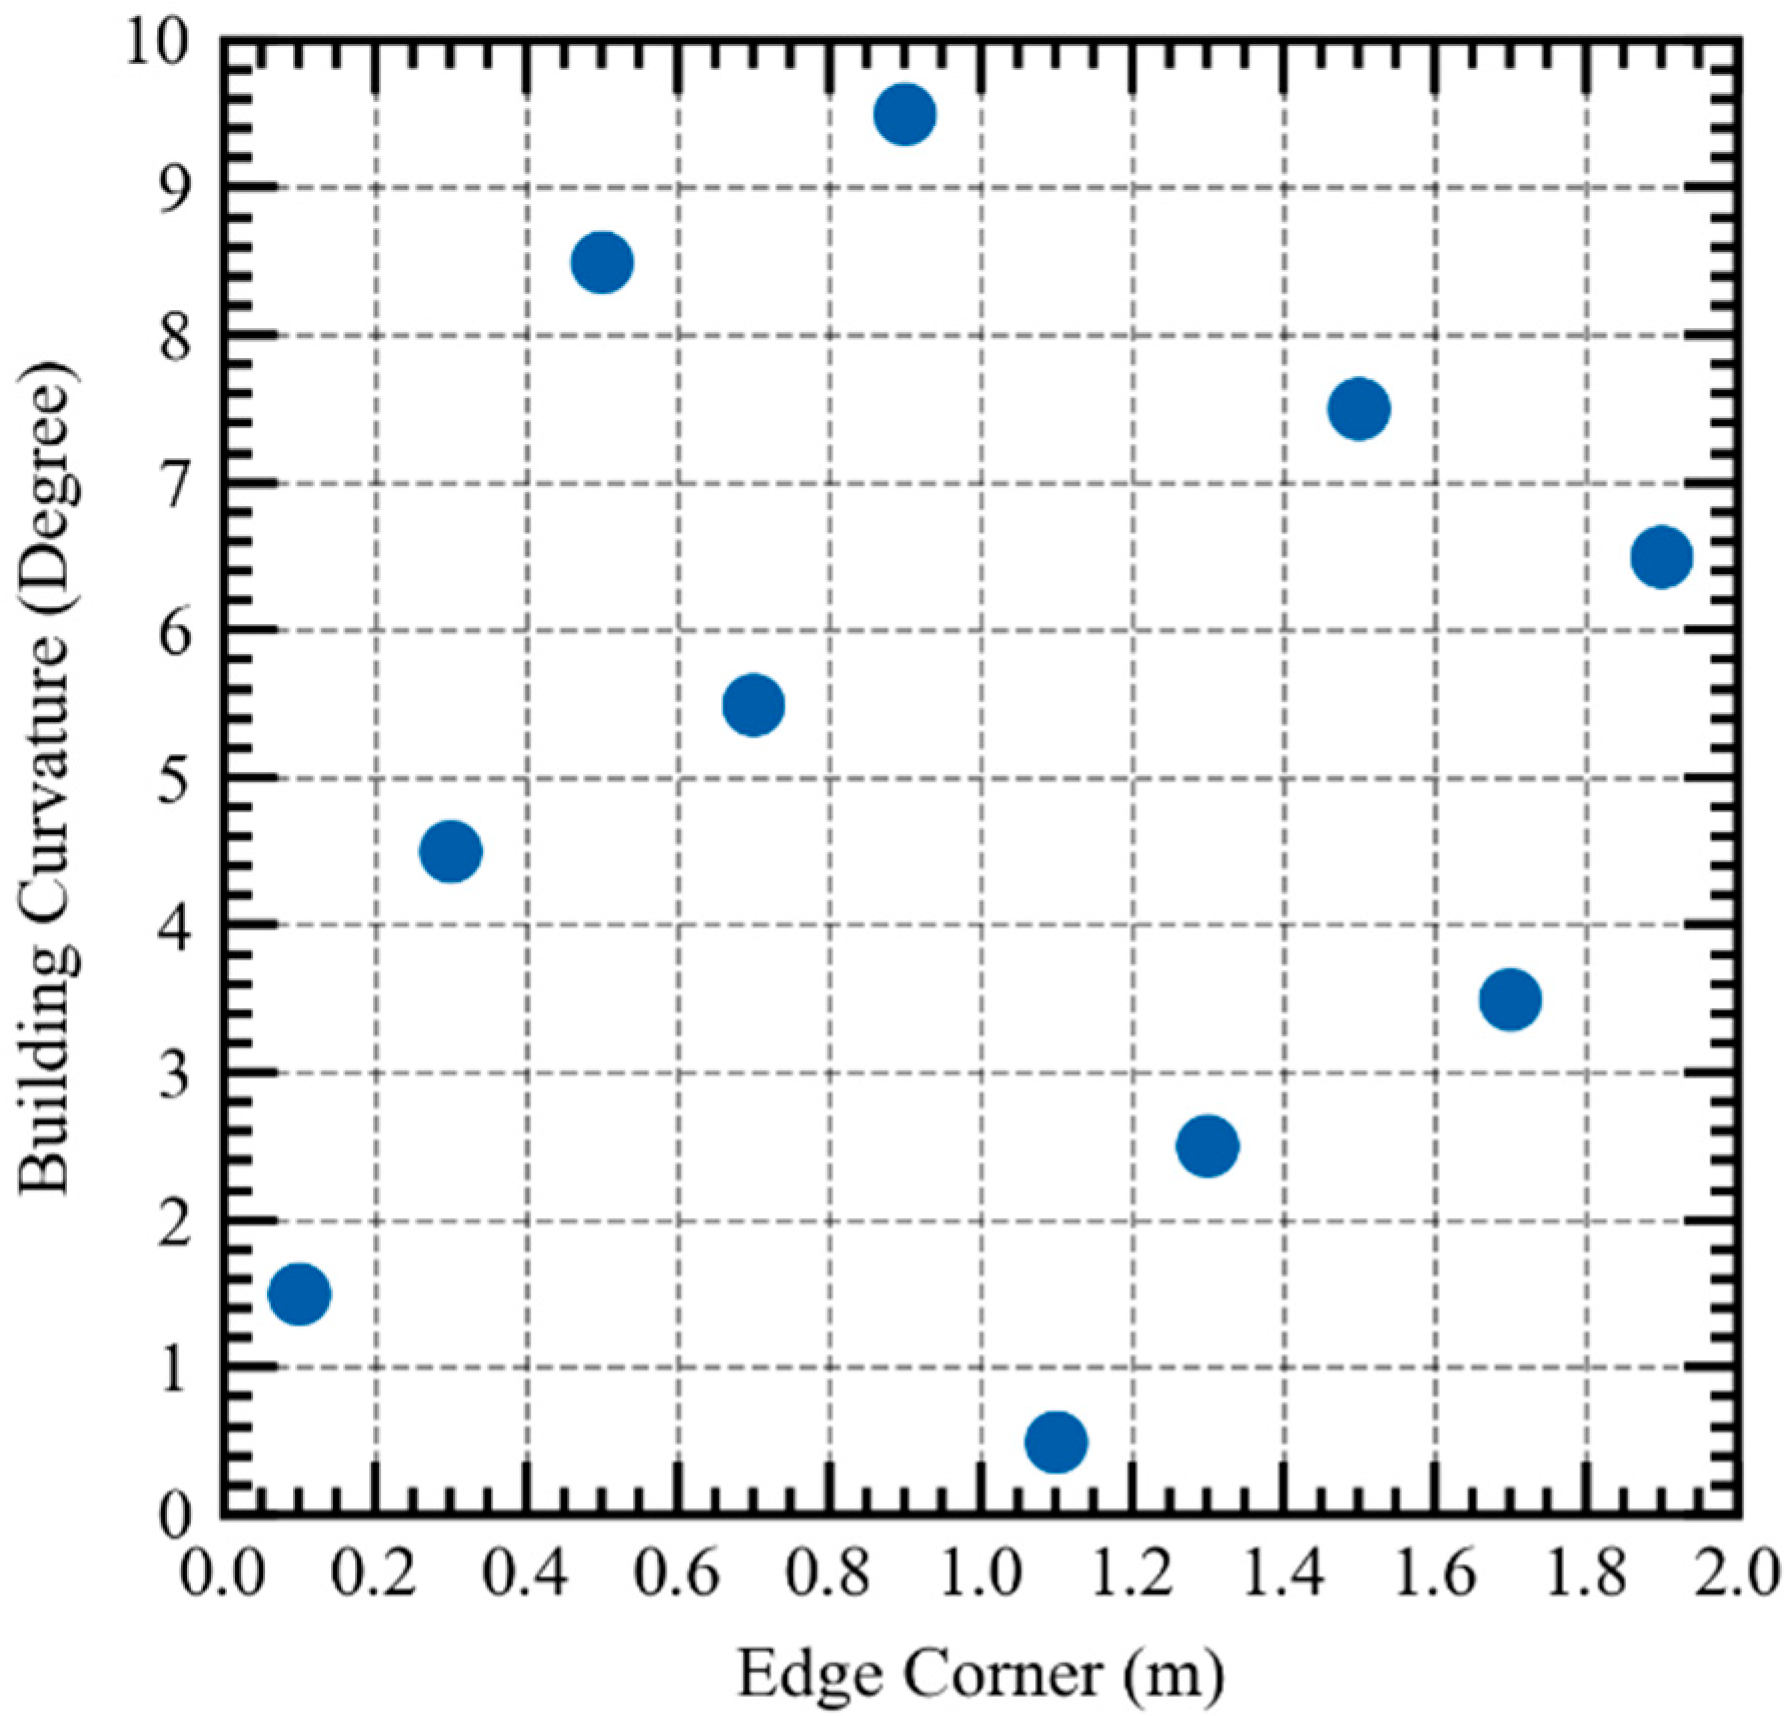
- Design of experiment (DOE) is generated randomly within the design domain limit of the identified design variables.
- -
- Objective function and its attributed limitations are constructed mathematically.
- -
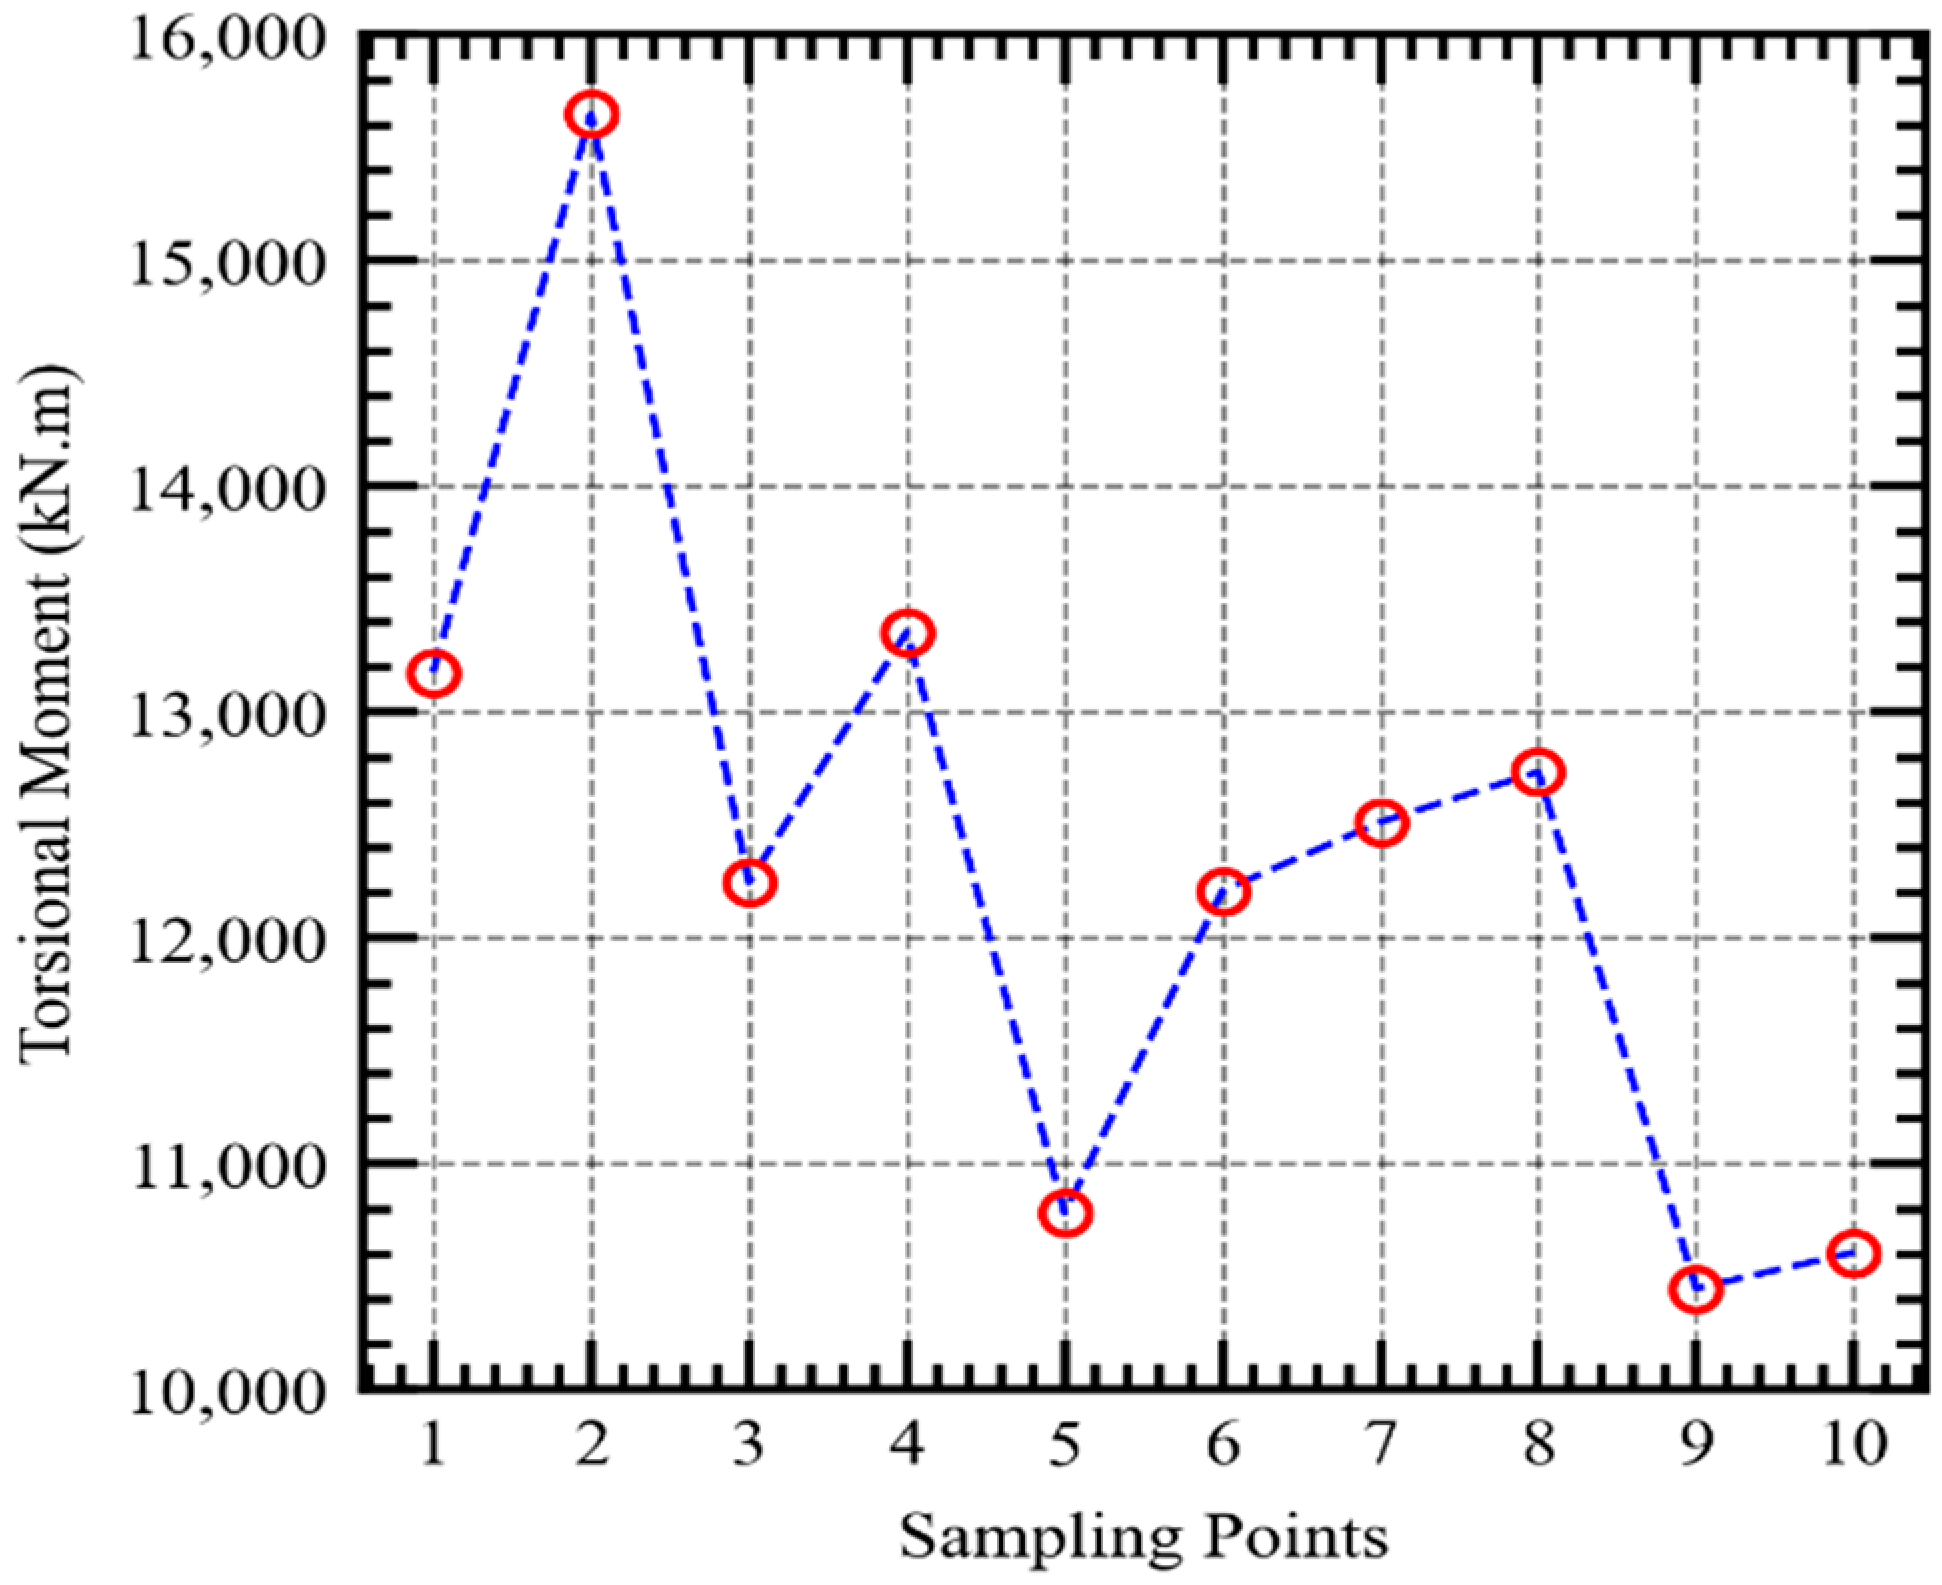
- Sampling points are then evaluated within the actual computationally expensive function (CFD-FSI-FEA) and interpolated against objective function to construct the surrogate model.
- -
- Additional random sample point is introduced to the design space.
- -
- Predicted value of the additional sample point is generated by the surrogate model, while its actual value is evaluated based on actual computational function (CFD-FSI-FEA)
- -
- Root mean square error is computed for the additional sample point between the predicted and actual value. The additional sample point is added to the design space as training data, and the sampling point’s k becomes k + 1.
- -
- Steps 5 to 8 are repeated to refine the surrogate model until a zero to near-zero error value is achieved.
- -
- The refined surrogate model is achieved where optimal function with its attributed design variables can be computed.
- -
- Optimal design variables obtained from the surrogate model are evaluated based on actual function to further ensure its accuracy and confidence.
4. Numerical Implementation
4.1. RBF Surrogate Model
4.1.1. Design of Experiment (DOE)
4.1.2. CFD Process
4.1.3. FSI Coupling
4.2. FE Analysis
Objective Function
5. Conclusions
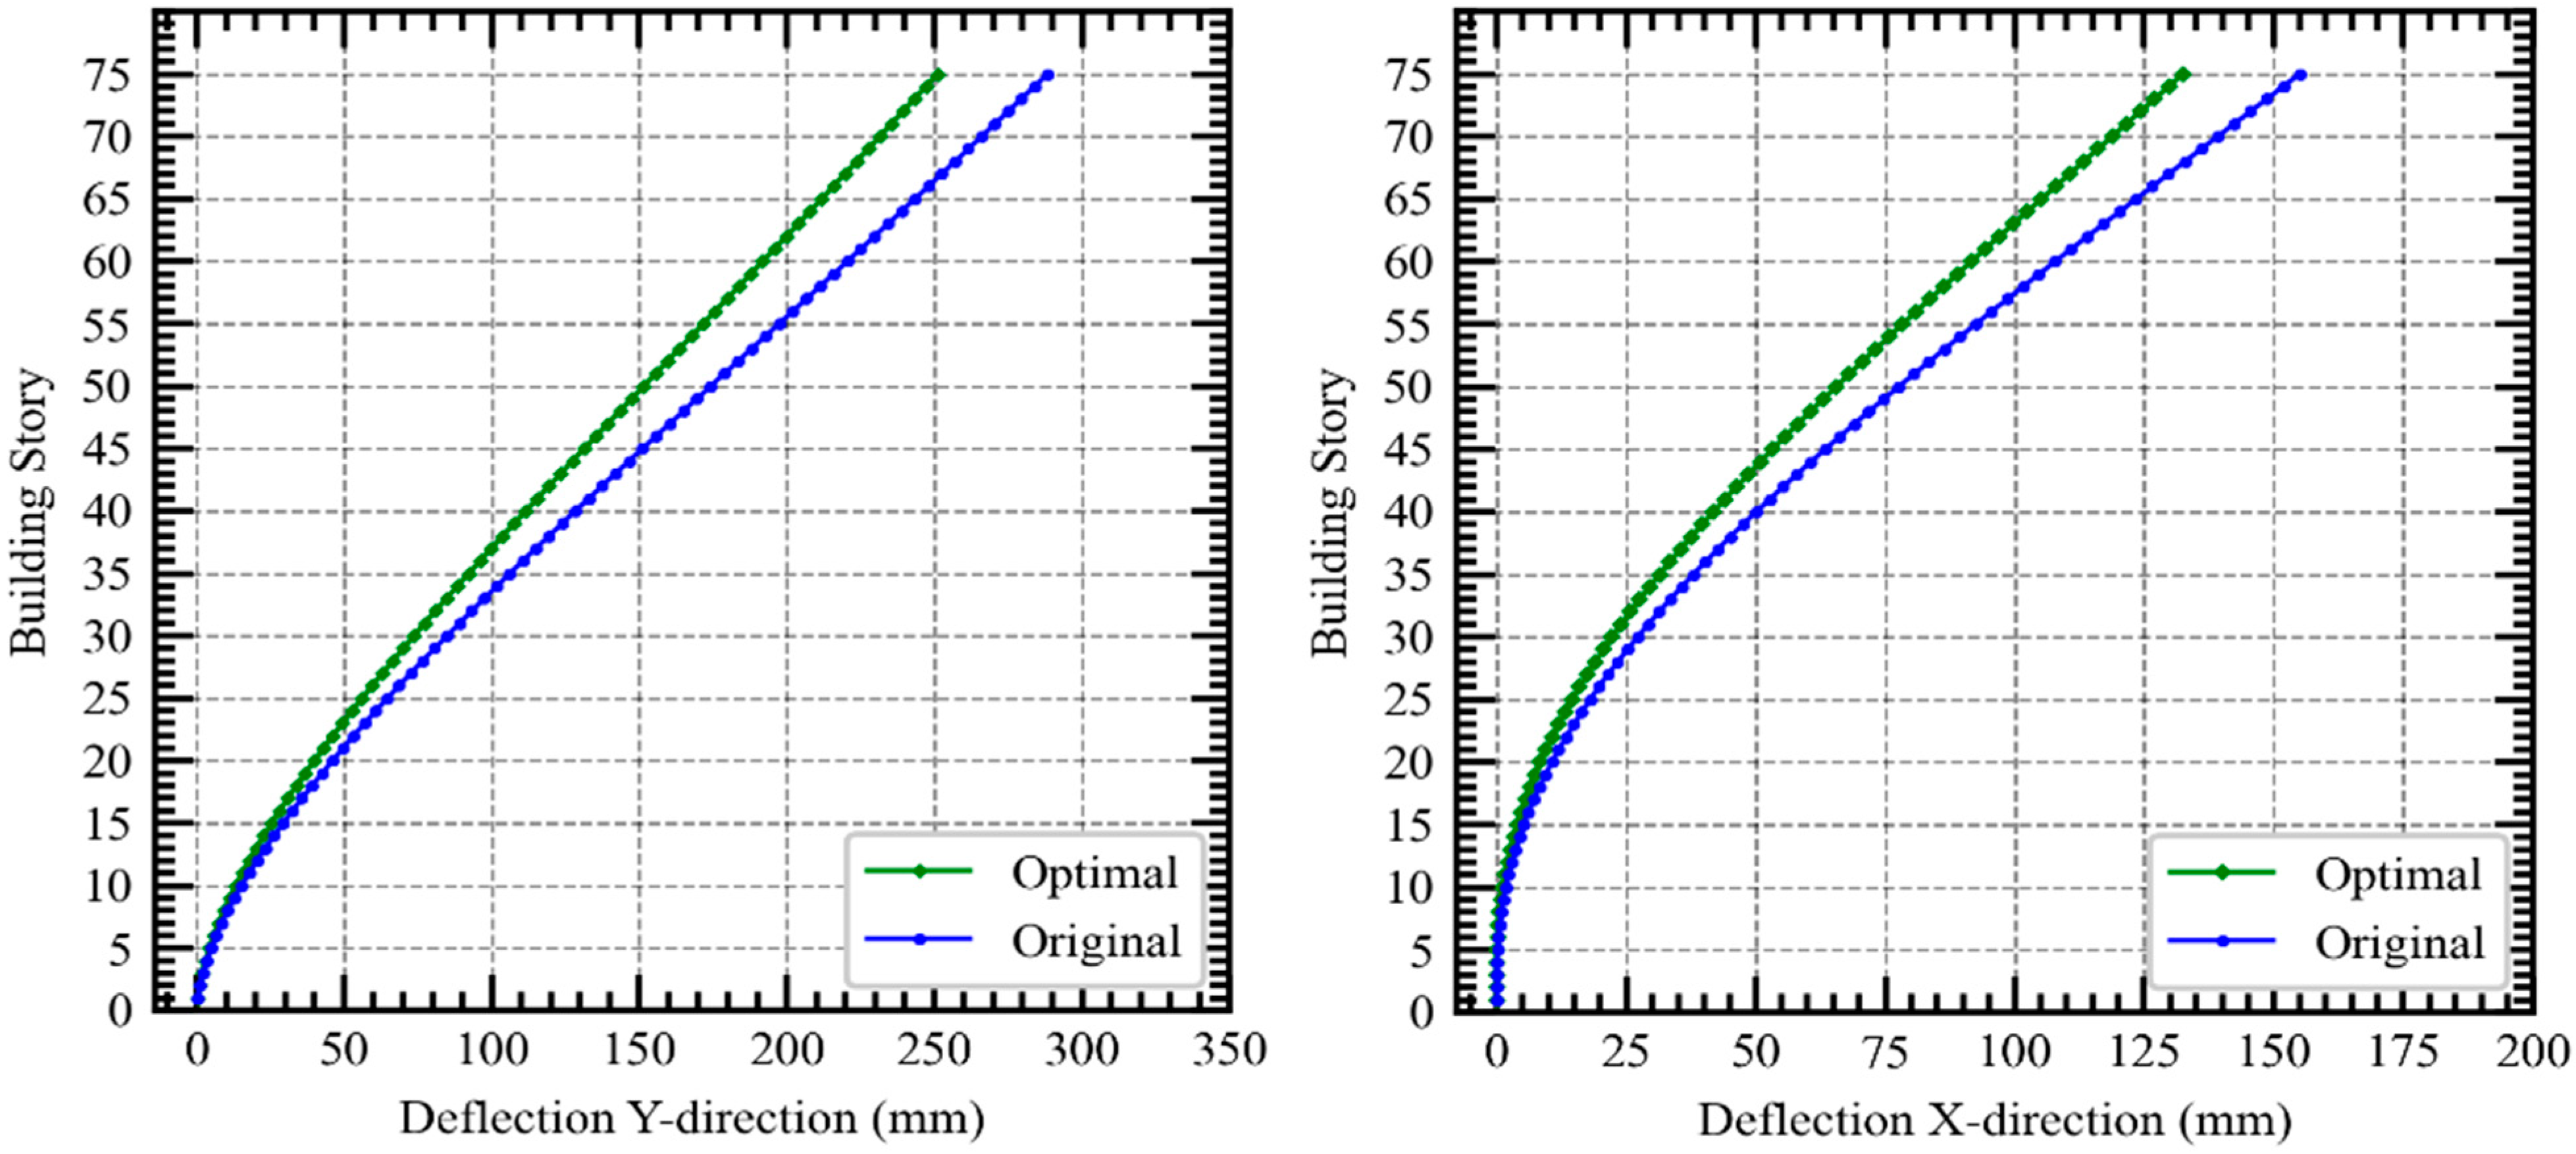
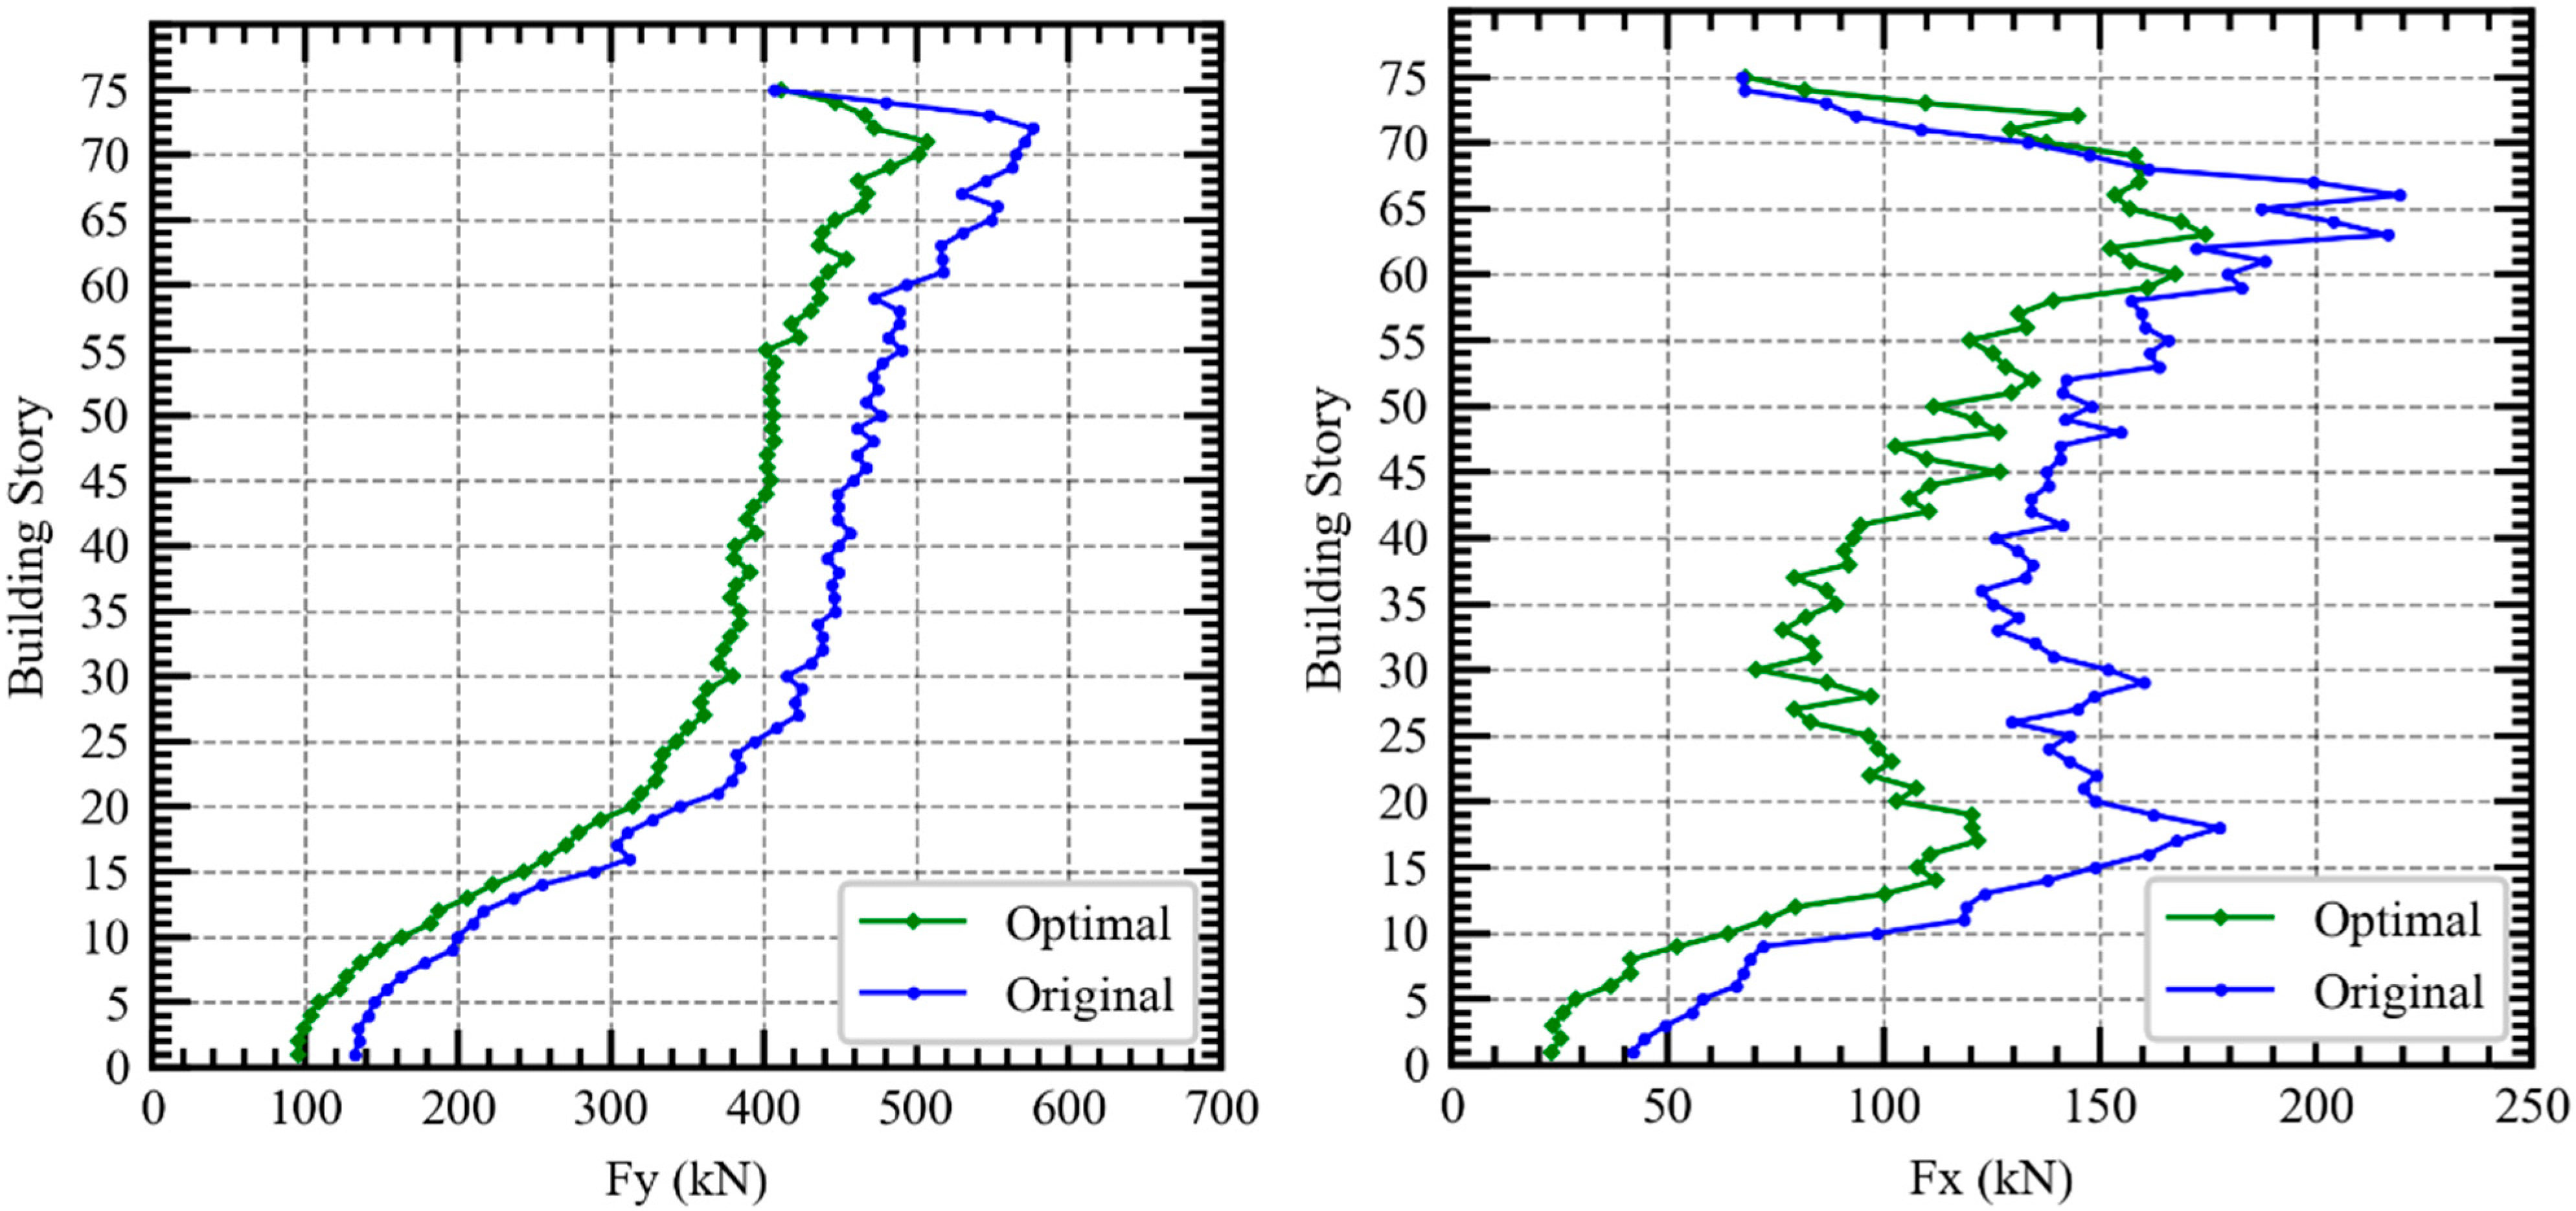
- Although only one wind direction was considered in this study, the results showed an effective minimization of structural responses on both along-wind and across-wind directions.
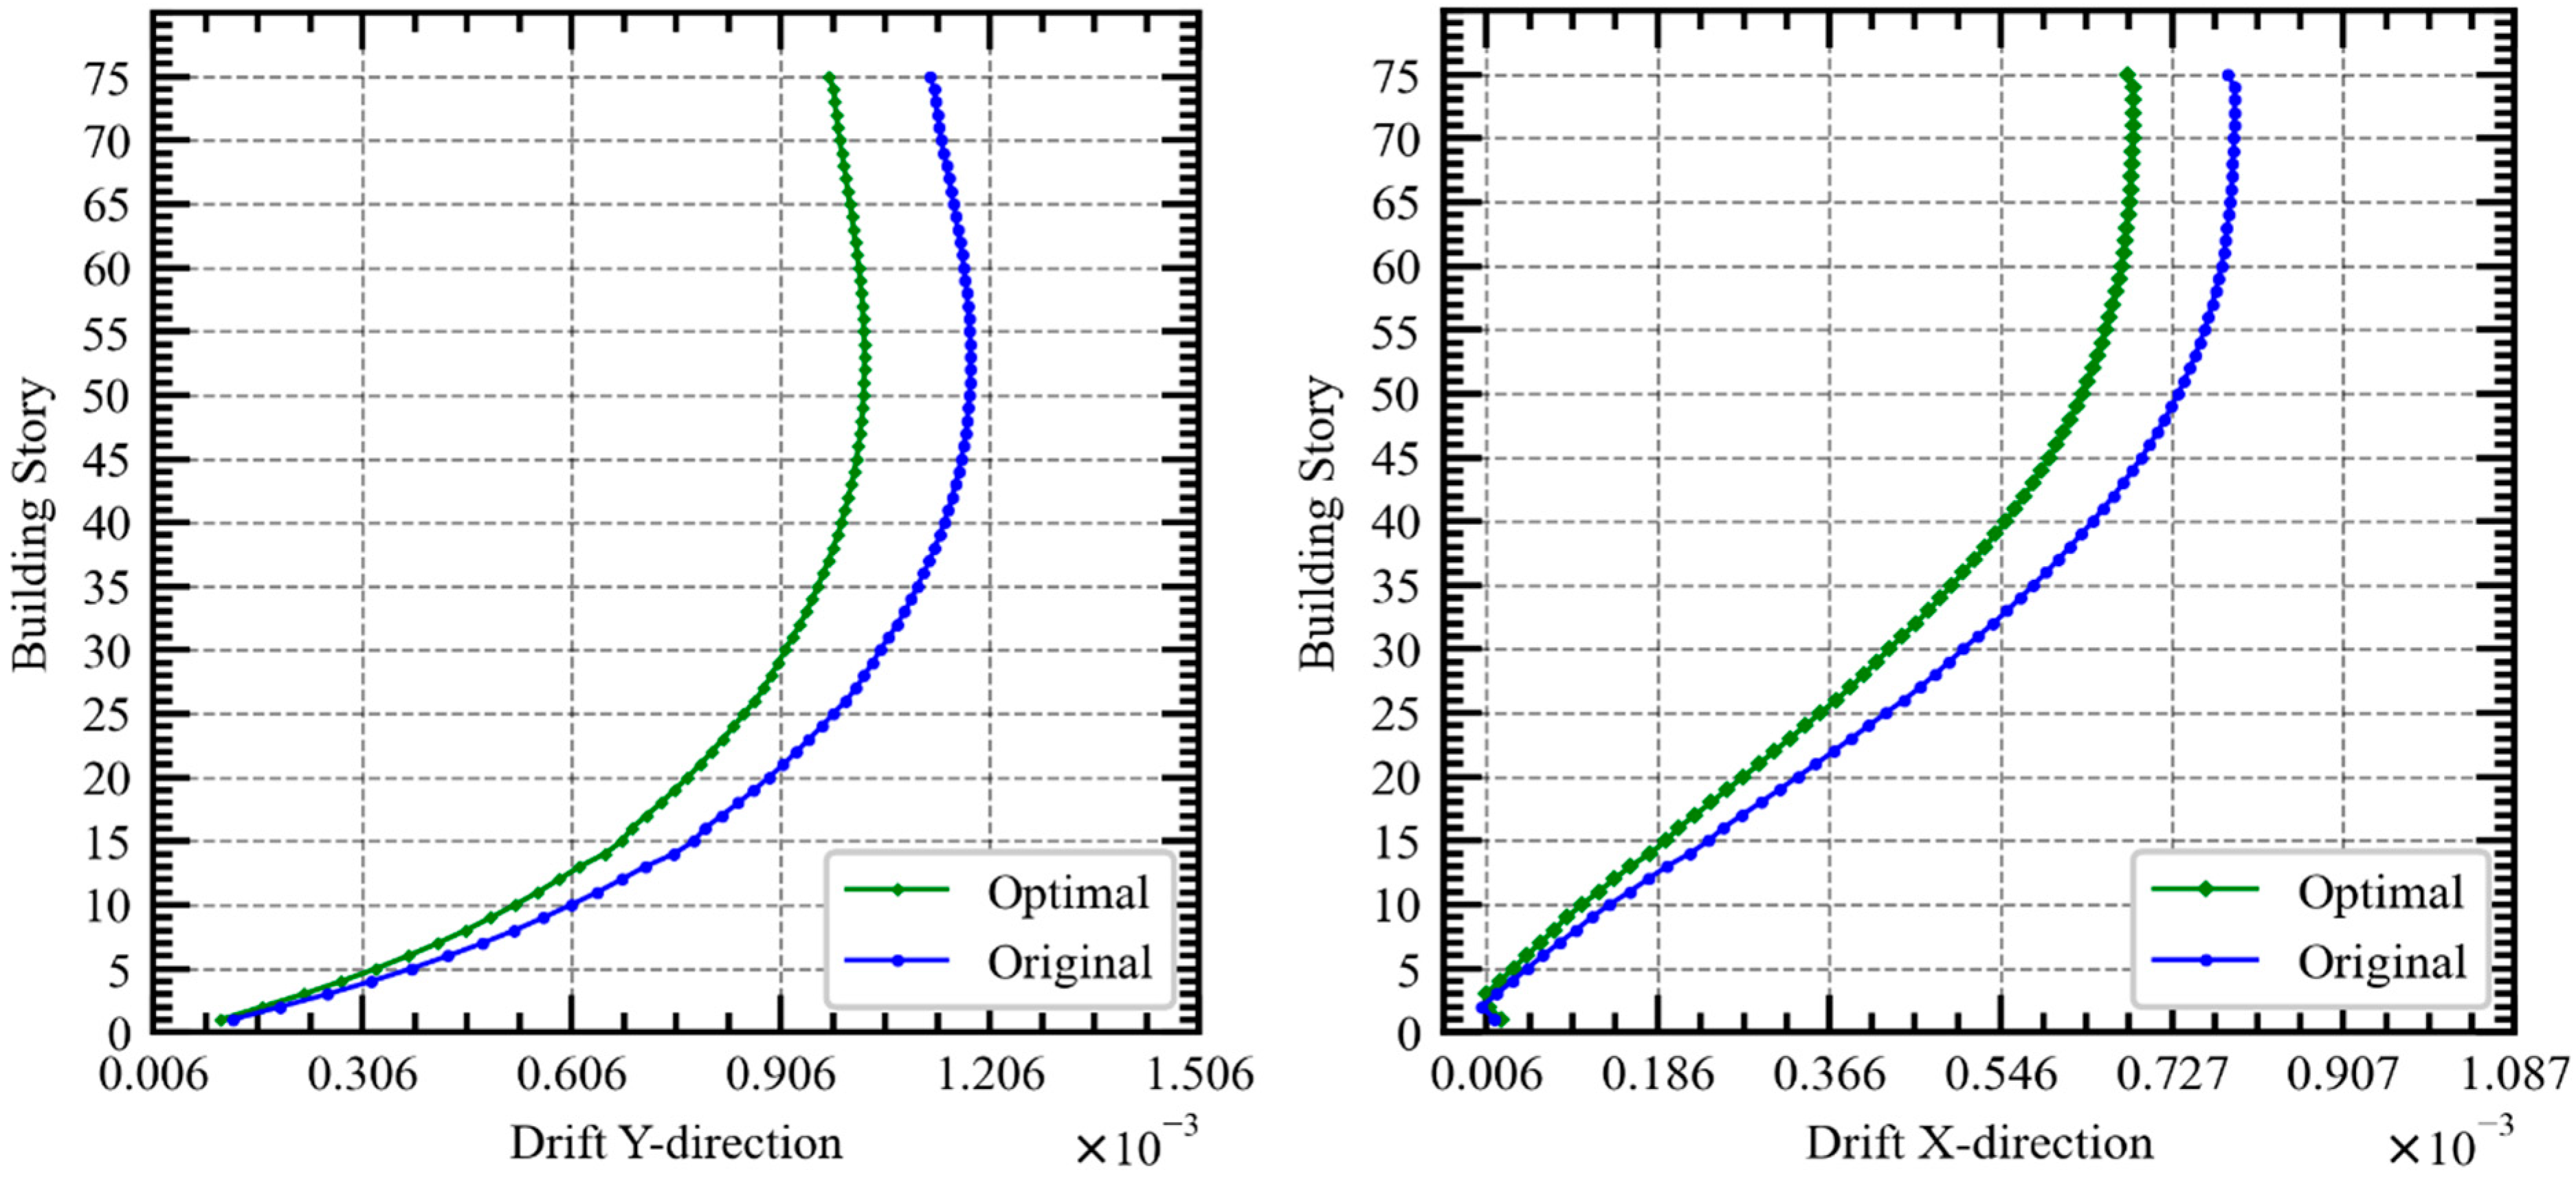
- The translated percentage of reduction in top structural deflection for both along-wind and across-wind are 12.95% and 14.53%, respectively.
- The translated percentage of reduction in inter-story drift for both along-wind and across-wind are 12.89% and 13.54%, respectively.
- The translated percentage of reduction in imposed wind loads for both along-wind and across-wind are 13.83% and 23.12%, respectively.
- The development of the surrogate model function showed to be effective in estimating highly non-linear functions in the case of large architectural problems.
- The efficiency of aerodynamic optimization together with the capability of computational tools are expected to encourage both architects and engineers to employ them while seeking better decisions at preliminary design stages.
- Adopting computational methods that integrate the requirements of both architects and engineers, as well as the evaluation with full interaction in a single virtual environment similar to what is presented in this paper, allows for a multidisciplinary design approach and connects both professions in more integrated manner.
Author Contributions
Funding
Institutional Review Board Statement
Informed Consent Statement
Data Availability Statement
Acknowledgments
Conflicts of Interest
References
- Oldfield, P. The Sustainable Tall Building: A Design Primer; Routledge: London, UK, 2019. [Google Scholar]
- Alkhatib, F.; Kasim, N.; Goh, W.I.; Al-masudi, A. Multidisciplinary Computational Optimization: An Integrated Approach to Achieve Sustainability in Tall Building Design at Early Stage-Review. In Proceedings of the 2021 Third International Sustainability and Resilience Conference: Climate Change, Sakheer, Bahrain, 15–16 November 2021; IEEE: Piscataway, NJ, USA, 2021; pp. 562–566. [Google Scholar]
- Hamidavi, T.; Abrishami, S.; Hosseini, M.R. Towards intelligent structural design of buildings: A BIM-based solution. J. Build. Eng. 2020, 32, 101685. [Google Scholar] [CrossRef]
- Elshaer, A.; Bitsuamlak, G.; El Damatty, A. Enhancing wind performance of tall buildings using corner aerodynamic optimization. Eng. Struct. 2017, 136, 133–148. [Google Scholar] [CrossRef]
- Sharma, A.; Mittal, H.; Gairola, A. Mitigation of wind load on tall buildings through aerodynamic modifications: Review. J. Build. Eng. 2018, 18, 180–194. [Google Scholar] [CrossRef]
- Hayashida, H.; Iwasa, Y. Aerodynamic shape effects of tall building for vortex induced vibration. J. Wind Eng. Ind. Aerodyn. 1990, 33, 237–242. [Google Scholar] [CrossRef]
- Kim, Y.; Tamura, Y.; Tanaka, H.; Ohtake, K.; Bandi, E.; Yoshida, A. Wind-induced responses of super-tall buildings with various atypical building shapes. J. Wind Eng. Ind. Aerodyn. 2014, 133, 191–199. [Google Scholar] [CrossRef]
- Bhattacharyya, B.; Dalui, S.K.; Ahuja, A.K. Wind induced pressure on ‘E’plan shaped tall buildings. Jordan J. Civ. Eng. 2014, 8, 120. [Google Scholar]
- Mou, B.; He, B.-J.; Zhao, D.-X.; Chau, K.-W. Numerical simulation of the effects of building dimensional variation on wind pressure distribution. Eng. Appl. Comput. Fluid Mech. 2017, 11, 293–309. [Google Scholar] [CrossRef]
- Paul, R.; Dalui, S. Shape optimization to reduce wind pressure on the surfaces of a rectangular building with horizontal limbs. Period. Polytech. Civ. Eng. 2021, 65, 134–149. [Google Scholar] [CrossRef]
- Kim, Y.-M.; You, K.-P. Dynamic responses of a tapered tall building to wind loads. J. Wind Eng. Ind. Aerodyn. 2002, 90, 1771–1782. [Google Scholar] [CrossRef]
- Kim, Y.-M.; You, K.-P.; Ko, N.-H. Across-wind responses of an aeroelastic tapered tall building. J. Wind Eng. Ind. Aerodyn. 2008, 96, 1307–1319. [Google Scholar] [CrossRef]
- Xie, J. Aerodynamic optimization of super-tall buildings and its effectiveness assessment. J. Wind Eng. Ind. Aerodyn. 2014, 130, 88–98. [Google Scholar] [CrossRef]
- Bairagi, A.K.; Dalui, S.K. Advances in Structures, Systems and Materials; Springer: Singapore, 2020; pp. 31–38. [Google Scholar]
- Bairagi, A.K.; Dalui, S.K. Comparison of aerodynamic coefficients of setback tall buildings due to wind load. Asian J. Civ. Eng. 2018, 19, 205–221. [Google Scholar] [CrossRef]
- Dutton, R.; Isyumov, N. Reduction of tall building motion by aerodynamic treatments. J. Wind Eng. Ind. Aerodyn. 1990, 36, 739–747. [Google Scholar] [CrossRef]
- Ruiz, C.A.; Kalkman, I.; Blocken, B. Aerodynamic design optimization of ducted openings through high-rise buildings for wind energy harvesting. Build. Environ. 2021, 202, 108028. [Google Scholar] [CrossRef]
- Tamura, T.; Miyagi, T.; Kitagishi, T. Numerical prediction of unsteady pressures on a square cylinder with various corner shapes. J. Wind Eng. Ind. Aerodyn. 1998, 74, 531–542. [Google Scholar] [CrossRef]
- Miyashita, K.; Katagiri, J.; Nakamura, O.; Ohkuma, T.; Tamura, Y.; Itoh, M.; Mimachi, T. Wind-induced response of high-rise buildings effects of corner cuts or openings in square buildings. J. Wind Eng. Ind. Aerodyn. 1993, 50, 319–328. [Google Scholar] [CrossRef]
- Kwok, K. Effect of building shape on wind-induced response of tall building. J. Wind Eng. Ind. Aerodyn. 1988, 28, 381–390. [Google Scholar] [CrossRef]
- Tamura, T.; Miyagi, T. The effect of turbulence on aerodynamic forces on a square cylinder with various corner shapes. J. Wind Eng. Ind. Aerodyn. 1999, 83, 135–145. [Google Scholar] [CrossRef]
- Tse, K.-T.; Hitchcock, P.A.; Kwok, K.C.; Thepmongkorn, S.; Chan, C.M. Economic perspectives of aerodynamic treatments of square tall buildings. J. Wind Eng. Ind. Aerodyn. 2009, 97, 455–467. [Google Scholar] [CrossRef]
- Zhengwei, Z.; Yonga, Q.; Minga, G.; Nankuna, T.; Yongc, X. Effects of corner recession modification on aerodynamic coefficients of square tall buildings. In Proceedings of the Seventh International Colloquium on Bluff Body Aerodynamics and Applications, Shanghai, China, 2–6 September 2012. [Google Scholar]
- Li, Y.; Tian, X.; Tee, K.F.; Li, Q.-S.; Li, Y.-G. Aerodynamic treatments for reduction of wind loads on high-rise buildings. J. Wind Eng. Ind. Aerodyn. 2018, 172, 107–115. [Google Scholar] [CrossRef]
- Thordal, M.S.; Bennetsen, J.C.; Capra, S.; Kragh, A.K.; Koss, H.H.H. Towards a standard CFD setup for wind load assessment of high-rise buildings: Part 2—Blind test of chamfered and rounded corner high-rise buildings. J. Wind Eng. Ind. Aerodyn. 2020, 205, 104282. [Google Scholar] [CrossRef]
- Mandal, S.; Dalui, S.K.; Bhattacharjya, S. Wind induced response of corner modified ‘U’ plan shaped tall building. Wind. Struct. 2021, 32, 521–537. [Google Scholar]
- Kwok, K.C.; Bailey, P.A. Aerodynamic devices for tall buildings and structures. J. Eng. Mech. 1987, 113, 349–365. [Google Scholar] [CrossRef]
- Gaur, N.; Raj, R. Aerodynamic mitigation by corner modification on square model under wind loads employing CFD and wind tunnel. Ain Shams Eng. J. 2022, 13, 101521. [Google Scholar] [CrossRef]
- Sanyal, P.; Dalui, S.K. Forecasting of aerodynamic coefficients of tri-axially symmetrical Y plan shaped tall building based on CFD data trained ANN. J. Build. Eng. 2022, 47, 103889. [Google Scholar] [CrossRef]
- Gu, M.; Quan, Y. Across-wind loads of typical tall buildings. J. Wind Eng. Ind. Aerodyn. 2004, 92, 1147–1165. [Google Scholar] [CrossRef]
- Tanaka, H.; Tamura, Y.; Ohtake, K.; Nakai, M.; Kim, Y.C. Experimental investigation of aerodynamic forces and wind pressures acting on tall buildings with various unconventional configurations. J. Wind Eng. Ind. Aerodyn. 2012, 107, 179–191. [Google Scholar] [CrossRef]
- Tamura, Y.; Kim, Y.; Tanaka, H.; Bandi, E.; Yoshida, A.; Ohtake, K. Aerodynamic and response characteristics of super-tall buildings with various configurations. In Proceedings of the 8th Asia-Pacific Conference on Wind Engineering, Chennai, India, 10–14 December 2013. [Google Scholar]
- Baghaei Daemei, A.; Mehrinejad Khotbehsara, E.; Malekian, E.; Bahrami, P. Study on wind aerodynamic and flow characteristics of triangular-shaped tall buildings and CFD simulation in order to assess drag coefficient. Ain Shams Eng. J. 2019, 10, 541–548. [Google Scholar] [CrossRef]
- Assainar, N.; Dalui, S.K. Aerodynamic analysis of pentagon-shaped tall buildings. Asian J. Civ. Eng. 2021, 22, 33–48. [Google Scholar] [CrossRef]
- Huang, M.; Li, Q.; Chan, C.M.; Lou, W.; Kwok KC, S.; Li, G. Performance-based design optimization of tall concrete framed structures subject to wind excitations. J. Wind Eng. Ind. Aerodyn. 2015, 139, 70–81. [Google Scholar] [CrossRef]
- Melbourne, W. Comparison of measurements on the CAARC standard tall building model in simulated model wind flows. J. Wind Eng. Ind. Aerodyn. 1980, 6, 73–88. [Google Scholar] [CrossRef]
- Meng, F.-Q.; He, B.-J.; Zhu, J.; Zhao, D.-X.; Darko, A.; Zhao, Z.-Q. Sensitivity analysis of wind pressure coefficients on CAARC standard tall buildings in CFD simulations. J. Build. Eng. 2018, 16, 146–158. [Google Scholar] [CrossRef]
- Franke, J.; Hellsten, A.; Schlünzen, K.; Carissimo, B. Best practice guideline for the CFD simulation of flows in the urban environment-a summary. In Proceedings of the 11th Conference on Harmonisation within Atmospheric Dispersion Modelling for Regulatory Purposes, Cambridge, UK, 2–5 July 2007; Cambridge Environmental Research Consultants: Cambridge, UK, 2007. [Google Scholar]
- Zhao, D.-X.; He, B.-J. Effects of architectural shapes on surface wind pressure distribution: Case studies of oval-shaped tall buildings. J. Build. Eng. 2017, 12, 219–228. [Google Scholar] [CrossRef]
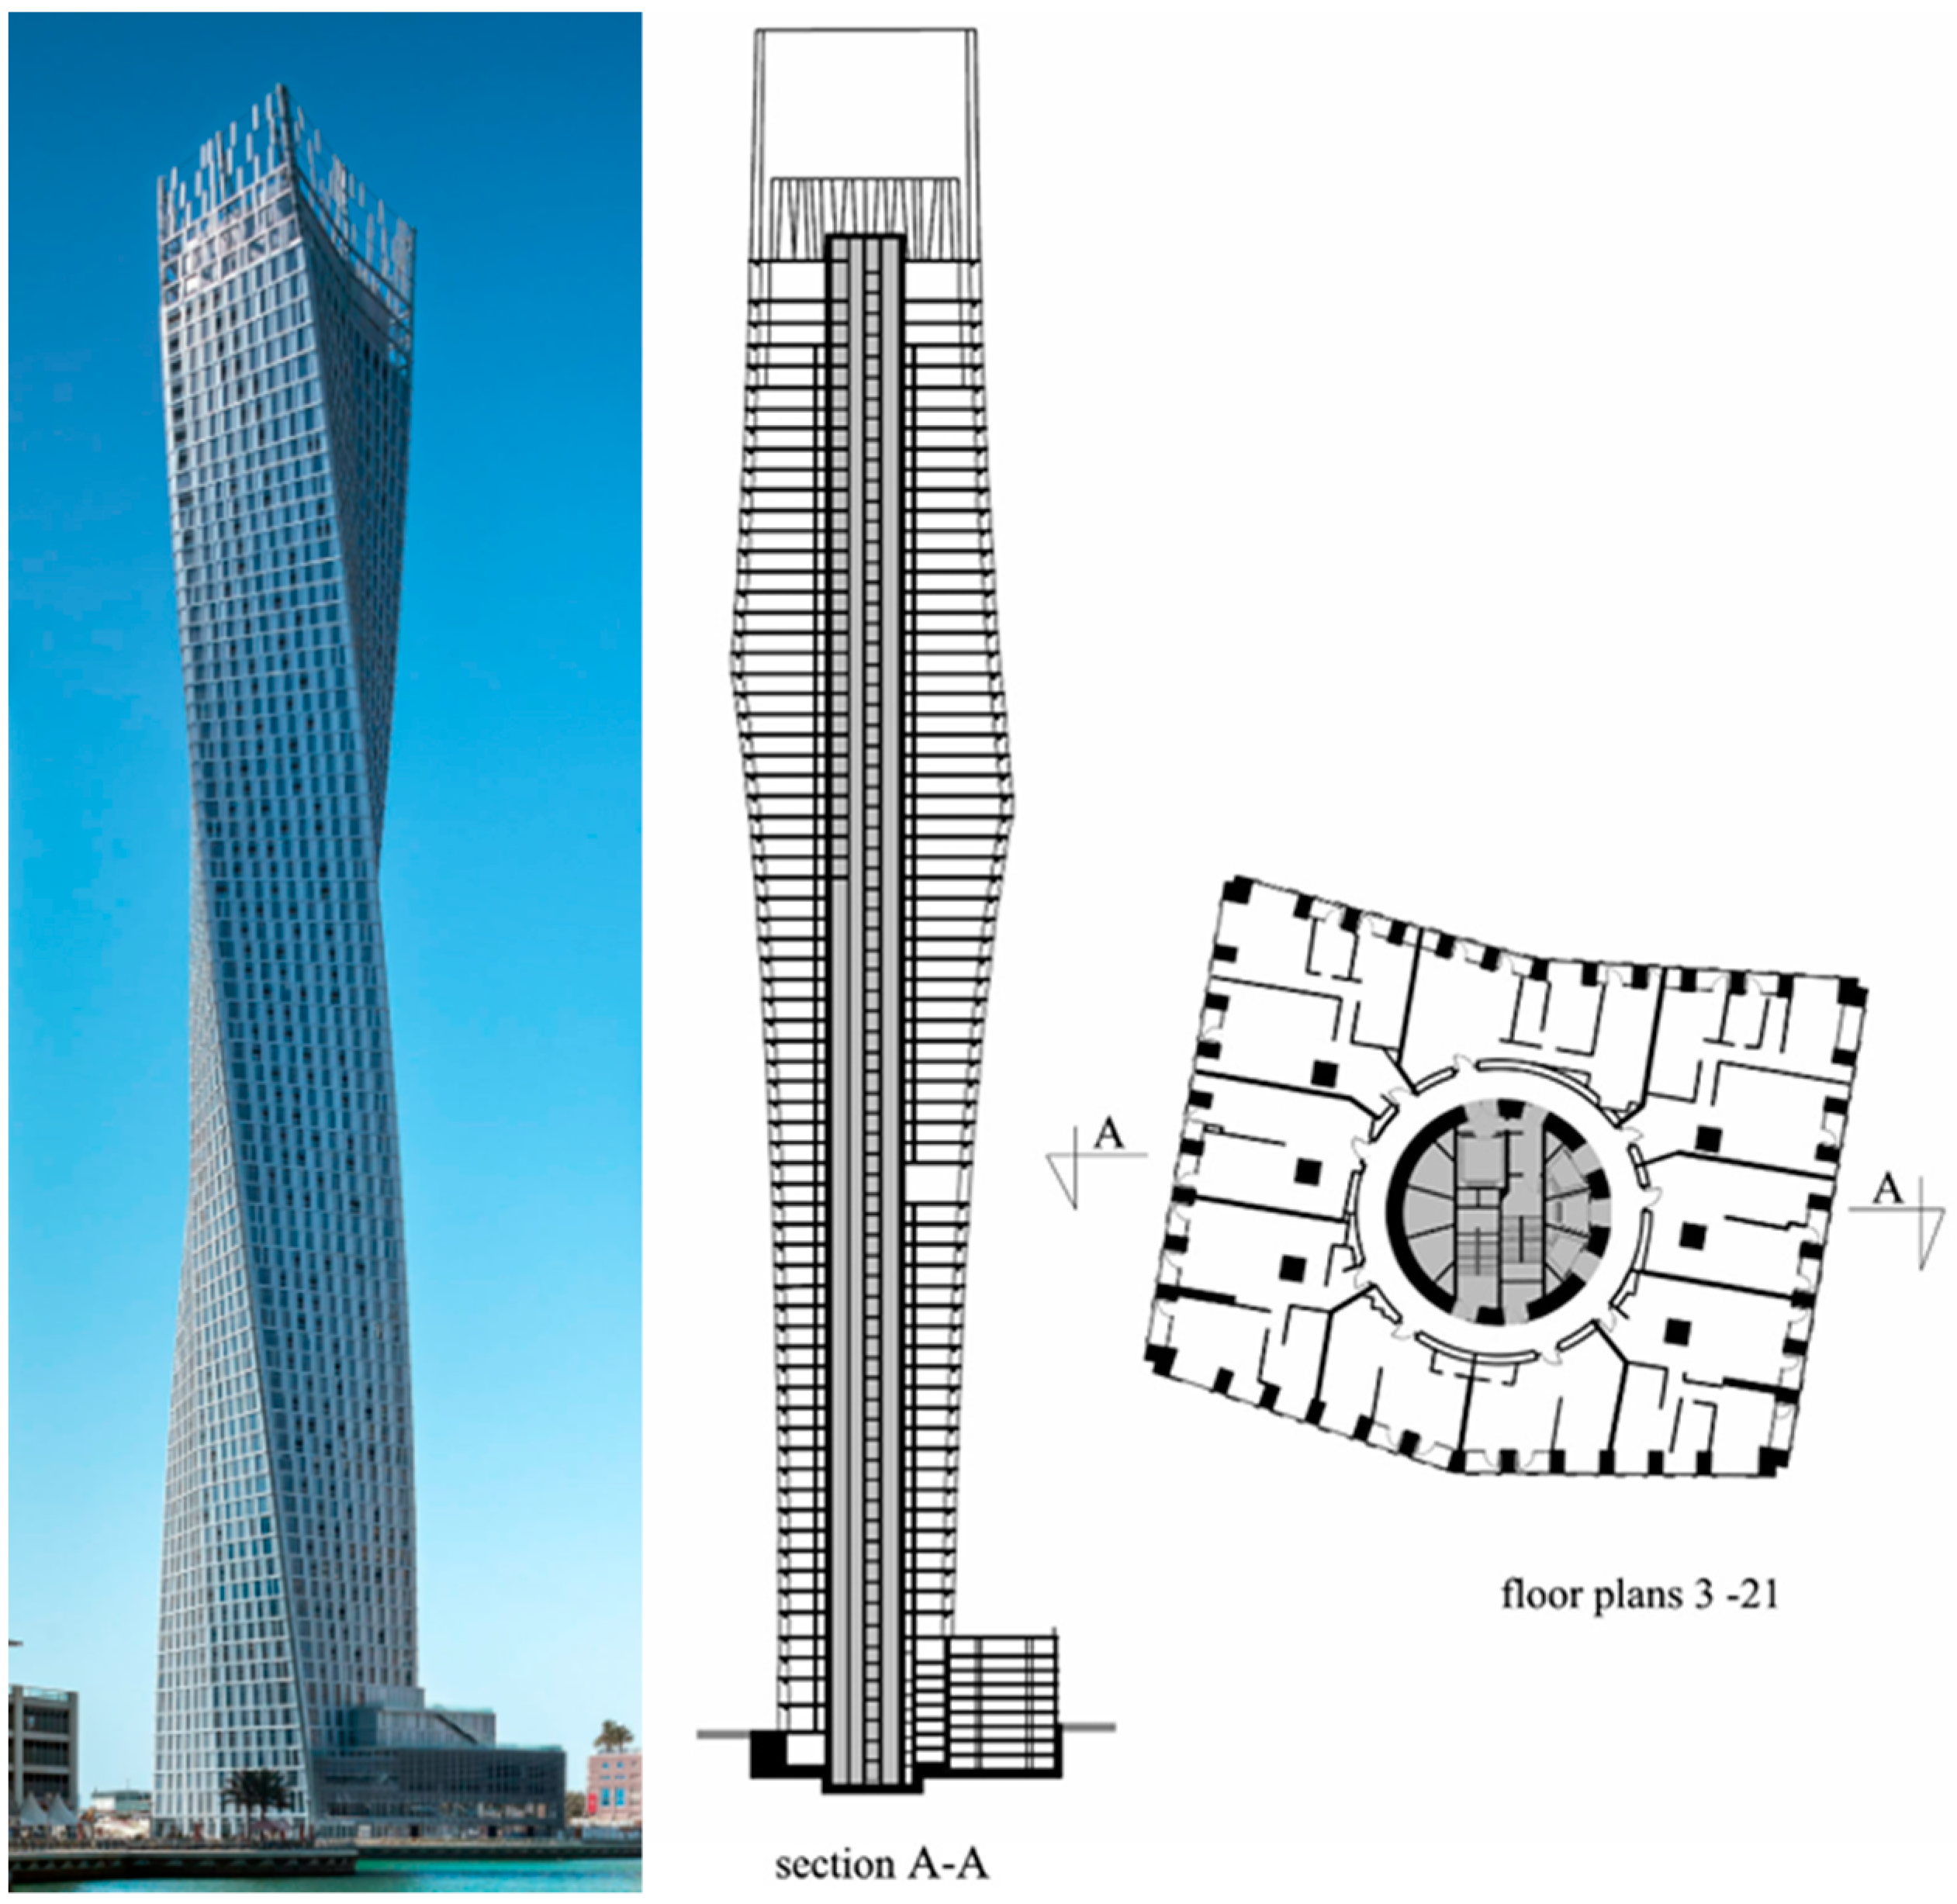
- Golasz-Szolomicka, H.; Szolomicki, J. Architectural and structural analysis of selected twisted tall buildings. IOP Conf. Ser. Mater. Sci. Eng. 2019, 471, 052050. [Google Scholar] [CrossRef]
- Moore, W.O.W.; Mala-Jetmarova, H.; Gebreslassie, M.; Tabor, G.R.; Belmont, M.R.; Savic, D.A. Comparison of multiple surrogates for 3D CFD model in tidal farm optimisation. Procedia Eng. 2016, 154, 1132–1139. [Google Scholar] [CrossRef] [Green Version]
- Wortmann, T. Opossum-introducing and evaluating a model-based optimization tool for grasshopper. In Proceedings of the 22nd International Conference of the Association for Computer-Aided Architectural Design Research in Asia (CAADRIA), Hong Kong, 5–8 April 2017. [Google Scholar]
- Navid, A.; Khalilarya, S.; Abbasi, M. Diesel engine optimization with multi-objective performance characteristics by non-evolutionary Nelder-Mead algorithm: Sobol sequence and Latin hypercube sampling methods comparison in DoE process. Fuel 2018, 228, 349–367. [Google Scholar] [CrossRef]
- Habibullah, A. ETABS Nonlinear, Three Dimensional Analysis and Design of Building Systems; Computer and Structures, Inc.: Berkeley, CA, USA, 1998. [Google Scholar]
- Mooneghi, M.A.; Kargarmoakhar, R. Aerodynamic Mitigation and Shape Optimization of Buildings: Review. J. Build. Eng. 2016, 6, 225–235. [Google Scholar] [CrossRef]
- Auwalu, A.S.; Noor, N.; Shazwan, M.; Shah, A.; Umar, S.; Amran, M.; Adamu, M.; Vatin, N.I.; Fediuk, R. Performance of Steel-Bolt-Connected Industrialized Building System Frame Subjected to Hydrodynamic Force. Appl. Sci. 2022, 12, 5093. [Google Scholar] [CrossRef]
- Yip, C.C.; Wong, J.Y.; Amran, M.; Fediuk, R.; Vatin, N.I. Reliability Analysis of Reinforced Concrete Structure with Shock Absorber Damper under Pseudo-Dynamic Loads. Materials 2022, 15, 2688. [Google Scholar] [CrossRef]
- Yip, C.C.; Marsono, A.K.; Wong, J.Y.; Amran, M.Y.H. Flexural strength of special reinforced lightweight concrete beam for Industrialised Building System (IBS). J. Teknol. 2015, 77, 187–196. [Google Scholar] [CrossRef] [Green Version]


| No | Author | Year | Method | Class | Modification | Approach/Aim |
|---|---|---|---|---|---|---|
| 1 | Kwok and Bailey [27] | 1987 | BLWT | Minor | Slotted corners, fins, vented fins | Investigating the impact of aerodynamic devices on wind-induced responses of tall buildings. |
| 2 | Kwok [20] | 1988 | BLWT | Minor | Chamfering corners, slotting corners | Measuring mean wind displacement response. |
| 3 | Hayashida and Iwasa [6] | 1990 | BLWT | Major | Circular, triangular, and Y-shaped layout plan | Evaluating aerodynamic effect on dynamic response behavior of buildings. |
| 4 | Dutton and Isyumov [16] | 1990 | BLWT | Major | Opening | Evaluating wind response and building forces based on high-frequency force balance technique. |
| 5 | Miyashita et al. [19] | 1993 | BLWT | Minor | Chamfering corners, opening | Evaluating wind-induced building response through modal analysis. |
| 6 | Tamura et al. [18] | 1998 | CFD | Minor | Chamfering corners, rounding corners | Evaluating aerodynamic characteristics such as Reynolds number and fluctuation of drag and lift forces. |
| 7 | Tamura and Miyagi [21] | 1999 | BLWT | Minor | Corner chamfering, corner rounding | Measuring of aerodynamic quantities, such as averaged and fluctuating statistics of lift and drag forces. |
| 8 | Kim and You [11] | 2002 | BLWT | Major | Tapering | Evaluating mean and RMS-force coefficients and power spectral density functions. |
| 9 | Gu and Quan [30] | 2004 | BLWT | Major/Minor | Square and rectangular plan, with corner chamfering and recession | Evaluating across-wind dynamic forces based on high-frequency force balance technique. |
| 10 | Kim et al. [12] | 2008 | BLWT | Major | Tapering | Investigating the reduction in RMS across-wind displacement responses. |
| 11 | Tse et al. [22] | 2009 | BLWT | Minor | Corner chamfering, corner recessions | Evaluating wind forces using high-frequency force balance technique for building models. |
| 12 | Zhengwei et al. [23] | 2012 | BLWT | Minor | Corner recessions | Analyzing mean and RMS coefficients of the aerodynamic base moment and torque. |
| 13 | Tanaka et al. [31] | 2012 | BLWT | Major/Minor | Twisting, opening, helical, corner chamfering, corner recessions | Investigating aerodynamic wind forces and wind pressures based on high-frequency force balance technique. |
| 14 | Tamura et al. [32] | 2013 | CFD | Major/Minor | Cross-section configurations | Investigating variations in peak pressures, aerodynamic and response characteristics, wind load combination effects, and flow field characteristics. |
| 15 | Xie [13] | 2014 | BLWT | Major | Tapering, twisting, stepping | Measuring dynamic force coefficient using power spectra approach. |
| 16 | Kim et al. [7] | 2014 | BLWT | Major | Atypical building shapes | Comparing wind load effects by conducting time history analysis. |
| 17 | Bhattacharyya et al. [8] | 2014 | CFD | Major | E-shaped building plan | Evaluating mean pressure coefficient of all building faces. |
| 18 | Mou et al. [9] | 2017 | CFD | Major | Building dimension variations | Investigating wind pressure distribution due to dimension ratio alteration. |
| 19 | Elshaer et al. [4] | 2017 | CFD | Minor | Corner configuration | Optimizing mean drag coefficient and standard deviation. |
| 20 | Bairagi and Dalui [15] | 2018 | CFD | Major | Single setback, double setback | Evaluating pressure, forces, and torsional moment coefficients. |
| 21 | Li et al. [24] | 2018 | BLWT | Minor | Corner configuration | Evaluating mean wind pressure coefficients, base moment coefficients, local wind force coefficients, power spectral densities, and vertical correlation coefficients. |
| 22 | Daemei et al. [33] | 2019 | CFD | Major/Minor | Tapering, setback, helical, chamfering, recession, rounding | Assessing aerodynamic efficiency behavior of along-wind responses based on drag coefficient. |
| 23 | Thordal et al. [25] | 2020 | CFD | Minor | Corner chamfering, corner rounding | Investigating surface pressure distribution, peak predicted structural responses, and floor loadings. |
| 24 | Bairagi and Dalui [14] | 2020 | CFD | Major | Setback | Measuring wind pressure distribution around building. |
| 25 | Mandal et al. [26] | 2021 | CFD | Minor | Corner chamfering and corner rounding on U-shaped building plan | Exploring wind resistance design parameters of force coefficient and pressure coefficients. |
| 26 | Ruiz et al. [17] | 2021 | CFD | Major | Opening (diameter and fillet radius) | Evaluating magnitude and uniformity of the wind speed and optimizing turbulent kinetic energy. |
| 27 | Assainar and Dalui [34] | 2021 | CFD | Major/Minor | Pentagonal plan with corner configuration, setback, and tapering forms | Evaluating forces and pressure coefficients and investigating structural dynamic behavior of building. |
| 28 | Paul and Dalui [10] | 2021 | CFD | Major | Horizontal limps on building plan | Evaluating the external pressure coefficients on building faces. |
| 29 | Gaur and Raj [28] | 2022 | CFD | Minor | Corner-cut configuration | Evaluating force coefficients, base moments, power spectra, external surface pressure coefficients, and flow field characteristics. |
| 30 | Sanyal and Dalui [29] | 2022 | CFD | Minor | Corner-cut on Y-shaped plan | Evaluating wind-induced force, moment, and torsional coefficients. |
| Mesh Type | Coarse | Medium | Fine |
|---|---|---|---|
| Refinement | |||
| Grid Size (m) | 2.16 m | 1.52 m | 1.08 m |
| Cell no. | 196,460 | 285,120 | 445,312 |
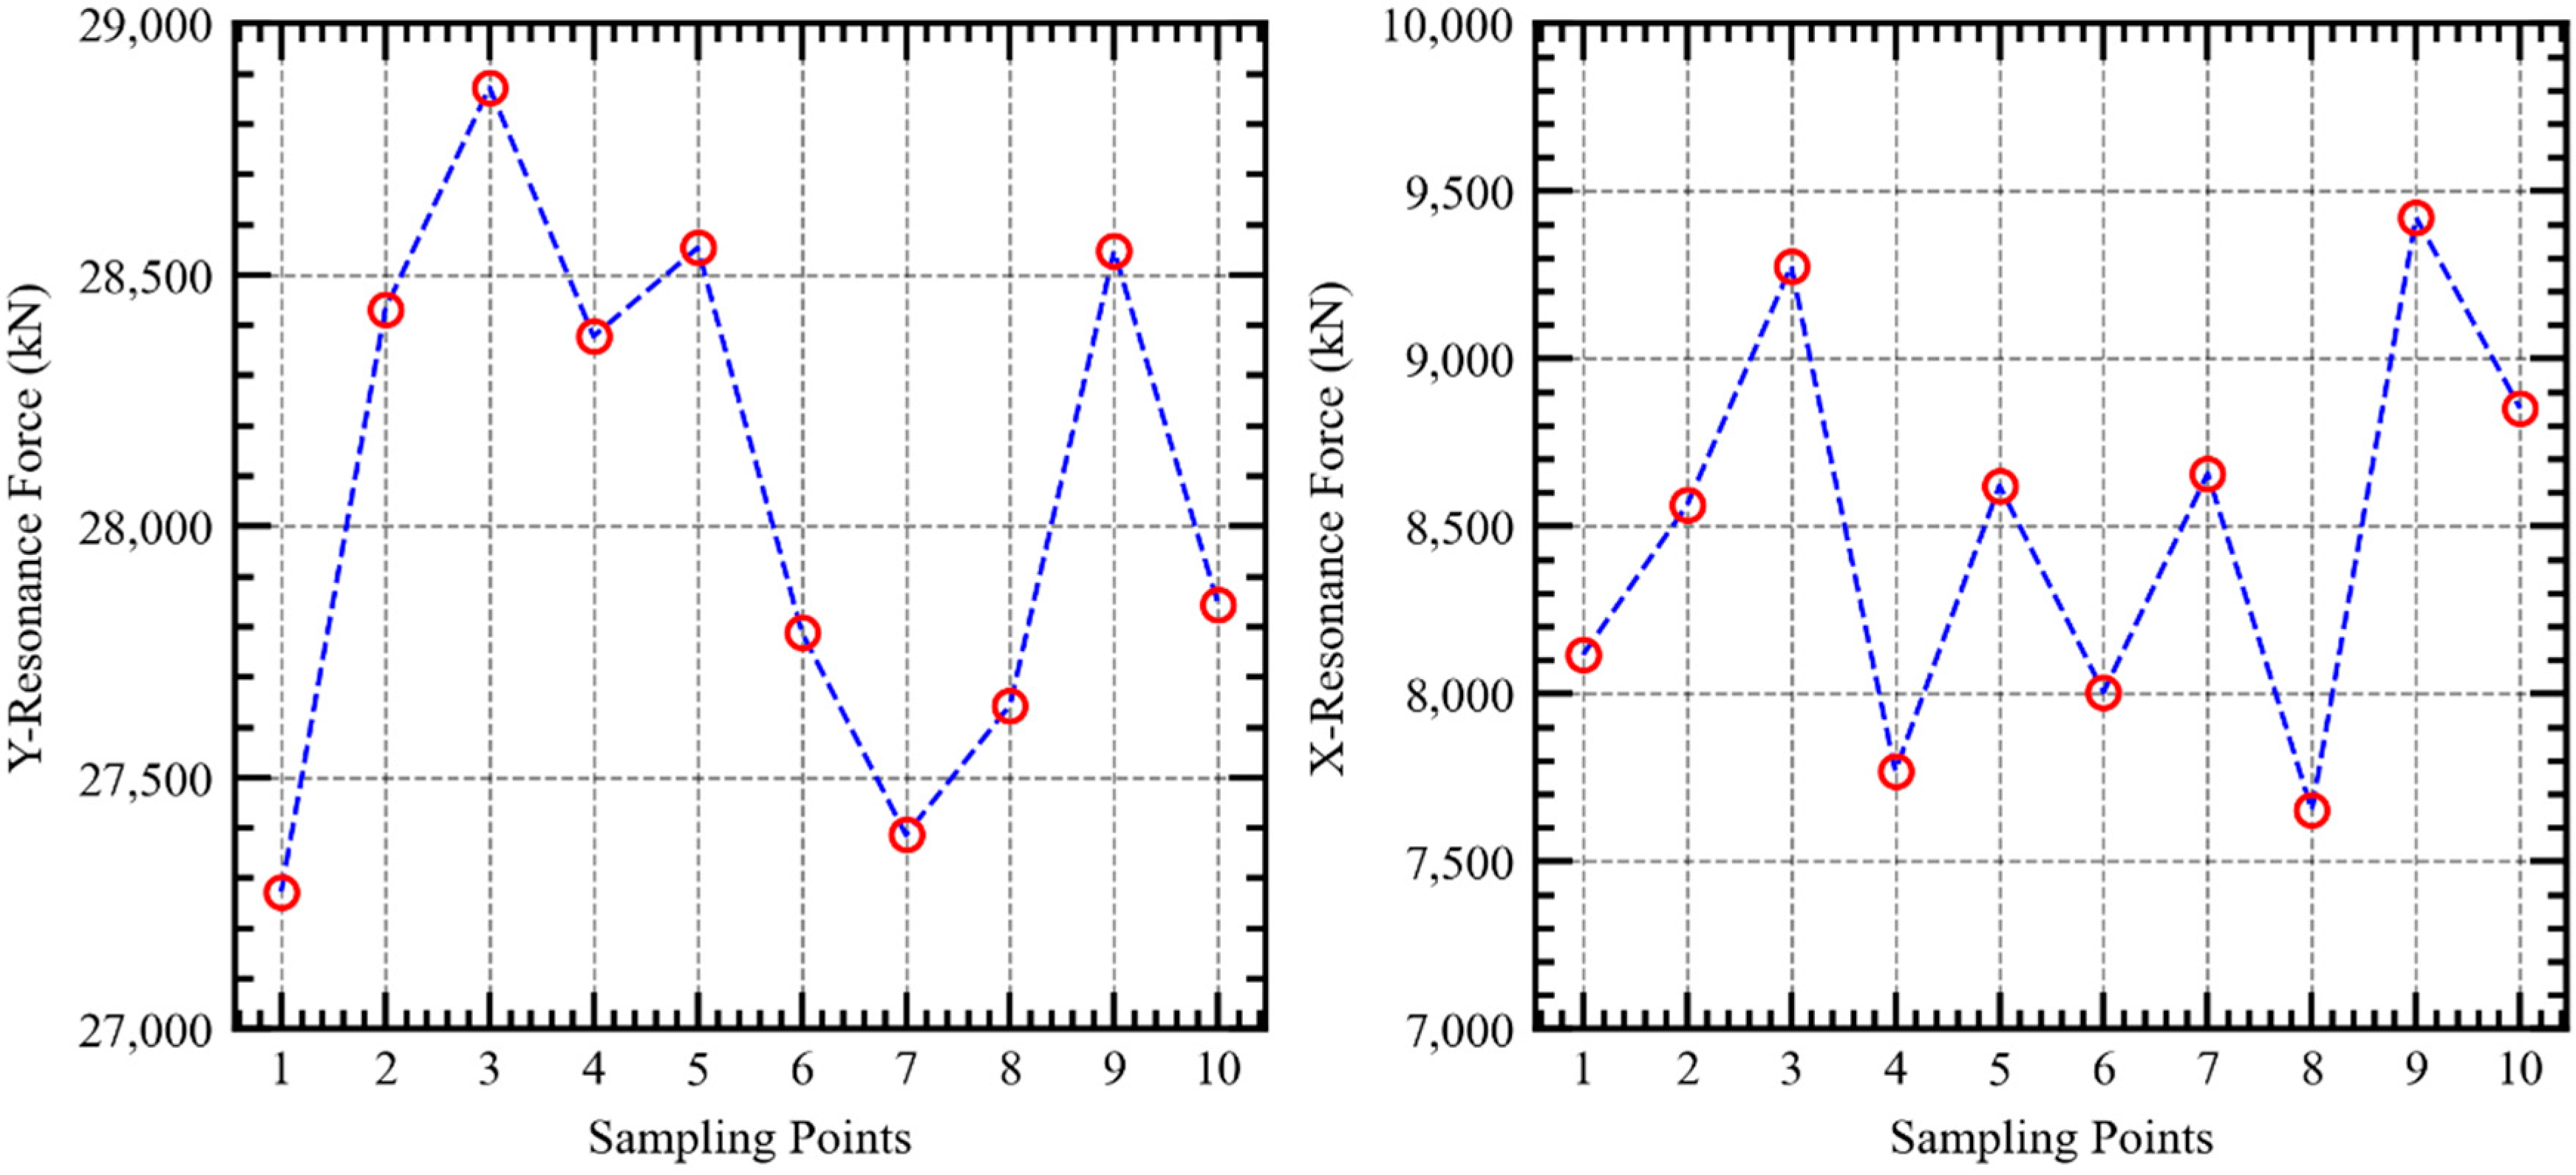
| Sample Points | Edge Curve | Building Curve | Fx | Fy | Mz | Def_x | Def_y | Drift_x | Drift_y |
|---|---|---|---|---|---|---|---|---|---|
| (mm) | (Degree) | (kN) | (kN) | (kN m) | (mm) | (mm) | - | - | |
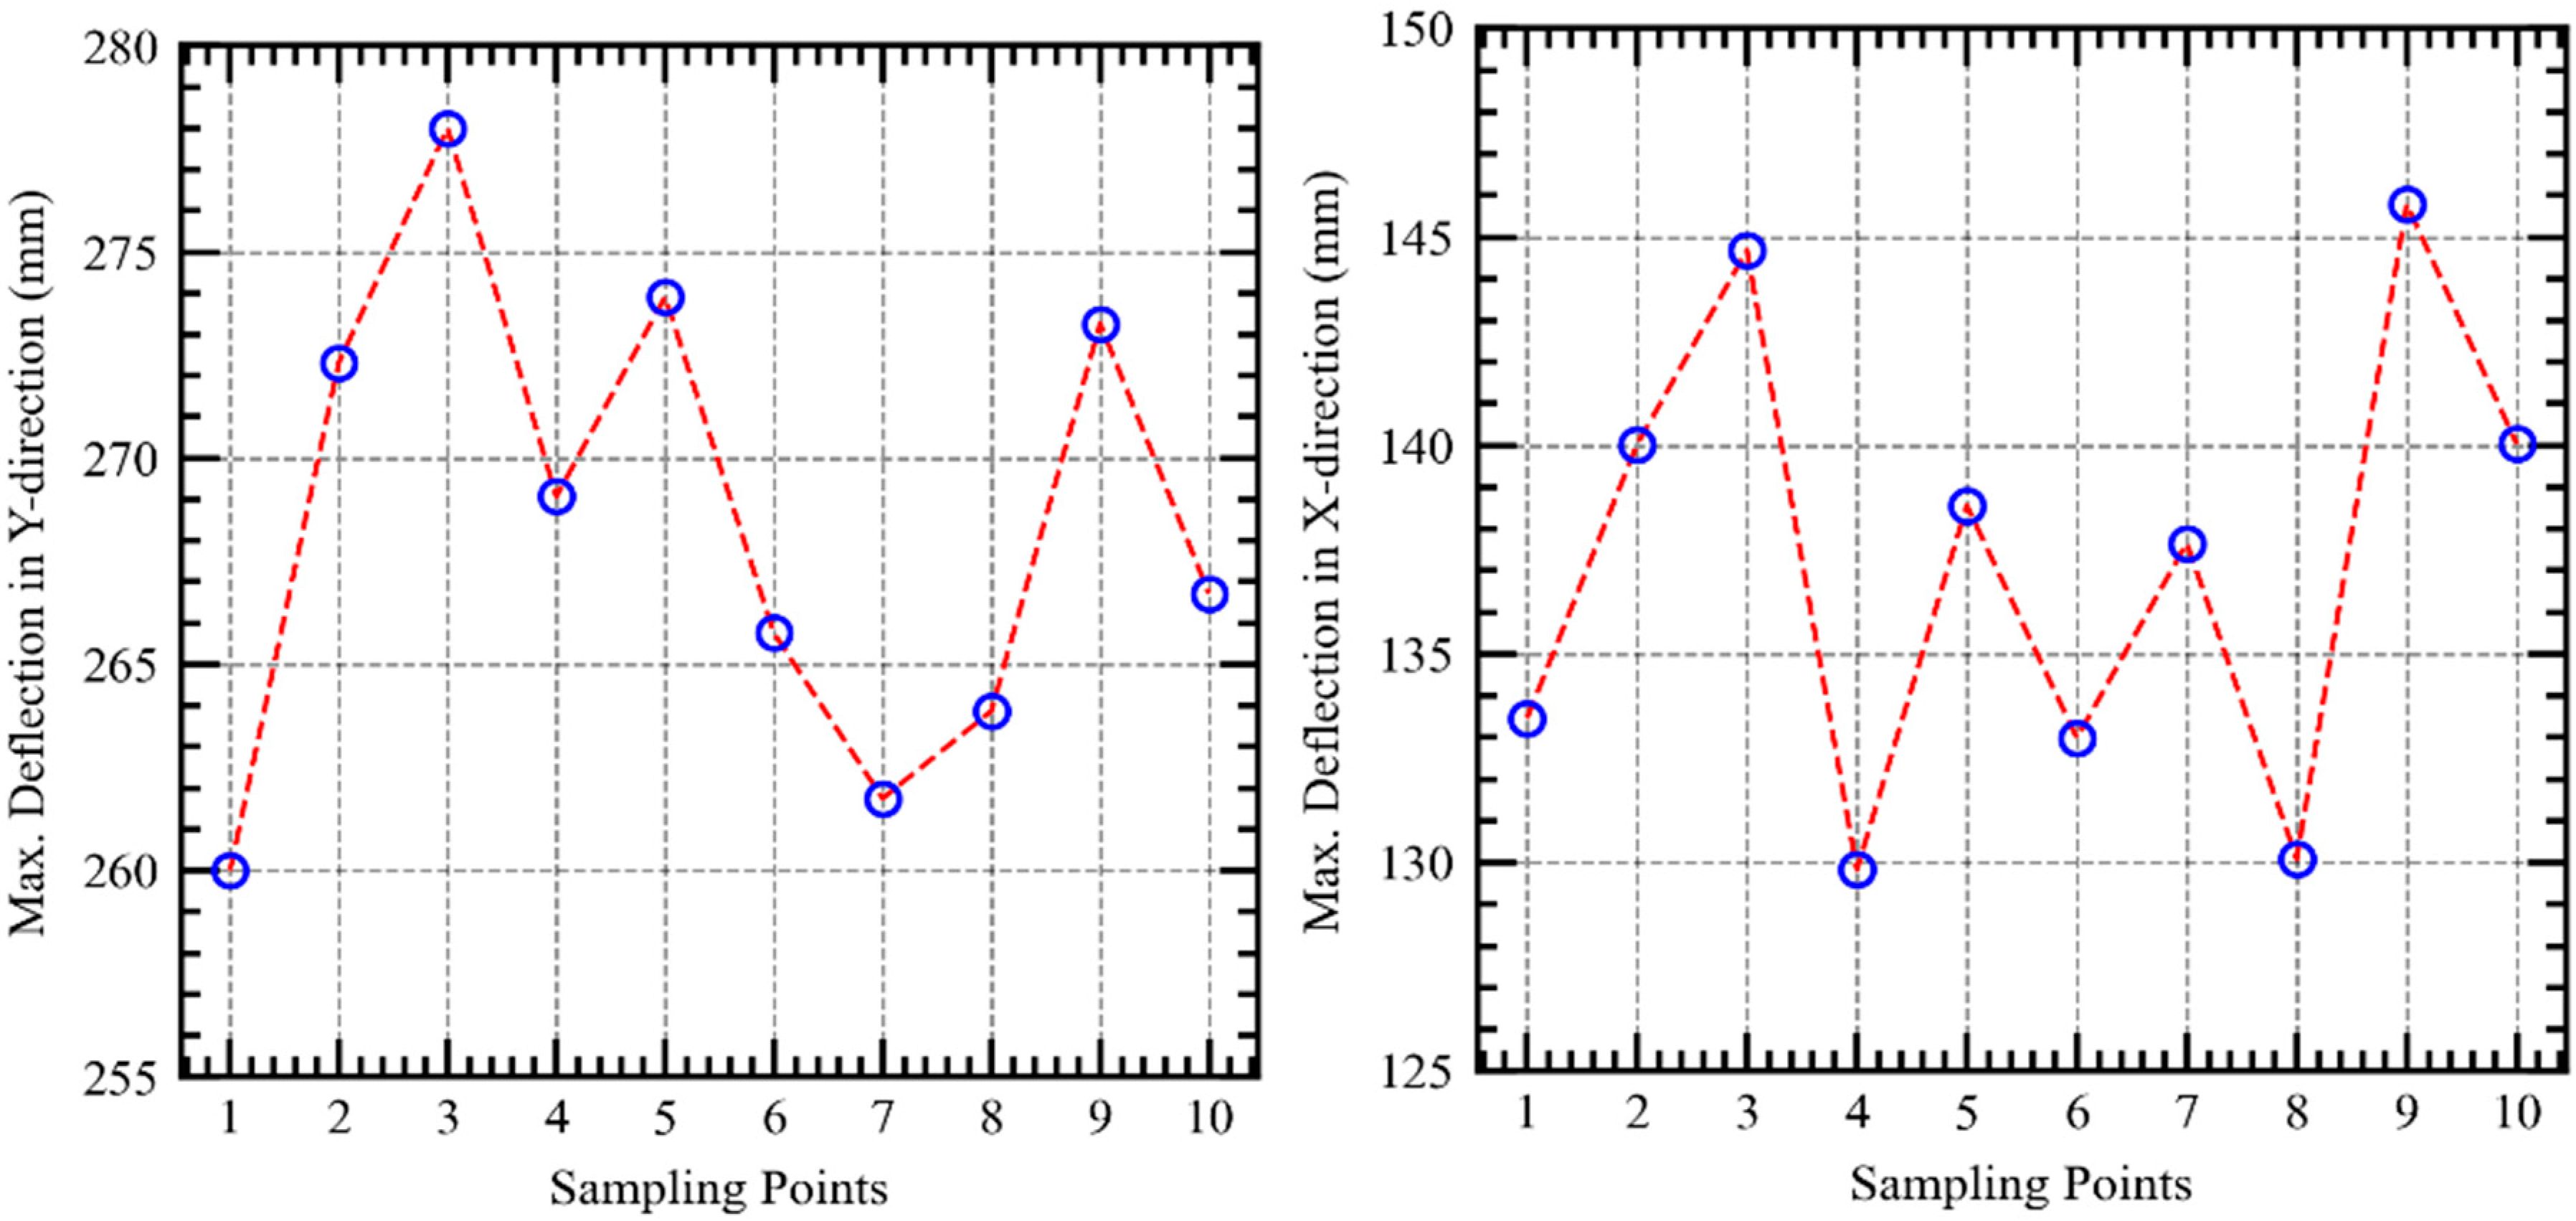
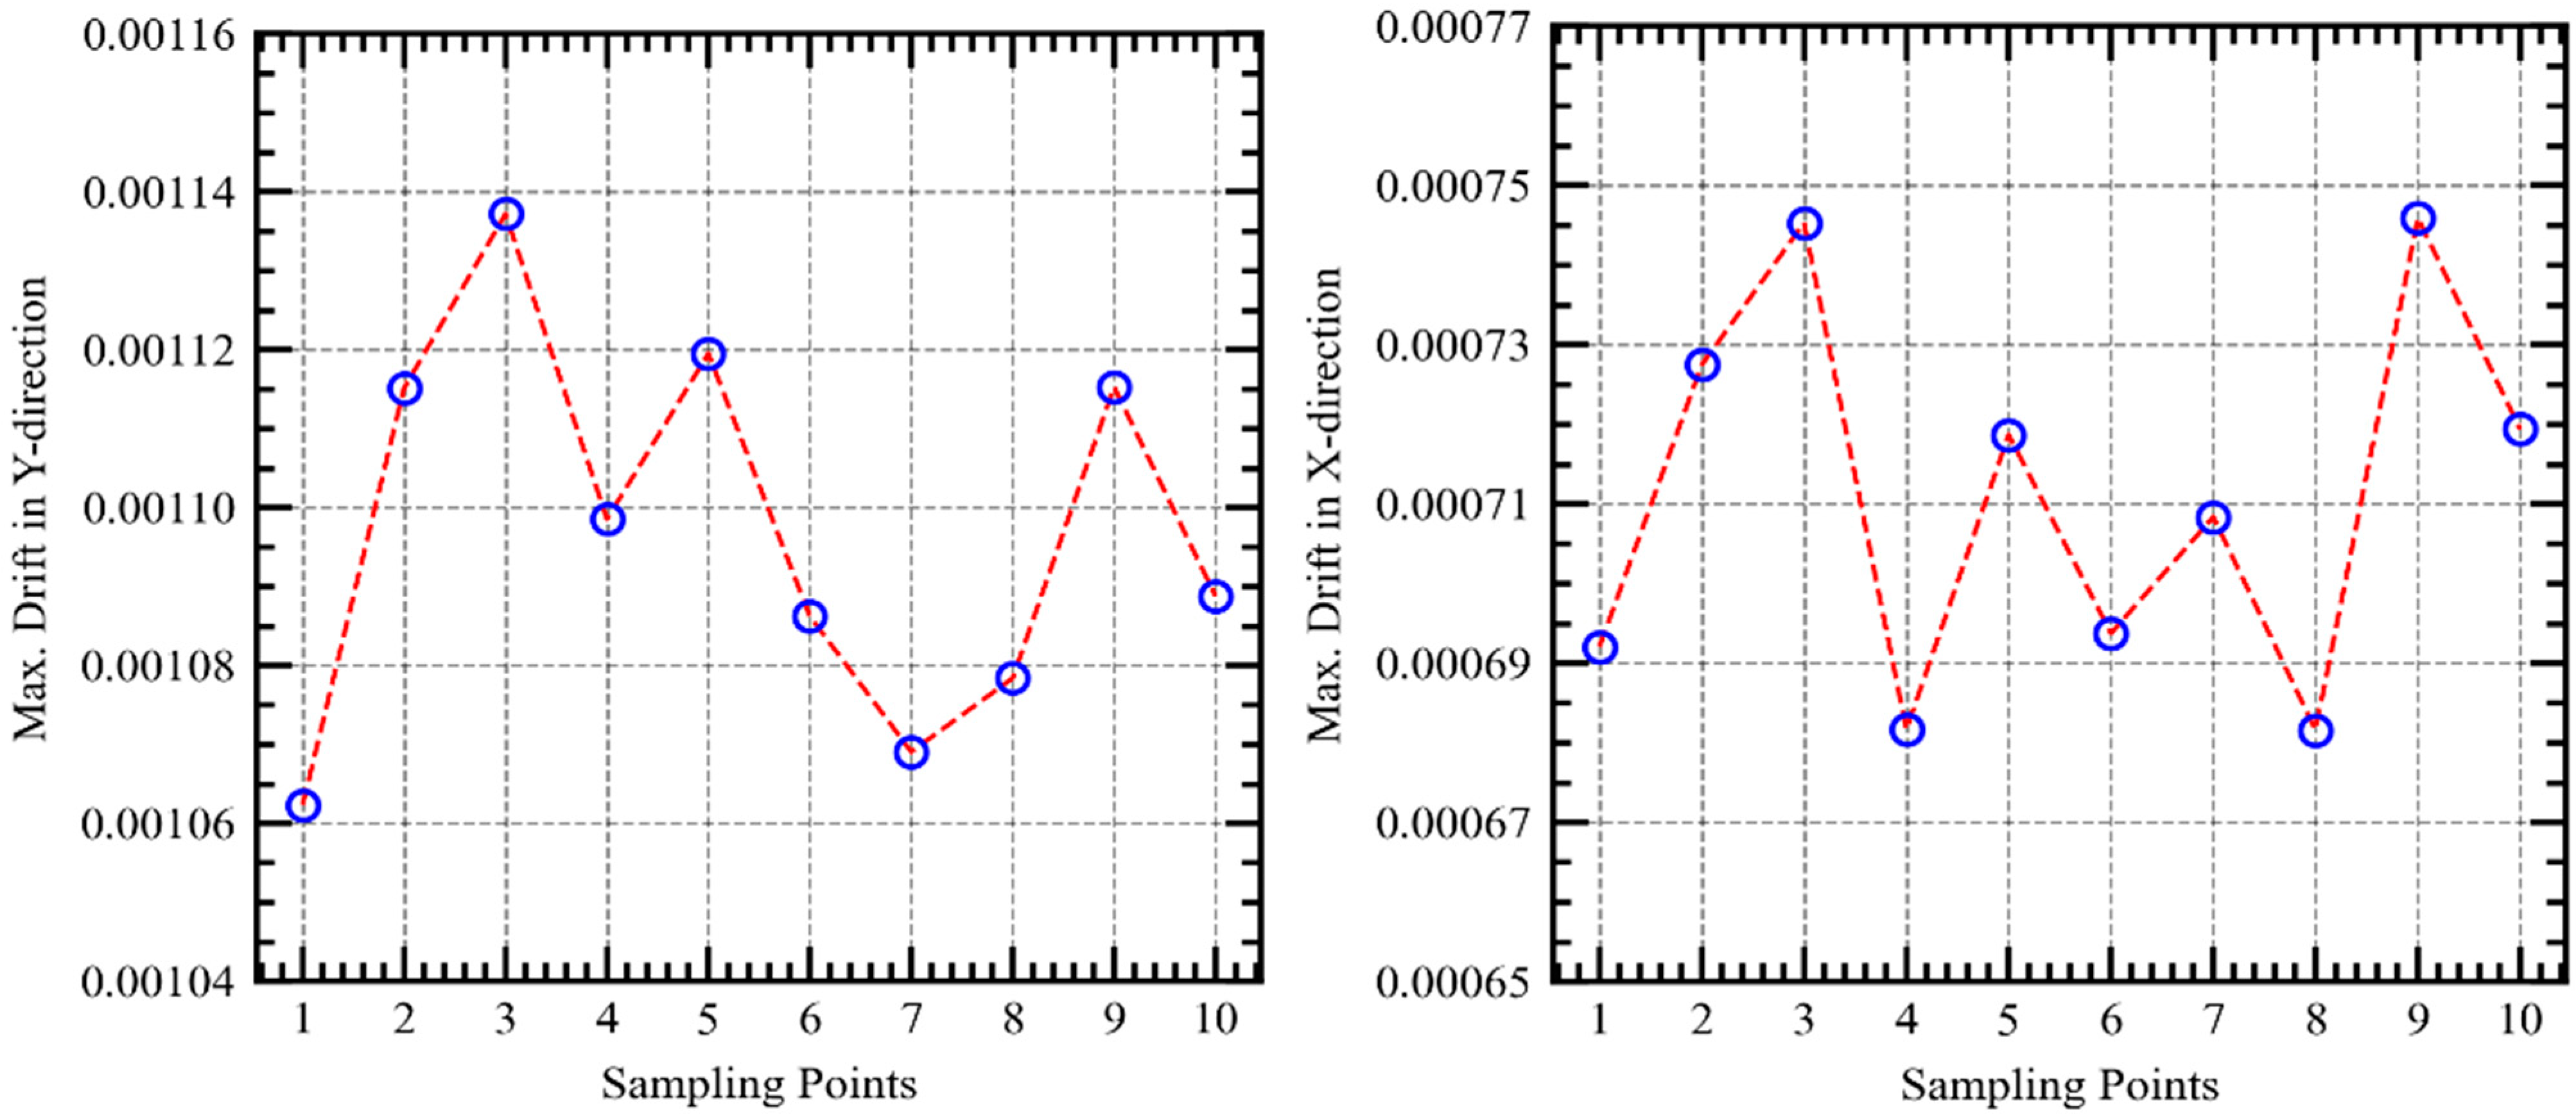
| SP1 | 1.7 | 3.5 | 8116 | 27,273 | 13,177 | 133.46 | 260 | 0.000692 | 0.001062 |
| SP2 | 0.3 | 4.5 | 8563 | 28,432 | 15,649 | 140.02 | 272.32 | 0.000727 | 0.001115 |
| SP3 | 0.5 | 8.5 | 9277 | 28,873 | 12,247 | 144.68 | 278 | 0.000745 | 0.001137 |
| SP4 | 0.1 | 1.5 | 7769 | 28,378 | 13,356 | 129.83 | 269.07 | 0.000682 | 0.001099 |
| SP5 | 0.7 | 5.5 | 8621 | 28,554 | 10,782 | 138.56 | 273.91 | 0.000719 | 0.00112 |
| SP6 | 1.3 | 2.5 | 8005 | 27,789 | 12,209 | 132.99 | 265.76 | 0.000694 | 0.001086 |
| SP7 | 1.9 | 6.5 | 8658 | 27,386 | 12,514 | 137.66 | 261.75 | 0.000708 | 0.001069 |
| SP8 | 1.1 | 0.5 | 7652 | 27,644 | 12,736 | 130.09 | 263.87 | 0.000682 | 0.001078 |
| SP9 | 0.9 | 9.5 | 9422 | 28,548 | 10,449 | 145.79 | 273.26 | 0.000746 | 0.001115 |
| SP10 | 1.5 | 7.5 | 8852 | 27,844 | 10,608 | 140.04 | 266.72 | 0.000719 | 0.001089 |
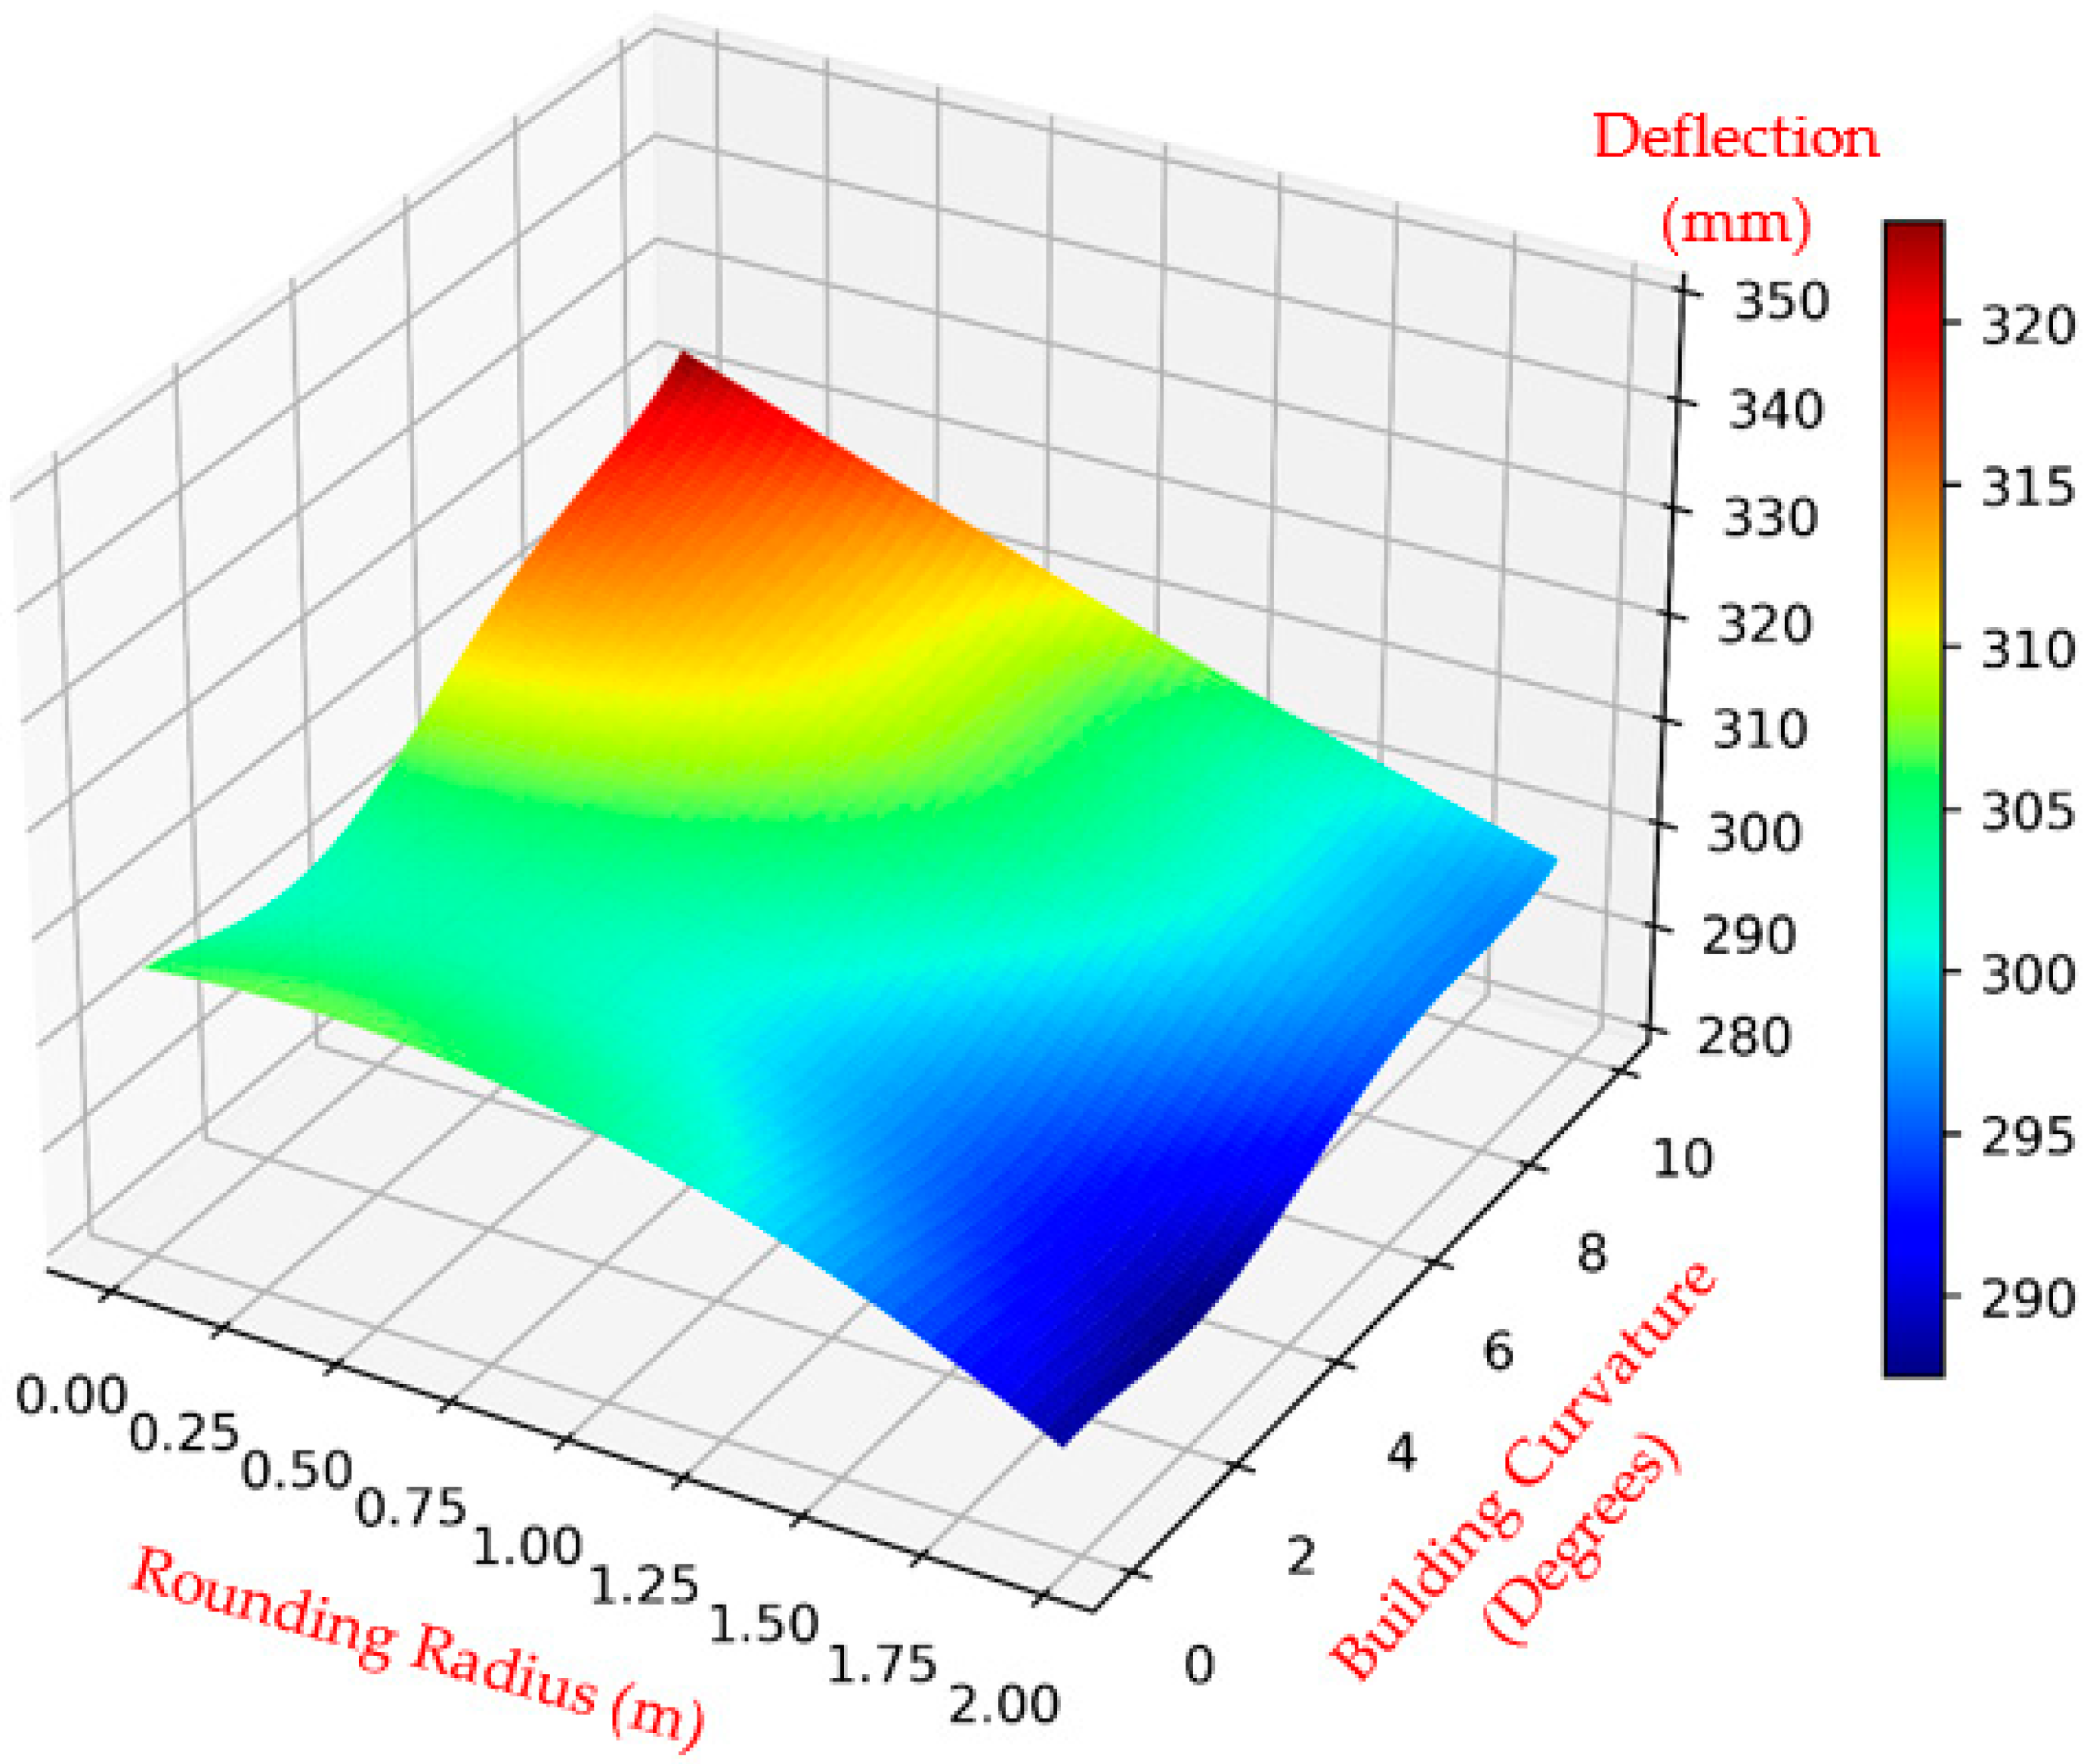
| No. Iterations | 1 | 2 | 3 | (Optimal) |
|---|---|---|---|---|
| No. Samples | 11 | 12 | 13 | 14 |
| Predicted (RBF) | 305.62 | 297.61 | 298.50 | 283.61 |
| Actual (CFD-FSI-FE) | 311.44 | 296.62 | 298.71 | 283.87 |
| RMSE (%) | 5.82% | 1.01% | 0.20% | 0.26% |
Publisher’s Note: MDPI stays neutral with regard to jurisdictional claims in published maps and institutional affiliations. |
© 2022 by the authors. Licensee MDPI, Basel, Switzerland. This article is an open access article distributed under the terms and conditions of the Creative Commons Attribution (CC BY) license (https://creativecommons.org/licenses/by/4.0/).
Share and Cite
Alkhatib, F.; Kasim, N.; Goh, W.I.; Shafiq, N.; Amran, M.; Kotov, E.V.; Albaom, M.A. Computational Aerodynamic Optimization of Wind-Sensitive Irregular Tall Buildings. Buildings 2022, 12, 939. https://doi.org/10.3390/buildings12070939
Alkhatib F, Kasim N, Goh WI, Shafiq N, Amran M, Kotov EV, Albaom MA. Computational Aerodynamic Optimization of Wind-Sensitive Irregular Tall Buildings. Buildings. 2022; 12(7):939. https://doi.org/10.3390/buildings12070939
Chicago/Turabian StyleAlkhatib, Fadi, Narimah Kasim, Wan Inn Goh, Nasir Shafiq, Mugahed Amran, Evgenii Vladimirovich Kotov, and Mohammed Abdo Albaom. 2022. "Computational Aerodynamic Optimization of Wind-Sensitive Irregular Tall Buildings" Buildings 12, no. 7: 939. https://doi.org/10.3390/buildings12070939
APA StyleAlkhatib, F., Kasim, N., Goh, W. I., Shafiq, N., Amran, M., Kotov, E. V., & Albaom, M. A. (2022). Computational Aerodynamic Optimization of Wind-Sensitive Irregular Tall Buildings. Buildings, 12(7), 939. https://doi.org/10.3390/buildings12070939