Article

Effects of Natural Weathering on the Performance of High Solar Reflective Index Paint Surfaces Exposed in Harsh Climatic Conditions of United Arab Emirates

by
Tirumala Uday Kumar Nutakki
1,* and
Waqar Ullah Kazim
2
1
Department of Chemical Engineering, American University of Ras Al Khaimah (AURAK), Ras Al Khaimah P.O. Box 10021, United Arab Emirates
2
RAK Research and Innovation Center, American University of Ras Al Khaimah (AURAK), Ras Al Khaimah P.O. Box 10021, United Arab Emirates
*
Author to whom correspondence should be addressed.
Buildings 2022, 12(7), 1002; https://doi.org/10.3390/buildings12071002
Submission received: 8 June 2022 / Revised: 11 July 2022 / Accepted: 12 July 2022 / Published: 13 July 2022

Abstract

:
The solar reflective index (SRI) is one of the important parameters in the analysis of a building’s energy and thermal performance, especially for “cool” reflective paints or coatings and also for cool roof membranes. However, there exists less information on the typical performance of the cool materials exposed for long term in the Middle East and more specifically in the United Arab Emirates (UAE). In this study, we determined values of reflectance, emittance, solar reflective index (SRI), and color difference, for three different high-SRI white-paint-coated panels exposed naturally on low- and high-sloped racks for three years. After 3 years, reflectance values of exposed sample panels significantly decreased with an increased color difference in comparison with original unexposed paint surfaces. The emissivity of the paint changed very little for all of the exposed samples, but SRI, determined from both the reflectance and emittance, initially ranged between 95 and 110 and decreased to 60–90 after three years of exposure. This appeared to be related to exposure to high temperatures, UV radiation, and adhesion of airborne contaminants in conjunction with low precipitation. Macroscopically, panels exposed on a low slope were the most discolored with the greatest presence of dust infusion and reduction in increase in surface temperatures, which was demonstrated through thermal imaging. Such natural weathering research study is necessary for the development of standard exposure tests and for the determination of various control elements to increase the durability of cool materials in hot and arid climatic conditions of the UAE.

1. Introduction

In the current urban world, most of the horizontal surface area of cities is comprised of building roofs and paved surfaces. Typically, these consist of dark and dry surfaces such as black-asphalt-covered roofs, pavements, and parking lots, and these surfaces absorb solar heat [1]. On a hot summer sunny day, these surfaces can be as much as 27–50 °C hotter than the ambient air and then remain warm into the night, creating a phenomenon called an “urban heat island (UHI)” [2]. In Abu Dhabi, the UAE, night-time temperatures in paved urban and suburban areas were observed to be more than 20 °C higher than in non-urban and vegetated areas [3]. In hot and humid climatic conditions, such as those of the United Arab Emirates (UAE), where air conditioning is used year-round, the urban heat island effect could increase significant energy consumption in the buildings [3]. A study on an urban heat island carried out in the desert city of Jaipur, India showed a temperature difference of 15 °C between an urban city and open green area, which resulted in significant energy consumption [4].
In recent years, architects, regulatory bodies, and city planners have adopted several strategies for reducing the effect of UHI. One of the simple strategies is the replacement of dark-colored surfaces, such as roofs or pavements, that absorb sunlight with light color surfaces that reflect it. These surfaces include concrete roofs, bitumen membrane roofs, exterior walls, textile materials for parking lots, etc. [5]. A typical dark-colored roof will absorb 90% or more of the incoming solar radiation and can reach temperatures above 65 °C, while a light-colored, cooler roof will absorb less than 50% of the radiation and can remain below 30 °C, or closer to the ambient temperature [6]. On the other hand, UHI could also significantly deteriorate the outdoor thermal comfort of the urban dwellers [7]. For hot-humid regions, researchers recommended assessing the outdoor thermal comfort using physiologically equivalent temperature (PET). PET represents the air temperature at which the human energy balance is maintained by skin temperature [8,9]. Using highly reflective solar awning solutions, an average PET reduction of 2.5 °C was observed with a maximum PET reduction of 11.2 °C for low-emittance awnings. The results of the study stress the significance of high solar reflective and low emittance materials on urban microclimate and outdoor comfort [7].
Reflectance and emittance are so-called radiometric properties, and both have a strong impact on UHI. The solar reflectance index (SRI) is a composite measure that accounts for a surface’s solar reflectance and emittance [10]. SRI is characterized by the temperature increase of a coating or material when exposed to sunlight and higher SRI values make the surface cooler. Specially manufactured high SRI pigments or white coatings are generally termed cool coatings and are produced as very thick paints that can protect the sunlight exposed surface from ultra-violet (UV) radiation, and chemical damage, and also offer water protection and restorative features [6]. Some manufacturers also coat roof surfaces with materials, such as membranes, metals, granules, etc., at the factory to make them more reflective [6]. Materials with a high solar reflective index (SRI), also known as “cool” materials, reduce the solar heat gain on building roofs, public walkways, shading structures, and other surfaces [6,10]. Using cool coatings or materials has proved to be a very cost-effective way to reduce building energy consumption and also helps in improving both indoor and outdoor thermal comfort [6,7]. Henceforth, these materials are encouraged by green building rating systems around the world and are being mandated by the governments [11]. The opportunity to accrue benefits from high-SRI materials is even greater in hot and arid environmental conditions, such as UAE. Accordingly, UAE regulators have set guidelines promoting high SRI materials for roofs, external walls, shading structures, and hardscape [12]. The most important mandates for construction practice in UAE related to high-SRI coatings or materials are summarized in Table 1.
As discussed earlier, ‘Cool coatings or materials’ present superior thermal performance, and their application to the urban environment has greater potential in reducing surface temperatures with increased reflectivity [6,13]. However, a material’s SRI value can change after installation and exposure on the site. This is typically due to diminished reflectance values, but emittance values can also vary [14]. Several studies reveal that the solar reflectance of roof coating or materials is more dynamic and reduced by the soiling accumulation on the surface after naturally weathering due to outdoor exposure. Further, studies have shown that solar reflectance attenuation due to soiling is the most important factor to determine the long-term performance of the white cool-roof coatings [15,16]. A study on cool pigmented roof samples exposed at different locations with varying precipitation and wind conditions concluded that the long-term benefit of cool coatings is frequently reduced by a reduction in the solar reflective index in the first few years of on-site exposure, mainly through the build-up of dirt, dust, and microorganisms in biofilms [17]. The authors observed a decrease in solar reflectance of 4% to 23% within the first year of exposure for white polyvinylidene-fluoride-coated steel roofs [17]. Another study assessed the high reflective paint performance over two years concerning surface contamination and observed 10–20% degradation of reflectivity within several months of exposure, revealing that the degradation of the paint surface was mainly due to airborne contamination, such as the adhesion of particles to the coating surface, that cannot be neglected [18]. Various environmental factors at the natural aging sites, such as the higher intensity of solar radiation, associated with high precipitation, compromised the integrity of the paint film, and the greatest loss of reflectance was associated with the biofilm containing particles dispersed through the air [19]. Researchers studied 14 types of reflective coatings and observed that the use of an appropriate reflective coating could significantly reduce surface temperatures by 2–4 °C [20]. The results also showed that the effect of weathering, even for a short period (3 months), caused degradation in the reflectivity of the coatings and therefore choosing coatings with good ‘dirt pick-up’ and weathering resistance has been suggested [20]. Researchers also observed that the decrease in reflectance or albedo also depends on the coating itself, the surface’s texture, the roof’s slope, and the nearby sources of dirt and debris [21]. Further, the reduction in energy savings due to soiling was estimated to be between 10–20% based on a model to evaluate cooling load demands [21]. Therefore, to realize the full potential of energy savings of the cool coatings, they must maintain high solar reflectivity for the service life of those coatings [22,23].
Cyclic maintenance and thorough cleaning of cool coatings have shown to restore 90% of the initial value of reflectance, but the restoration of full energy savings is only temporary, as soiling continues with exposure [21,24]. The most important consideration for cleaning is the labor costs, which are significant compared to returns on energy savings [21]. Studies have shown that cleaning might be necessary to meet the potential of the cool roof’s energy efficiency [22,25]. The Cool Roof Rating Council (CRRC), USA, determined that the SRI should be evaluated at the beginning and after 3 years of natural exposure to ascertain cool roof efficacy. This 3-year time period was recommended by most cool coatings manufacturers between the cleaning procedures and adapted by other major certification bodies, such as Energy Star and European Cool Roof Council (ECRC) [26]. However, this requirement of periodic maintenance varies based on location and depends on numerous factors, such as building characteristics, the specific type, and the properties of the coating.
Many previous research studies discussed above to determine the effect of natural aging on reflectance and emittance values of cool materials/coatings were conducted in the USA, and few studies in Southern Europe, East Asia, and Brazil. However, there are no such studies found in the literature for naturally weathered cool reflective surfaces in the Middle East region. Therefore, the current study aimed to determine the long-term performance of high solar reflective index white paint coated surfaces exposed for three years in the UAE, whose climatic conditions mimic those of many locations in the region. The study involves the evaluation of environmental stresses that adversely affect the important performance properties of these cool materials which are otherwise expected to function for longer lifetimes, even with harsh outdoor exposure conditions. A weathering test farm was developed in Ras Al Khaimah, UAE, and operated as an exposure site, which was fully equipped with appropriate meteorological, radiometric instrumentation, and data acquisition capability. The study presents a precise and detailed knowledge of environmental conditions experienced by various tested samples to understand location-specific performance losses and predict the long-term durability of the candidate solar reflective coatings.

2. Materials and Methods

White water-based acrylic coatings with high SRI values (high reflectance (>0.85) and emittance (>0.86)) were acquired from three different manufacturers in the UAE market and were used as model “cool surfaces” to study their natural aging for roof and façade coating applications in the UAE. To maintain consistency in the testing comparison, all coatings were applied on standard aluminum panels (3003 H14) [27]. The application and curing methods of the sample paint-coated panels were accomplished at the manufacturer’s facility. Each manufacturer prepared a total of 12 sample panels for each application (roof and façade), and they were responsible for ensuring the consistent application of the product coatings on the aluminum substrate provided. All panels prepared for testing were applied with a dry film thickness or coverage recommended by respective manufacturers based on the real application of the coatings. After receiving the coated panels, the dry film thickness was measured to ensure that all panels were within 10% of the manufacturer’s recommended minimum coating thickness. After initial testing for determining SRI values, three panels were kept in the lab as a reference, and the remaining nine panels from each manufacturer were exposed externally at the natural weathering farm in Ras Al Khaimah City (Figure 1) (25°40 N, 55°46 E, March 2017 to February 2020) as per ASTM standard G7/G7M-13 [28]. The exposure site lies within the premises of RAK Research and Innovation Center, AURAK, about 100 m from a highway and at a distance of 1.75 km from the sea coastline.
Sample panels of both roof and façade applications were exposed for a minimum of three (3) continuous years, and a few sample panels remained untouched for that period while other panels were used for periodic evaluations. The samples were docked in 5° and 45° tilted racks as shown in Figure 1. The 5° tilt represents the roof coatings and the 45° tilt represents the façade coatings. A flow chart of the experimental methodology for the determination of SRI and other parameters is shown in Figure 2 for one manufacturer and for roof coatings. A similar methodology was applied for other manufacturers and for façade coatings.
As mentioned earlier, natural weathering involves exposure to harsh outdoor conditions and analysis of meteorological and radiometric factors that affect the essential performance properties of the exposed materials. During the outdoor exposure period, the physical and/or chemical damage to the coatings might be induced by sunlight, especially the UV part of the spectrum, temperature, moisture, pollution, and wind. Solar radiation results in thermally induced degradation through direct heat, and defects can be observed at elevated temperatures. Precipitation, and relative humidity in the atmosphere can accelerate hydrolytic reactions and result in morphological structural changes of materials. Further, harmful pollutants, such as particulates, NOx, Sox, salts, and acid rain, could also induce materials degradation through corrosive, oxidation reactions. Changes in the wind conditions alter the surface temperatures through a convective heat transfer and may also result in the concentration changes of moisture and/or pollutants on the material surface [30].
The natural weathering exposure facility was a unique setup in the desert land of Ras Al Khaimah (RAK) free from residential pollution and urban structures. Compared with benchmark exposure sites (in the USA, and Europe) shown in Table 2, RAK experiences high temperature, low rainfall, and high dusty conditions which might significantly affect the performance of coatings in a long run. Further, RAK has a humid and high UV radiation environment, suitable to test and analyze the natural weathering performance of exterior coatings or paints. Testing under these conditions could mimic extreme weather conditions in many parts of the gulf cooperation council (GCC) region.

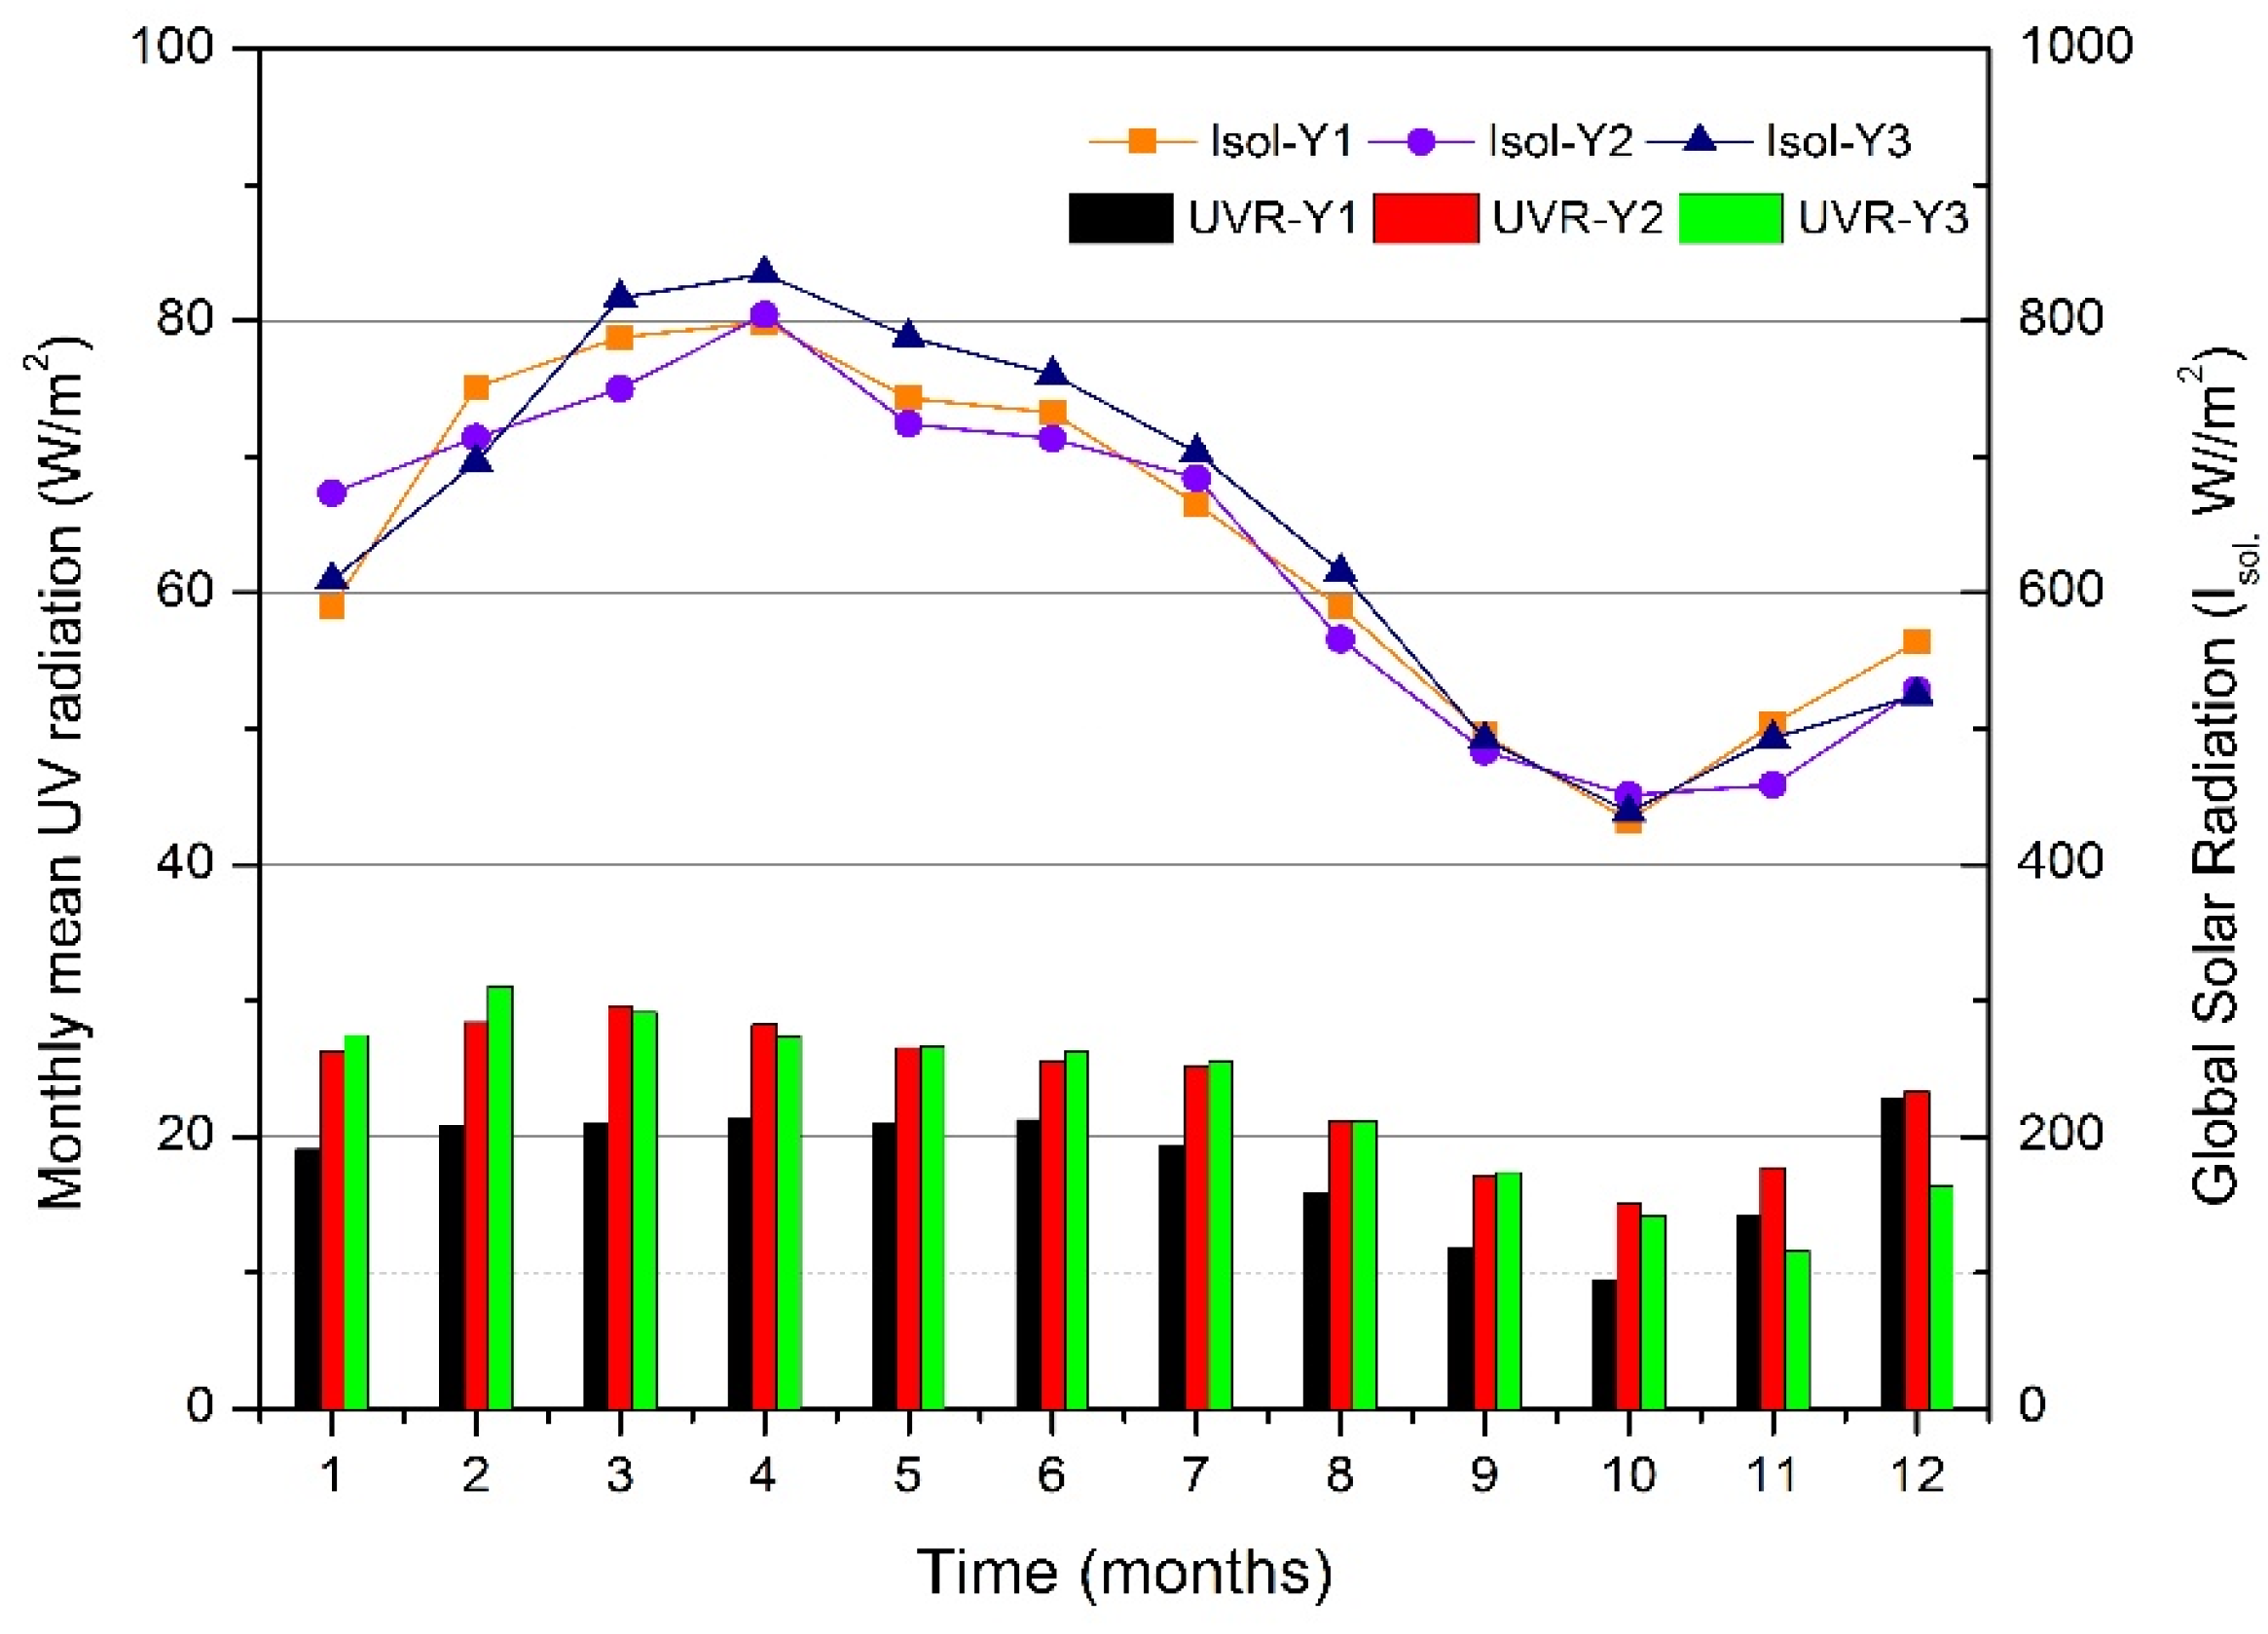
2.1. Metrological Data

The meteorological data were obtained using automatic weather stations, installed next to the naturally exposed paint panels at the test site. Continuous measurements were obtained for air temperature, global solar radiation, and air relative humidity, using the monthly averages. The measurements obtained at the test site used the following equipment: for air temperature and relative humidity, a Rotronic probe, model HC2-S3; for global solar radiation, an Eppley Pyranometer, model CMP11; and for solar total UV radiation, an Eppley Radiometer, model TUVR. For rainfall precipitation, we used the data from our weather station and accumulated them as the total of each month. For PM10 dust concentrations, we used the data recorded by the National center of metrology (NCM) from the nearest weather stations [33].

2.2. Reflectance and Thermal Emittance Measurement with Portable Reflectometer

Reflectance was measured according to ASTM C 1549-15, using a portable Solar Spectrum Reflectometer, model SSR–ER, Version 6.4 (Devices and Services Company, Dallas, TX, USA) [35]. Thermal emittance was measured using an Emissometer Model AE1-RD1 (Devices and Services Company, USA according to ASTM C 1371-10 [36]. Adequate time between measurements was maintained between samples to allow cooling of the surfaces for thermal emittance measurements. As shown in Figure 3, measurements were taken at three points on each panel (top, middle, and bottom), giving a total of 9 measurements for all three manufacturer panels naturally aged at the site for the three years. The reflectance and emittance measurements were carried out before exposure, periodical measurements for every 6 months, and final measurement after 3 years.

2.3. Solar Reflective Index (SRI)

The solar reflective index (SRI) was calculated based on the procedure described in ASTM E 1980-11 [37]. Given the solar reflectance and thermal emissivity of a test surface, SRI was calculated for three convective coefficients (hc) of 5, 12, 30 W/m2·K (Equation (1)), corresponding to low-, medium-, and high-wind conditions, respectively. The following equation was used to calculate SRI:
SRI = 123.97 141.35   χ + 9.655   χ 2
where
χ = α 0.029 ε 8.797 + h c 9.5205 ε + h c α = Total   solar   absorptance = 1     solar   reflectance ε = Thermal   emittance
The calculated SRI values were assessed based on the criteria established by the regional green building regulation and certification authorities having requirements and guidelines broadly similar to those in other parts of the world, such as the USA, Europe, Australia, Brazil, Japan, China, India, and across the Middle East. The U.S. Energy Star Program, the California Energy Code Title 24, and European national codes have comparable requirements, as do voluntary green building rating programs—such as LEED and Green Star (Australia). ASHRAE Standard 189.1, 90.1 and the International Green Construction Code (IGCC) both recommend high SRI values, especially for hot climates. Accordingly, UAE regulators have set mandates and guidelines promoting cooler materials, with the most important summarized earlier in Table 1 [11].

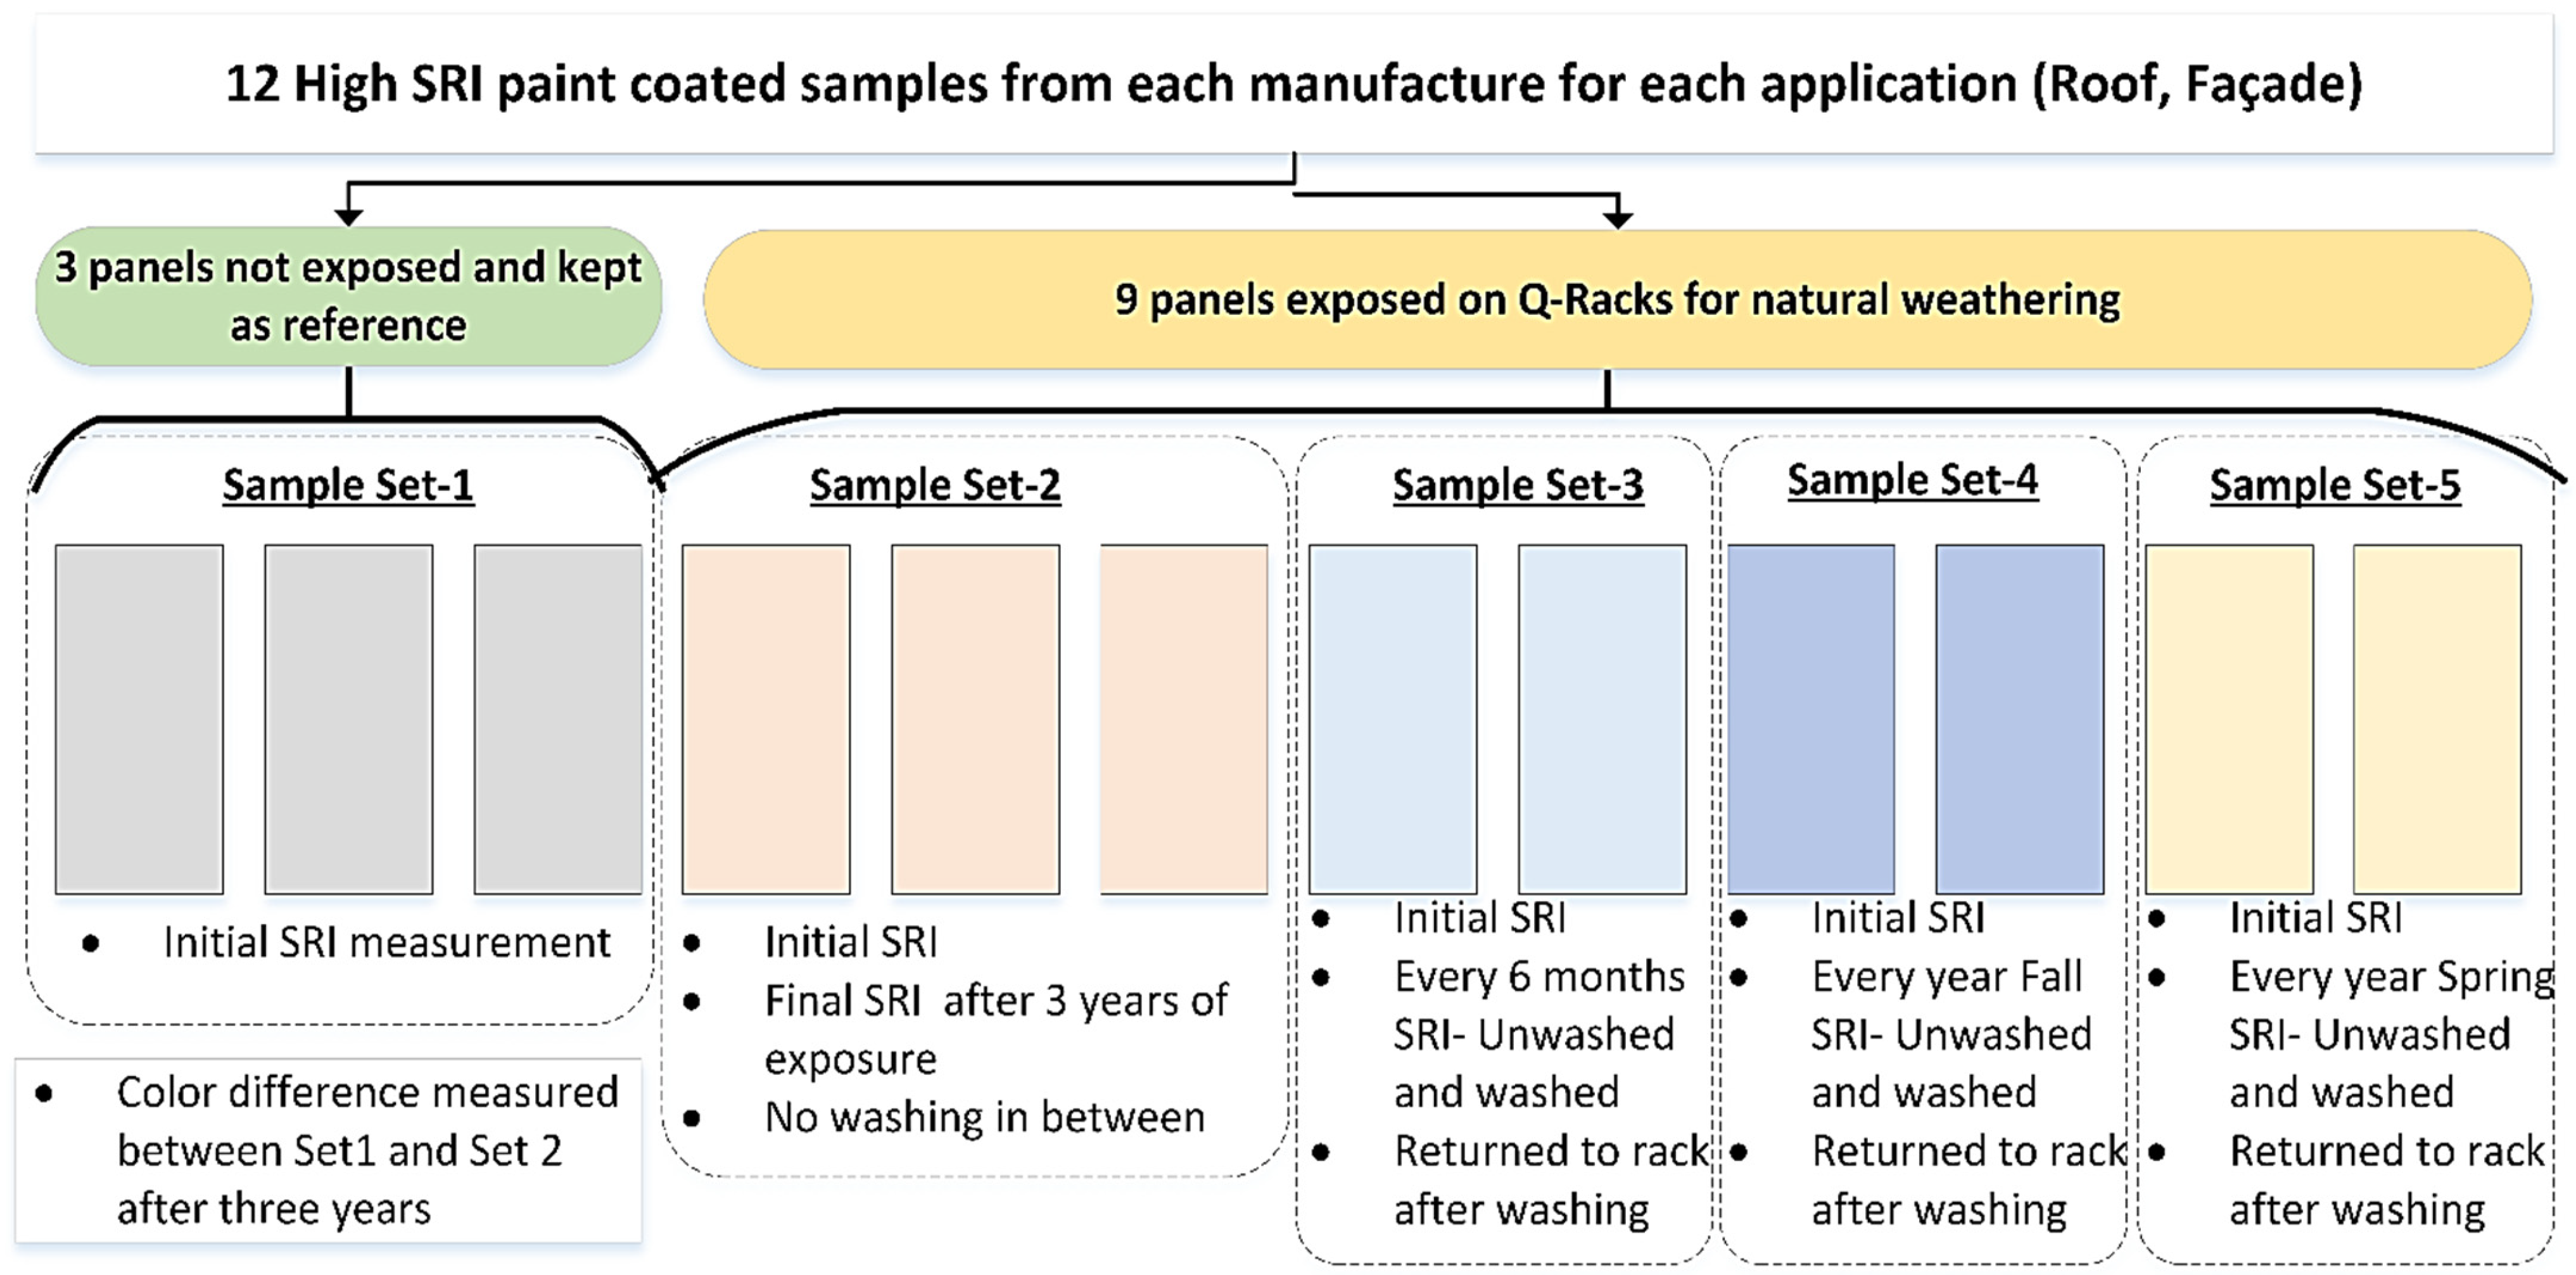
2.4. Periodic Cleaning

As discussed earlier, all major rating bodies; the U.S. Cool Roof Rating Council (CRRC), European Cool Roof Council (ECRC), and Energy Star preferred to conduct natural weathering tests for at least for 3 years to demonstrate long-term performance. Importantly, unwashed testing allows for analyzing the material’s dirt pick-up, or soiling/dust accumulation—a factor difficult to test in a short-term laboratory test [11]. As discussed earlier, the energy savings from cool materials depends on solar reflectivity and maintaining the condition of the coated surfaces. Thus, periodic maintenance through cleaning the surfaces might be necessary to retain mainly the solar reflectance and to enhance the contribution to energy savings. A study on the weatherization of the cool roofs in two buildings in Athens Greece showed that annual cleaning of the cool roof coating increased the solar reflectance near to initial levels, and an 18.8% of the decrease in annual energy consumption was observed [22]. Another 3-year exposure study on roofing membranes in Italy suggested considering a cleaning program in the spring season as a best practice, as the soiling effects were higher in winter and cleaning before the oncoming cooling loads of summer could maximize returns on investment [38].
In the current study, we incorporated a periodic cleaning program, and sample surfaces were washed every 6 months after initial exposure to investigate the degradation in reflectivity due to soiling. Further, as elucidated in Figure 2, washing of another set of sample panels was conducted annually in fall and spring cycles to analyze the percentage retention of the solar reflective index. The washing process involves pressurized water spray without manual intervention to minimize damage to the coating while removing dust contamination. The coatings were then dried after washing at indoor temperature, and the SRI values were determined.

2.5. Infrared Thermal Imaging

For higher emissivity surfaces, such as the high SRI paints or coatings, reflected temperature might have less influence. However, to define the coatings as cool coatings or surfaces, it is important to know the surface temperatures during natural exposure. The ability to visualize the surface temperature gives infrared thermography a wide scope of application, particularly in the field of non-destructive testing [39]. In the building industry, thermography may be applied to many facets of building performance, including insulation defect detection. In this study, we performed the thermal imaging of the samples exposed on the low slope and steep sloped racks to analyze the surface temperatures of the panels before and after washing. A Fluke Ti-45 thermal imager was used for obtaining the differences in surface temperatures of exposed and unexposed samples.

2.6. Color Difference

The color was determined in two areas on the sample as shown in Figure 2, before and after washing of the samples exposed for 3 years and compared with the unexposed samples. The BYK Gardner Wireless Color Measurement Device was used to determine L, a, b. The value of L varies from 0 to 100 (black to white), a from negative (green) to positive (red), and b from negative (blue) to positive (yellow) values. With these values, we can calculate the color difference (ΔE) through the Equation (3).
Δ E = Δ L 2 + Δ a 2 + Δ b 2

3. Results and Discussion

The results presented in this section cover the three years of natural weathering of the high solar reflective index (SRI) white coatings from three manufacturers for both exterior roof and façade applications. This study was part of the research funded by the Abu Dhabi Quality and Conformity Council, the UAE [40].

3.1. Metrological Data

Figure 4 and Figure 5 show the meteorological information measured at the test site and also data obtained from other sources during the experiment period in Ral Al Khaimah, UAE. Figure 4 presents the global solar radiation at the exposure site for the three years with an average of 638.3 W/m2, with an average amplitude of 372 W/m2. Further, Figure 4 also presents the total UV radiation (TUVR) measured within the wavelength range of 285–395 nm. The mean total UV radiation of 21.5 W/m2 was recorded for the three years with an amplitude of 11 W/m2 in the first year, 14.5 W/m2 in the second year, and 19.4 W/m2 in the third year, respectively.
Figure 5 shows the atmospheric PM10 data between 2017 and 2020, which accounts for average PM10 concentrations from the nearest measuring station in Ras al Khaimah, UAE according to reports by NCM (National Center for Metrology). Annual average concentrations of 130 μg/m3 were reported with amplitudes of 77 μg/m3 in the first year, 157 μg/m3 in the second year, and 99 μg/m3 in the third year respectively. The regime precipitation measured at the exposure site was quite distinct during the exposure period, both in volume and distribution over the three years. As shown in Figure 5, the average total rainfall at the site for 3 years is 112.6 mm with a total of 110 mm in the first year, 42 mm in the second year, and 186 mm in the third year, respectively. Second year of exposure records the least precipitation and also high PM10 dust concentrations. The third-year of exposure has the highest rainfall, which would have a significant effect on the reflectance measured at the end of the 3-year exposure period.

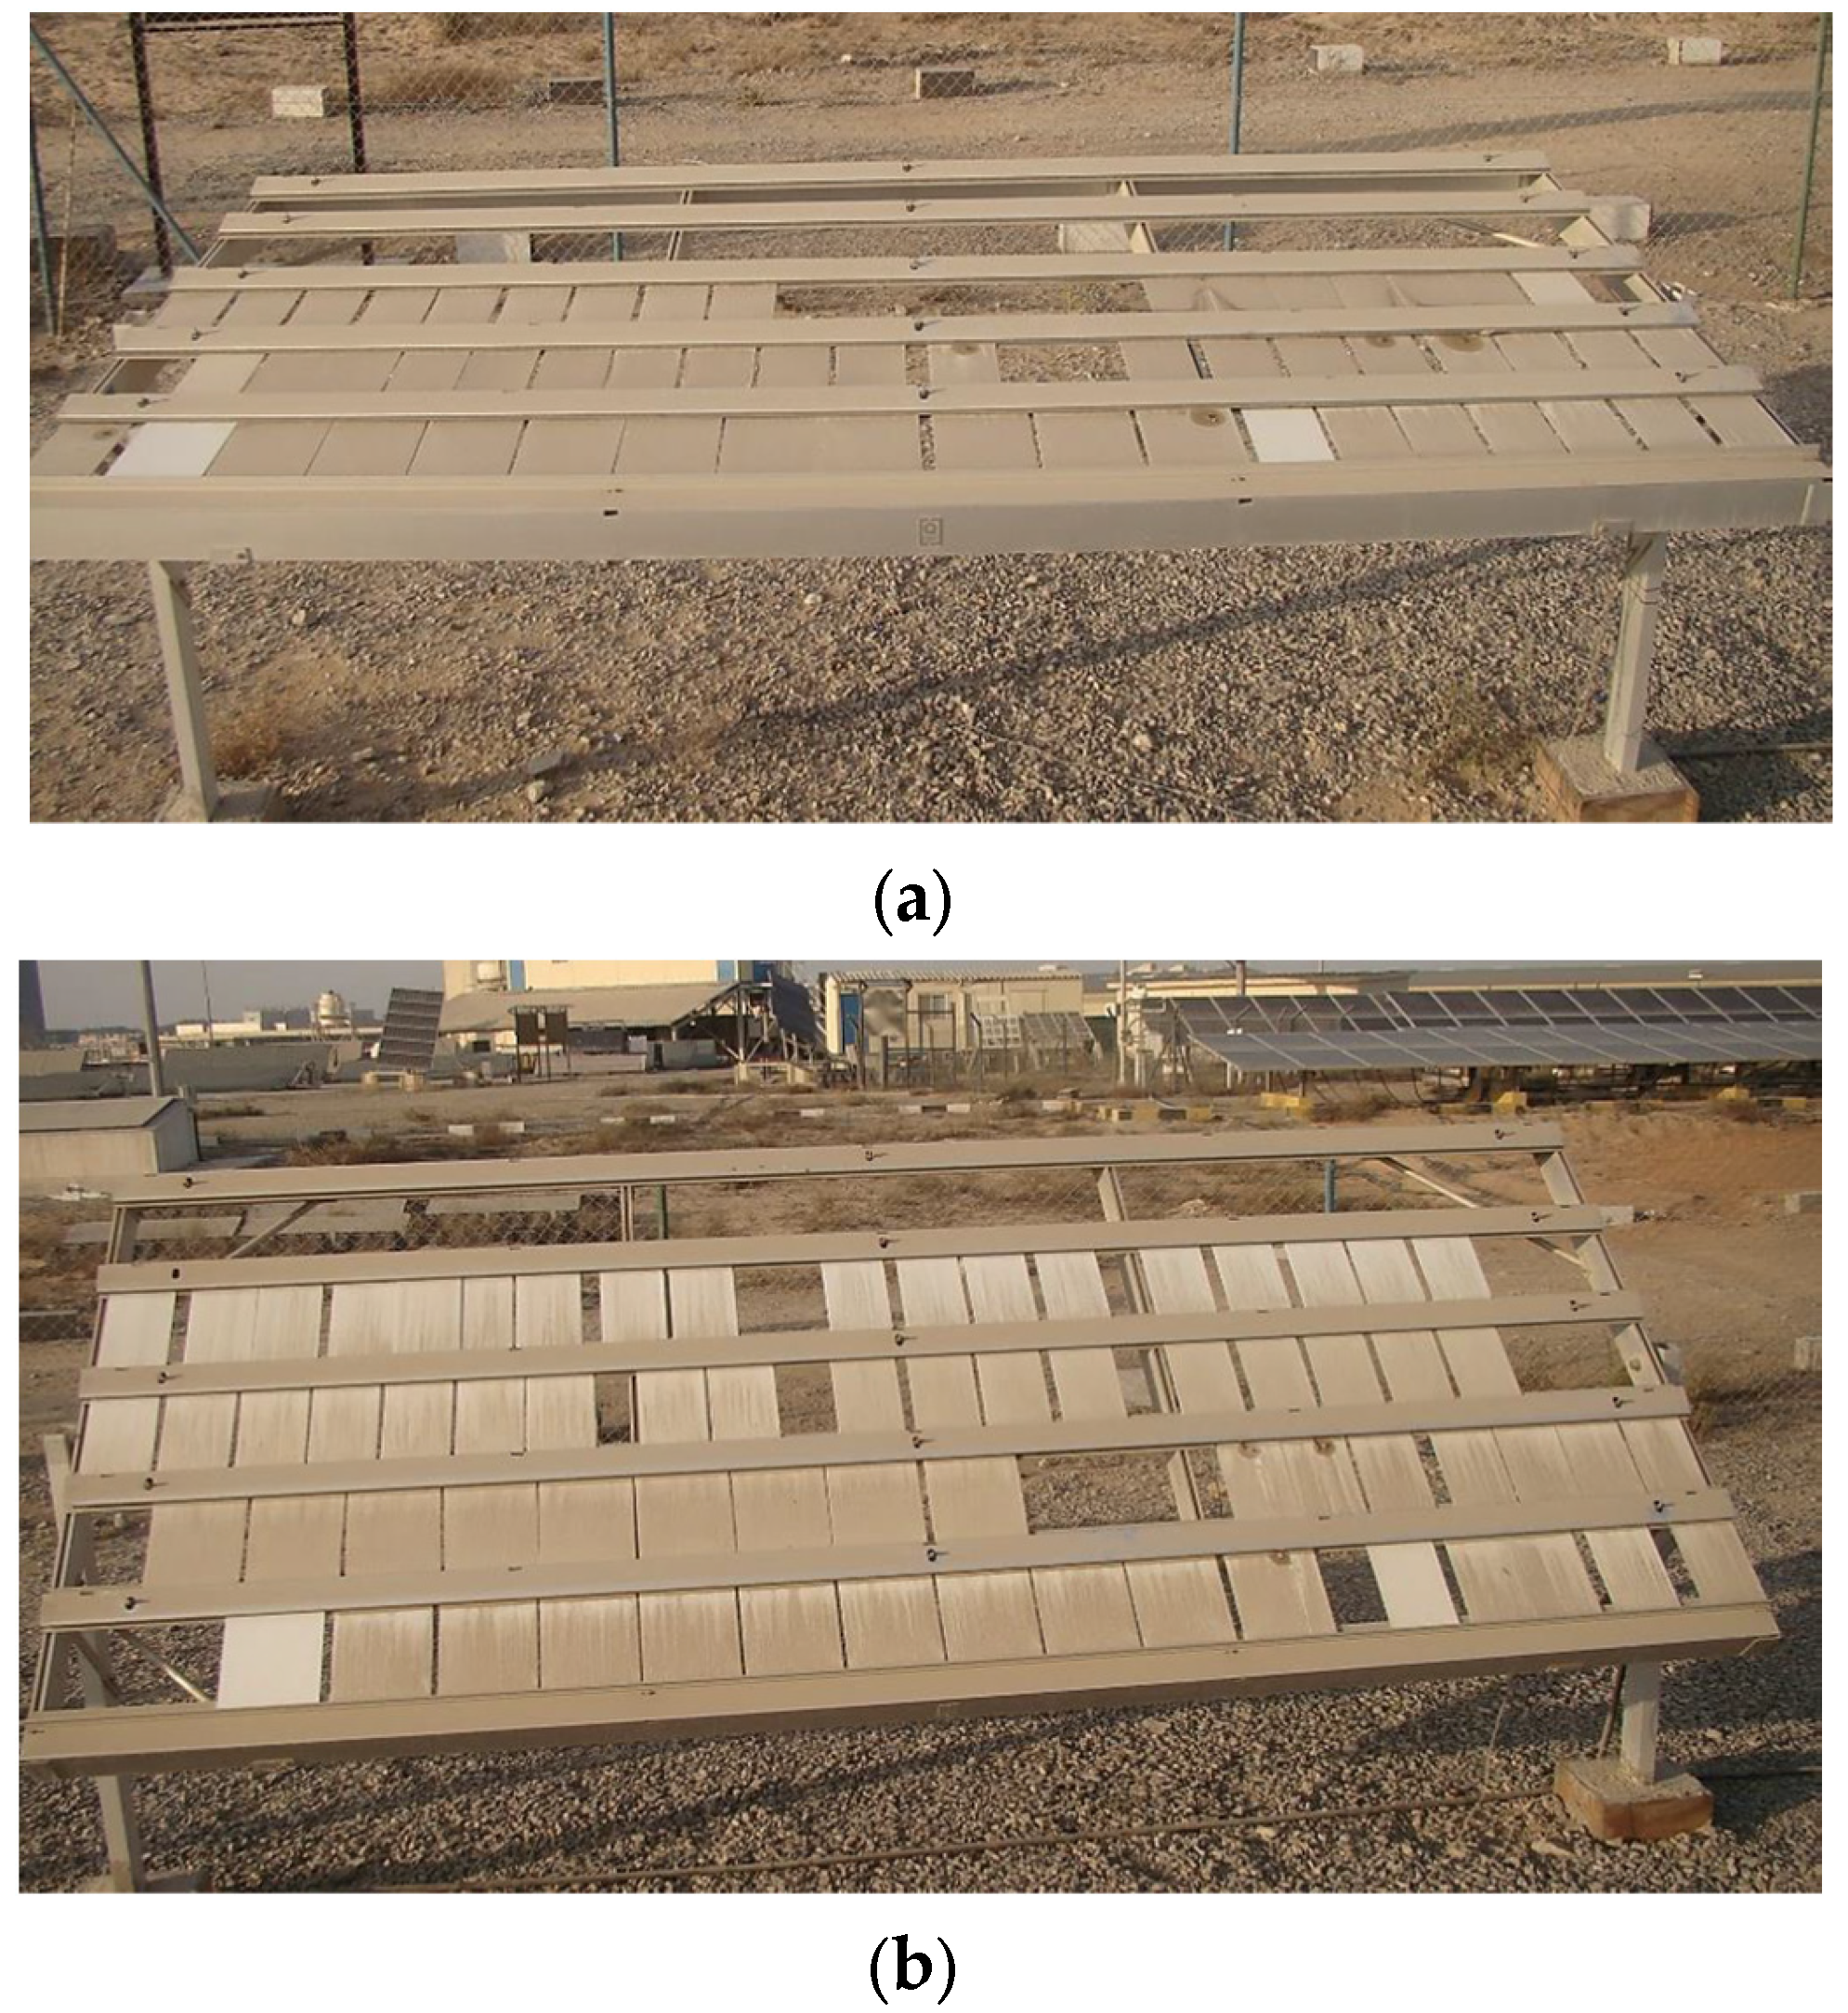
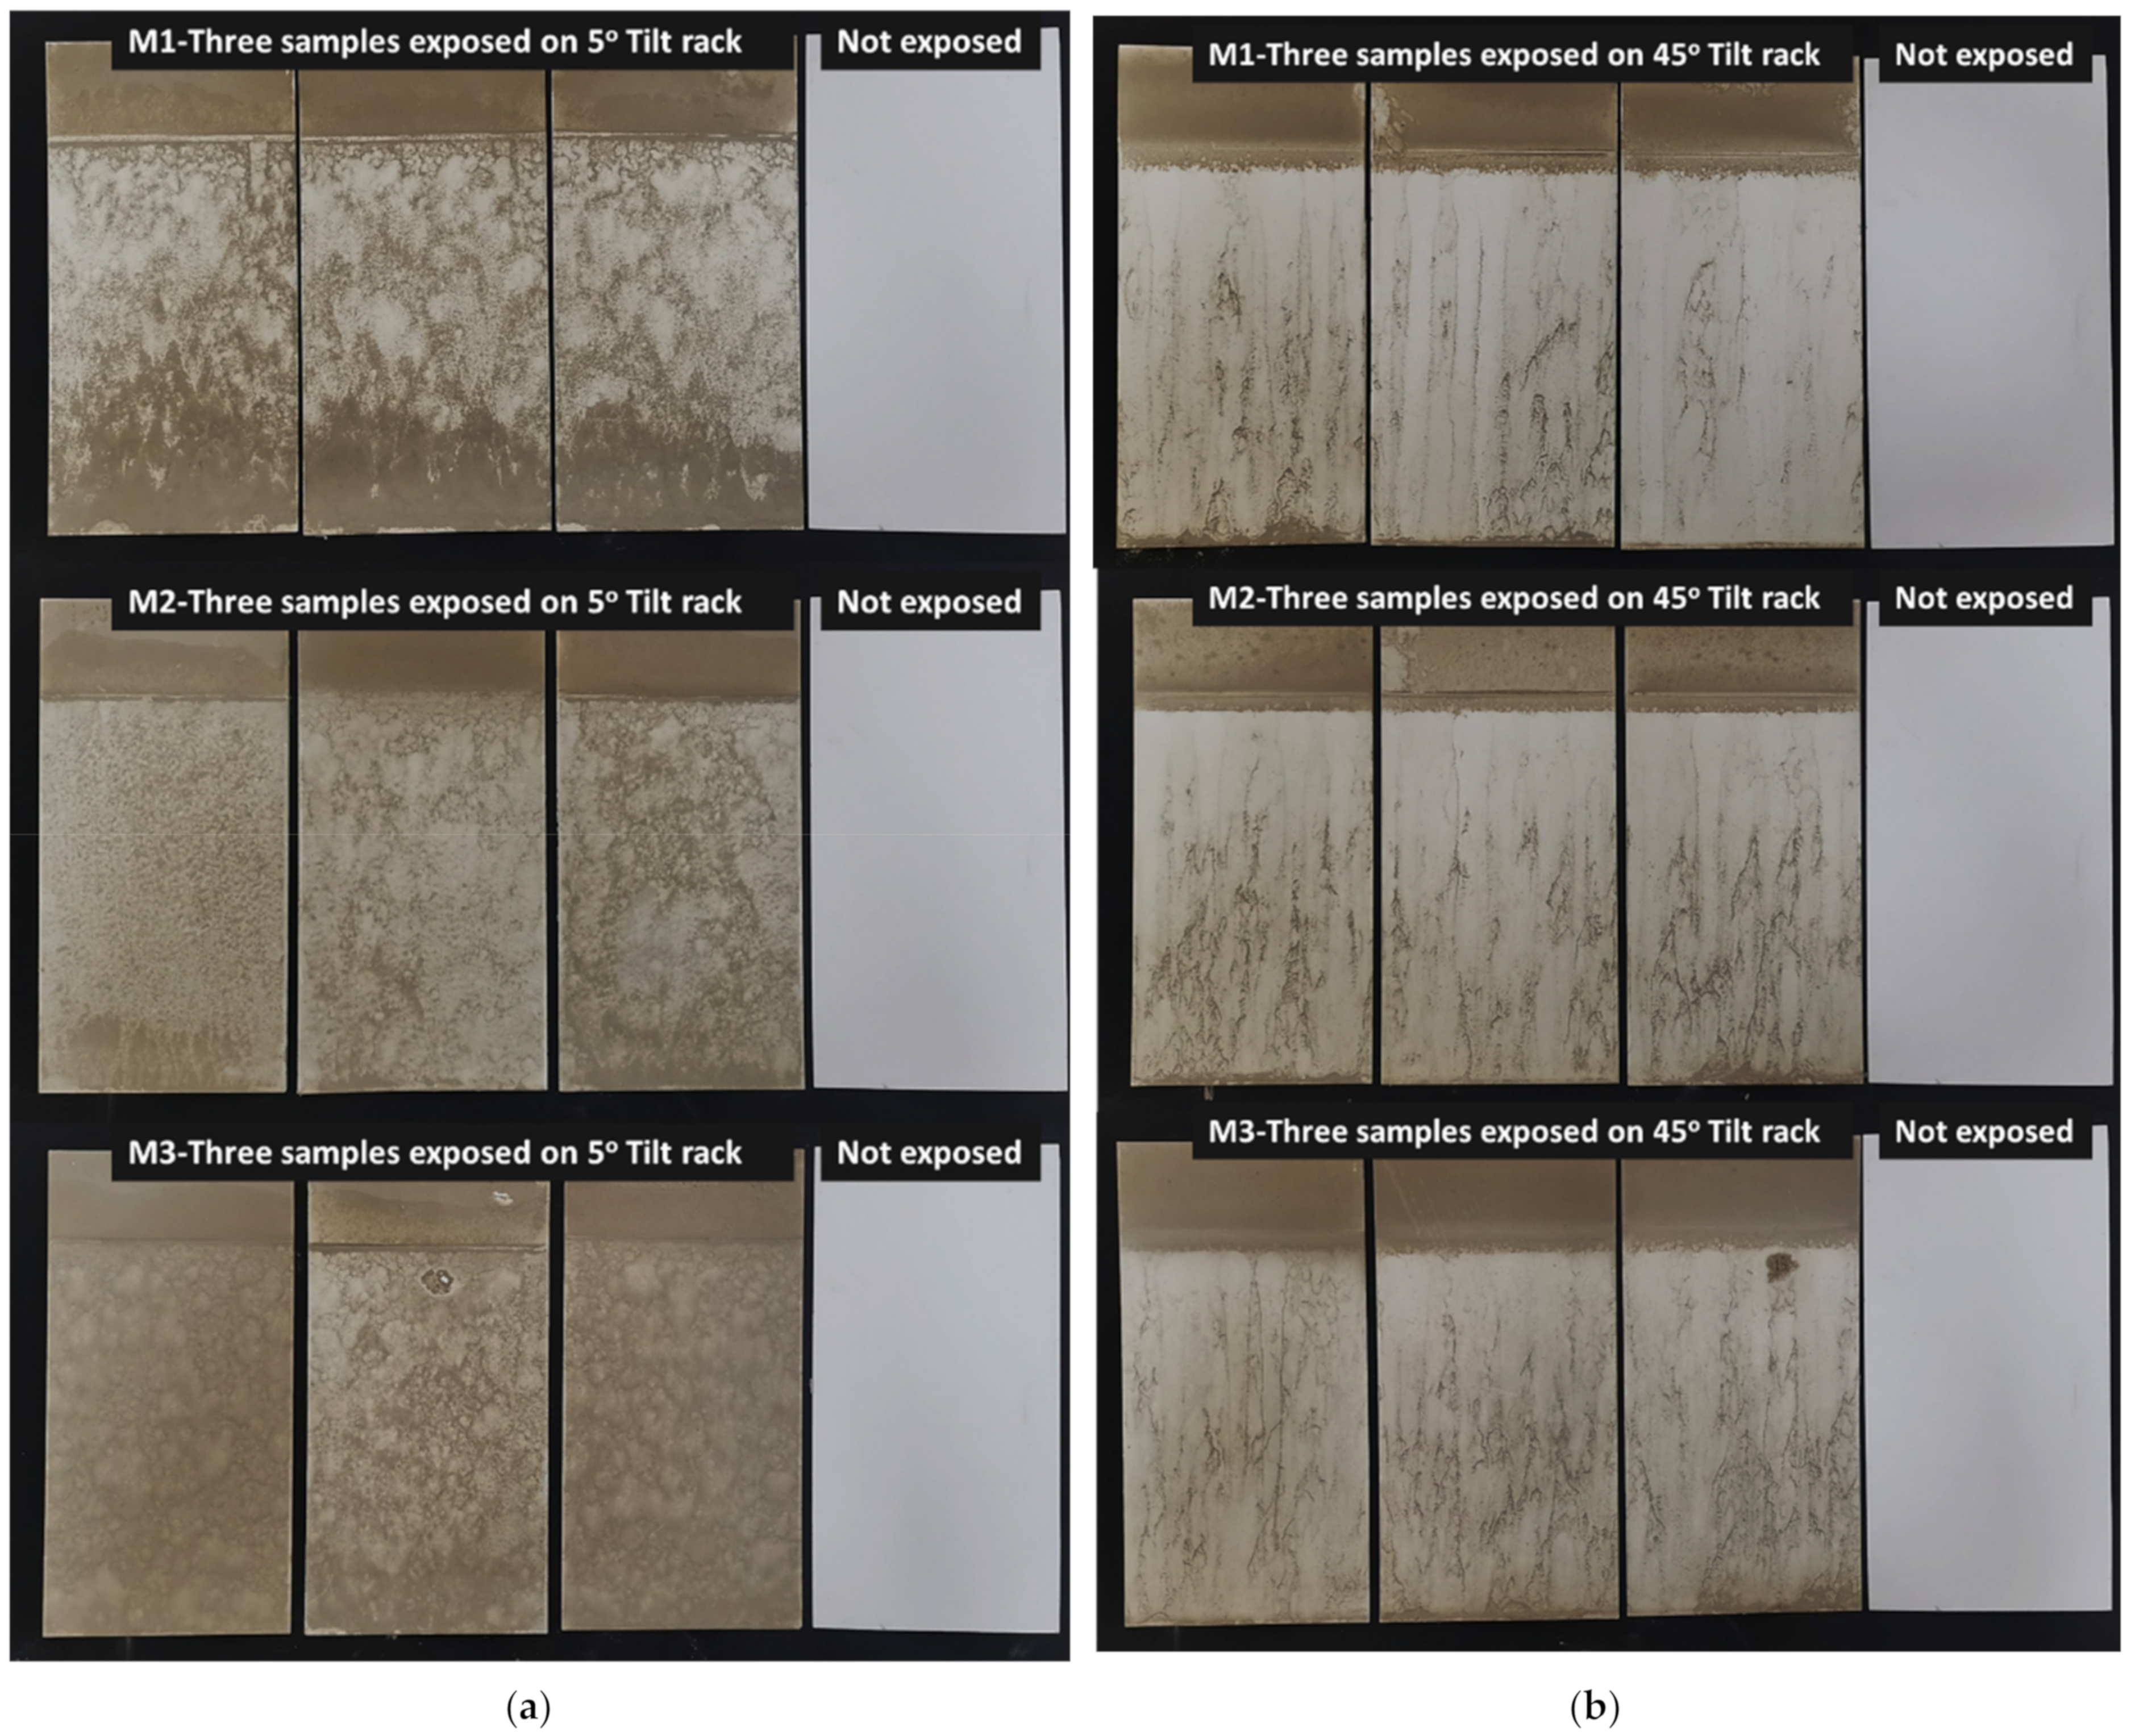
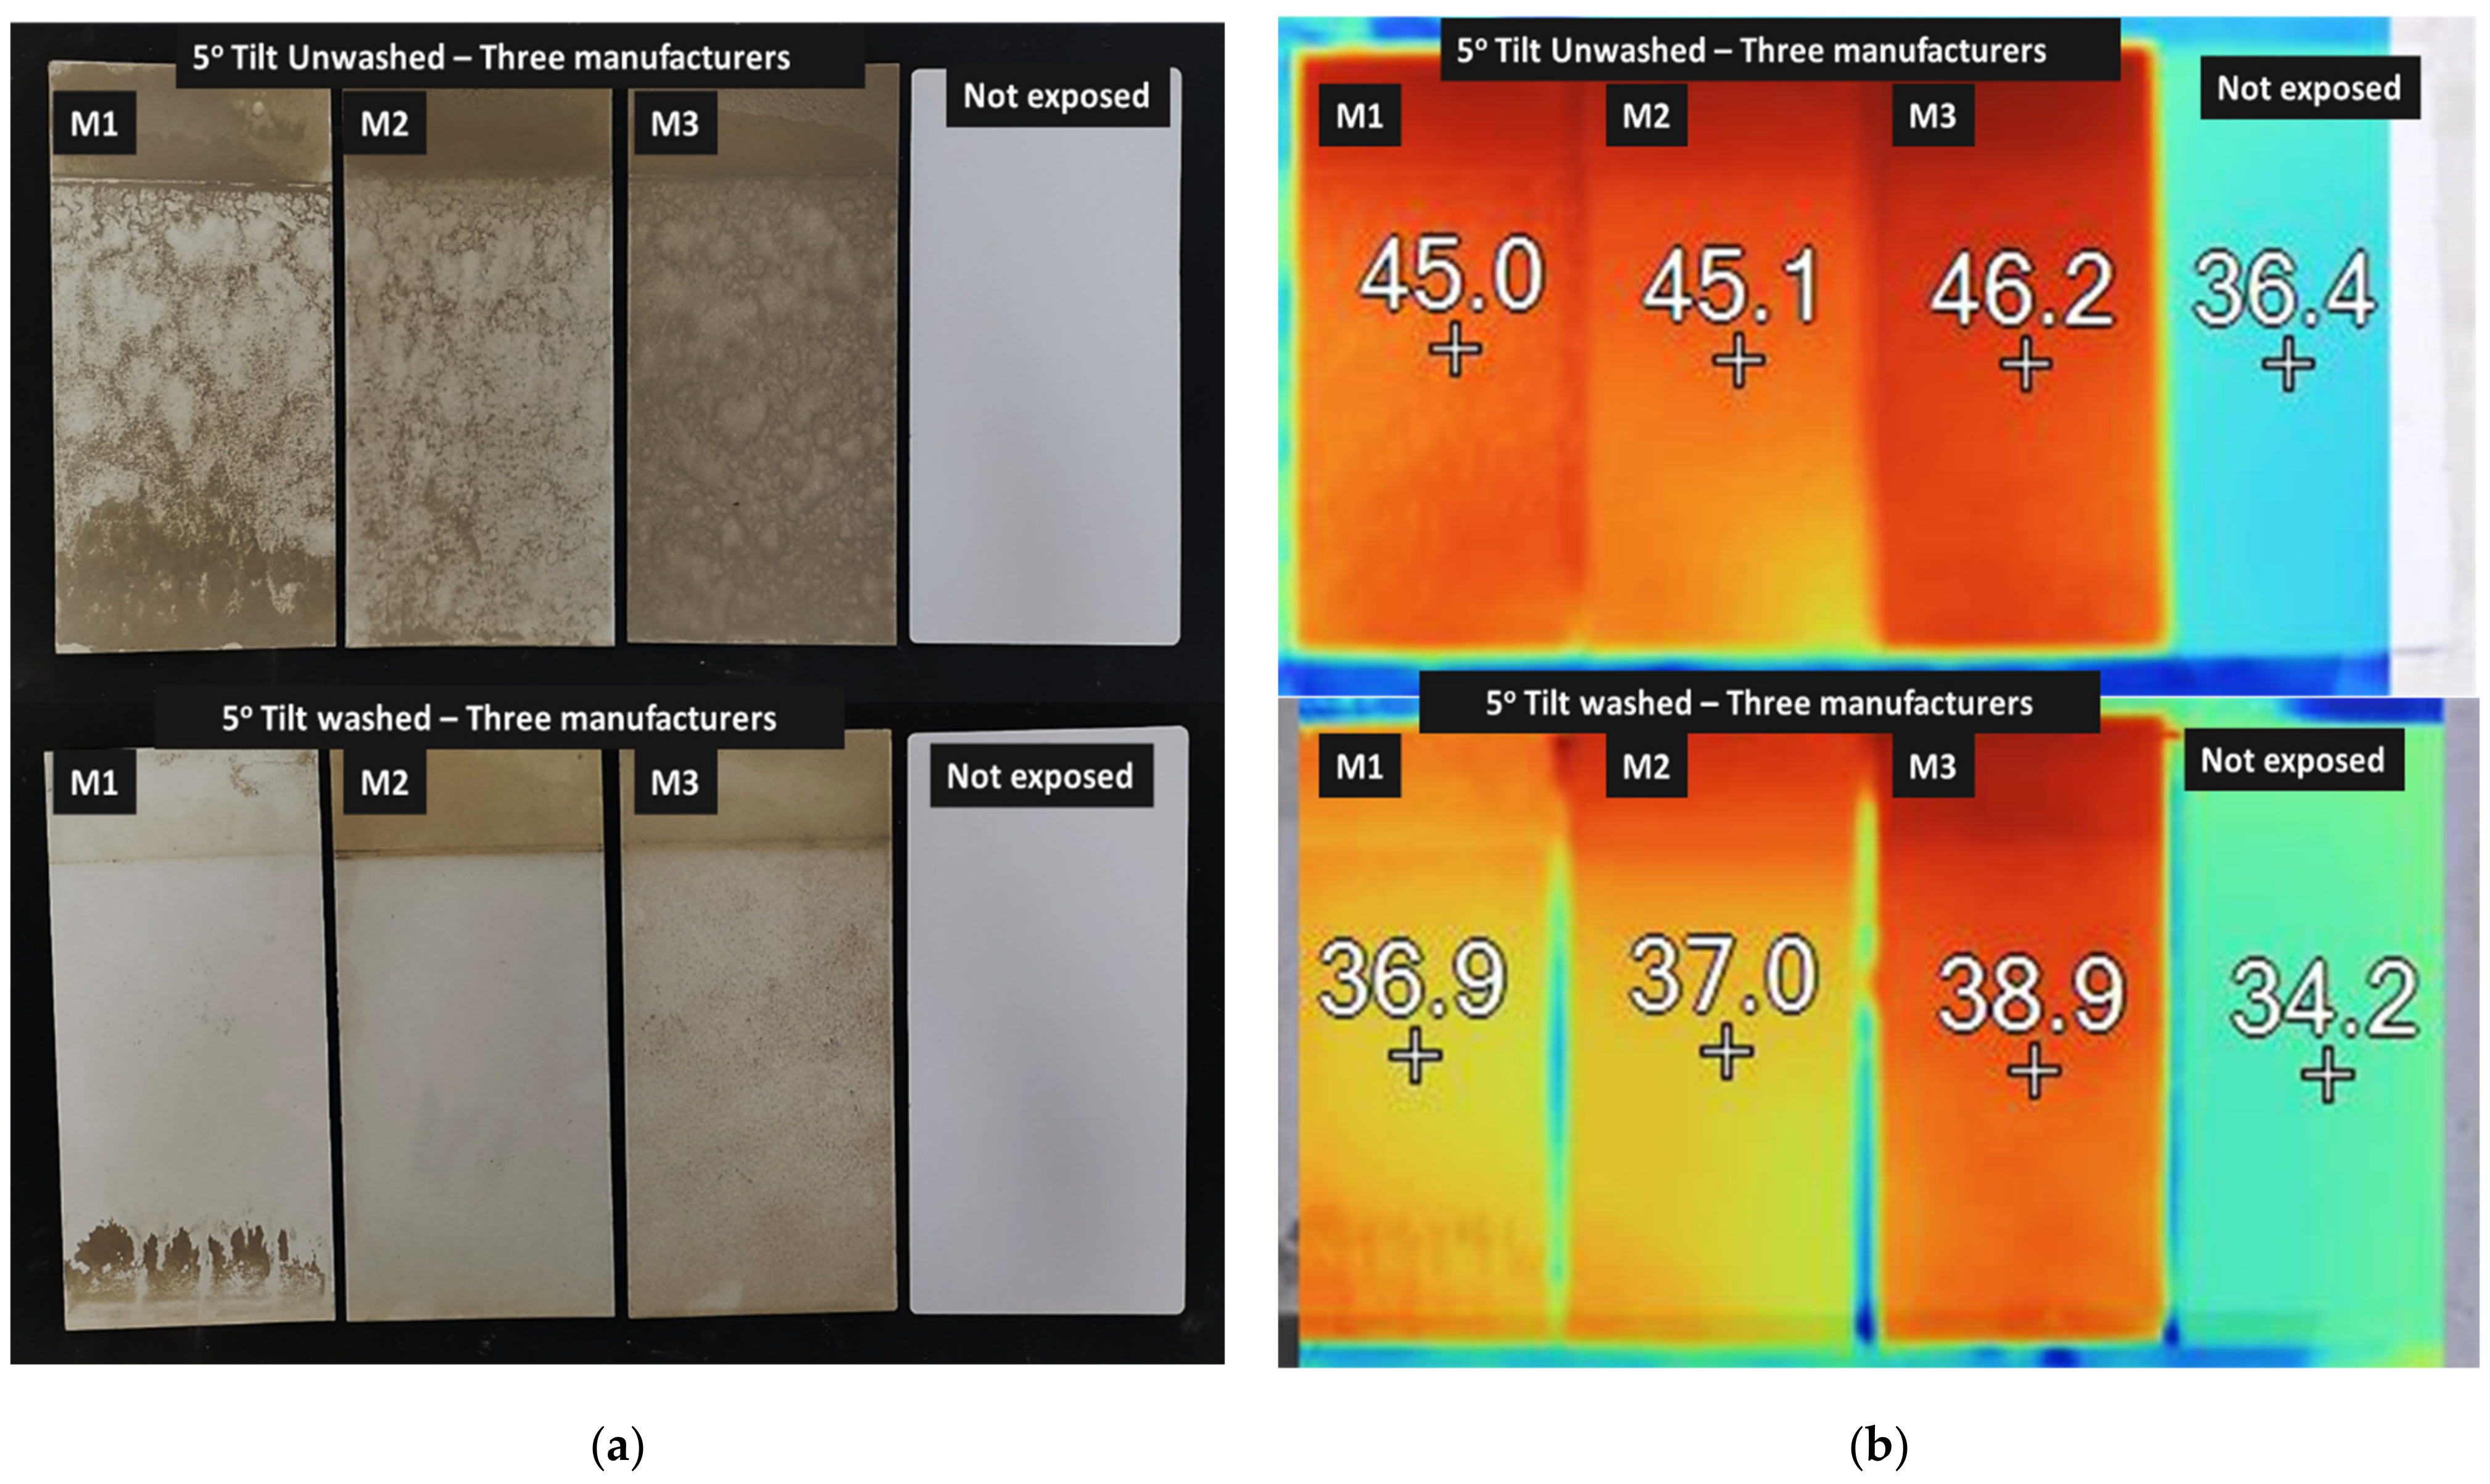
3.2. Images after Weathering/Aging

During the initial six months of exposure on the outdoor racks, all samples show a significant decrease in SRI values, owing to the high accumulation of dust on the sample panels as shown in Figure 6 (image includes other samples with different substrate). Figure 6 shows the images of the samples taken indoors after a 3-year exposure period at two different tilts from various manufacturers. As shown in the images, samples exposed at a low tilt (Figure 7a) show a high amount of dust accumulation, owing to less water runoff compared to the samples exposed at a higher tilt (Figure 7b).
The characteristics of the particulate matter and precipitation affect the macroscopic appearance of the dust and alter surface appearance. All the samples exposed also showed noticeable discoloration due to dust compared to the non-exposed samples. As evident from Figure 6 and Figure 7, images reveal that there were obvious environmental influences, and the appearance of samples from M1 and M2 show fewer esthetic surface alterations and less color difference, compared to M3 in terms of dust infusion or chalking. Samples of M3 exposed at 5° tilt became darker with high dust penetration, while the same samples at 45° tilt did not blacken or discolor, compared to others on the same tilt.

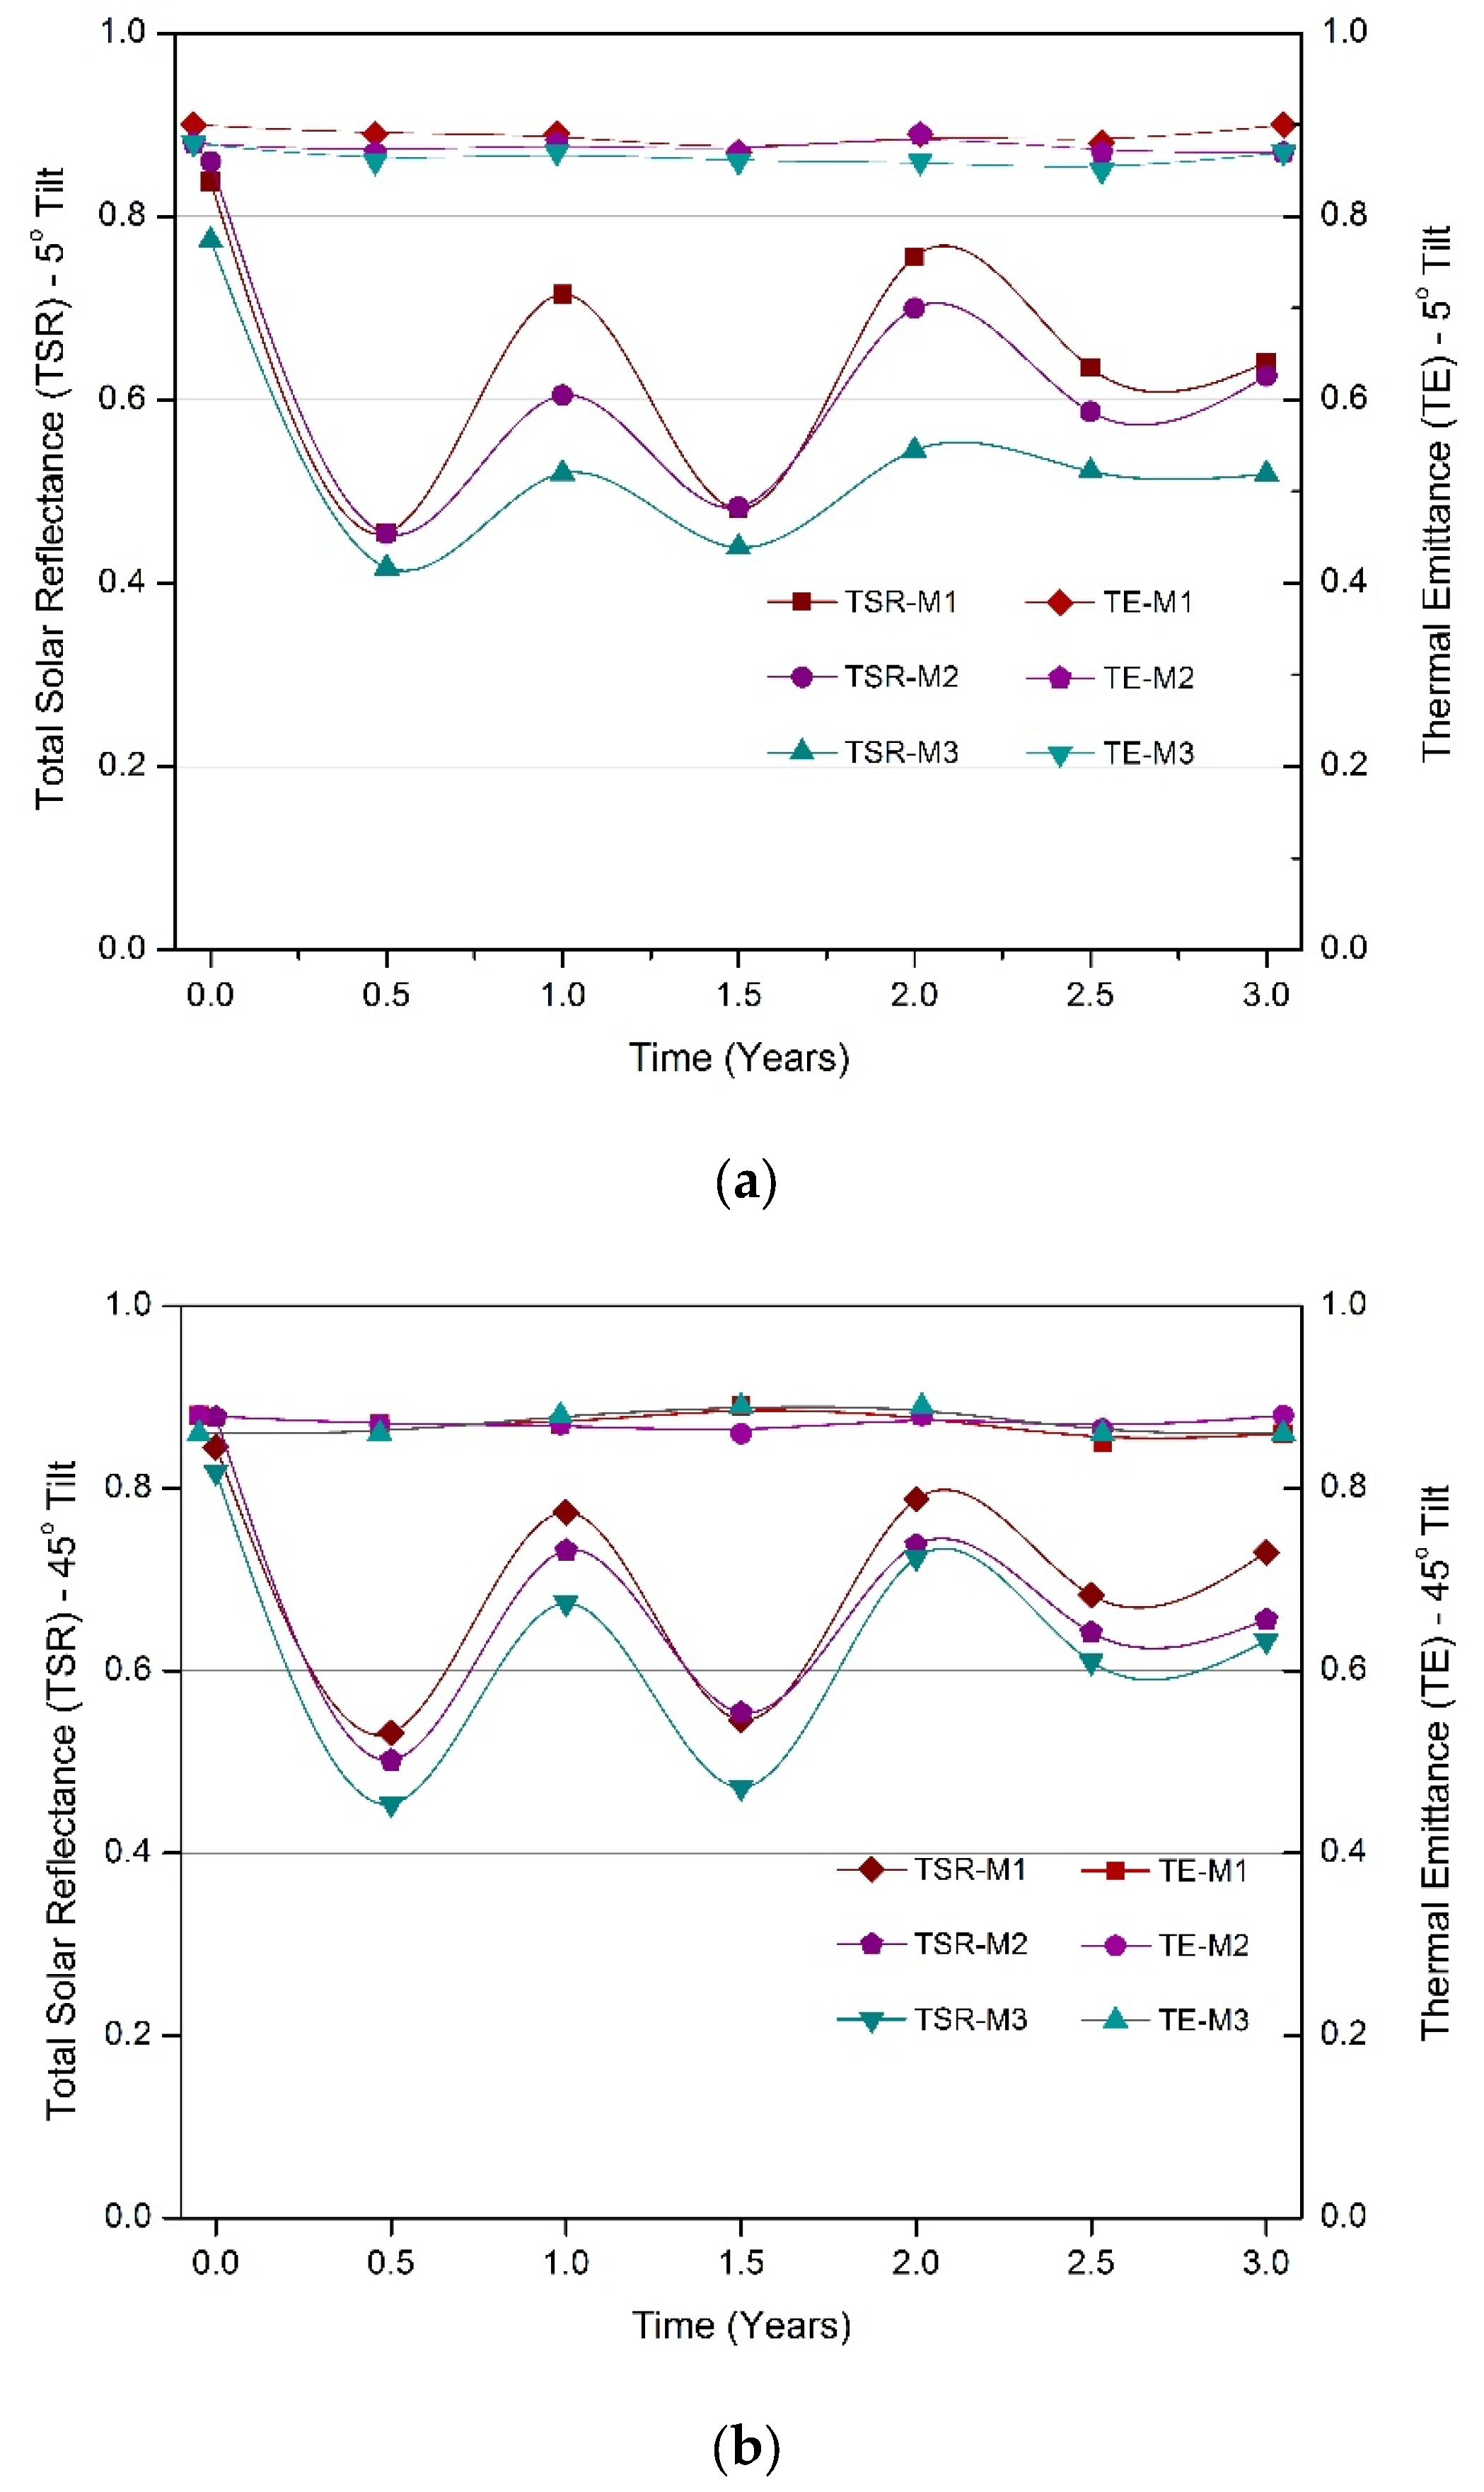
3.3. Reflectance and Thermal Emittance

As shown in Figure 8, the reflectance values tended to decrease sharply during the initial six months of the exposure period and further appears as a sinusoidal wave until the 3-year exposure period. The changes in reflectance of the panels were due to obvious environmental effects; high dust during summers and rainfall during the winters as shown in Figure 9 of the next section.
Samples of M3 exposed at 5° tilt (Figure 8a), showed the least retention of reflectance value at the end of the 3-year exposure period. High penetration of dust was observed on the M3 samples. The average reflectance value of M3 exposed on low tilt was 0.53 with an amplitude of 0.35 and for the higher tilt exposure, the average reflectance was 0.62 with a similar amplitude of low tilt samples. On the other hand, samples from M1 exposed at low tilt showed the least decrease in reflectance values over the exposure period, with an average reflectance of 0.64 and amplitude of 0.38. As shown in Figure 8a,b, the variation in emittance is very little and almost constant with the time of exposure in all samples, agreeing with the results previously found in the literature exposed in other parts of the world [21]. Emittance values remain almost constant (average ≈ 0.872) over the period of exposure for all manufacturers, concluding that reflectance contributes majorly to the determination of the SRI of coatings. However, thermal emittance is an important parameter due to its contribution to the “urban heat island” effect and has a greater impact on adjacent buildings.

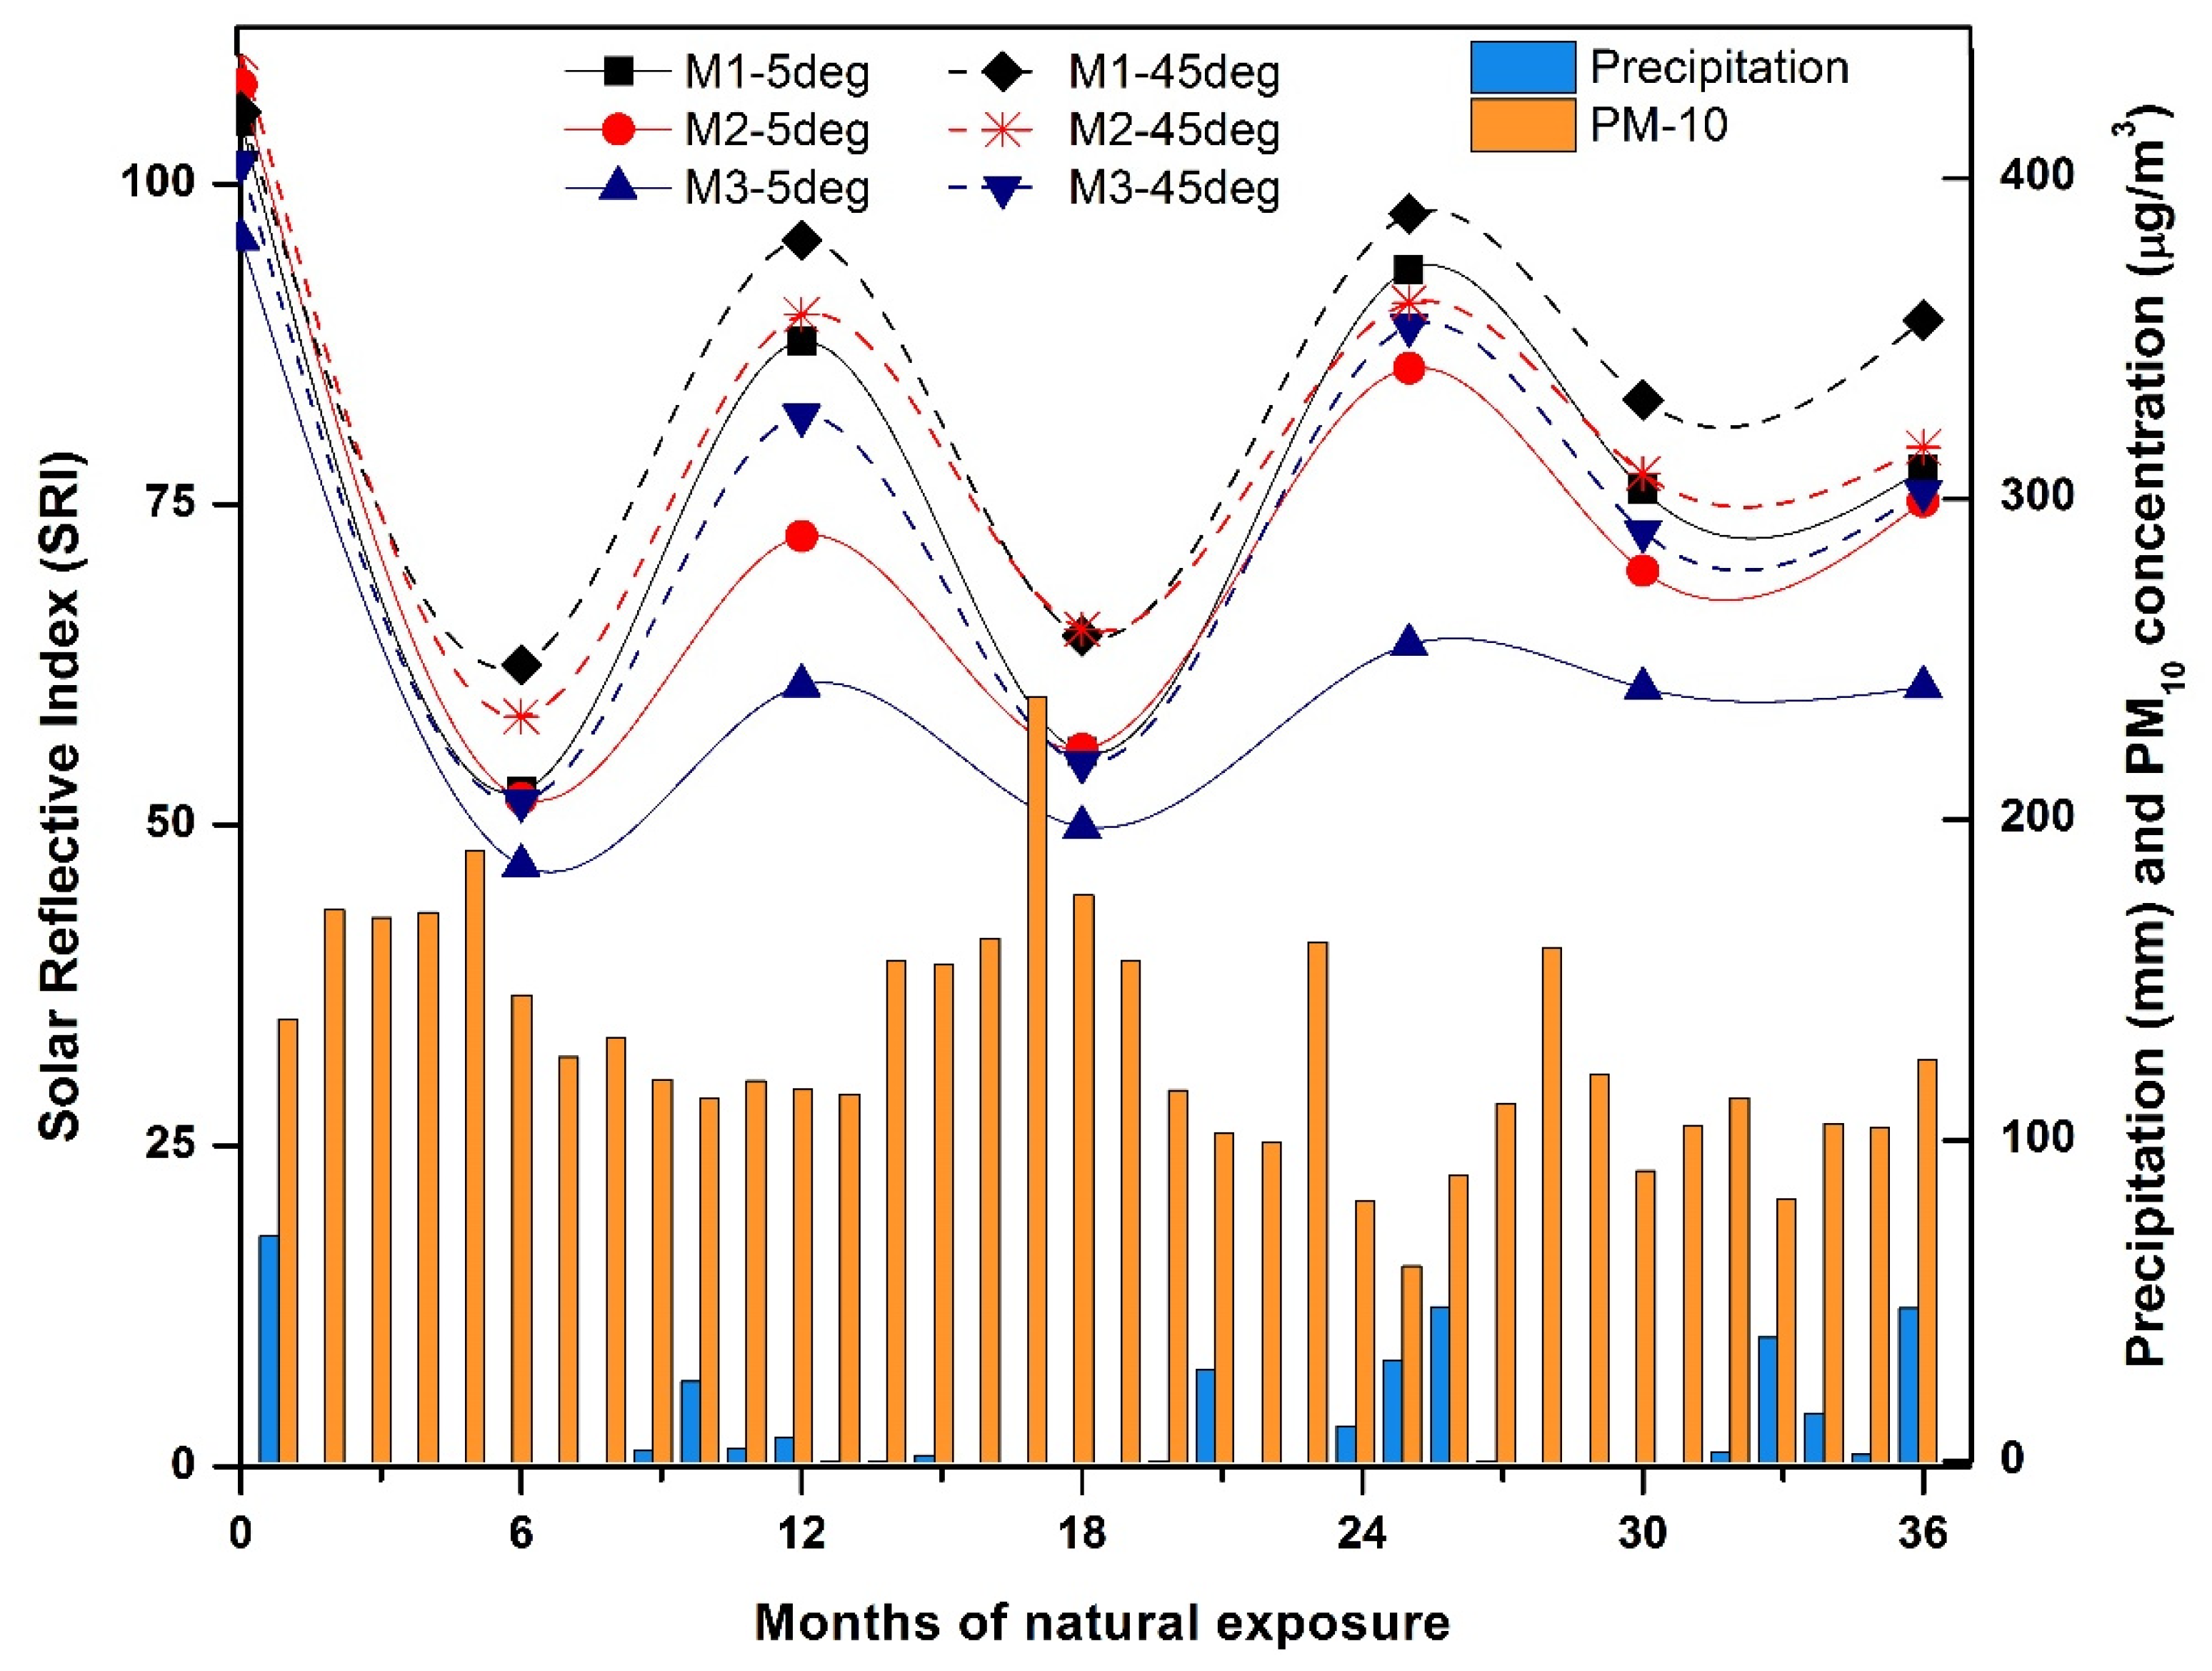
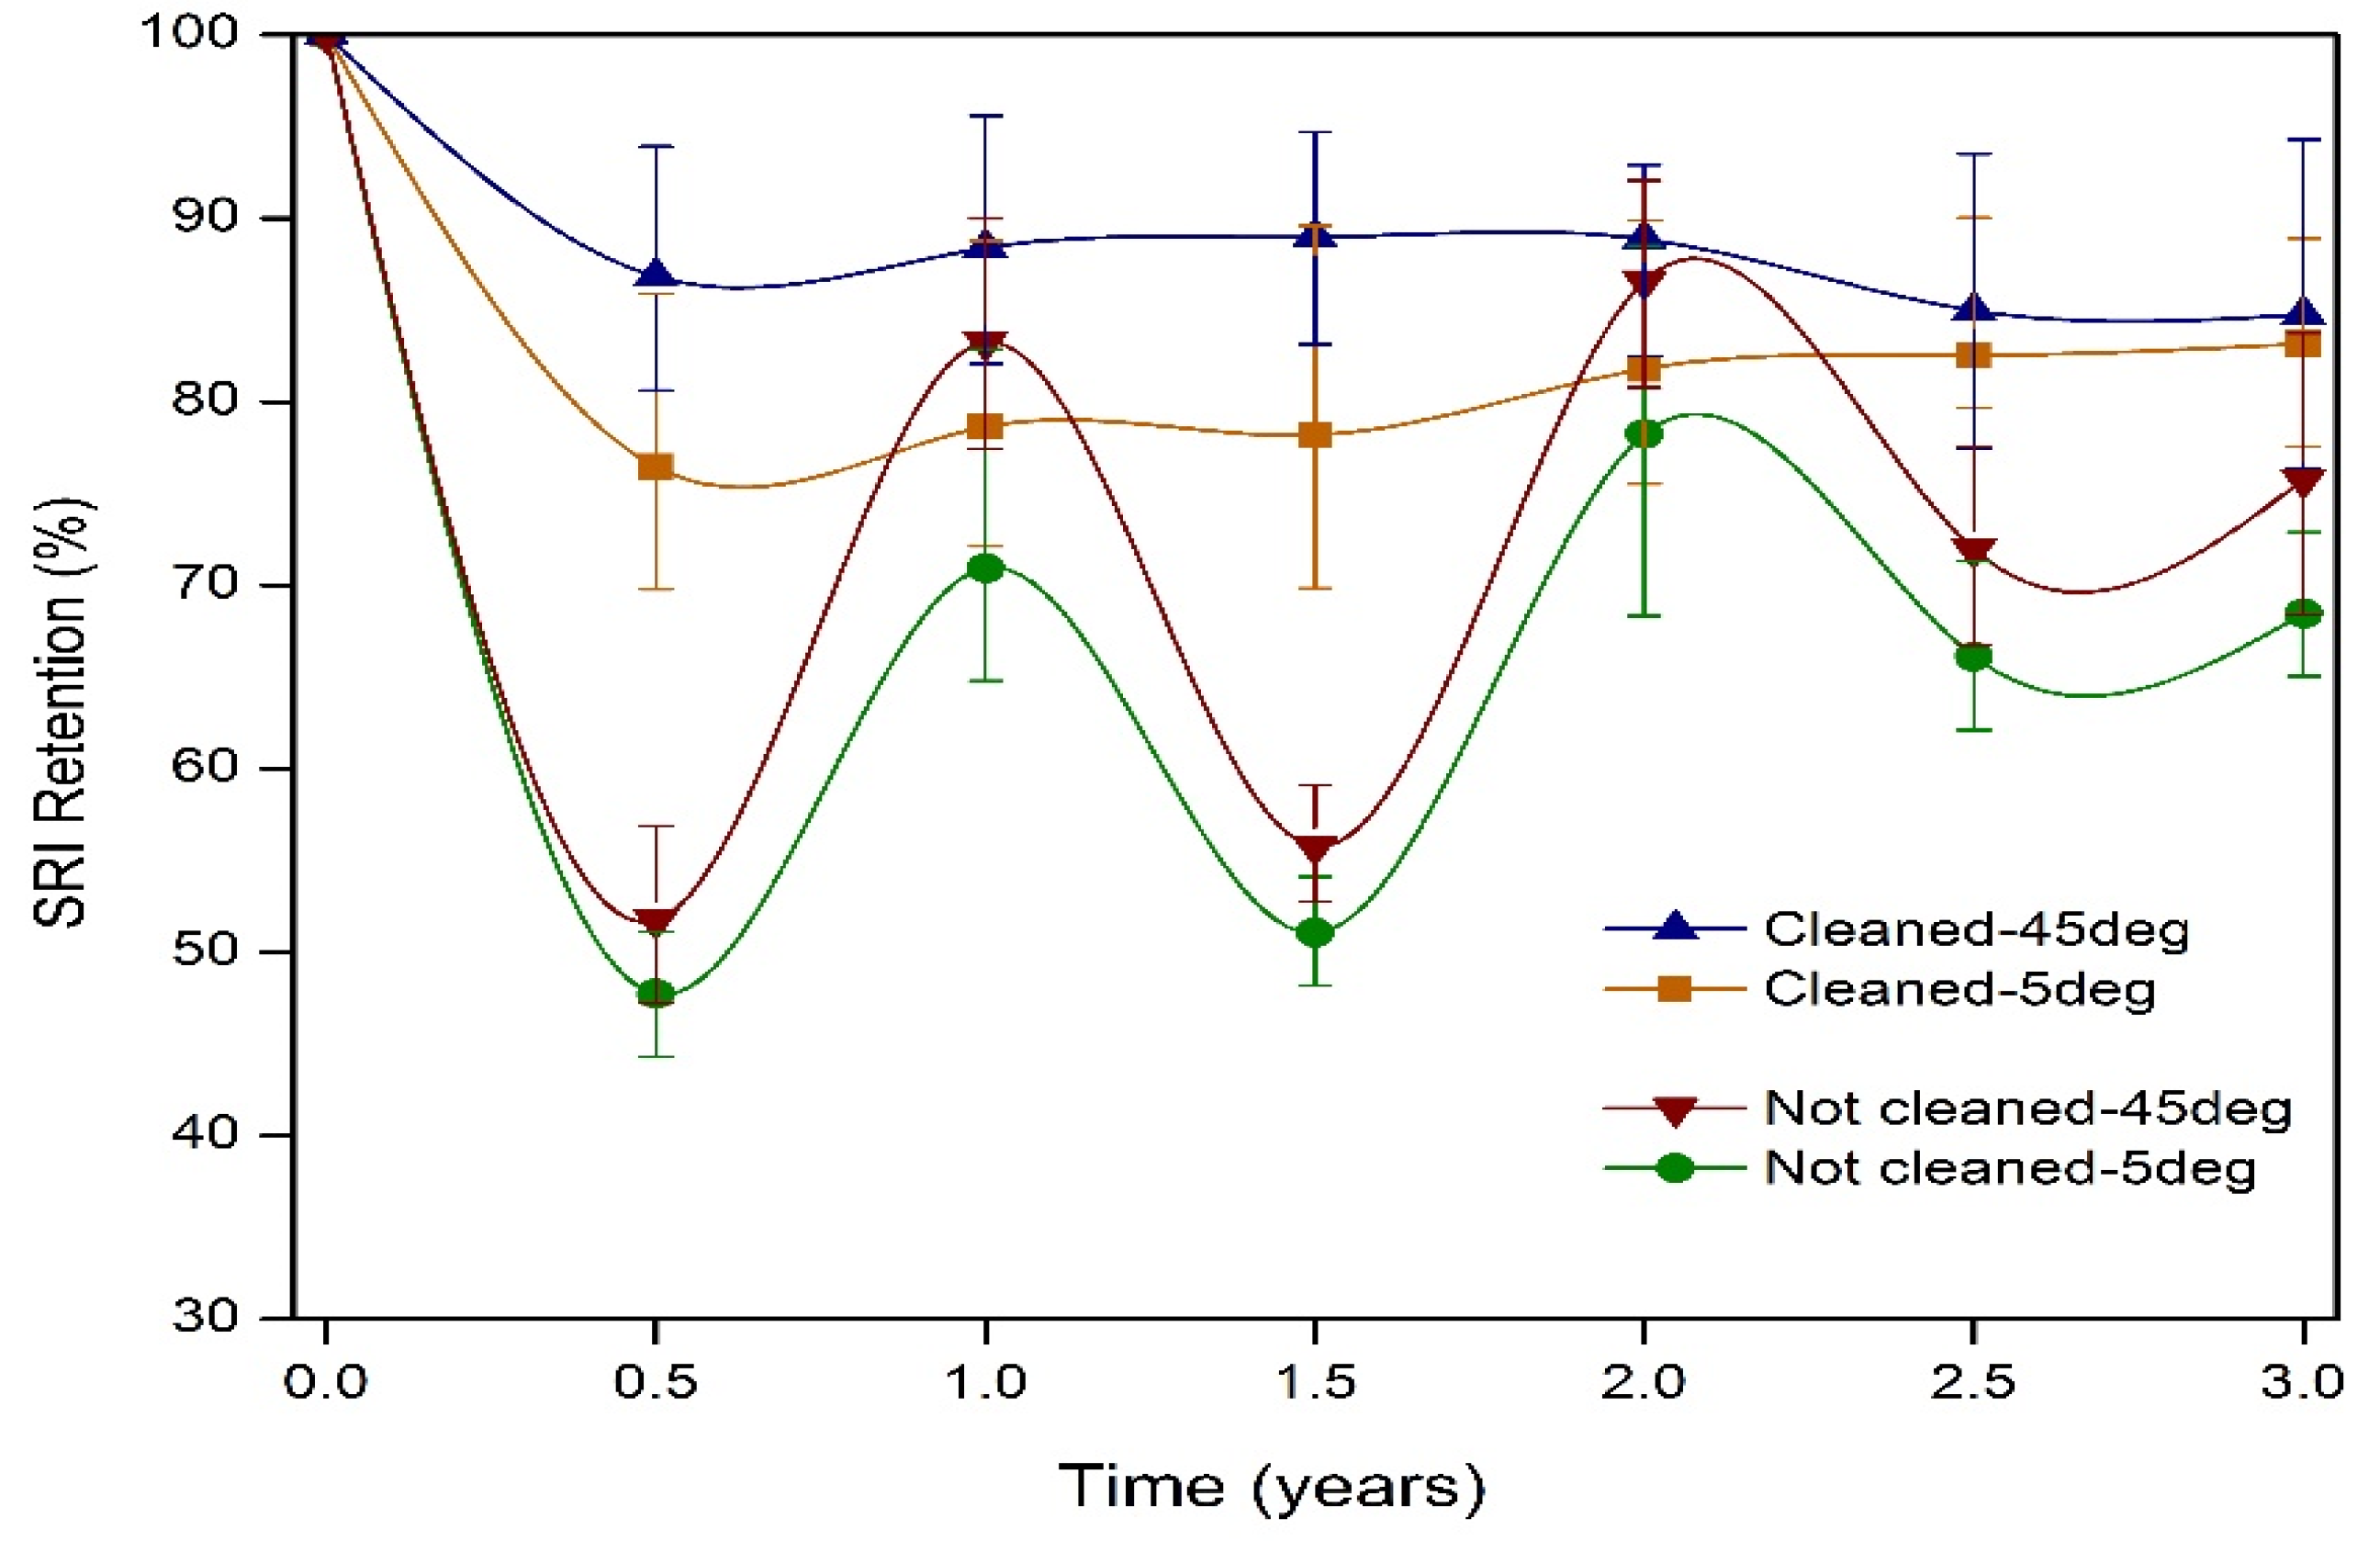
3.4. Analysis of Solar Reflective Index

Based on the calculation procedure in ASTM E 1980-11, the reflectance results were combined with emittance measurements to obtain the solar reflectance index (SRI). Figure 9 presents the variation in SRI with the exposure period and correlates with the environmental factors discussed earlier (dust and rainfall). The SRI during and after three years varied among all the manufacturers and varied based on the tilt osf the racks they exposed. After 3 years of exposure on low tilt, M1 showed the lowest decrease (26%), M2 showed a 30% decrease, and M3 had the highest decrease (37%), indicating a decreased tendency for panels of M3 to lose heat to the environment, compared to the other two. Similar trends were observed for samples exposed on higher tilt, with the least decrease of 11% for M1 and the highest decrease of 23% for M3. Results indicate that the average decrease in SRI values between low and high tilt exposed samples was 14.3%. The ability to retain the highest percentage of SRI on 45° tilt exposed panels was due to less dust accumulation (shown in Figure 7) and high runoff due to the high rainfall in the final year of the exposure period. As shown in Figure 9, with high PM10 concentrations during the mid of second year of exposure, the SRI values dropped significantly. With a considerable amount of precipitation during 24–26 months, a gain in SRI values was observed. More stability in the SRI values was observed during the third year of exposure, owing to the balanced environmental conditions.
Figure 9. Solar reflective index (SRI) as a function of natural weathering without periodic cleaning.
Buildings 12 01002 g009
SRI values after 3 years of exposure for roof coatings indicate that samples from M1 and M2 have SRI > 64, and they should be accepted as cool materials as per the guidelines of regulatory bodies. However, for the samples of M3, the SRI values fall below the requirement due to their inherent material properties. When compared with the manufacturer (M3) data of 3-year aged coatings in benchmark locations in the USA, the observed SRI value is lowered by 21%. The results indicate the significance and necessity for regional weathering of cool materials, which not only helps the authorities to regularize penetration of quality products into the market, but also aids the manufacturers to tune their product to perform better in those harsh climatic conditions.

3.5. Effect of Periodic Cleaning

Figure 10 shows the fluctuation of SRI as follows: initial SRI values (yellow bar only), and SRI values of exposed samples (yellow and blue bars combined), where blue shading indicates the change in reflectivity before and after washing. The specimens of various manufacturers were washed annually, and the increase in SRI values is presented in Figure 10. Observations show that the increase in SRI values during the second year washing cycle was lowest, whereas the highest increase in SRI values was observed during the third year washing cycle. Therefore, the adhesion of contaminants after 3 years of exposure may contribute to major degradation of the coatings. Additionally, the trend shows that samples exposed at a higher slope or tilt have less increase in SRI values due to washing, compared to samples exposed on a low slope or tilt. After 3 years of exposure, the highest increase in SRI value due to washing (21%) was obtained for M1 exposed at 5° tilt, and the least increase (9%) was obtained for M3 exposed at 45° tilt.
Figure 11 presents the retention of SRI values for cleaned and non-cleaned samples during the exposure period of 3 years with periodic washing cycles employed for every 6 months. With regular cleaning in place, the average retention of SRI values was stable over the exposure period for both high- and low-sloped exposures. At the end of three years of exposure, for the unwashed samples, the average percentage retention of SRI values was 68.5% and 75.8%, respectively, for 5° and 45° tilt, whereas employing periodic washing cycles reduced the gap between these values from 7.3% to 1.6%.
The results indicate the importance of washing cycles, especially for roof coatings. The issue of whether or not to permit “washing” of the sample has received much attention in the development of the CRRC’s “aged test protocol”. Current practice is to measure the radiative properties of exposed samples without cleaning in order to best reflect “real-world” conditions [41]. However, many regional manufacturers hold on to the “pro-wash” argument, stating that (1) through washing, their materials can restore close to their initial solar reflectance values, and (2) hence, washing should be encouraged by adopting it as a requirement in the region. In fact, the conditions in UAE are harsh compared to the benchmark location in the USA (Florida, Arizona), and concerns were raised by many manufacturers that their products could get surprisingly different results, compared to weathering tests elsewhere. One study on 5 years aged reflective properties showed that simple washing with detergent and algaecide brought back 90% of their original reflectivity values [42]. Our findings prove the argument to be correct and show a retention of 80–90% of the original values with regular (6 months) washing cycles. The hot conditions of the UAE might prevent algae or fungal growth, but the very dusty and sandy surfaces could be restored to normal conditions by employing simple washing cycles.
Further, in order to determine the preferred season for the maintenance cycles, exposed samples were washed during both early fall (September) and spring (March) seasons in UAE, and the percentage retention of SRI values are reported in Table 3.
The maximum average difference in SRI retention during the two seasons was observed to be 3% with the lowest retentions shown during the fall washing cycle. This is due to the high soiling of the surfaces in summer and high precipitation during winter enhanced SRI retention values during the Spring washing cycle. However, if only annual cleaning is employed, it is preferred to clean during the fall cycle to ensure consistent energy savings. The finding is in contrast to the literature study preferring the spring washing cycle in Italy [38].

3.6. Thermal Imaging for Surface Temperatures

As mentioned earlier, infrared thermal imaging was used to investigate the temperature on the surface of the coated panels and to understand the differences in their thermal performance. Figure 12 presents a visible and an infrared image of the three selected manufacture coatings exposed on 5° tilt.
The surface temperatures were measured during midday hours and compared for these samples before and after washing at the end of the 3-year exposure period. It was found that the sample temperatures were quite uniform on the test surface, but small temperature gradients were present around the edges of the samples, influenced by their surroundings. A very important factor regarding the thermal performance of coatings is ‘‘dirt pick-up’’ resistance. As shown in Figure 12b, there was degradation in the thermal performance of tested samples, indicated by an increase in surface temperatures compared to the unexposed cool coating. The higher the dust pick-up resistance, the lower the temperature difference between exposed and unexposed samples (as in the case of M1 in Figure 12), indicating better reflection and thermal performance. All the exposed washed or unwashed sample panels in the study were characterized by higher surface temperatures than the surface temperature of unexposed samples. The coolest coatings were from M1, which are 9.6 °C warmer than unexposed samples, while the samples from M3 were 10.2 °C warmer. Further washed samples after 3 years of exposure showed significant improvement in thermal performance with a decrease in average surface temperatures of 7.2 °C. When compared with the unexposed samples, the washed panel’s surface temperature difference with respect to unexposed panels ranged between 2.7 and 4.7 °C. Even though all coatings studied are of a similar type, (water-based acrylic coatings composed of ceramic microspheres dispersed in an acrylic polymer emulsion), they experienced differences in mean surface temperatures caused by differences in their reflectance, discoloration, and dust penetration, which is clearly visible in Figure 12a (lower image).

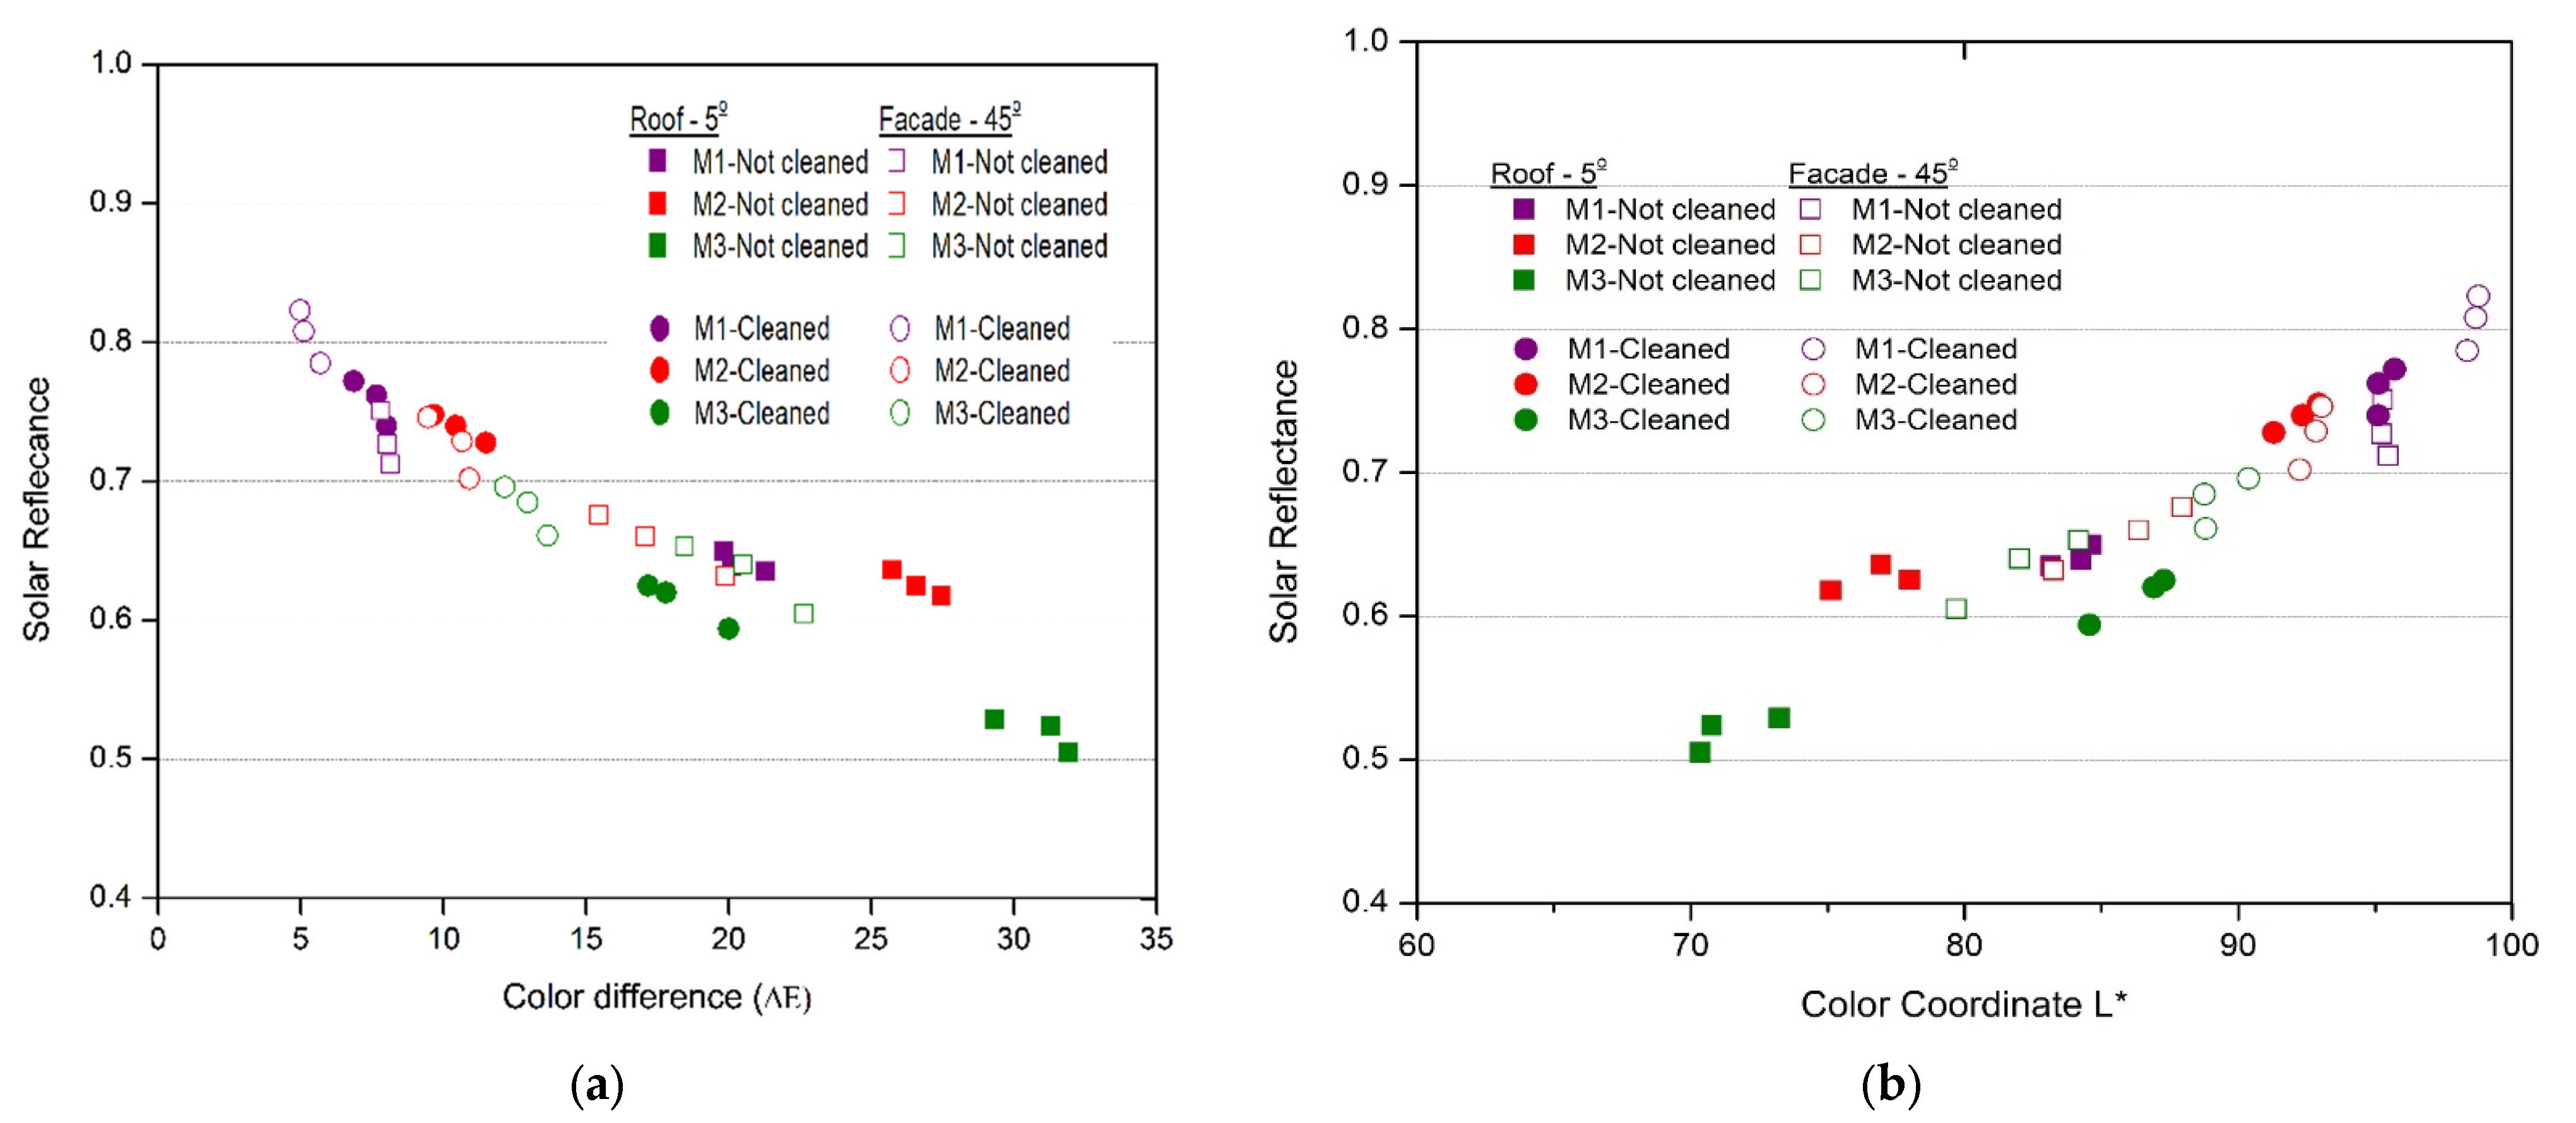
3.7. Color Difference and Reflectance

The results presented in Figure 13 show the reflectance as a function of color difference (ΔE) after 3 years of exposure. In general, the decrease in reflectance is inversely proportional to the increase in color difference (Figure 13a). For the samples exposed on a low slope rack, the color difference of unwashed samples at the end of the exposure period ranged between 20 and 32, while the samples exposed on a steep slope exhibit a color difference range between 7.8 and 22.6. The sample of M3 placed at a 5° tilt had the highest color difference, whereas a sample of M1 placed at a 45° tilt had the least color difference values.
Further, washing the samples after three years of exposure significantly decreased the color difference with respect to unexposed original samples. The color difference of washed samples ranged between 6.8 and 20 for low slope exposed samples, while the values ranged between 5 and 13.6 for high slope exposed samples. The decrease in the L co-ordinate (White = 100 and black = 0) follows an opposite pattern, compared to the color difference. The decrease of L was directly proportional to the reflectance decrease, indicating darkening of the surface due to contamination reduced the reflectance (Figure 13b). Coordinate a, shows a tendency from green (negative) to red (positive). All washed and unwashed samples exposed on the low slope showed values below 5, whereas samples on the high slope have values recorded below 2. Further, the results confirm that the blackening of the surface (coordinate L) was more significant for decreasing reflectance in comparison with co-ordinate a. On the other hand, variation between 6 and 12 for low sloped samples and from 5 to 10 for high slope exposed samples (least for washed and highest for unwashed) was observed for coordinate b (blue-yellow). These values indicate a slight yellowing tendency after 3 years of exposure. The yellowing observed during outdoor exposure might be associated with the high UV irradiance, which might have resulted in photo-oxidative degradation and the discoloration of polymers [43]. Although all coordinates showed some correlation with reflectance, the color difference, ΔE, and the black-white coordinate, L, the correlations are most significant consistent with the results from other studies in the literature [21].

4. Conclusions

After careful observation of the results, all the tested samples could be termed as cool coatings, owing to their high SRI values which are greater than 95 before the exposure period. Every paint sample could be eligible for use in green ratings, according to the regulators in the UAE, owing to their high initial SRI values. However, it is apparent from our research that the long-term performance of these coatings might become compromised, due to the extreme weather conditions in the UAE. An important radiative property to be maintained for long-term performance is solar reflectivity rather than thermal emittance. The rate of reduction in radiative properties was analyzed using periodic measurements and was estimated to be between 15% and 35% (depending on the manufacturer’s material properties) over a 3-year period of exposure. Weather factors, such as high temperature, UV radiation, low rainfall, and dust concentrations in the UAE, might not be favorable for the long-term durability of the coatings in the region. In order to develop quality reflective coatings suitable for the region or to penetrate into the market, we stress the importance of testing the products in real regional climatic conditions. The periodic unwashed and washed evaluations for the SRI values provided greater insights into the SRI retention of such coatings through maintenance cycles over a period of time. We recommend an annual cleaning cycle for roof coatings preferably during the fall season to ascertain balanced SRI values throughout the year. The overall improvement in SRI retention with an annual cleaning regime, when compared with unwashed exposures, is around 10–20%. Thermal imaging and color difference measurements provided greater insights into soiling and dust penetration into coated surfaces. Visual and SRI determination results showed significant differences between the manufacturer samples studies. We recommend that the manufacturers consider testing different formulations with dust repellence or low elongation properties to ensure long-term durability and to ascertain continuous energy savings. Further, efforts must be made to improve the dust pickup resistance or self-cleaning property of the coatings, using nanomaterials or technology. As the aged testing requirement is not mandated by the authorities in the region to qualify cool materials, we believe that our research study will accumulate knowledge for drafting aged testing protocol in this region and aid in developing mandates by the regulatory bodies to encourage the penetration of quality products. The research study also benefits manufacturers, consultants, and energy practitioners to set high standards and encourage innovations to fine-tune their products for enhanced performance.

Author Contributions

T.U.K.N.: Conceptualization, Funding acquisition, Project administration, Formal analysis, Writing—original draft, Writing—review and editing. W.U.K.: Investigation, Formal analysis, Resources planning, Visualization, supervision, Writing—original draft, Writing—review and editing. All authors have read and agreed to the published version of the manuscript.

Funding

This research received no external funding.

Institutional Review Board Statement

Not applicable.

Informed Consent Statement

Not applicable.

Data Availability Statement

Not applicable.

Acknowledgments

The authors would like to thank Abu Dhabi Quality and Conformity Council (ADQCC) for providing funds to develop the natural weathering farm. We extend our thanks to Simon Miller form QCC for his technical, administrative support during execution of the project.

Conflicts of Interest

The authors declare that they have no known competing financial interests or personal relationships that could have appeared to influence the work reported in this paper. Also, the funders had no role in the design of the study; in the collection, analyses, or interpretation of data; in the writing of the manuscript, or in the decision to publish the results.

References

  1. Akbari, H.; Cartalis, C.; Kolokotsa, D.; Muscio, A.; Pisello, A.L.; Rossi, F.; Santamouris, M.; Synnef, A.; Wong, N.H.; Zinzi, M. Local climate change and urban heat island mitigation techniques—The state of the art. J. Civ. Eng. Manag. 2015, 22, 1–16. [Google Scholar] [CrossRef] [Green Version]
  2. Oke, T.R. Boundary Layer Climates, 2nd ed.; Taylor & Francis e-Library: Abingdon, UK, 2002. [Google Scholar]
  3. Lazzarini, M.; Prashanth, R.M.; Ghedira, H. Temperature-land cover interactions: The inversion of urban heat island phenomenon in desert city areas. Remote Sens. Environ. 2013, 130, 136–152. [Google Scholar] [CrossRef]
  4. Bhargava, A.; Lakmini, S.; Bhargava, S. Urban Heat Island Effect: It’s Relevance in Urban Planning. J. Biodivers. Endanger. Species 2017, 5, 187. [Google Scholar] [CrossRef]
  5. Jacobson, M.Z.; Ten Hoeve, J.E. Effects of Urban Surfaces and White Roofs on Global and Regional Climate. J. Clim. 2012, 25, 1028–1044. [Google Scholar] [CrossRef]
  6. Urban, B.; Roth, K. Guidelines for Selecting Cool Roofs. 2010. Available online: https://www.energy.gov/sites/prod/files/2013/10/f3/coolroofguide.pdf (accessed on 10 March 2022).
  7. Rossi, F.; Cardinali, M.; Gambelli, A.M.; Filipponi, M.; Castellani, B.; Nicolini, A. Outdoor thermal comfort improvements due to innovative solar awning solutions: An experimental campaign. Energy Build. 2020, 225, 110341. [Google Scholar] [CrossRef]
  8. Höppe, P. The physiological equivalent temperature—A universal index for the biometeorological assessment of the thermal environment. Int. J. Biometeorol. 1999, 43, 71–75. [Google Scholar] [CrossRef] [PubMed]
  9. Potchter, O.; Cohen, P.; Lin, T.; Matzarakis, A. Outdoor human thermal perception in various climates: A comprehensive review of approaches, methods and quantification. Sci. Total Environ. 2018, 631–632, 390–406. [Google Scholar] [CrossRef] [PubMed]
  10. Santamouris, M. Cooling the buildings—Past, present and future. Energy Build. 2016, 128, 617–638. [Google Scholar] [CrossRef]
  11. Simon, M. High SRI Materials: QCC Research Framework Report; Abu Dhabi Quality and Conformity Council (ADQCC): Abu Dhabi, United Arab Emirates, 2013. [Google Scholar]
  12. Medgar, L.M.; Martha, G.V. Solar Reflectance of Concretes for LEED Sustainable Sites Credit: Heat Island Effect; Portland Cement Association: Portland, OR, USA, 2007; Available online: https://trid.trb.org/view/836925 (accessed on 10 March 2022).
  13. Muscio, A. The Solar Reflectance Index as a Tool to Forecast the Heat Released to the Urban Environment: Potentiality and Assessment Issues. Climate 2018, 6, 12. [Google Scholar] [CrossRef] [Green Version]
  14. Dornelles, K.; Caram, R.; Sichieri, E. Natural Weathering of Cool Coatings and its Effect on Solar Reflectance of Roof Surfaces. Energy Procedia 2015, 78, 1587–1592. [Google Scholar] [CrossRef] [Green Version]
  15. Berdahl, P.; Akbari, H.; Levinson, R.; Miller, W.A. Weathering of roofing materials—An overview. Constr. Build. Mater. 2006, 22, 423–433. [Google Scholar] [CrossRef] [Green Version]
  16. Xue, X.; Yang, J.; Zhang, W.; Jiang, L.; Qu, J.; Xu, L.; Zhang, Z. The study of an energy efficient cool white roof coating based on styrene acrylate copolymer and cement for waterproofing purpose—Part I: Optical properties, estimated cooling effect and relevant properties after dirt and accelerated exposures. Constr. Build. Mater. 2015, 98, 176–184. [Google Scholar] [CrossRef]
  17. Cheng, M.D.; Miller, W.; New, J.; Berdahl, P. Understanding the long-term effects of environmental exposure on roof reflectance in California. Constr. Build. Mater. 2016, 26, 516–526. [Google Scholar] [CrossRef]
  18. Ichinose, M.; Inoue, T.; Sakamoto, Y. Long-term performance of high-reflectivity exterior panels. Build. Environ. 2009, 44, 1601–1608. [Google Scholar] [CrossRef]
  19. Shirakawa, M.A.; de Lima, L.N.; Gaylarde, C.C.; Silva Junior, J.A.; Loz, P.H.F.; John, V.M. Effects of natural aging on the properties of a cool surface exposed in different Brazilian environments. Energy Build. 2020, 221, 110031. [Google Scholar] [CrossRef]
  20. Synnefa, A.; Santamouris, M.; Livada, I. A study of the thermal performance of reflective coatings for the urban environment. Solar Energy 2006, 80, 968–981. [Google Scholar] [CrossRef]
  21. Bretz, S.E.; Akbar, H. Durability of High-Albedo Roof Coatings. California Institute for Energy Efficiency, University of California. 1994. Available online: https://www.aceee.org/files/proceedings/1994/data/papers/SS94_Panel9_Paper08.pdf (accessed on 20 May 2021).
  22. Mastrapostoli, E.; Santamouris, M.; Kolokotsa, D.; Vassilis, P.; Venieri, D.; Gompakis, K. On the ageing of cool roofs: Measure of the optical degradation, chemical and biological analysis and assessment of the energy impact. Energy Build. 2016, 114, 191–199. [Google Scholar] [CrossRef]
  23. Revel, G.M.; Martarelli, M.; Bengochea, M.Á.; Gozalbo, A.; Orts, M.J.; Gaki, A.; Emiliani, M. Nanobased coatings with improved NIR reflecting properties for building envelope materials: Development and natural aging effect measurement. Cem. Concr. Compos. 2013, 36, 128–135. [Google Scholar] [CrossRef]
  24. Preston, H. A Case Study on the Impact of Solar Reflectance Attenuation and Roof Cleaning on a Cool Roof Return on Investment. Master’s Thesis, Arizona State University, Tempe, AZ, USA, December 2016. [Google Scholar]
  25. Levinson, R.; Akbari, H.; Konopacki, S.; Bretz, S. Inclusion of cool roofs in nonresidential Title 24 prescriptive requirements. Energy Policy 2005, 33, 151–170. [Google Scholar] [CrossRef] [Green Version]
  26. Haverstic, T.; Sullivan, K.; Smithwick, J. Impact of solar reflectance attenuation and roof cleaning on a cool roof: Assessing return on investment for facility management. J. Facil. Manag. Educ. Res. 2017, 1, 72–85. [Google Scholar] [CrossRef] [Green Version]
  27. ANSI/CRRC S100; Standard Test Methods for Determining Radiative Properties of Materials. Cool Roof Rating Council: Portland, OR, USA, March 2021. Available online: https://coolroofs.org/product-rating/ansi-crrc-s100 (accessed on 20 April 2021).
  28. RAK Research and Innovation Center: Natural Weathering Farm. Available online: https://goo.gl/maps/95xUCLjKeCRoZ8wF6 (accessed on 20 May 2022).
  29. G7/G7M-13; Standard Practice for Atmospheric Environmental Exposure Testing of Nonmetallic Materials. American Society for Testing and Materials: West Conshohocken, PA, USA, 2013.
  30. Jorgensen, G. Outdoor exposure testing. In Performance and Durability Assessment: Optical Materials for Solar Thermal Systems, 1st ed.; Kohl, M., Carlsson, B., Jorgensen, G.J., Czanderna, A.W., Eds.; Elsevier Science: Amsterdam, The Netherlands, 2004; pp. 235–253. [Google Scholar]
  31. ATLAS Benchmark Exposure Sites. ATLAS Material Testing Solutions, Mount Prospect, Illinois, USA. Available online: http://www.klimatest.eu/katalog/leaflets/atlas/Starzenie_naturalne-materialow.pdf (accessed on 20 May 2021).
  32. Environmental Protection Agency (EPA). Air Quality Statistics 2019, Abu Dhabi, UAE. Available online: https://www.epa.gov/air-trends/air-quality-cities-and-counties (accessed on 20 May 2021).
  33. Federal Competitiveness and Statistics Authority, Abu Dhabi, UAE. Available online: https://fcsa.gov.ae/en-us/Pages/Statistics/ (accessed on 20 May 2021).
  34. Meteo France, Air Quality Data, Paris, France. Available online: https://www.meteoblue.com/en/weather/outdoorsports/airquality/sanary-sur-mer_france_2976258 (accessed on 20 May 2021).
  35. C1549-15; Standard Test Method for Determination of Solar Reflectance near Ambient Temperature Using a Portable Solar Reflectometer. American Society for Testing and Materials: West Conshohocken, PA, USA, 2015.
  36. C1371-10; Test Method for Determination of Emittance of Materials Near Room Temperature Using Portable Emissometers. American Society for Testing and Materials: West Conshohocken, PA, USA, 2010.
  37. E1980-11; Standard Practice for Calculating Solar Reflectance Index of Horizontal and low-Sloped Opaque Surfaces. American Society for Testing and Materials: West Conshohocken, PA, USA, 2011.
  38. Paolini, R.; Zinzi, M.; Poli, T.; Carnielo, E.; Mainini, A.G. Effect of ageing on solar spectral reflectance of roofing membranes: Natural exposure in Roma and Milano and the impact on the energy needs of commercial buildings. Energy Build. 2014, 84, 333–343. [Google Scholar] [CrossRef]
  39. Usamentiaga, R.; Venegas, P.; Guerediaga, J.; Vega, L.; Molleda, J.; Bulnes, F.G. Infrared Thermography for Temperature Measurement and Non-Destructive Testing. Sensors 2014, 14, 12305–12348. [Google Scholar] [CrossRef] [PubMed] [Green Version]
  40. QCC-PCS-ASP030.01, Abu Dhabi Certification Scheme for High Solar Reflective Index Materials. Available online: http://jawdah.qcc.abudhabi.ae/en/Certifications/Product/Pages/ProductCertificationDetails.aspx (accessed on 10 March 2021).
  41. Peter, W. The evolution of a rating system. Available online: http://rci-online.org/wp-content/uploads/2007-02-turnbull.pdf (accessed on 10 March 2022).
  42. Levinson, R.; Berdahl, P.; Asefawberhe, A.; Akbari, H. Effects of soiling and cleaning on the reflectance and solar heat gain of a light-colored roofing membrane. Atmos. Environ. 2005, 39, 7807–7824. [Google Scholar] [CrossRef]
  43. Singh, R.P.; Tomer, N.S.; Bhadraiah, S.V. Photo-oxidation studies on polyurethane coating: Effect of additives on yellowing of polyurethane. Polym. Degrad. Stab. 2001, 73, 443–446. [Google Scholar] [CrossRef]
Figure 1. Natural weathering/aging site: Ras Al Khaimah, the UAE [29].
Buildings 12 01002 g001
Figure 2. Flowchart representing the experimental methodology and parameter evaluation.
Buildings 12 01002 g002
Figure 3. Panels showing three areas (1–3), where reflectance and emittance were analyzed and two dashed areas (4, 5), where color analyses were carried out.
Buildings 12 01002 g003
Figure 4. Global solar radiation at site and UV radiation data at Ras Al Khaimah, UAE.
Buildings 12 01002 g004
Figure 5. Particulate matter (PM10) concentration and precipitation data at Ras Al Khaimah, UAE.
Buildings 12 01002 g005
Figure 6. High SRI coating samples mounted on racks after 6 months of exposure. (a) Roof application—5° tilt; (b) Facade application—45° tilt.
Buildings 12 01002 g006
Figure 7. Triplicate samples of various manufacturers after 3 years of natural aging at Ras al Khaimah: (a) 5° tilt and (b) 45° tilt.
Buildings 12 01002 g007
Figure 8. Reflectance and emittance as a function of exposure period at (a) 5° tilt and (b) 45° tilt.
Buildings 12 01002 g008
Figure 10. Effect of cleaning on solar reflective index: (a) 5° tilt and (b) 45° tilt.
Buildings 12 01002 g010
Figure 11. Percentage retention of SRI values as function of exposure period.
Buildings 12 01002 g011
Figure 12. Unwashed and washed visible (a) and infrared (b) images of the three selected samples.
Buildings 12 01002 g012
Figure 13. Solar reflectance plotted against (a) color difference (ΔE) and (b) coordinate L.
Buildings 12 01002 g013
Table 1. Requirements and guidelines for SRI coatings/materials in UAE [11].
RegulationSRI Value
Roofs
Estidama Pearl Building/Villa rating system
“RE-2: Cool Building strategies”
SRI ≥ 78 (Initial)
Abu Dhabi International Energy Conservation Code (AD IECC)SRI ≥ 64 (3-year aged)
Or Solar Reflectance ≥ 0.55
Thermal Emittance ≥ 0.75
Equivalent to SRI of 60 (3-year aged)
Dubai Green Building Regulations
304.01 Urban Heat Island effect “High SRI Roof”
Steep sloped (>1.6): SRI ≥ 29 (Initial)
Flat or low-sloped (<1.6): SRI ≥ 78 (Initial)
Externally Painted Walls
Dubai Green Building Regulations 304.03 Light Colors on the Outside of Buildings “High LRV Coatings & Paints”Light Reflectance Value ≥ 45%
For 75% of area.
Shading Structures
Estidama Pearl Building Rating System (PBRS) “LBo-R3: Outdoor Thermal Comfort Strategy”
Estidama Pearl Community Rating System (PCRS) “LC-R4: Outdoor Thermal Comfort Strategy”
SRI ≥ 29
Required for all Buildings and Communities.
Dubai Green Building Regulations 304.06 Shading of Public Access Areas “Shading Material with High SRI” Steep-sloped (>1:6): SRI ≥ 29
Flat or low-sloped (<1:6): SRI ≥ 78
Hardscape
Estidama Pearl Community Rating System (PCRS) RE-2: Urban Heat Reduction SRI ≥ 29 Community hardscape (excluding roads)
Dubai Green Building Regulations 304.05 Hardscape “Paving Material with High SRI” SRI ≥ 29
Or, shaded as per roof SRI requirements.
(50% of area)
Table 2. Weather parameters of RAK test site compared with benchmark locations.
Weather ParametersArizona [31] (Phoenix)Florida [31] (Miami)Sanary [31],
France
Ras-Al-Khaimah
Elevation1055 ft10 ft2001 ft5 Feet
Average total Solar Irradiance/year8004 MJ/m26588 MJ/m25500 MJ/m28375 MJ/m2
Average total UV radiation/year334 MJ/m2280 MJ/m2382 MJ/m2331 MJ/m2
Avg. Maximum Summer Temperature39 °C34 °C23 °C43 °C
Avg. Maximum Winter Temperature26 °C20 °C9 °C26 °C
Average Humidity49%80%76%58%
Average Annual Rainfall186 mm1420 mm700 mm113 mm
Coarse Particulate Matter PM10 [32,33,34]183 μg/m354 μg/m330 μg/m3157 μg/m3
Table 3. Retention of initial SRI values through annual maintenance (fall and spring).
Exposure Tilt ManufacturerInitial SRIWashed during FallWashed during Spring
Year-1Year-2Year-3Year-1Year-2Year-3
Low slope (5°)M1104.8387%89%90%89%88%90%
M2107.7472%73%81%74%72%85%
M395.7272%75%73%74%68%80%
High slope (45°)M1105.6394%95%94%96%94%95%
M2110.2884%87%88%85%81%83%
M3101.6688%88%86%89%88%90%
Publisher’s Note: MDPI stays neutral with regard to jurisdictional claims in published maps and institutional affiliations.

