Abstract
Townships in Southwest China are usually located in mountainous regions, which are abundant in natural and cultural landscape resources. There are additional requirements for the township’s sustainable development in these areas. However, insufficient infrastructures, due to limited resources, constrain the sustainable development of these townships. Sustainable contribution of infrastructure (SCOI) in this study is defined as the performance of infrastructure as a contribution to the coordinated development among economic, social, and environmental dimensions of township’s sustainable development. It is necessary to assess these infrastructures according to SCOI and provide choices for investment to maximize resource utilization. Therefore, an assessing model of SCOI with 26 general indicators was developed, which covers five most urgently needed infrastructures of these townships in Southwest China, including road transport, sewage treatment, waste disposal, water supply, and gas. In this model, quantitative and qualitative methods are combined to acquire different SCOI of each infrastructure. The result of the SCOI would be an important reference for infrastructure investment. A case study of Jiansheng Town, that is located in the Dadukou district of Chongqing, demonstrates the applicability of the model. It shows the assessing model of SCOI is efficient to identify the most valuable infrastructure that is appropriate for investment with the goal of township’s sustainable development. This study can provide insights for infrastructure investment and management in townships or areas.
1. Introduction
Townships in this study are the small towns that are recognized by the government through official documents such as China Statistical Yearbook. As shown in the Figure 1, in China, township government is the lowest administrative organization and has jurisdiction over several villages. Townships, consisting of villages, are the bonds linking the urban and rural areas. From this, townships play a vital role in the rural development in China. Southwest China is a typical mountainous concentration area, accounting for over 90% of the local land area. Townships in Southwest China are usually located in mountainous regions, which are abundant in natural and cultural landscape resources, and are also underdeveloped areas. All of this has led to the additional requirements for the townships’ sustainable development in Southwest China. She et al. [1] proved sustainable townships are significant for China’s sustainable development task, even for some relatively less-developed townships that are located in Southwest China.

Figure 1.
The administrative structure about township in China.
The improvement of infrastructure conditions plays an important role in the township’s development [2,3]. Shen et al. [4] suggested that an infrastructure project is a kind of public good and contributes to both economy and society. The United Nation’s 2030 Sustainable Development Agenda [5] also proposes to develop resilient infrastructure to help improve “human well-being” and economic development. Therefore, infrastructure has major effects on these township’s sustainable development. However, townships in Southwest China are usually located in remote and rural areas, which are usually underdeveloped. Similarly, the infrastructure in such regions is delivered with limited policy support [2] and limited financial capacity [6]. As a result, it is well recognized that the infrastructure is poor in Chinese townships, especially in Southwest China [1]. Even so, not all needed infrastructure can be developed in recent years due to limited resources. As Zhang et al. [2] argued, the insufficient financial resources could be one of the biggest limitations for infrastructure development in townships. Therefore, it is necessary to assess these infrastructures according to a criterion and make choice from them to maximize resources utilization.
According to the principle of sustainable development, infrastructure projects have significant impacts on economy, society, and environment [4], which is called “sustainable contribution” in this paper. In other words, the sustainable contribution of infrastructure (SCOI) is used to represent the performance of the infrastructure as a contribution to the coordination between economic, social, and environmental development. Clearly, the degree and angle of contribution are different according to different infrastructure. It means that if we can find the most important infrastructure according to their contribution, we can provide appropriate investment decisions with limited financial capacity which help contribute to a township’s sustainable development.
There are quite a few researchers that have introduced methods for assessing infrastructure sustainability. Siew [7] proposed the development of sustainability reporting tools (SRTs) that are applied to infrastructure sustainability considering the environment, society, economics, and institutions. Shen et al. [4,8] also developed models with key assessment indicators for assessing infrastructure project sustainability. Other models to assess the infrastructure sustainability can be found from different aspects [9,10]. However, these models are focused more on the sustainability of infrastructure itself while there are few on the infrastructure’s impact on township’s sustainable development. To quantify the effect of sustainable infrastructure on urban-rural balance, Zhang et al. [2] introduced the model that was based on the two attributes of efficiency and equity. Some researchers have also carried out studies on the relationship between infrastructure and regional economy or urbanization [2,11] while few studies involve the relationship between infrastructure and township development, with much less involving examining the sustainable contribution of different infrastructure to townships within the context of China.
Therefore, this paper aims to set up an indicator system and develop a model for assessing the SCOI of different infrastructure under the special circumstances of townships in Southwest China. For this purpose, studies were carried out as the following steps: (1) selecting indicators for assessing the township’s sustainable development in Southwest China by a literature review and local background analysis; (2) drawing out an indicator system for assessing the SCOI of major infrastructure after identification of the most urgent infrastructures by authoritative literature comparison and on-site investigation; (3) developing a model, combing the quantitative methods and qualitative methods, for assessing the SCOI; and (4) carrying out a case study to demonstrate the application of this model. On the whole, it shows that the result of this model matches the practical condition.
As far as the contribution of this study, it can be concluded as follows. First of all, there are many studies that are involved in the sustainability of infrastructure itself [4,8] and some others involving in township’s sustainable development [8,12], while there are few studies that refer to the infrastructure’s impact on township’s sustainable development. The study and measurement of sustainable contribution of infrastructure (SCOI) may provide a new way for the practice and research on sustainable development. Second, this paper set up an indicator system that is applicable to the special circumstances of townships in Southwest China, with unique characteristics such as small scale, closer links with the rural area, relatively underdeveloped, inadequate infrastructure investment, and a lack of awareness of sustainability. There is a lot of research that provides abundant key performance indicators for promoting sustainable development. However, some focus on cities [13,14], infrastructure sustainability [4,9], energy saving actions and energy efficiency [15,16], and sustainable contribution of green building [17], and they are not exactly applicable to townships in Southwest China. Moreover, with the case study that was carried out, the applicability of the model was demonstrated, and the priority of infrastructure investment was discussed according to the SCOI results. These provide a valuable reference for future township’s infrastructure investment and sustainable development.
2. Literature Review
2.1. Understanding of Township’s Sustainable Development
There are many researchers introducing the understanding of sustainable development from different aspects. Mohamed [18] regarded that sustainability means something in harmony with human and nature considering environment, society, and economy. This is the most general understanding of sustainability which can also be concluded in other research. Zambon [19] directly pointed out that sustainability is often explained through such three dimensions. Shi [20] assessed regional sustainable development that was based on social, economic, and environmental factors as well as resources. Golbazi [21] emphasized the benefits that are provided by green buildings to environmental, societal, and economic gains. Matheus [8] et al., evaluated the sustainable development of small municipalities from social wellness, public management, education, new economies, and regional planning.
Some research was also involved in the concept of township’s sustainable development. The report referred to townships in Scotland [12] and emphasized public services, education opportunities environment, local innovation, and property for the township’s sustainable development. Valtenbergs [22] studied sustainable development of townships and rural areas from economic, environmental, and social dimensions. Besides, Emanuela [23] also proposed a township’s sustainability evaluation structure on social, economic, environmental, and historic-architectural components. In general, scholars tend to study township’s sustainable development from three dimensions: economy, society, and environment.
2.2. Research on Indicators for Accessing Sustainability
2.2.1. Assessing Indicators of Infrastructure Sustainability
As analyzed above, there have been quite a few studies that have been conducted the assessing indicators of infrastructure sustainability. Shen [4] and Yao [9] take market supply and demand analysis and project budget as core indicators for assessing infrastructure sustainability based on above three dimensions: economy, society, and environment. Job opportunities and impacts on residents’ life standard are used to evaluate the impact of infrastructure on the social dimension [10]. Waste disposal [8], air quality [24], and energy consumption [25] are important evaluation indicators for infrastructure sustainability which are conducive to the sustainable development of local environment. Besides, some indicators, such as government management and long-term health, can directly or indirectly assess infrastructure sustainability [11]. Nevertheless, the focus of these studies is assessing the performance of project, which can be identified as these indicators shows: internal return ratio (IRR), environment protection measures in project design [4], project financing channels [9], and life cycle cost [10]. The indicators which can examine the relationship between different infrastructure and every dimension of sustainability still need to be developed.
2.2.2. Assessing Indicators of Regional Sustainability
The studies referring to assessment for township’s sustainable development will be the base to assess the SCOI. Current studies on assessment of regional sustainability have achieved some results.
As the Global indicator framework, the SDGs aim to build resilient infrastructure and promote sustainable industrialization (Goal 9) [5]. To assess city sustainability in the international standard [14], there are 19 categories of indicators that are recommended, including economy, energy, environment and climate change, solid waste, telecommunication, transportation, wastewater, water, urban planning, education, health, etc. European Common Indicators for Urban Environment [26] defined sustainable lifestyle in urban areas from transportation, availability of public open areas, journey to and from school, and local products. CITYkeys indicators were used for assessing smart city and smart project based on five aspects: people, planet, prosperity, governance, and propagation [13].
As far as smaller regions, Visvaldis et al. [22] regarded traffic jam, pollution, and crime as key for township’s that are sustainable to live when they tried to find the indicators for township’s sustainable development. Taecharungroj [27] assessed the sustainable development of townships through 33 survey items in term of some factors including economic growth, social equity, environment and land scape, transport, energy, etc. Xu [28], through surveying eight townships in the north of Zhejiang Province, proposed an improved indicator system to assess the progress of the SDGs in the county level. Though making energy and environment are the master plan for stakeholders’ preferences, Giaccone et al. [29] used some economic and environment indicators, such as the cost of saved energy and avoided pollutant emissions, to evaluate regional sustainability.
2.3. Research on Infrastructure’s Effect on Sustainable Development
Infrastructure can directly or indirectly influence the regional sustainable development, which, approximately includes 72% of the targets in SDGs according to statistics [30].
2.3.1. Infrastructure’s Effect on Economic Development
Although the relationship between infrastructure and economic development is complex and variable, it is recognized that infrastructure investment is an effective means to promote regional economic growth. Keynes [31] demonstrated, from the economic theory level, that infrastructure investment itself as a direct input of production factors will lead to a direct increase in total output and will also achieve capital accumulation through multiplier effects. Zhang [2] and Shen [3] argued that infrastructure investment can improve residents’ living standards which expressed the Engle coefficient. The European Union intends to develop a more competitive low-carbon economy by developing renewable energy infrastructure for sustainable and inclusive growth [15]. Some studies also showed the important contributions of infrastructure to economic development in many different ways, such as personal income [2,3], regional GDP [4,8], and economic benefit [30]. Some other studies showed the impact on economy from different infrastructure. Robert [32] thought that transportation helps a lot in low-income rural areas by reducing transport costs to deliver and access these services and opportunities. As defined by the OECD (2013), transport infrastructure is a key component of economic development at all income levels [33]. Some researchers have proposed that waste disposal [34] and sewage treatment technology [3] are important ways to promote regional GDP. In general, the sustainable contribution of infrastructure, such as water supply [1], waste disposal [34], and road [1,33], to economic dimension in townships is mainly reflected in the reduction of production and living costs [4], the optimization of the township’s industrial structure [1,35], and the improvement of the investment environment [30].
2.3.2. Infrastructure’s Effect on Social Development
Infrastructure investment has a driving role in the social development of townships. Keynes [36] has advocated for solving social unemployment problems through public investment such as infrastructure. Related studies have demonstrated that there is a positive curve relationship between infrastructure investment and the urbanization of townships, especially in Western China [34]. Thacker [30] regarded that infrastructure investment is the backbone of society by providing essential services. Some studies have also shown the important contributions of infrastructure to social development from different aspects such as education and medical care [2], social insurance coverage [8,35], employment rate [22], and population structure [37]. Transportation has an important effect on sustainable social development [2,22]. Waste management [8] and water supply [38] are important ways to promote the urbanization rate. To sum up, the SCOI to township’s social development is mainly reflected in the increase of employment opportunities [22,36], improvement of social culture [6], and improvement of residents’ quality of life [2,3].
2.3.3. Infrastructure’s Effect on Environmental Protection
As public goods, infrastructure has obvious externalities. Siew [7] and Visvaldis [22] proposed that infrastructure investment can reduce industrial exhaust emissions and increase green space ratio. Infrastructure is also an important way for low carbon transition and energy saving [16,39], which can improve the environmental quality to promote people’s quality of life. There have been some studies that showed the contribution of environmental infrastructure such as sewage treatment and garbage disposal in helping to improve water and air quality [40,41], which benefits the environmental quality of townships. As such, infrastructure can contribute to the environmental protection. The SCOI to environment is mainly reflected in improving residents’ living environment [22,35] and providing a well-development environment for industrial development [5,8].
The main work and contributions of the literature are summarized in Table 1.

Table 1.
List of the main work and contributions in the literature.
3. Selection of Indicators for Assessing Sustainable Contribution of Infrastructure
There is no direct reference to selection indicators for sustainable contribution of infrastructure (SCOI). As such, the indicators of assessing township’s sustainable development will be the base to assess the SCOI.
3.1. Indicators for Assessing the Township’s Sustainable Development
There have been many indicator systems for measuring sustainable development around the world as discussed in Section 2.2 which would be the important references to select appropriate indicators for assessing the township’s sustainable development. Furthermore, the practical condition of townships in Southwest China is different from other areas. A township’s sustainable development should be consistent with the strategy of national sustainable development that is described as: development should be emphasized while taking into account the utilization and protection of resources and environment. Therefore, the indicators for assessing the township’s sustainable development, in this paper, mainly refers to the classification method of indicators that are issued by some researchers [19,22], which includes three dimensions: economy, society, and environment. At the same time, the “Evaluation Index System for Green and Low-Carbon Key Townships (Trial)” [42], issued by multiple national departments, and China Statistical Yearbook are also important references. Above all, an index system for assessing the township’s sustainable development is drawn as Table 2.
Table 2.
Assessment indicators for township’s sustainable development.
3.2. Identification of Township’s Major Infrastructures in Southwest China
As the analysis above suggests, the degree and angle of contribution are different according to different infrastructure. However, there are many types of infrastructure even in townships and it is unpractical to discuss all. Therefore, it is more feasible to find out a few of the most important infrastructures in townships in Southwest China.
3.2.1. Literature Analysis
Since the scope of this paper is in the southwestern region, this article begins with the relevant authoritative literature on infrastructure construction or investment in townships that are published by the state, including the National New Urbanization Plan (2014–2020) [38], and the southwestern provinces/cities.
Through statistics and comparisons, nine infrastructures were extracted as shown in Table 3. As such, the top nine infrastructures are reserved for further research.
Table 3.
Main types of infrastructure according to official documents.
3.2.2. On-Site Investigation
To understand the practical situations of mountainous townships in Southwest China and further identifies the most important infrastructure, this study conducted on-site investigations of 24 townships that were located in the southwestern part of China, including traditional Yunnan, Guizhou, Sichuan, Chongqing, and Hubei Province which is adjacent to Chongqing. The list of the 24 townships is shown in Table 4.
Table 4.
The townships for on-site investigation.
The interviewees were mainly the main responsible persons of the above 24 townships. All the respondents have full experience in the construction and management of townships. The respondents were invited to provide the nine most urgently needed infrastructures in their townships according to the needs of the recent development plan. The infrastructures were also screened by frequency statistics.
According to the statistics, the top six infrastructure types are also listed in Table 3 as follows in order: road transport, sewage treatment, waste disposal, water supply, gas, and power. Telecommunications, distributed energy resource, and logistics aren’t yet in the list of the on-site investigation. However, power supply is important only for 11 townships in recent years, not more than half of 24 townships. Lastly, there were five most important infrastructures that were extracted for further analysis and discussion in this study includes road transport, sewage treatment, waste disposal, water supply, and gas.
3.3. Indicators for Assessing the SCOI of Major Infrastructure
Different infrastructure has different contributions to a township’s sustainable development. Therefore, the indicators in Table 2 are not all applicative for these five infrastructures including road transportation, sewage treatment, waste disposal, water supply, and gas. Based on previous studies, especially literature reviews about infrastructure’s effect on sustainable development, as shown in Section 2.2, the further indicators for assessing the sustainable contribution of the five major infrastructures can be screened accordingly as shown in Table 5. There are 26 general indicators that can be used for assessing the sustainable contribution of the five major infrastructures in townships one by one. In terms of the extent and manner of the impact, different infrastructure has different contributions even within the same township. The different decisions of infrastructure investments would lead to different results of sustainable development. On the other hand, the indicators, when applied to a specific township, can be selected from this general indicator system according to the local practical conditions and availability of indicators. In other words, every indicator system for each township may be different to some extent.
Table 5.
Assessing indicators for sustainable contribution of infrastructure in townships.
4. Methodologies
With the indicator system drawn out, it is important to select appropriate methods for measuring the sustainable performance of the infrastructure as contribution to these indicators. Although there are various methods that are adopted to measure similar indicators, such as “Full Permutation Polygon Synthetic Indicator” method [11], Simulation Model by using system dynamics [9], and the AHP method [29], most are used to measure the performance of the indicators themselves while not examining the degree of the impact between each infrastructure and each indicator. At the same time, objective methods show seem powerless in examining the degree of the impact due to limited objective data. As a result, integrating the advantages of the above methods, a new model combining quantitative and qualitative methods was proposed in this study to measure the SCOI of each infrastructure.
4.1. Model for Assessing the SCOI
Based on the indicator system in Table 5, a model for assessing the sustainable contribution of infrastructure needs to be set up to assist in decision-making on the infrastructure development direction. The model can be expressed as Equation (1).
where is the quantitative value of sustainable contribution (SCOI) from the five major infrastructures which were determined in previous analysis; i = 1,2,3,4, and 5. represents the SCOI of road transport, represents the SCOI of sewage treatment, represents the SCOI of waste disposal, represents the SCOI of water supply, and represents the SCOI of gas. ij is the contribution value in this study, representing the assessed value of sustainable contribution to the jth indicator in terms of the ith infrastructure. is the weight of the jth indicator. There are 26 recommended indicators for assessing the sustainable contribution of all five infrastructures, as shown in Table 5. So, n = 26 which means j = 1,2,3…26. At last, the correspondence of all above variables can be seen as Table 6.
Table 6.
Assessment system for sustainable contribution of infrastructure investment in townships.
4.2. Measurement of Contribution Value
The assessing model as expressed in Equation (1), represents the contribution value of each infrastructure affecting each indicator. However, the practical condition and developing stages of every township are different, which lead to different evaluation criterion for each township. In other words, the results of the contribution value () would not be universal for different infrastructures or different townships. Therefore, the contribution value will only be measured within a specific township and the results are only applied to this township.
Furthermore, it is impossible to measure the contribution value by objective methods because there are no enough objective data. On account of this, an expert interview method was used to measure the contribution value () in this paper. Through on-site surveys of a specific township, an expert group, including 5–10 experts that were selected from leaders of the township and construction departments or other related departments administering this township in county government, were accessible to apply their suggestions.
The five-point Likert method was adopted to present the experts’ views about the impact degree, which is usually adopted to examine some subjective data about indicator performance [4,13]. The Likert method is an effective method for rating the relative significance of factors [65]. In this study, this method was used to collate quantitative data, which is essential for the following analysis. To rate the impact degree, 5 was used to represent very strong, and, on the contrary, 1 was used to represent negligible. Each contribution value was an average score of all experts’ view.
4.3. Calculation of Weights
In Equation (1), is used to represent the weights of these 26 indicators. Usually, the methods for calculating the indicators’ weights can be classified into two categories: subjective methods and objective methods. In view of the subjective method that was used in the model to acquire the contribution value () in a previous study, the objective methods are appropriate for the following study to correct subjective bias. Objective methods are more accepted because of higher reliability, in which an entropy weight method is a simple and feasible scientific method [66]. The weights in the entropy weight method can not only objectively represent the significant degree of each indicator in the whole indicator system, but also reflect the change of weights with time. Since the middle of the last century, this method has been employed in various specific fields, including information, administration, economy, and environment. Currently, this method has been widely applied to the research about sustainable development [64].
Therefore, it is very suitable for the study of economy, society, and comprehensive evaluation at the county level [35]. In this study, the entropy weight method was adopted to calculate the weights by collecting the panel data of the specific township for several consecutive years according to Table 6. The steps to determine the weights are as follows [66,67].
4.3.1. Standardization of Indicator
The collected data of all indicators for weights calculation could not be directly used due to their various magnitudes and dimensions. To ensure equal status of all indicators and compare these different types of data, all data of indictors should be standardized at first according to their individual nature. In addition, there are normally two categories of indicators as follows: positive indicators and negative indicators. The method should be different according to different categories of indicators as shown in Equations (2) and (3) respectively.
The positive indicators can be standardized as:
The negative indicators can be standardized as:
where is the standardized value of . is the data of the kth indicator from the tth sample; k = (1, 2,…, 26). In this study, t represents the statistical year; t = (1, 2,…, m).
4.3.2. Determination of the Weights
In line with principle of the entropy theory, information entropy () is used to represent the average information value of an indicator system, which is defined by Equation (4):
where ; ; 0 ≤ ≤ 1.
The information value of an indicator, expressed by , represents the difference of 1 and :
The weight is determined by the utility value according to entropy weight method. The larger the utility value, the more important this indicator is. The weight the of kth indicator can be calculated as Equation (6):
where is the weights of the jth indicators in Table 5 for assessing SCOI.
5. Case Study
5.1. Background of the Case
A specific township, called Jiansheng town, was selected to demonstrate the applicability of the model in Equation (1), which is located in the Dadukou district of Chongqing. Chongqing, located in Southwest China, is one of the four central municipalities, the connection point of One Belt and One Road and the economic belt of the Yangtze River, and the support of the western development strategy. There are eight administrative villages and four communities in Jiansheng town and the area is 23.65 km2. The satellite map of Jiansheng town can be seen in Figure 2. With a development history of more than 60 years, the township has a relatively sound management structure, which is conducive to the collection and statistics of relevant data. According to the survey, the infrastructure construction is relatively perfect, but there is still room for investment and development in rural areas in Jiansheng town. In the near futures, the five types of infrastructures, road transport, sewage treatment, waste disposal, water supply, and gas, are also the important infrastructure to develop for this township.
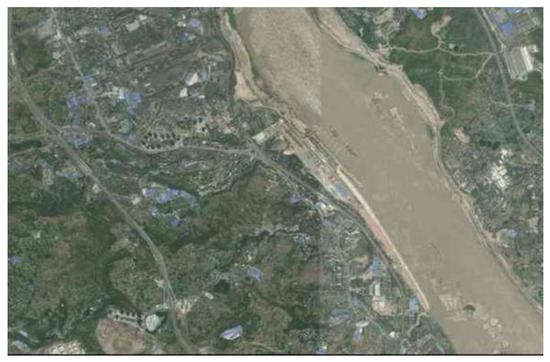
Figure 2.
Satellite map of Jiansheng town reprinted from ref. [68].
5.2. Materials
The application of the model in this paper involved some subjective evaluation. Therefore, there were nine experts that were invited to form an expert group, including the party secretary, mayor, and vice mayors of Jiansheng town, the heads of the urban construction office and the economic office, as well as the heads of the relevant departments from the construction committee and the transportation committee of Dadukou district. These experts have rich practical experience in the construction and management of townships. They are familiar with Jiansheng town and have an overall understanding of the township.
In fact, the statistical scope and content of relevant data on townships in China varies from province to province and even from district (or county) to district (or county). Moreover, some statistics for the township are not exhaustive. In view of this, the indicator system for the specific township was amended. Therefore, the nine experts were invited firstly to help determine the specific indicator system according to the general indicator system in Table 5, considering the actual development of Jiansheng town, condition of infrastructure construction, and especially the availability of the indicators. The specific assessment system for the sustainable contribution of infrastructure investment in Jiansheng town is shown in Table 7. There were 14 indicators left due to some indicators that were not available in this township.
Table 7.
Assessment system for sustainable contribution of infrastructure investment in Jiansheng town.
After determining the assessment system, the raw data for these indictors in this system can be collected which can be used to calculate the weights by the entropy weight method. According to the survey and statistics by researchers in Jiansheng town, the historic data on economy, society, and environment from 2015 to 2019 were collected as shown in Table 8.
Table 8.
Statistics of assessment indicators for sustainability contribution in Jiansheng town from 2015 to 2019.
5.3. Calculation and Results
The raw data in Table 8 was handled by researchers to acquire the weights of indicators according to the equation from Equations (2) and (6). The final calculation result of can be seen in Table 9.
Table 9.
Sustainable contribution of infrastructures to Jiansheng Town.
Secondly, the nine experts, which were mentioned above (5.2), were also invited to give their comments for the contribution value . The comments were based on the hypothesis that all five types of infrastructure have been put into operation and match the development plan of Jiansheng town in the near future. The five-point Likert method was adopted to present respondents’ view about each infrastructure’s effect on each indicator. In this paper, 5 was a significant influence and 1 was no influence. The full mark of nine experts’ views on each parameter was 45 (5 × 9 = 45). The final value of was the result of actual total mark of nine experts’ views that was divided by 45, which can be seen in Table 9.
According to Equation (1): , the sustainable contribution of each infrastructure to Jiansheng town can be acquired when the value of and were put into the equation as shown in the last line of Table 9, where = 61.93, = 52.60, = 47.91, = 53.31, and = 46.05. According to the results, the quantitative values of sustainable contribution (SCOI) to Jiansheng town from the road transport was 61.93, the SCOI from sewage treatment was 52.60, the SCOI from waste disposal is 47.91, the SCOI from water supply was 53.31, and the SCOI from gas was 46.05.
6. Discussion
6.1. Analysis of Order and Priority of Infrastructure Investment Based on SCOI
In general, the results in Table 8 demonstrated that the sustainable contribution of road transportation to Jiansheng town was the greatest, followed by water supply, sewage treatment, and waste disposal, and sustainable contribution of gas was the least. Compared with the previous on-site investigation of the 24 townships in Southwest China, the order of the major infrastructures is: road transport, sewage treatment, waste disposal, water supply, and gas. It is clear that road transport is really the most important infrastructure for these townships and should be achieved with enough attention and investment. On the whole, it shows that the result of this model assessment matches the practical condition.
However, there is a little difference between the two orders as shown in Table 10. The SCOI value of water supply in Jiansheng town is 53.31, which was higher than that of sewage treatment and waste treatment, and the order of water supply was second while the order of water supply was fourth through on-site investigation. It means that the water supply is playing more roles in the sustainable development of this specific town. On the other hand, the possibility cannot be ruled out that water supply has not attracted enough attention in the development of these townships, which may lead to such kind of infrastructure that is lost due investment and further constrains these townships’ sustainable development. After all, according to the order that is based on results of SCOI, it is recommended, for the purpose of sustainable development, that the priority of infrastructure investment in Jiansheng town in the next several years should follow the latter order.
Table 10.
The changes in the rank of the major infrastructures.
6.2. Improvement of the Infrastructures in Townships
According to results, it can be seen that road transportation is the biggest contributor with a sustainable contribution (US1) = 61.93 among these five infrastructures to the sustainable development of Jiansheng town. It is shown from Table 8 that, in the road transportation indicators that were set, the top three indicators of contribution value included GDP per capita (Ec1), mileage per 10,000 people (So4), and gross output value of secondary industry (Ec3). Of these indicators, two (Ec1 and Ec3) are in an economic dimension and one (So4) is in a social dimension. Road transportation enables communication, and further extend benefits by widening product and labor markets and promoting innovation through the exchange of ideas, making important contributions to the economy and society [30]. At the same time, road transport is also an important carrier of town’s agricultural development. In Table 8, the highest contribution value to the gross output value of primary industry (Ec2) among all the five infrastructures was 77.78, carried by road transport. It means that the road transport plays the most important role in the agricultural industry and the key breakout for the strategy of rural vitalization in China. However, the contribution of road to the environment dimension is not significant, as we can see in Table 9. With the further on-site investigation that was carried out in Jiansheng town, as we can see from the Figure 3, there are still strong needs for road transport in villages. In light of the significant role of townships in rural development, the development of road transport is still an important task for these townships, with more consideration of quality such as environmental protection, less occupation of green space, and energy saving.
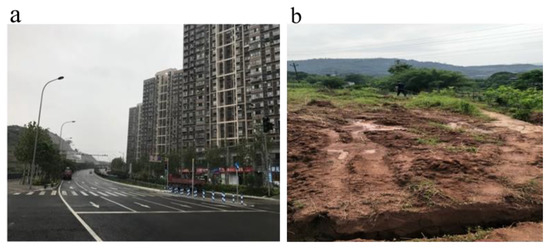
Figure 3.
Roads in Jiansheng town. (a) The road in the town, (b) the road in the village.
As the second contributor, water supply had the greatest contribution to En2 referring to safe drinking water, Ec3 referred to the output of secondary industry, and Ec4 referred to the output of third industry. At present, through on-site investigations of 24 townships, it is true that most regions have achieved full coverage of water access while most water pipes are aged because of the number of years since they were installed, resulting in a reduction of quality of the water supply and some health problems. According to other survey statistics from 563 water plants in Chongqing’s townships [69], only 18% of these water plants were built after 1980, meanwhile 80% of which lacked water quality laboratory and qualified disinfection facilities. In the research in Yunnan Province [70], there are still 67% of townships that lack water plants or a water supply network up til 2015 and the existing parts were also badly aged. We need to not only ensure the quantity of the water supply but also improve the quality of the water. The improvement of water quality, through the measures of eliminating dumping, minimizing release of hazardous chemicals and materials, reducing pollution, and providing services of safely managed drinking water, are important goals for China’s sustainable development by 2030 [5]. Thus, it urges townships to improve water infrastructure construction, especially in renewing the aged facilities and improving water quality.
Sewage treatment is the third contributor, with a sustainable contribution (US2) = 52.60. Sewage treatment has the greatest contribution to the domestic sewage treatment rate (En4), followed by Ec3 and Ec4. Two indicators (Ec3 and Ec4) are in an economic dimension and one (En4) is in an environmental dimension. Sewage treatment can minimize emissions of odor and alleviate the impact of climate change [34]. In other words, sewage treatment can improve the living environment, attracting more residents. It not only provides additional labors for secondary industry, but also attracts more investors for third industry development. Furthermore, some traditional sewage treatment processes, especially industrial sewage treatment, consumes additional energy and releases greenhouse gases [71]. In the future, more energy efficient sewage treatment process or technologies should be promoted in these townships.
The SCOI of waste disposal (US3) is 47.91. Waste disposal has the greatest contribution to the domestic garbage disposal rate (En3), air quality days up to standard rate (En1), and the gross output value of third industry (Ec4). There are two indicators (En3 and En1) that are in environment dimension and one (Ec4) that is in an economic dimension. It is obvious that the main contribution of waste disposal tend is in the environment dimension. Proper waste disposal and management can eliminate uncontrolled disposal and reduce its vast adverse environmental and health impacts [41], providing a good living environment to attract more investors in third industry. As such, waste disposal should also be paid more attention in the township’s sustainable development.
With the score of SCOI as 46.05, gas has the greatest contribution to Ec3, Ec4, and En1 (air quality days up to standard rate). There are two indicators (Ec3 and Ec4) that are in an economic dimension and one (En1) that is in an environment dimension. Lan [24] argued that power–gas energy storage technology is one of the most important power systems in the future, and it will have a positive impact on the economy. Tao [54] proposed that the coal–gas policy has significantly improved overall air quality and reduced industrial gas pollutant emissions. As a clean energy source, it not only provides motivation for the development of secondary and third industries but also reduces greenhouse gas emissions to improve air quality. It can be predicted that gas infrastructure would be greatly developed in townships in China in the near future, for the goal of a carbon dioxide emission peak by 2030 and carbon neutrality by 2060.
6.3. Future Development of Infrastructure in Townships
The major infrastructures were determined based on the practical conditions of townships in Southwest China, compared to that in Eastern China or in developed countries, which represents relatively underdeveloped and insufficient infrastructure in some areas to fulfill the basic living and production needs. It means that the selection of five major infrastructures (road transport, sewage treatment, waste disposal, water supply, and gas) that are only applicable to the townships in these areas and the current stage of townships’ development. However, with the gradual development, increasing awareness of sustainability and basic needs being fully fulfilled, the needs for other infrastructures in these townships would rise continually. In line with the requirement in ISO 37120:2018 [14], infrastructures referring to environmental protection, energy saving, or increasing energy efficiency would require more attention such as gas representing a clean energy source [71], photovoltaic plant [29], and other new energy facilities. By that time, the major infrastructures will vary and the priority of infrastructure investment will also change. In light of this, some related indicators have been considered in the indicator system including Table 2 and Table 5. It is worth mentioning that both the indicator system and the model for assessing the SCOI, introduced in this study, are still applicable for any of infrastructure portfolio, just requiring a minor adjustment.
7. Conclusions
Although there have been many studies involving in infrastructure sustainability and township’s sustainable development, limited studies refer to the infrastructure effect on township’s sustainable development, named as sustainable contribution of infrastructure (SCOI) in this study. Therefore, works have been conducted in examining the SCOI of each infrastructure to townships within the context of Southwest China. This study can provide a new way for the practice and research on sustainable development.
To measuring the SCOI, this paper set up an indicator system that is applicable to the special circumstances of townships in Southwest China. With on-site investigations and literature analysis, there are five most urgent needed infrastructures in townships in Southwest China that were found, including road transport, sewage treatment, waste disposal, water supply, and gas. Focusing on these five infrastructures, a general indicator system with 26 indicators for comprehensively measuring the SCOI, and a model combining quantitative methods and qualitative methods were drawn out in this study. Due to the forward-looking considerations of indicators, the indicator system and the methodology that were used in this study, can also be used in other areas in China or developing countries through proper adjustment.
Furthermore, the results can also provide reference for decision-makers or policy-makers. Through carrying out the case study, the application of this model was demonstrated and the results of SCOI were calculated and analyzed. These findings can provide insights for township managers to determine the priority of infrastructure investment and other developing plans referring to infrastructure.
However, there is still limitation in this study that should be highlighted. Due to the constraints of data availability, only one township was selected for the case study, which may limit the universality of the results. Accordingly, in further research, comparison of the SCOI among different types of townships may provide additional interesting information. Otherwise, it could also be considered too in-depth to investigate and develop a more reasonable indicator system, including more consideration of energy performance, and improving the integration with international standards or well recognized indicator system. Furthermore, in view of the limited financial resources in townships, a study on portfolio decisions that were based on SCOI evaluation in terms of allocation of the available financial resources would also be valuable.
Author Contributions
Conceptualization, Y.S. and C.H.; methodology, Y.S. and C.H.; software, Y.S. and X.C.; validation, Y.S., C.H. and D.M.; formal analysis, Y.S. and Y.Z.; investigation, Y.S. and Y.Z.; resources, Y.S. and C.H.; data curation, Y.S., D.M. and X.C.; writing—original draft preparation, Y.S. and C.H.; writing—review and editing, Y.S., C.H. and V.W.Y.T.; visualization, Y.S.; supervision, Y.S. and V.W.Y.T.; project administration, Y.S. and V.W.Y.T.; funding acquisition, Y.S. All authors have read and agreed to the published version of the manuscript.
Funding
This research was funded by Chongqing Municipal Education Commission (Grant No. 20SKGH239) and Chongqing University of Science & Technology (Grant No. YKJCX2020617). And The APC was funded by Chongqing University of Science & Technology.
Informed Consent Statement
Informed consent was obtained from all subjects involved in the study.
Conflicts of Interest
The authors declare no conflict of interest.
References
- She, Y.; Shen, L.; Jiao, L.; Zuo, J.; Tam, V.W.; Yan, H. Constraints to achieve infrastructure sustainability for mountainous townships in China. Habitat Int. 2018, 73, 65–78. [Google Scholar] [CrossRef]
- Zhang, X.; Wu, Y.; Skitmore, M.; Jiang, S. Sustainable infrastructure projects in balancing urban-rural development: Towards the goal of efficiency and equity. J. Clean. Prod. 2014, 107, 445–454. [Google Scholar] [CrossRef]
- Shen, L.; Jiang, S.; Yuan, H. Critical indicators for assessing the contribution of infrastructure projects to coordinated urban–rural development in China. Habitat Int. 2012, 36, 237–246. [Google Scholar] [CrossRef]
- Shen, L.; Wu, Y.; Zhang, X. Key Assessment Indicators for the Sustainability of Infrastructure Projects. J. Constr. Eng. Manag. 2013, 139, 591. [Google Scholar] [CrossRef]
- Global Indicator Framework for the Sustainable Development Goals and Targets of the 2030 Agenda for Sustainable Development. Available online: https://unstats.un.org/sdgs/indicators/Global%20Indicator%20Framework%20after%202019%20refinement_Eng.pdf (accessed on 6 October 2019).
- Lu, Z.; Peña-Mora, F.; Wang, X.R.; Shen, C.Q.; Riaz, Z. Social Impact Project Finance: An Innovative and Sustainable Infrastructure Financing Framework. Financ. Mark. Res. 2015, 123, 300–307. [Google Scholar] [CrossRef][Green Version]
- Siew, R.; Balatbat, M.; Carmichael, D.G. A review of building/infrastructure sustainability reporting tools (SRTs). Smart Sustain. Built Environ. 2012, 2, 106–139. [Google Scholar] [CrossRef]
- Frare, M.B.; Clauberg, A.P.; Sehnem, S.; Campos, L.M.; Spuldaro, J. Toward a sustainable development indicators system for small municipalities. Sustain. Dev. 2020, 28, 1148–1167. [Google Scholar] [CrossRef]
- Yao, H.; Shen, L.; Tan, Y.; Hao, J. Simulating the impacts of policy scenarios on the sustainability performance of infrastructure projects. Autom. Constr. 2011, 20, 1060–1069. [Google Scholar] [CrossRef]
- Ugwu, O.; Kumaraswamy, M.; Wong, A.; Ng, S. Sustainability appraisal in infrastructure projects (SUSAIP): Part 1. Development of indicators and computational methods. Autom. Constr. 2006, 15, 239–251. [Google Scholar] [CrossRef]
- Sun, X.; Liu, X.; Li, F.; Tao, Y.; Song, Y. Comprehensive evaluation of different scale cities’ sustainable development for economy, society, and ecological infrastructure in China. J. Clean. Prod. 2015, 163, S329–S337. [Google Scholar] [CrossRef]
- Hague, C. Small towns in a small country. In Findings from the Small Towns Initiative of the Built Environment Forum.Scotland; BEFS: Glasgow, UK, 2013. [Google Scholar]
- CITYkeys Indicators for Smart City Projects and Smart Cities. Available online: http://www.citykeys-project.eu/citykeys/cities_and_regions/performance-measurement-framework, (accessed on 24 January 2022).
- ISO37120:2018: Sustainable Cities and Communities—Indicators for City Services and Quality of Life. Available online: https://www.iso.org/standard/68498.html (accessed on 10 July 2021).
- Bisegna, F.; Cirrincione, L.; Casto, B.M.L.; Peri, G.; Rizzo, G.; Scaccianoce, G.; Sorrentino, G. Fostering the energy efficiency through the energy savings: The case of the University of Palermo. In Proceedings of the IEEE International Conference on Environment and Electrical Engineering;IEEE Industrial and Commercial Power Systems Europe, Genova, Italy, 11–14 June 2019. [Google Scholar]
- Guerrieri, M.; Gennusa, M.L.; Peri, G.; Rizzo, G.; Scaccianoce, G. University campuses as small-scale models of cities: Quantitative assessment of a low carbon transition path. Renew. Sustain. Energy Rev. 2019, 113, 109263. [Google Scholar] [CrossRef]
- U.S. Green Building Council. LEED Neighborhood Development Rating System; GBC LEED ND RATING SYSTEM-2009; U.S. Green Building Council: Washington, DC, USA, 2009. [Google Scholar]
- Mohamed, K.E. The Implementation Model of Integrating the Three Sustainability Aspects into the Undergraduate Architectural Design Studio. J. Green Build. 2021, 16, 217–238. [Google Scholar] [CrossRef]
- Zambon, I.; Colantoni, A.; Cecchini, M.; Mosconi, E.M. Rethinking sustainability within the viticulture realities integrating economy, landscape and energy. Sustainability 2018, 10, 320. [Google Scholar] [CrossRef]
- Shi, Y.; Ge, X.; Yuan, X.; Wang, Q.; Kellett, J.; Li, F.; Ba, K. An Integrated Indicator System and Evaluation Model for Regional Sustainable Development. Sustainability 2019, 11, 2183. [Google Scholar] [CrossRef]
- Golbazi, M.; Aktas, C.B. LEED Certification and Patient Wellbeing in Green Healthcare Facilities. J. Green Build. 2020, 15, 3–18. [Google Scholar] [CrossRef]
- Visvaldis, V.; Ainhoa, G.; Ralfs, P. Selecting Indicators for Sustainable Development of Small Towns: The Case of Valmiera Municipality. Procedia Comput. Sci. 2013, 26, 21–32. [Google Scholar] [CrossRef]
- D’Andria, E.; Fiore, P.; Nesticò, A. Small Towns Recovery and Valorisation. An Innovative Protocol to Evaluate the Efficacy of Project Initiatives. Sustainability 2021, 13, 10311. [Google Scholar] [CrossRef]
- Lan, Y.; Tham, J.; Jia, S.; Sarkar, S.; Yu, L.E. Peat-forest burning smoke in Maritime Continent: Impacts on receptor PM2.5 and implications at emission sources. Environ. Pollut. 2021, 275, 116626. [Google Scholar] [CrossRef]
- Buggin, A.; Gennusa, M.L.; Peri, G.; Rizzo, G.; Tambani, C. Towards resilient cities: Advancements allowed by a multi-criteria optimization tool to face the new challenges of European Union’s climate and energy goals. IOP Conf. Ser. Mater. Sci. Eng. 2019, 609, 072047. [Google Scholar] [CrossRef]
- Urban Environment. European Common Indicators. Available online: URL:http://ec.europa.eu/environment/urban/common_indicators.htm (accessed on 13 March 2013).
- Taecharungroj, V.; Suksaroj, T.T.; Rattanapan, C. The place sustainability scale: Measuring residents’ perceptions of the sustainability of a town. J. Place Manag. Dev. 2018, 11, 370–390. [Google Scholar] [CrossRef]
- Xu, J.; Bai, J.; Chen, J. An improved indicator system for evaluating the progress of sustainable development goals (SDGs) sub-target 9.1 in county level. Sustainability 2019, 11, 4783. [Google Scholar] [CrossRef]
- Giaccone, A.; Lascari, G.; Peri, G.; Rizzo, G. An ex post criticism, based on stakeholders’ preferences, of a residential sector’s energy master plan: The case study of the Sicilian region. Energy Effic. 2017, 10, 129–149. [Google Scholar] [CrossRef]
- Thacker, S.; Adshead, D.; Fay, M.; Hallegatte, S.; Harvey, M.; Meller, H.; O’Regan, N.; Rozenberg, J.; Watkins, G.; Hall, J.W. Infrastructure for sustainable development. Nat. Sustain. 2019, 2, 324–331. [Google Scholar] [CrossRef]
- Terra, F.H.B.; Ferrari Filho, F.; Fonseca, P.C.D. Keynes on state and economic development. Rev. Political Econ. 2021, 33, 88–102. [Google Scholar] [CrossRef]
- Roberts, P.; Kc, S.; Rastogi, C. Rural Access Index: A Key Development Indicator; The World Bank Group: Washington, DC, USA, 2006. [Google Scholar]
- Wang, L.; Xue, X.; Zhao, Z.; Wang, Z. The impacts of transportation infrastructure on sustainable development: Emerging trends and challenges. Int. J. Environ. Res. Public Health 2018, 15, 1172. [Google Scholar] [CrossRef] [PubMed]
- Delanka-Pedige, H.M.K.; Munasinghe-Arachchige, S.P.; Abeysiriwardana-Arachchige, I.S.A.; Nirmalakhandan, N. Wastewater infrastructure for sustainable cities: Assessment based on UN sustainable development goals (SDGs). Int. J. Sustain. Dev. World Ecol. 2020, 28, 203–209. [Google Scholar] [CrossRef]
- Vaishar, A.; Šťastná, M. Sustainable Development of a Peripheral Mountain Region on the State Border: Case Study of Moravské Kopanice Microregion (Moravia). Sustainability 2019, 11, 5540. [Google Scholar] [CrossRef]
- Konzelmann, S.J.; Chic, V.; Fovargue-Davies, M. Keynes, capitalism and public purpose. Camb. J. Econ. 2021, 45, 591–612. [Google Scholar] [CrossRef]
- Bedrunka, K. Concepts of the sustainable development of the region. In Sustainable Production: Novel Trends in Energy, Environment and Material Systems; Springer: Cham, Switzerland, 2020. [Google Scholar]
- Malmir, M.; Javadi, S.; Moridi, A.; Neshat, A.; Razdar, B. A new combined framework for sustainable development using the DPSIR approach and numerical modeling. Geosci. Front. 2021, 12, 101169. [Google Scholar] [CrossRef]
- Ness, D.A.; Xing, K. Consumption-based and Embodied Carbodied Carbon in the Built Environment: Implications for Apec’s Low-carbon Model Town Project. J. Green Build. 2020, 15, 67–82. [Google Scholar] [CrossRef]
- Wu, H.; Gao, X.; Wu, M.; Zhu, Y.; Ye, S. The efficiency and risk to groundwater of constructed wetland system for domestic sewage treatment—A case study in Xiantao, China. J. Clean. Prod. 2020, 277, 123384. [Google Scholar] [CrossRef]
- Maalouf, A.; Mavropoulos, A.; El-Fadel, M. Global municipal solid waste infrastructure: Delivery and forecast of uncontrolled disposal. Waste Manag. Res. 2020, 38, 1028–1036. [Google Scholar] [CrossRef] [PubMed]
- The Ministry of Urban and Rural Construction, the Ministry of Finance, and the National Development and Reform Commission Jointly. Evaluation Index System for Green and Low-Carbon Key Townships (Trial). 2011. [Google Scholar]
- Shen, L.; Shuai, C.; Jiao, L.; Tan, Y.; Song, X. A global perspective on the sustainable performance of urbanization. Sustainability 2016, 8, 783. [Google Scholar] [CrossRef]
- Almeida, A.; Silva, J.; Angelo, H. Importance of primary, secondary and tertiary industries for sustainable development. GDR 2013, 9, 146–162. [Google Scholar]
- Zhanglin, G.; Peng, L.; Jun, E.L. The role of primary and secondary industry in pulling the growth of GDP. In Proceedings of the 2010 International Conference on Computer and Communication Technologies in Agriculture Engineering(CCTAE 2010), Chengdu, China, 12–13 June 2010. [Google Scholar]
- Shen, Y.; Zhijian, L. Empirical Research of Scientific and Technological Talents’s Contribution to Sustainable Development of Economic Growth in Zhejiang, China; Baidu: Beijing, China, 2012. [Google Scholar]
- Siew, Y.R. Green Township Index: Malaysia’s sustainable township rating tool. Eng. Sustain. 2018, 171, 1–9. [Google Scholar] [CrossRef]
- Winans, K.; Dlott, F.; Harris, E.; Dlott, J. Sustainable value mapping and analysis methodology: Enabling stakeholder participation to develop localized indicators mapped to broader sustainable development goals. J. Clean. Prod. 2021, 291, 125797. [Google Scholar] [CrossRef]
- Cabello, J.M.; Navarro-Jurado, E.; Rodríguez, B.; Thiel-Ellul, D.; Ruiz, F. Dual weak–strong sustainability synthetic indicators using a double reference point scheme: The case of Andalucía, Spain. Oper. Res. 2019, 19, 757–782. [Google Scholar] [CrossRef]
- Davardoust, S.; Karahan, F. Evaluation of Sustainable Rural Tourism. The Case of Uzundere District, Erzurum, Turkey. Sustainability 2021, 13, 10218. [Google Scholar] [CrossRef]
- Yang, B.; Xu, T.; Shi, L. Analysis on sustainable urban development levels and trends in China’s cities. J. Clean. Prod. 2017, 141, 868–880. [Google Scholar] [CrossRef]
- Huovila, A.; Bosch, P.; Airaksinen, M. Comparative analysis of standardized indicators for Smart sustainable cities: What indicators and standards to use and when? Cities 2019, 89, 141–153. [Google Scholar] [CrossRef]
- Ciranni, A. Creating a More Sustainable City. Buildings 2018, 112, 18–19. [Google Scholar]
- Tao, Y.; Li, F.; Crittenden, J.; Lu, Z.; Ou, W.; Song, Y. Measuring urban environmental sustainability performance in China: A multi-scale comparison among different cities, urban clusters, and geographic regions. Cities 2019, 94, 200–210. [Google Scholar] [CrossRef]
- Egilmez, G.; Gumus, S.; Kucukvar, M. Environmental sustainability benchmarking of the US and Canada metropoles: An expert judgment-based multi-criteria decision making approach. Cities 2015, 42, 31–41. [Google Scholar] [CrossRef]
- Alawneh, R.; Ghazali, F.E.M.; Ali, H.; Asif, M. Assessing the contribution of water and energy efficiency in green buildings to achieve United Nations Sustainable Development Goals in Jordan. Build. Environ. 2018, 146, 119–132. [Google Scholar] [CrossRef]
- Cattaneo, T.; Giorgi, E.; Ni, M.; Manzoni, G.D. Sustainable development of rural areas in the EU and China: A common strategy for architectural design, research practice and decision-making. Buildings 2016, 6, 42. [Google Scholar] [CrossRef]
- The National Development and Reform Commission, P.R.C. National New Urbanization Plan (2014–2020). Urban Plan. Forum 2014, 3. [Google Scholar]
- Chongqing Municipal People’s Government. The Guidance on the Development of Characteristic Townships in Chongqing; Chongqing Municipal People’s Government: Chongqing, China, 2016. [Google Scholar]
- People’s Government of Yunnan Province. The Implementation Opinions on Deepening the Construction of New-Type Urbanization in Yunnan Province; People’s Government of Yunnan Province: Yunnan, China, 2016. [Google Scholar]
- Ministry of Housing and Urban-Rural Development, P.R.C. Construction Practice of Characteristic Townships in Guizhou Province; Ministry of Housing and Urban-Rural Development, P.R.C.: Beijing, China, 2016. [Google Scholar]
- Sichuan Province Development and Reform Commission. Development Plan of Characteristic Townships in Sichuan Province during the 13th Five-Year Plan; Sichuan Province Development and Reform Commission: Chengdu, China, 2017. [Google Scholar]
- Wei, H.; Zhang, Y.; Xiu, P.; Zhang, H.; Zhu, S. Index-based analysis of industrial structure and environmental efficiency based on sewage discharge assessment in China. Alex. Eng. J. 2022, 61, 493–500. [Google Scholar] [CrossRef]
- Wang, Q.; Yuan, X.; Zhang, J.; Gao, Y.; Hong, J.; Zuo, J.; Liu, W. Assessment of the Sustainable Development Capacity with the Entropy Weight Coefficient Method. Sustainability 2015, 7, 13542–13563. [Google Scholar] [CrossRef]
- Shen, L.; Zhang, Z.; Zhang, X. Key factors affecting green procurement in real estate development: A China study. J. Clean. Prod. 2017, 153, 372–383. [Google Scholar] [CrossRef]
- Su, H.; Zhu, C. Application of entropy weight coefficient method in evaluation of soil fertility. In Recent Advances in Computer Science and Information Engineering; Springer: Cham, Switzerland, 2012; pp. 697–703. [Google Scholar]
- Zou, Z.-H.; Yi, Y.; Sun, J.-N. Entropy method for determination of weight of evaluating indicators in fuzzy synthetic evaluation for water quality assessment. J. Environ. Sci. 2006, 18, 1020–1023. [Google Scholar] [CrossRef]
- Baidu. Satellite of Jiansheng Town. Available online: http://www.fengyunditu.com/?ver=bd-wx-266&renqun_youhua=3127511 (accessed on 5 December 2021).
- Shaojie, J.I.; Zhimin, Z. Problems and Countermeasures of Water Supply System in Small Towns. J. Chongqing Univ. 2005, 11, 118–121. [Google Scholar]
- Xin, C.; Yan, F.; Jiajia, W.; Xiangwan, L.; Chihao, L. Existing problems of water supply system of a small town in Yunnan province and countermeasures thereof. Ind. Water Wastewater 2015, 46, 49–51. [Google Scholar]
- Yu, Y.J.; Wang, Q.; Yang, Y.; Fu, Y.W.; Lu, C.X. Study on the energy consumption and conservation trend of sewage treatment processes. Adv. Mater. Res. 2014, 870, 408–415. [Google Scholar] [CrossRef]


Publisher’s Note: MDPI stays neutral with regard to jurisdictional claims in published maps and institutional affiliations. |
© 2022 by the authors. Licensee MDPI, Basel, Switzerland. This article is an open access article distributed under the terms and conditions of the Creative Commons Attribution (CC BY) license (https://creativecommons.org/licenses/by/4.0/).