Abstract
The world of building materials is constantly and rapidly developing. New technologies are needed to reduce the cost of producing these materials and to ensure better efficiency when the materials are used in various engineering projects. One of these materials is high-strength concrete. This paper investigates the production of low-cost, high-strength concrete by partially replacing fine aggregates (FA) with waste glass sand (WGS). Four concrete mixes were considered in this study with varying percentages of WGS (0%, 25%, 50%, and 75%). For each mix, cubic, cylindrical, and beam specimens were cast to study the workability and different mechanical properties of concrete-like density, elasticity modulus, compressive strength, ultrasonic pulse velocity (UPV), split tensile strength, and flexural strength. In addition, the cost of each mix was calculated to evaluate the cost reduction efficiency of concrete with WGS compared to normal concrete. Results showed that the workability of concrete enhanced as the percentage of WGS increased. In terms of concrete mechanical properties, it was shown that the elasticity modulus, compressive strength, split tensile strength, and flexure strength for a concrete mix with 50% WGS as FA replacement was increased by 7%, 27%, 9%, and 50%, respectively. Also, it was concluded that the presence of WGS in concrete mixes reduced the production cost by up to 30% for a 75% replacement level. The authors recommended the usage of 50% WGS as the optimum replacement percentage for low-cost, high-strength concrete.
1. Introduction
Using natural sand as fine aggregates in concrete production has been the conventional element used in the industry for several decades. However, this excessive use can result in the depletion of locally available sand [1,2]. Current practices that consider sustainability as a priority are agreed on finding ways to reuse the waste in order to prevent environmental consequences and save natural resources without compromising the quality of the concrete [3,4,5,6,7,8,9]. One of the alternative materials that can substitute the fine natural aggregates in concrete is recycled glass. Using glass as sand replacement helps in preserving natural sand while reducing the amount of glass waste generated [1,5,10].
The key parameters that affect the efficiency of using glass as sand replacement are related to the glass’s physical and chemical properties, which include size, gradation, shape, specific gravity, and resistance to alkali-aggregate reactions [4]. The finer the glass particles, the better the mechanical and durability performance is [11,12]. Using glass sand at replacement levels between 5% to 15% resulted in a positive slump value and compaction factor [13,14,15], in addition to having a considerable improvement in the concrete density attributed to the micro-filling effect. However, for replacement levels beyond 20%, a loss of workability is realized [12,13]. The slump of concrete decreases as the percentage of sand glass replacement content increases [5,15]. Some studies attribute this decrease to the sharp and larger surface area of the sand glass [1,10,12,15].
From the main concerns that lie behind the use of waste glass sand in concrete is the Alkali-Silica Reaction (ASR), which occurs between amorphous silica present in the glass composition and alkali in cement, resulting in excessive expansion when moisture is present and thus affects the durability of concrete [11]. Studies show that using waste glass sand up to 20% replacement levels did not show substantial ASR expansion [6,16]. Also, since ASR reactions are attributed to various parameters, including particle size, well-graded glass send can serve to increase the density due to the micro-filling effect and thus lower the risk of ASR expansion [12]. Although the inclusion of waste glass sand might lead to an increase in cost, it serves as an eco-friendly option that obtains acceptable concrete characteristics and a reduced cost of waste management [15]. However, it is recommended by some studies that up to 10% replacement levels of low-grade and uneconomic glass fines can be used to substitute natural sand in concrete [17]. This serves to reduce the consumption of large amounts of natural resources and contribute to the benefit of the economy and environment [18,19].
Several studies conducted on the use of waste glass as sand replacement in concrete have agreed that the effective substitution of sand up to between 10 to 30% exposes no detrimental long-term effects on the quality of concrete [4,5,6,7,8,9,10,11,12,13,14,15]. The best percentage of replacement in common with most studies is at 20% sand replacement level [1,4,6,7,12,13].
Several studies have been conducted on the use of waste glass (WG) in ultra-high-performance concrete (UHPC) as a binder and fine aggregates (FA) replacement [20,21,22,23,24,25,26,27]. Soliman and Tagnit-Hamou [20] investigated the replacement of silica fume (SF) in UHPC with waste glass powder (WGP). The replacement percentages adopted in this study were 30%, 50%, 70%, and 100%. It was demonstrated that replacing SF in UHPC by 30–50% led to enhancing concrete compressive strength by 15% and 8%, respectively. Moreover, better fresh concrete properties were achieved as the percentage of WGP increased.
Another study was conducted by Jiao et al. [22] on concrete incorporating WG as FA replacement. The study investigated different replacement percentages of WG (25%, 50%, 75%, and 100%) to recommend the best replacement percentage in terms of concrete mechanical properties. It was noticed that concrete with 75% WG as FA replacement had the highest compressive strength among all specimens. However, incorporating waste glass in concrete showed a negligible effect on both flexure and tensile strength.
Chu et al. [23] studied the partial replacement of paste (cement + silica fume + fly ash) in concrete by WGP. Three replacement percentages of WGP were considered as follows: 5%, 10%, and 15%. In terms of workability, results showed that concrete with 10% WGP had the best workability in terms of slump value and flow diameter. Regarding concrete mechanical properties, results exhibited that at a 10% replacement level, both compressive and flexure strength increased significantly (50% increase for compressive strength and 30% increase for flexure strength) compared to the control mix.
Based on the literature review conducted, it can be concluded that most of the previous studies conducted on sand replacement by the waste glass in concrete focused on the mechanical properties and didn’t consider the cost issue. Some studies were conducted on the cost analysis of UHPC with waste glass as cement replacement, but also, they are few. Therefore, this study aimed to assess the use of waste glass as fine aggregate replacement in low-cost, high-strength sustainable concrete mixtures under standard curing conditions. The workability and mechanical properties of concrete were assessed in this study by performing a slump flow test, density test, elasticity modulus test, ultrasonic pulse velocity (UPV) test, compressive strength test, split tensile test, and flexural strength test. A theoretical analysis was conducted on the findings, and some fitting relations were derived and compared with ACI code equations.
2. Methods
2.1. Mix Design
The properties of various constituents used in the mix design, including Waste Glass Sand (WGS), Quartz Sand (QS), Quartz Powder (QP), and Silica Fume (SF), are shown in Table 1. The cement used has tri-calcium aluminate content of less than 8%, di-calcium and tri-calcium aluminate combined content of more than 65%, low alkali content, and moderate fineness ranging from 3000 to 4500 cm2/kg. The low content of tricalcium aluminate reduces the water demand and improves overall workability. The waste glass sand is ground in the lab with the aid of a compressive strength machine to reduce glass particle sizes (to 300 µm and 150 µm), as shown in Figure 1.

Table 1.
Properties and Composition of the Materials Used.

Figure 1.
(a) Compressive Strength Machine; (b) Crushed Waste glass sand.
The mixtures were made with different percentages of replacement of sand by WGS with the following proportions (0%, 25%, 50%, and 75%), as shown in Table 2. The nomenclature used for each mix consisted of the term WGS followed by the replacement level of waste glass sand. Therefore, the four mixes were named WGS0 (control mix), WGS25 (25% replacement level), WGS50 (50% replacement level), and WGS75 (75% replacement level). All mixes were cast in molds and were normally cured by water at 20 °C till the testing day.

Table 2.
Mix Design.
Oven-dried aggregates were sieved with the help of the mechanical shaker through a stack of sieves to consider a specific particle size for each aggregate type. A particle size of 300 µm was chosen for both QS and WGS (particles retained in sieve #50), while a particle size of 150 µm was chosen for QP (particles retained in sieve #100), as shown in Figure 2.
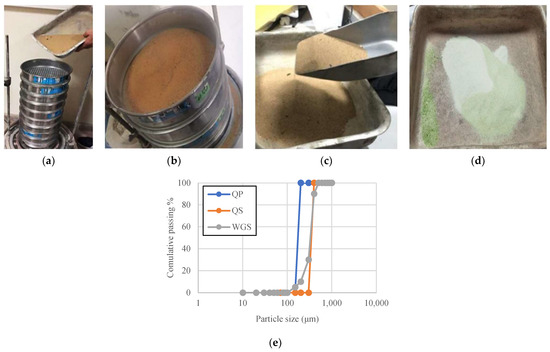
Figure 2.
(a) Mechanical Shaker; (b) Sieving Apparatus; (c) Sieved Aggregates; (d) Waste glass sand; (e) Gradation curve for QP, QS, and WGS.
2.2. Mixing and Casting Procedure
The dry components like Cement, Silica fume (SF), Quartz powder (QP), Quartz sand (QS), and Waste glass sand (WGS) were added to the mixer for three minutes at a low speed. Then, the High-Range Water-Reducing Admixture (HRWRA) and water were added. The diluted HRWRA in half the amount of mixing water was added gradually to the mixture after two minutes of the mixing period, and the remaining quantity of water and HRWRA was added in another two minutes of the mixing. After the preparation of the mixture, the slump flow was measured to check the workability of the mixes. All mixes were de-molded and cured in a water bath in a room at a normal temperature of 20 ºC until the day of testing. For each mix, 9 cubes of (100 × 100 × 100 mm) dimensions were cast for compressive strength and UPV tests. Also, 9 cylinders of 150 mm diameter and 300 mm height were cast for elasticity modulus, compression, and split tensile tests. As for the flexure test, 3 prisms of 40 × 40 × 160 mm were cast. Figure 3 depicts the concrete cubes and prisms after casting.

Figure 3.
Molded Concrete Specimens.
2.3. Testing
Figure 4 shows the various strength tests performed on the different specimens. The slump flow test was performed according to ASTM 1437 [28]. The elasticity modulus test was done according to ASTM C469 [29] requirements. The compressive strength test was done in accordance with test standards ASTM C109 [30] after a curing duration of 7, 14, and 28 days. The load increased gradually until reaching failure. The density test was done according to ASTM C188 [31]. The flexural test was done according to the ASTM C348 [32] standards, and the splitting tensile test was done according to ASTM C496 [33], where the concrete cylinders were placed horizontally along its length, and a vertical load (P) was applied gradually until the specimen reaches failure. The Ultrasonic pulse velocity (UPV) was performed according to ASTM C597 [34].
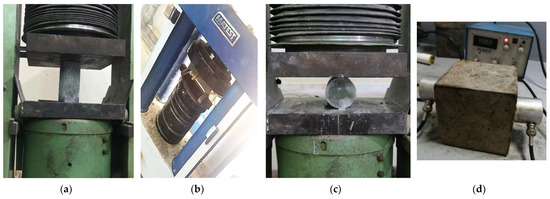
Figure 4.
(a) Compressive Strength Test; (b) Flexural Strength Test; (c) Split Tensile Test; (d) UPV Test.
3. Results and Discussion
3.1. Slump Flow
Figure 5a below shows the slump flow assessment for the mixtures. Based on the experimental visualization, the control mix gave the lowest diameter for the flow table test measured as 165 mm and increased with the increase in replacement levels, gradually reaching 175 mm for 75 % percentage of replacement which indicated the best workability. This is attributed to the low waste glass sand absorption ability. Figure 5b shows the flow diameter for the various mixtures prepared.
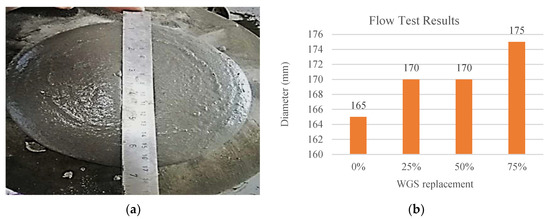
Figure 5.
(a) Flow Test Measurement; (b) Flow Test Results.
Other studies showed a similar trend for workability to this study [22,35]. For example, the study done by Jiao et al. [22] showed that concrete specimens with 100% WGS as a sand replacement had the best workability compared to other replacement percentages (0%, 25%, 50%, 75%, and 100%). Moreover, flowability test results done by Liu et al. [35] demonstrated that concrete with 75% WGS as a sand replacement had the best workability among all replacement percentages. However, the study conducted by Tamanna et al. [1] showed different behavior, where increasing the replacement percentage of WGS led to decreasing slump values. This was justified by the sharp edges and rough texture of the WGS, which led to the reduction of slump values.
3.2. Density
The dry density of concrete was determined for all mixes by measuring the weight/area ratio as shown in Figure 6a for the cubic specimen of (100 mm × 100 mm × 100 mm). It was noticed that as the percentage of waste glass sand replacement increased, the density experienced a decrease relating to the fact that glass powder is lighter than sand affecting the overall aggregate volume and thus decreasing the density. When the percentage of waste glass sand replacement reached 50% and above, the concrete turned to lightweight concrete with a (density < 1850 kg/m3) as observed in Figure 6. Comparable results were determined for the specimens at 14 and 28 days.
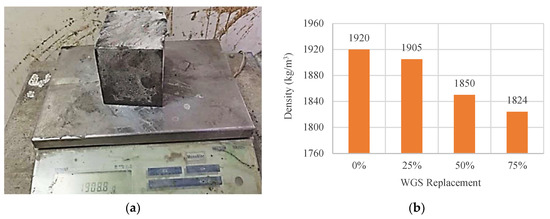
Figure 6.
(a) Weight Measurement; (b) Density of Cubic Specimens at 7 days.
Compared to previous work done on similar topics, the density showed to decrease as the percentage of WGS increased [1,22]. However, in some studies, when the WGS used had a higher density than the quartz sand, the density of concrete showed an increase as the replacement percentage increased [35].
3.3. Compressive Strength
The use of waste glass sand as aggregate replacement contributes to the improvement of the concrete microstructure. It contributes to a beneficial reaction with cement hydrates relating to the fineness and waste glass sand particle properties. As shown in Figure 7 below, the 50% glass replacement was determined as the most efficient percentage in having the highest compressive strength. At 7 days, the 25% glass replacement gave 3.44% higher strength than the control mix, while the 50% glass replacement gave an 18.22% increase in compressive strength. It was noticed that as the waste glass sand replacement levels reached 75%, the bonding between the aggregates was weakened, and the WGS aggregate could not fully play the advantage of high crushing strength, leading to a slight decrease in the compressive strength.
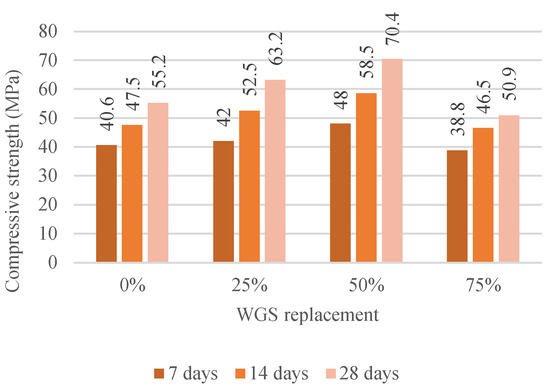
Figure 7.
Compressive Strength Results at 7, 14, and 28 days for cubic specimens.
A similar trend is realized for the compressive strength of cylindrical specimens, where 50% glass replacement led to the highest compressive strength at 28 days. Figure 8 depicts the compressive strength of cubic specimens versus cylindrical specimens. The compressive strength of cylindrical specimens was less than the compressive strength of cubic specimens. The ratio between cylindrical and cubic strength ranged from 0.85 to 0.89, according to Figure 8.
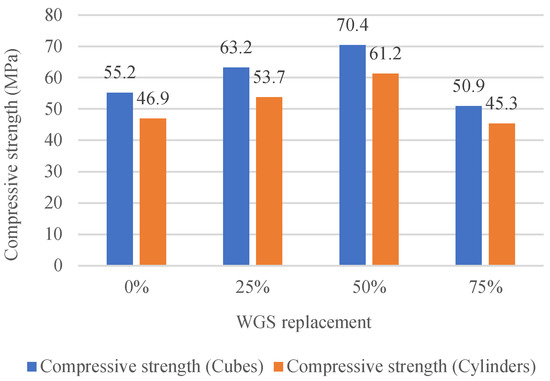
Figure 8.
Compressive Strength Results at 28 days for cubic vs. cylindrical specimens.
The best replacement percentage for the highest compressive, according to previous studies, ranges from 20% to 75%, depending on the type and shape of WGS used in the replacement procedure [1,22]. However, in some studies, the presence of WGS led to decreasing the compressive strength of concrete [35]. This was justified by the high porosity of WGS concrete, which led to a negative effect on the compressive strength.
3.4. Ultrasonic Pulse Velocity (UPV)
The UPV test was conducted along at (7 days, 14 days, and 28 days) for the different concrete mixtures. It is noticed that as the waste glass sand replacement percentage increased, the UPV increased, indicating better concrete quality with low void content. From the results presented in Figure 9, it is indicated that the 50% replacement level with waste glass sand showed the best performance and exhibited continuous improvement with the concrete age.

Figure 9.
UPV Results at 7, 14, and 28 Days.
Based on the UPV findings of this study, the fitting curve that relates UPV to cylindrical compressive strength (f’c) for concrete containing waste glass as a fine aggregate replacement was presented. It has the formula:
where “Y” is the compressive strength of concrete in MPa, and “x” is the ultrasonic pulse velocity (UPV) in m/s. The (R2) factor for the fitting curve formula is 0.97, which indicates high accuracy. Figure 10 depicts the experimental data along with the fitting curve.
Y = 0.247e0.0013x
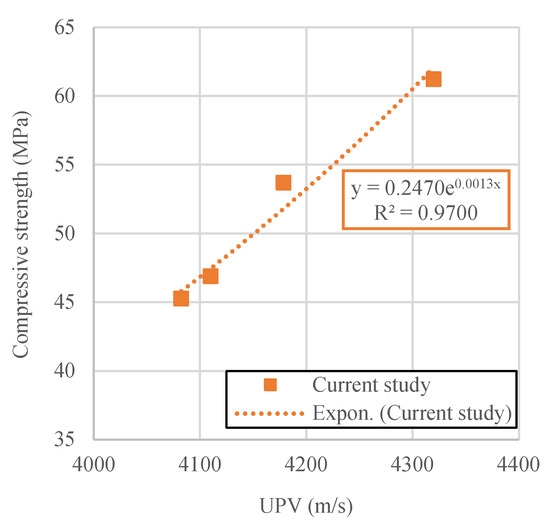
Figure 10.
Fitting curve for UPV and the corresponding compressive strength.
3.5. Modulus of Elasticity
Substituting aggregates with Waste glass sand, according to some research studies, tends to have a positive influence on the elasticity modulus when used at small percentages. This can lead to a similar or slightly higher modulus of elasticity compared to control specimens. The results in Figure 11 show that as the percentage of WGS in concrete increased, the elasticity modulus slightly increased up to a 50% replacement level, whilst a 75% replacement level resulted in a reduction in the modulus of elasticity by around 12% compared to the control specimen. In summary, the elasticity modulus tends to show a dramatic decrease with an increasing percentage beyond 50%.
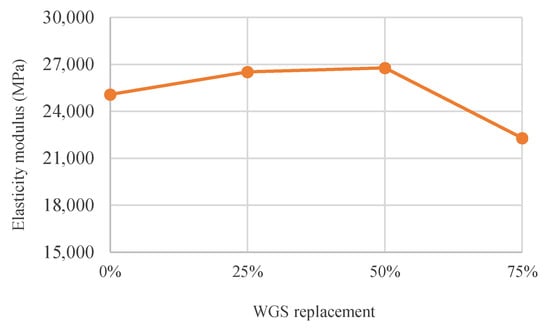
Figure 11.
Elasticity Modulus vs. Glass Sand Replacement Percentage.
3.6. Split Tensile Strength
The split tensile results of the mixtures shown in Figure 12 showed that cylinders having 50% glass sand replacement levels obtained the highest tensile strength with a 9% improvement in comparison with the control mix. Beyond 50% replacement levels, the tensile strength experienced a decreasing manner that may be attributed to the fragility of concrete in tension because of its very brittle nature and the ineffectiveness of glass powder replacement as the improvement was slightly changing. As noticed, when the glass sand replacement levels increased, the concrete cracked and reached its ultimate strength earlier.
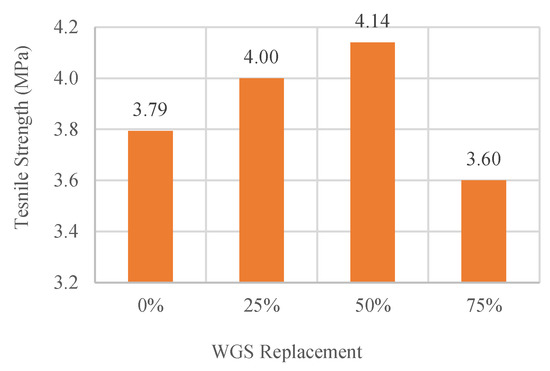
Figure 12.
Split tensile strength at 28 days.
Table 3 shows the ratio between the split tensile strength and compressive strength (ft/f’c) at 28 days. It can be noted that as the percentage of WGS increased, the (ft/f’c) ratio decreased. This is valid until reaching 50% replacement, where values beyond 50% replacement lead to increasing this factor. This is due to the significant drop in compressive strength for specimen WGS75 which led to a higher (ft/f’c) ratio.

Table 3.
The ratio between Split Tensile Strength and Compressive Strength.
Previous research showed a similar trend regarding the split tensile strength [1,22], but they didn’t agree on the best replacement percentage of WGS that resulted in the highest tensile strength, and some of them concluded that replacing WGS with different types of sands, e.g., quartz sand and river sand, led to different increasing percentages in the tensile strength [22].
The ACI code [36] derived a relation between the split tensile strength and cylindrical compressive strength for normal concrete. The equation was plotted in Figure 13 and used as a reference to be compared with the fitting curve from this study that relates the same parameters. The fitting curve has the formula:
where “Y” is the split tensile strength of concrete in MPa, and “x” is the compressive strength of concrete in MPa. The (R2) factor for the fitting curve is 0.92, which indicates high accuracy. It can be shown, according to Figure 13, that split tensile strength values for concrete with waste glass were higher than normal concrete for the same compressive strength values. This could be due to the high enhancement of split tensile strength for WGS concrete compared to normal concrete.
Y = 0.725x0.4257
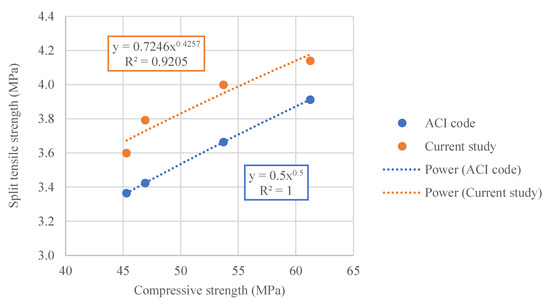
Figure 13.
Fitting curve for the split tensile strength compared to ACI code equation.
3.7. Flexure Strength
The flexural strength results presented in Figure 14 showed that specimens with 50% glass sand replacement showed the highest flexural strength of 10.56 MPa. This is 50% higher than the flexure strength of the control specimen. As the replacement percentage went beyond 50%, the flexure strength showed a significant reduction. This lies within the range of several previous studies conducted on concrete with WGS [1,22]. However, some other studies indicated a reduction in flexure strength as the percentage of WGS increased due to the high porosity of concrete incorporating WGS [35].
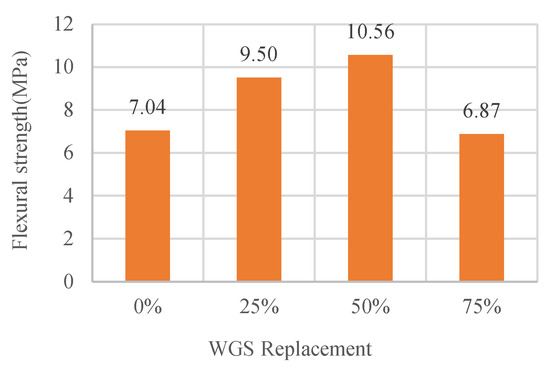
Figure 14.
Split tensile strength at 28 days.
Similar to split tensile strength, the fitting curve was presented for the flexure strength of concrete with WGS as follows:
where “Y” is the flexure strength of concrete in MPa, and “x” is the compressive strength of concrete in MPa. The (R2) factor for the fitting curve is 0.95, which indicates high accuracy. It can be shown, according to Figure 15, that flexure strength values for concrete with waste glass were higher than normal concrete for the same compressive strength values. This is similar to the trend realized for the split tensile strength for WGS concrete.
Y = 0.02x1.53
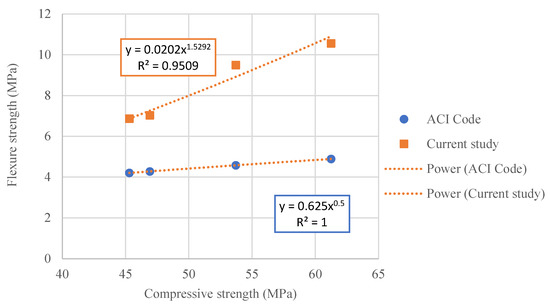
Figure 15.
Fitting curve for the flexure strength compared to ACI code equation.
3.8. Economic Study
In addition to using glass powder as an eco-friendly replacement for natural sand, it also plays a role in reducing the overall cost of the mixture. After summing up the total cost per mixture, as shown in Table 4, it was noticed that as the percentage of glass replacement of sand increased, the cost decreased, reaching a maximum reduction of 8% when 75% of glass powder was used.

Table 4.
Cost analysis details for each concrete mix.
Another way to present the cost analysis results is by determining the Performance/Cost (P/C) ratio, which determines the strength gained per each 1 USD paid for preparing 1 m3 of each mix. Three mechanical properties of concrete were considered in this analysis: compressive strength, split tensile strength, and flexure strength. According to Figure 16, the P/C ratio for compressive strength for the control specimen was 0.383 MPa/$/m3. This ratio increased as the replacement percentage of WGS increased to reach 0.449 MPa/$/m3, 0.526 MPa/$/m3, and 0.339 MPa/$/m3 for replacement levels 25%, 50%, and 75%, respectively.
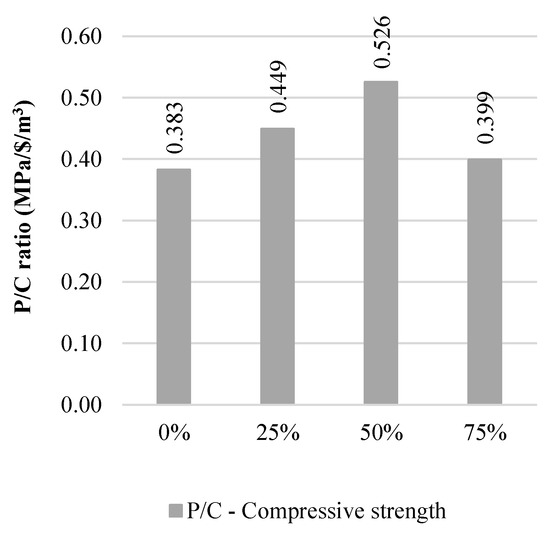
Figure 16.
P/C ratios for compressive strength.
Moreover, a similar trend was realized for the split tensile strength and flexure strength, where the P/C ratio increased from 0.031 MPa/$/m3 for specimen WGS0 to reach a maximum value of 0.036 MPa/$/m3 for specimen WGS50. As for the P/C ratios for flexure strength, it increased from 0.057 MPa/$/m3 for WGS0 to reach a maximum value of 0.091 MPa/$/m3 for WGS50. Although the P/C ratio for split tensile and flexure strength decreased at replacement level 75%, it was still higher than the P/C ratio of control specimen WGS0, as depicted in Figure 17.
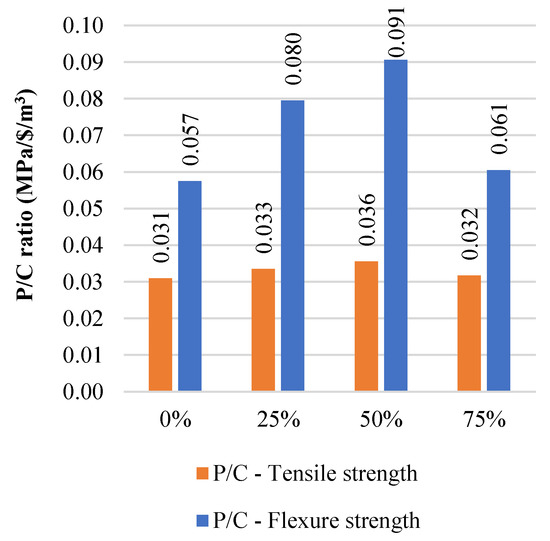
Figure 17.
P/C ratios for split tensile and flexure strengths.
This indicates that the utilization of WGS as sand replacement is possible economically, speaking up to 75% replacement level. However, the authors recommend the 50% replacement level since it corresponds to maximum enhancement in the P/C ratio (37% for compressive strength, 16% for split tensile strength, and 60% for flexure strength).
4. Conclusions
This study focuses on evaluating the mechanical properties of concrete containing waste glass as sand replacement. Based on the study findings, the following conclusions can be drawn:
- In terms of density, results showed a slight decrease as the percentage of WGS increased in concrete. The density was decreased by 5% for the specimen with a 75% replacement level compared to the control specimen. Other studies reached the same conclusion regarding the density due to the lighter weight of WGS compared to QS. However, for other types of WGS where the weight of WGS is higher than the replaced sand, the density showed to slightly increase with the increase of replacement level.
- Regarding concrete workability, slump flow results showed a slight increase in the distribution diameter as the replacement percentage of WGS increased, which indicates better workability. Specimen WGS75 showed the best workability among the concrete mixes, which is similar to the findings of other studies that adopted the same replacement level. However, in other studies, it was shown that the shape of glass particles (the presence of sharp edges) could have an adverse effect on workability.
- In terms of material stiffness, results showed that the specimen with 50% waste glass sand showed the highest elasticity modulus among all specimens. The elasticity modulus was shown to increase by 7% for specimen WGS50. However, as the replacement percentage reached 75%, the elasticity modulus showed to decrease by 15% compared to the control specimen. The authors recommend the 50% replacement level for the best material stiffness.
- In terms of compressive strength, results showed that concrete specimens with a WGS replacement level of 50% had the highest compressive strength compared to the control specimen. The compressive strength was increased by 27% for specimen WGS50 compared to specimen WGS0. This was confirmed by other similar studies, which recommended a replacement level between 20–75% for the highest compressive strength. Moreover, UPV results showed the same trend where specimen WGS50 had the highest values compared to other specimens, which indicates higher compressive strength at a 50% replacement level.
- In terms of tensile strength, both split tensile and flexure tests showed that concrete with 50% WGS had the best performance in tension. Split tensile and flexure strengths for specimen WGS50 were 9% and 50% higher than control specimens, respectively. This was confirmed by other studies, which recommended replacement levels between 25% to 75% for the highest tensile and flexure strength.
- In terms of production cost, replacing sand with WGS led to decreasing the production cost by up to 8% for a replacement percentage of 75%. As for the performance/cost (P/C) ratio, it was concluded that as the replacement level of WGS increased, the P/C ratio for compressive, tensile, and flexure strength increased, which means that using WGS as sand replacement is economically feasible. However, the authors recommend a replacement level of 50% since it led to the highest P/C ratios (37% for compressive strength, 16% for split tensile strength, and 60% for flexure strength). This will help in reducing the overall construction cost since high-strength concrete is known for its high production cost
Finally, for future research, the authors recommend studying the effect of using WGS with different shapes (cylindrical, discoidal, spherical, abutting—burr) as sand replacement on the mechanical behavior of concrete. Also, it is worth studying the effect of different grain sizes of WGS on the mechanical performance of concrete.
Author Contributions
Conceptualization, A.J. and J.K.; methodology, A.J. and J.K.; formal analysis, A.J. and R.R.; investigation, A.J. and R.R.; resources, J.K.; data curation, A.J. and R.R; writing—original draft preparation, A.J. and R.R; writing—review and editing, A.J. and J.K.; visualization, J.K.; supervision, J.K.; project administration, J.K. and A.J. All authors have read and agreed to the published version of the manuscript.
Funding
This research received no external funding.
Institutional Review Board Statement
Not applicable.
Informed Consent Statement
Not applicable.
Conflicts of Interest
The authors declare no conflict of interest.
References
- Tamanna, N.; Tuladhar, R.; Sivakugan, N. Performance of recycled waste glass sand as partial replacement of sand in concrete. Constr. Build. Mater. 2020, 239, 117804. [Google Scholar] [CrossRef]
- Ashish, D.K. Feasibility of waste marble powder in concrete as partial substitution of cement and sand amalgam for sustainable growth. J. Build. Eng. 2018, 15, 236–242. [Google Scholar] [CrossRef]
- Małek, M.; Łasica, W.; Jackowski, M.; Kadela, M. Effect of waste glass addition as a replacement for fine aggregate on properties of mortar. Materials 2020, 13, 3189. [Google Scholar] [CrossRef] [PubMed]
- Meddah, M.S. Use of waste window glass as substitute of natural sand in concrete production. IOP Conf. Ser. Mater. Sci. Eng. 2019, 603, 032011. [Google Scholar] [CrossRef]
- Olofinnade, O.M.; Ede, A.N.; Ndambuki, J.M.; Ngene, B.U.; Akinwumi, I.I.; Ofuyatan, O. Strength and microstructure of eco-concrete produced using waste glass as partial and complete replacement for sand. Cogent Eng. 2018, 5, 1483860. [Google Scholar] [CrossRef]
- Kazmi, D.; Williams, D.J.; Serati, M. Waste glass in civil engineering applications—A review. Int. J. Appl. Ceram. Technol. 2020, 17, 529–554. [Google Scholar] [CrossRef]
- Harrison, E.; Berenjian, A.; Seifan, M. Recycling of waste glass as aggregate in cement-based materials. Environ. Sci. Ecotechnol. 2020, 4, 100064. [Google Scholar] [CrossRef]
- Khatib, J.; Jahami, A.; Elkordi, A.; Baalbaki, O. Structural performance of reinforced concrete beams containing plastic waste caps. Mag. Civ. Eng. 2019, 7, 73–79. [Google Scholar]
- Bawab, J.; Khatib, J.; Jahami, A.; Kenai, S.; Elkordi, A. Effect of using cathode-ray tubes (CRT) waste glass on concrete properties. BAU J.-Sci. Technol. 2020, 2, 3. [Google Scholar]
- Ferdous, W.; Manalo, A.; Siddique, R.; Mendis, P.; Zhuge, Y.; Wong, H.S.; Lokuge, W.; Aravinthan, T.; Schubel, P. Recycling of landfill wastes (tyres, plastics and glass) in construction—A review on global waste generation, performance, application and future opportunities. Resour. Conserv. Recycl. 2021, 173, 105745. [Google Scholar] [CrossRef]
- Sawant, V.G. Experimental Investigation of Waste Glass Powder as the Partial Replacement of Sand in Making Concrete. Iconic Res. Eng. J. 2018, 1, 7–9. [Google Scholar]
- Ahmad, J.; Zhou, Z.; Usanova, K.I.; Vatin, N.I.; El-Shorbagy, M.A. A Step towards Concrete with Partial Substitution of Waste Glass (WG) in Concrete: A Review. Materials 2022, 15, 2525. [Google Scholar] [CrossRef] [PubMed]
- Warnphen, H.; Supakata, N.; Kanokkantapong, V. The Reuse of Waste Glass as Aggregate Replacement for Producing Concrete Bricks as an Alternative for Waste Glass Management on Sichang Island. Eng. J. 2019, 23, 43–58. [Google Scholar] [CrossRef]
- Atoyebi, O.D.; Gana, A.J.; Longe, J.E. Strength assessment of concrete with waste glass and bankoro (Morinda Citrifolia) as partial replacement for fine and coarse aggregate. Results Eng. 2020, 6, 100124. [Google Scholar] [CrossRef]
- Tiwari, A.; Singh, S.; Nagar, R. Feasibility assessment for partial replacement of fine aggregate to attain cleaner production perspective in concrete: A review. J. Clean. Prod. 2016, 135, 490–507. [Google Scholar] [CrossRef]
- Collivignarelli, M.C.; Cillari, G.; Ricciardi, P.; Miino, M.C.; Torretta, V.; Rada, E.C.; Abbà, A. The production of sustainable concrete with the use of alternative aggregates: A review. Sustainability 2020, 12, 7903. [Google Scholar] [CrossRef]
- Wang, T.; San Nicolas, R.; Kashani, A.; Ngo, T. Sustainable utilisation of low-grade and contaminated waste glass fines as a partial sand replacement in structural concrete. Case Stud. Constr. Mater. 2022, 16, e00794. [Google Scholar] [CrossRef]
- Khatib, J.M.; Jahami, A.; Elkordi, A.; Abdelgader, H.; Sonebi, M. Structural assessment of reinforced concrete beams incorporating waste plastic straws. Environments 2020, 7, 96. [Google Scholar] [CrossRef]
- Khatib, J.; Jahami, A.; El Kordi, A.; Sonebi, M.; Malek, Z.; Elchamaa, R.; Dakkour, S. Effect of municipal solid waste incineration bottom ash (MSWI-BA) on the structural performance of reinforced concrete (RC) beams. J. Eng. Des. Technol. 2021. [Google Scholar] [CrossRef]
- Soliman, N.A.; Tagnit-Hamou, A. Partial substitution of silica fume with fine glass powder in UHPC: Filling the Micro Gap. Constr. Build. Mater. 2017, 139, 374–383. [Google Scholar] [CrossRef]
- Soliman, N.A.; Tagnit-Hamou, A. Development of ultra-high-performance concrete using glass powder—Towards ecofriendly concrete. Constr. Build. Mater. 2016, 125, 600–612. [Google Scholar] [CrossRef]
- Jiao, Y.; Zhang, Y.; Guo, M.; Zhang, L.; Ning, H.; Liu, S. Mechanical and fracture properties of ultra-high performance concrete (UHPC) containing waste glass sand as partial replacement material. J. Clean. Prod. 2020, 277, 123501. [Google Scholar] [CrossRef]
- Chu, S.H.; Li, L.; Shen, P.L.; Lu, J.X.; Poon, C.S. Recycling of waste glass powder as paste replacement in Green UHPFRC. Constr. Build. Mater. 2022, 316, 125719. [Google Scholar] [CrossRef]
- Salahaddin, S.D.; Haido, J.H.; Wardeh, G. The behavior of UHPC containing recycled glass waste in place of cementitious materials: A comprehensive review. Case Stud. Constr. Mater. 2022, 17, e01494. [Google Scholar] [CrossRef]
- Yoo, D.-Y.; You, I.; Zi, G. Effects of waste liquid–crystal display glass powder and fiber geometry on the mechanical properties of ultra-high-performance concrete. Constr. Build. Mater. 2021, 266, 120938. [Google Scholar] [CrossRef]
- Abellán-García, J. Tensile behavior of recycled-glass-UHPC under direct tensile loading. Case Stud. Constr. Mater. 2022, 17, e01308. [Google Scholar] [CrossRef]
- Kou, S.C.; Xing, F. The effect of recycled glass powder and reject fly ash on the mechanical properties of fibre-reinforced ultrahigh performance concrete. Adv. Mater. Sci. Eng. 2012, 2012, 263243. [Google Scholar] [CrossRef]
- Standard Test Method for Flow of Hydraulic Cement Mortar. Available online: https://www.astm.org/c1437-20.html (accessed on 16 October 2022).
- Standard Test Method for Static Modulus of Elasticity and Poisson’s Ratio of Concrete in Compression. Available online: https://www.astm.org/c0469_c0469m-22.html (accessed on 16 October 2022).
- Standard Test Method for Compressive Strength of Hydraulic Cement Mortars (Using 2-in. or [50-mm] Cube Specimens). Available online: https://www.astm.org/c0109_c0109m-20.html (accessed on 16 October 2022).
- Standard Test Method for Density of Hydraulic Cement. Available online: https://www.astm.org/c0188-17.html (accessed on 16 October 2022).
- Standard Test Method for Flexural Strength of Hydraulic-Cement Mortars. 2021. Available online: https://www.astm.org/c0348-21.html (accessed on 16 October 2022).
- Standard Test Method for Splitting Tensile Strength of Cylindrical Concrete Specimens. Available online: https://www.astm.org/standards/c496 (accessed on 16 October 2022).
- Standard Test Method for Pulse Velocity Through Concrete. 2016. Available online: https://www.astm.org/c0597-16.html (accessed on 16 October 2022).
- Liu, T.; Wei, H.; Zou, D.; Zhou, A.; Jian, H. Utilization of waste cathode ray tube funnel glass for ultra-high performance concrete. J. Clean. Prod. 2020, 249, 119333. [Google Scholar] [CrossRef]
- American Concrete Institute. Building Code Requirements for Structural Concrete (ACI 318-14): An ACI Standard: Commentary on Building Code Requirements for Structural Concrete (ACI 318R-14), an ACI Report; American Concrete Institute: Farmington Hills, MI, USA, 2014. [Google Scholar]
Publisher’s Note: MDPI stays neutral with regard to jurisdictional claims in published maps and institutional affiliations. |
© 2022 by the authors. Licensee MDPI, Basel, Switzerland. This article is an open access article distributed under the terms and conditions of the Creative Commons Attribution (CC BY) license (https://creativecommons.org/licenses/by/4.0/).