Abstract
Building energy efficiency is vital to achieve human thermal comfort with minimum energy consumption. It is a great concern in extremely hot countries such as Oman. This study aims to investigate the thermal performance of contemporary mosque buildings in comparison to traditional mosque buildings in Oman. The research methodology employs energy modelling using EDSL’s Tas Engineering computer simulation software. The analysis focused on how traditional mosque buildings compare to contemporary mosque buildings in terms of dry bulb air temperature and different thermal loads. The outcome showed the traditional mosque building design and construction are better suited for free-running buildings, while contemporary mosque building design and construction achieved less cooling load demand per area.
1. Introduction
Sustainability and energy efficiency have vast global interest due to the continuously increasing pollution and energy consumption. It is not imaginable now to live without electricity and air conditioning. Air conditioning is the most energy demanding use in buildings in most countries, and it is continuing to increase every year [1]. Oman features an extremely hot and arid climate with a maximum temperature recorded of about 50.7 °C and relative humidity that can be very high (100%) in coastal areas and very low (1%) in interior desert areas [2]. The building’s sector consumes about 75% of the total energy consumption in the country according to The Authority of Electricity Regulation in Oman [3]. Air conditioning accounts for most the energy consumed by the building’s sector [4].
This research aims to investigate the thermal performance in buildings in Oman taking a traditional mosque and a contemporary mosque as two case studies. Mosque architecture is unique, but also simple, which makes it an interesting study. Mosque architecture is simple given its shape and layout is typical to mosques in general, but it is unique given its daily intermittent usage. The Sultanate of Oman features both recently built mosques and traditional 600-year-old mosques. It is estimated that there are 16,000 mosques across Oman [5]. Contemporary mosques rely on active cooling systems, while some traditional mosques still feature passive cooling systems. The materials used in the construction of contemporary and traditional mosques are different. The general layout and design, however, has stayed mostly the same between old and new mosques [6]. Improving the energy efficiency of mosques could contribute to much needed reduction of energy consumption. It could also contribute towards energy efficiency of other buildings since any techniques employed in the typical simple design of mosques can be potentially replicated into other buildings.
In 2017, Oman has put forward the 2040 vision. It outlines the 13 top priorities of the country to be achieved by 2040 which are called the “National Priorities”. Two of the National Priorities are the “Sustainable Development in Governorates and cities” and “Natural Resources and Environmental Sustainability” [7]. This research also aims to contribute to both these National Priorities. A more energy efficient mosque building would contribute towards a more sustainable city and environment. Another significance to this research is the fact that electricity is still subsidised for most buildings in Oman as of 2021. This is changing very soon though. On 20 December 2020, it was announced that electricity subsidies will be phased out over a period of five years starting from 2021 in Oman [8]. This will put a greater emphasis on sustainable design and energy efficiency research for all types of buildings in Oman.
Another aspect of this research is the impact of vernacular architecture in building’s thermal comfort and performance. There were several studies conducted to investigate how thermal comfort is achieved in vernacular buildings in Oman. There are features that improved the thermal comfort of old buildings and could potentially apply to new buildings. Compact patterns of settlement and courtyards are two examples from the vernacular architecture in Oman that could improve thermal comfort in buildings [6]. Since Oman’s mass modernisation in 1970, it began to depend on active air conditioning systems, which made buildings built afterwards less efficient. Buildings built before this period were built to achieve thermal comfort using passive means. Passive thermal comfort was achieved by building’s design, orientation, and construction materials [9].
This research focuses more on the thermal performance aspect of mosque buildings in Oman. A building can be considered as a thermal system with thermal energy inputs and outputs. The environment, the building itself, and occupants all contribute to the heat inputs and outputs [10]. The environment in Oman features hot and arid climate. Two of the most significant building thermal performance factors when focusing on hot-arid climate are solar gain and conduction through the building envelope [11].
Taking the surrounding environment into account, state-of-the-art research in energy efficiency indicates that there are many techniques that could be employed to significantly reduce cooling load [12]. Fenestration, building envelope insulation, building material, and thermostat set point are believed to be areas for potential improvement in buildings in hot arid regions [13].
Fenestration can be argued as the weakest element in a building. Controlling the window-to-wall ratio (or glazing ratio) is key to achieve higher building efficiency. A study conducted in mosques in Saudi Arabia concluded that the optimal value for glazing ratio is around 15% overall [14]. It is also recommended to decrease the U-value of the building envelope to limit thermal transmittance into the building. Increasing the thermostat set point also yields considerable savings in cooling loads. As per a study conducted on mosques in Kuwait, an electrical energy saving of 10% was achieved by increasing the thermostat temperature by 1 °C [15]. In another study conducted on government buildings of Oman, it concluded that increasing the set point by 3 °C yielded annual energy savings of at least 13.23% [16].
Research Objective
The research objective is to contribute to the energy efficiency in buildings research. It takes two different mosques as case studies. One is a contemporary mosque (built in 2016), and the other is a traditional mosque (about 400 years old). This will help create a better understanding of the thermal performance status of both new and old mosques.
It is interesting to see the effect of air conditioning in traditional old buildings in comparison with contemporary buildings. A 400-year-old building witnessed generations of usage in addition to continuous renovation and modifications. On the other hand, a recently built mosque is relatively new and is built to the current standard of construction. Comparing the thermal performance of the two mosques could help us understand the areas for improvement in a contemporary building’s thermal performance. It could also help us understand the unique and sustainable features of a vernacular building that do not exist anymore in a modern building today.
Most of the air conditioning consumption in Oman occurs during the summer, when external temperature reaches a maximum of 50 °C. During the winter, dry bulb air temperature varies between different regions of Oman. In Muscat, it ranges between 15 and 30 °C [2]. Most people are comfortable with natural ventilation without the use of air conditioning during the winter.
This research aims to analyse the mosques performance between winter and summer considering internal dry bulb temperature, relative humidity, external dry bulb temperature, and cooling loads. Breakdown of the different loads are also analysed such as solar gain, building heat transfer, and heat conduction gain.
The research attempts to answer the following questions:
- Which type of mosques perform better in Oman (contemporary or traditional)?
- How does building performance change between winter and summer?
- How much cooling load reduction in both cases can be achieved utilizing state-of-the-art passive energy saving techniques?
2. Methodology
A building energy modelling and computer simulation can serve many purposes either for the construction industry or research. It is imperative for all stakeholders involved in the building simulation process to agree on a performance criterion with defined measures. Once the simulation is done, the results can be benchmarked against the performance measures to arrive to a set of recommendations to the stakeholders of the building [17].
There are a wide range of software specialized for thermal comfort such as EDSL’s Tas Engineering, IES VE, Ecotect, EnergyPlus, and Design Builder. The research methodology employed in this research is Tas Engineering software, an energy computer simulation software. Tas Engineering software specializes in simulation of dynamic thermal performance of buildings and their systems. It uses a 3D model and integrates it with natural and forced air flow along with HVAC systems to estimate energy demand and resulting internal temperatures and humidity. It accounts for dynamic parameters such as air flow as well as static parameters such as building material thermal capacity [18]. Tas Engineering software was utilized for this research because it is deemed most suitable for the purposes of this research. It is simple and provide sufficient tools to study the different areas of mosque buildings’ thermal properties [19,20]. It was utilized to study two mosque buildings from two different eras in Oman.
Table 1 shows the details of the two mosques selected for this research. By energy modelling both types of mosques, the comparison could lead to possibilities of using old methods in new buildings to achieve a more sustainable building. Additionally, it could help make recommendations implementable in different types of buildings not restricted to mosques.

Table 1.
A list of mosques for the case study.
2.1. Computer Simulation
The computer simulation process via EDSL’s Tas Engineering software (version 9.5.1, Environmental Design Solutions Ltd, Milton Keynes, United Kingdom) consist of: 3D modelling the building, setting the location and weather data, assignment of construction materials, setting internal gains and conditions, building thermal simulation, and simulation results analysis.
2.2. Calendar
Muscat and Al Wafi’s climate features two seasons throughout the year: summer and winter. For the purposes of this simulation, it was considered that the winter season spanned from 1 November until 28 February, while the rest was considered summer season. The buildings for this simulation were free running during the winter season and air-conditioned during the summer season.
2.3. Weather Data
The weather data for both the Hudhayfah mosque and Al Wafi mosque were Typical Metrological Years (TMY) files in EPW weather format for Muscat International Airport region. The weather data was derived from the period 2004 to 2018 [21].
2.4. Orientation
All mosques are oriented towards the Qiblah (Direction towards the Kabaah), which makes both Hudhayfah and Al Wafi mosques’ orientation towards the west [13].
2.5. Height
Hudhayfah mosque’s prayer hall ceiling height is about 4.2 metres and its Qubba’s (Dome’s) ceiling height reaches 9 metres, while Al Wafi mosque’s prayer hall ceiling height ranges between 3.5 and 6.5 metres since it has an arched roof.
2.6. Age of Building
The Hudhayfah mosque was built in 2015, while the Al Wafi mosque was built in the 1600s. The Al Wafi mosque was renovated several times throughout its history. A major restoration was done in 1989 [22].
2.7. Fenestration
The Hudhayfah mosque uses windows with aluminium frames, while the Al Wafi mosques has windows with timber frames. All windows considered are double-glazed.
2.8. Internal Gains
Air conditioning is used throughout the year except the winter season. Some buildings in Oman have cooling air conditioning active even during the winter [16]. For the purposes of this research, both mosque buildings are considered free running during the winter season (from 1 November until 28 February). During the rest of the calendar the air conditioning is used for cooling only. Mosques are used intermittently, five times a day. The air-conditioning runs for two periods. The first period is from 3 am till 5 am for the fajr prayer. The second period covers four prayer congregation times, which is from 12 pm until 9 pm. Table 2 shows the typical daily prayer times during the day. Each prayer lasts for about 30 min, except for Friday congregational prayer which lasts for about 90 min [23].
Table 2.
Daily prayer times in Muscat, Oman [24].
2.9. Cooling
The Hudhayfah mosque has a DX roof top packaged units for air conditioning, while Al Wafi mosque utilizes a DX split unit system [4]. It is noted that according to a survey conducted most occupants in residential buildings preferred a thermostat setpoint between 20 and 22 °C [25], while the government buildings’ thermostat setpoint is around 22 °C [16]. On the other hand, 24 °C is considered to be the optimal thermostat set point to achieve thermal comfort according to a pilot measurement study in Oman [26]. For the purposes of this simulation, the thermostat setpoint for the air-conditioning system is set for an upper limit of 23 °C and is set for cooling from 1 March to 31 October. The buildings are considered as naturally ventilated for the rest of the year.
Hudhayfah mosque’s DX roof top packaged unit introduces 10% fresh air, while Al Wafi mosque’s DX split unit system does not introduce fresh air. For the purposes of this research, it is assumed that both mosques have 0.5 air changes per hour.
2.10. Climate Conditions of Muscat and Al Wafi
Both Muscat and Al Wafi are classified as hot and dry according to the Köppen–Geiger climate classification. [27]. Muscat is a hot climate city which is located by the coastline of Gulf of Oman. It features long summers and short warm winters [28]. Al Wafi village is located 250 kilometres away from Muscat, which features a similar climate to Muscat. For the purposes of this research, Muscat weather data was input into the simulations of both mosques’ buildings. Figure 1 shows the location of Muscat and Al Wafi. Figure 2 shows mean temperatures and humidity throughout a typical year, while Figure 3 shows a bioclimatic chart for Muscat. Figure 3 shows the bioclimatic chart that most months have ambient air temperature above 30 °C. The green area is the comfort zone area under air conditioning, which makes 20 to 24 thermostat set point reasonably within the comfort zone if humidity is between 30% and 80%.
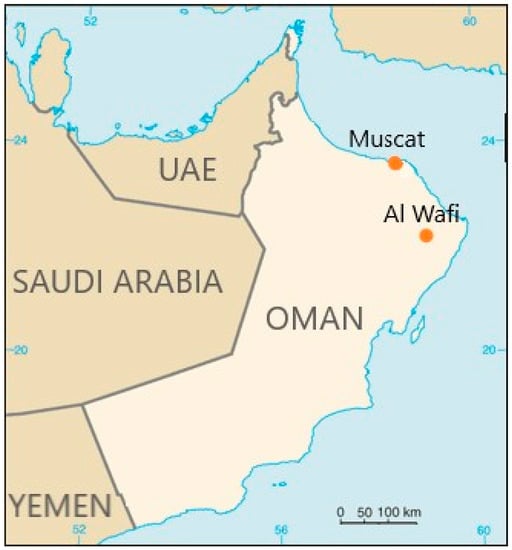
Figure 1.
A map showing the location of Muscat city and Al Wafi village.
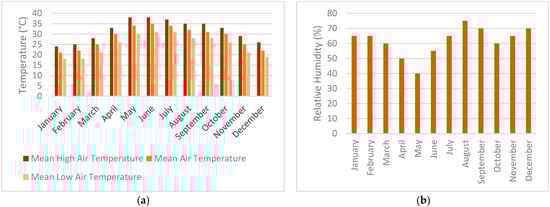
Figure 2.
(a) Mean ambient air temperature in a typical year in Muscat, Oman. (b) Mean relative humidity in a typical year in Muscat, Oman.
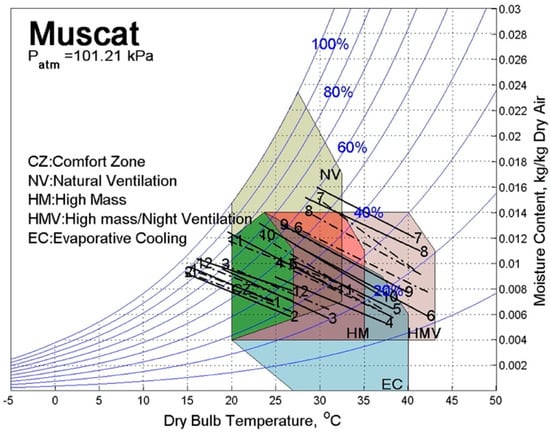
Figure 3.
Bioclimatic chart for Muscat. Solid lines are for months from normal Typical Metrological Years (TMY), while dashed lines are for months from TMY developed for passive cooling [29,30].
3. Design and Construction Details of Hudhayfah and Al Wafi Mosques
3.1. Hudhayfah Mosque
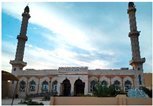
The Hudhayfah bin Al Yaman Mosque was built in 2015 in Muscat, the capital of the Sultanate of Oman. The area is 1120 m2 and fits a maximum of 1100 worshippers. Figure 4 shows the Hudhayfah mosque ground floor plan drawing, and the ground floor plan modelled into the Tas software. Figure 5 and Figure 6 show different 3D views from the Tas software as well as an east elevation view. It can be noticed that the southern wall misses three windows in the Tas model as this is the case in built mosque. The Tas model shows the mihrab (the semi-circular niche in the mosque’s western wall indicating the direction of the qibla) in the western wall as a square shape instead of a semi-circular shape to simplify the model [13]. Table 3 lists the construction details of the Hudhayfah mosque’s building elements. It features a typical construction detail found in most recent buildings in Oman. A typical window size in Hudhayfah mosque is 1.9 metres by 2.54 metres, while a typical door is 2.4 metres wide by 3 metres high.
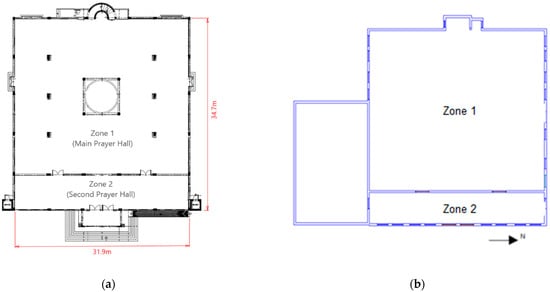
Figure 4.
(a) Ground floor plan of Hudhayfah Mosque; (b) ground floor plan of Hudhayfah Mosque as shown in Tas software showing the two zones.
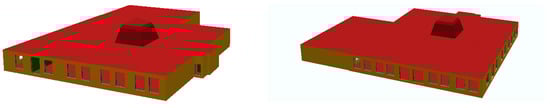
Figure 5.
Three-dimensional (3D) views of Hudhayfah mosque.

Figure 6.
East elevation view of Hudhayfah mosque. The Qubba’s (Dome’s) maximum height is 9 metres, while the main prayer hall’s height is 4.2 metres.
Table 3.
Construction details of Hudhayfah mosque.
3.2. Al Wafi Mosque
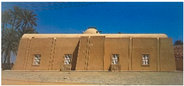
Al Wafi Mosque is in Al Kamil and Al Wafi, about 250 km away from Muscat, Oman. It was built in 1600s [31], and renovated in 1989, and since then there were minor restorations to the Mosque up till date. The walls vary between 500 and 1000 millimetres in thickness [22]. It is important to mention that this simulation of Al Wafi Mosque is as per its condition in 2015. The courtyard (Zone 3) was recently closed completely, but it was considered as a naturally ventilated open courtyard in the simulations. Figure 7, Figure 8 and Figure 9 shows Al Wafi mosques design in plans, sections, and 3D views. A typical window size is 0.7 metre by 1 metre, while a typical door is 1.2 metres width by 1.8 metres height.
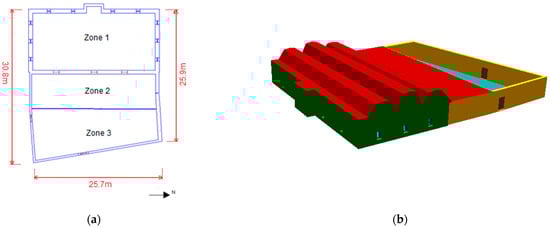
Figure 7.
(a) Al Wafi Mosque floor plan showing zones in Tas (Reproduced from [22]); (b) 3D view of Al Wafi Mosque.
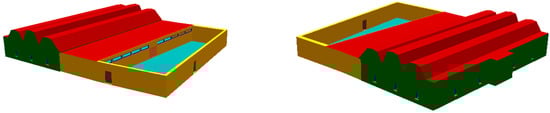
Figure 8.
Three-dimensional (3D) views of Al Wafi Mosque.

Figure 9.
North elevation of Al Wafi Mosque.
The construction details are shown in the Table 4 featuring clay as the main material in the building. It is common in the region for such clay walls to have a density of about 1730 kg/m3 [32]. ASHRAE 2009 handbook states that clay or adobe walls can have a conductivity that range between 0.7 to 0.85 W/m·K. for a 1730–1800 kg/m3 dense clay walls [33]. Al Wafi mosque walls decrease in thickness as it increases in height, and the thickness varies from a wall to another. This means U-values are different at any given point across all the walls and roof of Al Wafi mosque. For the purposes of this research, it can be estimated that the walls of Al Wafi Mosque (mean thickness of 1 metre) can have a U-value of 0.7 W/m2·K. The roof (mean thickness of 0.7 metre) is estimated to have a U-value of 1.1 W/m2·K.
Table 4.
Construction details of Al Wafi mosque.
4. Results and Discussion
The results in this section present data from Hudhayfah and Al Wafi mosques’ simulations. Both mosques’ simulation results are split into winter and summer results. The winter results and summer results presented are for the winter design day in Muscat, day 20, and the summer design day in Muscat, day 179, respectively. The presented results compare between the external dry bulb temperature (DBT), internal DBT, and loads breakdown of the different zones in each mosque.
4.1. Hudhayfah Mosque Winter Simulation Results
Hudhayfah mosque Zone 2′s DBT is higher than Zone 1′s DBT throughout day 20. Figure 10 shows the external DBT during the coldest day of the year, day 20, along with the DBT inside the mosque. Both zones maintain a higher DBT than external temperature throughout the day. Zone 2′s temperature is consistently higher than Zone 1 throughout the day by at least 2 °C at 07:00 and reaches to a difference of up to 6 °C at 14:00. It is also evident that Zone 2′s DBT fluctuates throughout the day similar to external DBT. Zone 2 DBT increases from 26 °C at 07:00 to 30 °C at 14:00, while Zone 1 stays within one degree Celsius from 23 °C.
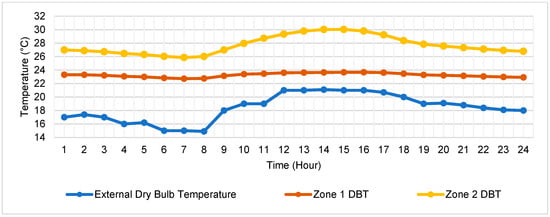
Figure 10.
External dry bulb temperature and internal dry bulb temperatures in Hudhayfah Mosque by the hour during day 20 (Winter).
Zone 2′s higher DBT could be attributed to higher solar gain. Figure 11 shows the breakdown of the most influential loads for Zones 1 and 2. The main contributing factor for heat gain and heat loss for both zones are solar gain and external opaque conduction, respectively. Solar gain starts to increase by 07:00, reaches its peak at 11:00, and gradually decreases to zero by sunset. Most of the heat gain during this period is lost via external opaque conduction. Zone 2 is affected more by solar gain, hence the increase in DBT through the day, while Zone 1 keeps a steady DBT through day and night at 23 degrees Celsius. Zone 2 has a higher glazing ratio in external walls of 59% compared to 27.5% for Zone 1. Most of Zone 2 windows are in the eastern wall, which is exposed to direct sunlight, hence a higher solar gain.
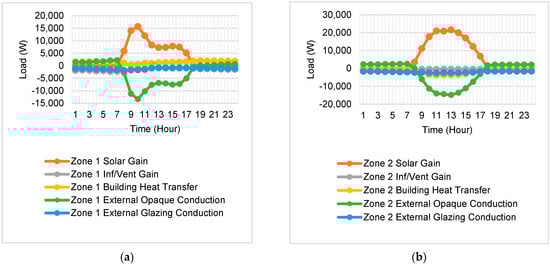
Figure 11.
(a) Loads breakdown in Hudhayfah mosque (Zone 1) during day 20 (winter); (b) loads breakdown in Hudhayfah mosque (Zone 2) during day 20 (winter).
4.2. Hudhayfah Mosque Summer Simulation Results
Unlike summer, during winter both zones of Hudhayfah mosque have a very similar DBT throughout day 179. Figure 12a shows the external DBT during the summer design day, day 179, compared to the internal DBT inside the mosque and the cooling load required, respectively. The external DBT reaches 44.8 C. Both zones reach the setpoint temperature during the two periods as per the schedule (3 am to 5 am, and 12 pm to 9 pm). The cooling system start and ends at the times mentioned, which means that the system turns off every day at 5 a.m. and 9 p.m.
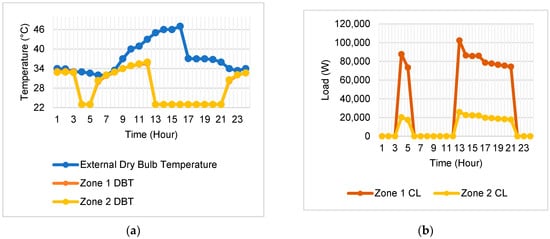
Figure 12.
(a) External dry bulb temperature versus internal dry bulb temperature in summer in Hudhayfah mosque during day 179; (b) cooling load (CL) during summer in Hudhayfah mosque by the hour during day 179.
Zone 2 peak cooling load is about 25,864 Watts while Zone 1 peak cooling load is 102,406 Watts although both spaces have the same thermostat setpoint of 23 °C as shown in Figure 12b. Zone 2′s smaller area, 174 m2, compared to Zone 1′s area of 906 m2, could be one of the factors for the high difference in cooling load demand between the two zones [10]. From 5:00 to 12:00 the air conditioning system does not operate, and the external DBT increases by 10 degrees during this period from 33 to 43 °C. Hence, the internal DBT manages to increase from 23 °C at 5:00 to 35.6 °C at 12:00 before the air conditioning system starts again for the second period.
Figure 13 shows the loads breakdown for Zones 1 and 2 during summer. Sensible loads shown are for the active cooling load by the air conditioning system during the two occupancy periods. External opaque conduction contributes to heat gain as a counter to the sensible load during the occupancy periods. Between 5:00 and 12:00 when the mosque is not occupied, solar gain is the main factor to heat gain. In contrast to the winter, Zone 1 has more solar gain than Zone 2 when it is free running. This could be attributed to the different solar orientation and the longer periods of exposure to solar irradiance in summer compared to winter.
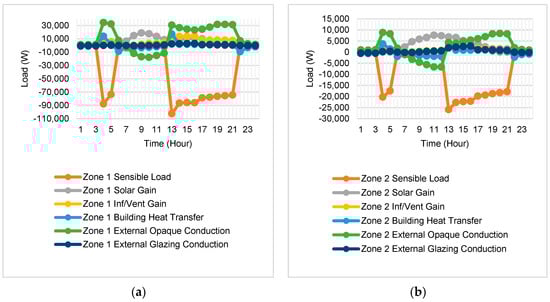
Figure 13.
(a) Loads breakdown in Hudhayfah mosque (Zone 1) during day 179 (summer); (b) loads breakdown in Hudhayfah mosque (Zone 2) during day 179 (summer).
4.3. Al Wafi Mosque Winter Simulation Results
Unlike the Hudhayfah mosque, Zone 1 and 2 of Al Wafi mosque had similar DBT throughout the winter design day. Figure 14 shows the external DBT during the coldest day of the year, day 20, along with the internal DBT. The simulation is free running during the winter. Zone 1 maintains a steady DBT throughout the day closer to 23 °C, while Zone 2 fluctuates between 22 and 25 °C. Zone 2 has the entire eastern wall as an aluminium partition wall with windows throughout the whole top part of the wall. Zone 3 is an exposed area, and that is why its DBT is very similar to external DBT. See the layout of Al Wafi mosque in Figure 7.
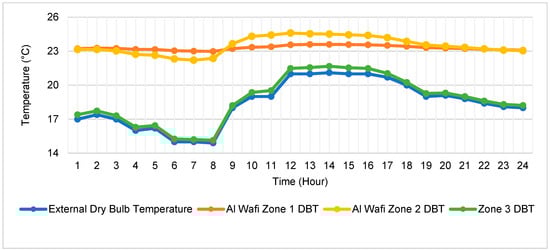
Figure 14.
External DBT vs. Al Wafi DBT in winter by the hour during day 20.
Loads breakdown are shown for Zones 1 and 2 in Figure 15. Both zones gain heat through external opaque conduction during night-time although external DBT is lower than internal DBT (reaches a difference of up to 8 degrees Celsius). The buildings are believed to gain heat via the heat absorbed into the thermal mass. Al Wafi mosque’s clay walls have relatively similar heat capacity and density as Hudhayfah’s concrete walls. Al Wafi mosque, though, features clay walls (up to 1.2 metres thick) almost three times the thickness of Hudhayfah concrete walls (0.375 metres thick). Al Wafi external walls feature significantly higher time constant as per Table 3 and Table 4. Consequently, it is reflected into Al Wafi’s clay wall to have a continuous high external opaque conduction load throughout winter nights and mornings.
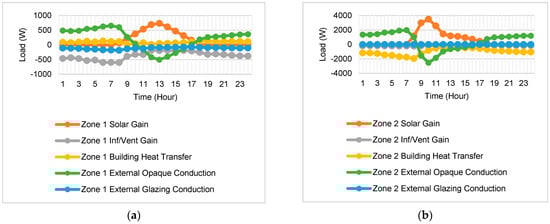
Figure 15.
(a) Loads breakdown in Al Wafi mosque (Zone 1) during day 20 (winter); (b) loads breakdown in Al Wafi mosque (Zone 2) during day 20 (winter).
Solar gain reaches a peak of 735 Watts for Zone 1 at 13:00, while the peak of Zone 2 is 3502 Watts, which happens at 10:00. Zone 2 has a glazing ratio of 10% compared to Zone 1′s glazing ratio of 4.2%. The higher solar gain for Zone 2 could be attributed to the orientation of Zone 2′s glazed wall to the east, which is exposed directly to sunlight between 9:00 and 12:00.
4.4. Al Wafi Mosque Summer Simulation Results
Figure 16 shows Al Wafi mosque’s external DBT during the hottest day of the year, day 179, compared to the cooling load required. The external DBT reaches 44.8 °C. The thermostat set point is set at 23 °C, and that is why Zones 1 and 2 reach this temperature during the two air-conditioning periods as per the schedule (3 am to 5 am, and 12 pm to 9 pm). Unlike Hudhayfah mosque’s summer case, Al Wafi mosques’ two zones react differently during the unoccupied period from 5:00 to 12:00. Al Wafi Zone 1 increases its DBT by 10 °C while Zone 2 increases by 16 °C from the thermostat setpoint temperature (23 °C).
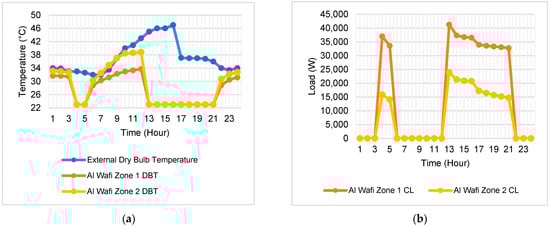
Figure 16.
(a) External DBT vs. DBT in summer in Al Wafi Mosque during day 179; (b) external DBT vs. CL in summer in Al Wafi Mosque during day 179.
Figure 17 shows the loads breakdown for Al Wafi mosque during summer for Zone 1 and Zone 2, respectively. As the space is air conditioned, the higher difference between internal and external DBT means an increasing external conduction gain through the building envelope.
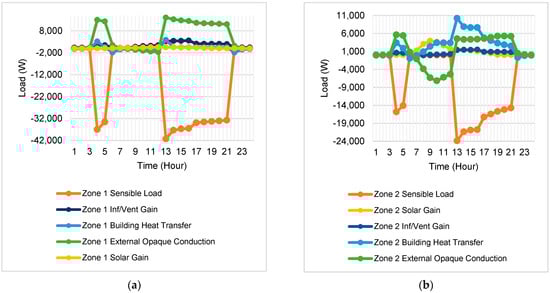
Figure 17.
(a) Loads breakdown in Al Wafi mosque (Zone 1) during day 179 (summer); (b) loads breakdown in Al Wafi mosque (Zone 2) during day 179 (summer).
It was noticed that Zone 2 is more affected by solar gain than Zone 1. This is due to the incidence of sunlight that directly affects the east and west walls during the summer. Zone 2′s east wall is mostly exposed to sunlight between 7:00 and 12:00 and has a glazing ratio of 13.65%. Zone 1′s west wall is exposed to sunlight between 12:00 and 19:00, and it has a glazing ratio of 3.86% in the west wall. Hence, Zone 1 is less affect by solar gain than Zone 2. Building heat transfer also impacts Zone 2 more than Zone due to the building envelope of both zones. The walls of the mosque are all thick clay walls that varies between 500 and 1200 mm, except for the east wall of Zone 2 which is 15-milimetre aluminium partition wall. This wall was added during the 2000s to close Zone 2, which was previously a Riwaq (an arcade). Zone 2 east wall would allow more heat to be transferred from than other walls due to its higher U-value of 7.27 W/m2·K compared to 0.7 W/m2·K U-value for clay wall.
4.5. Comparison between Hudhayfah and Al Wafi Mosques
Figure 18a shows the DBT of both Hudhayfah and Al Wafi mosques’ Zone 1 compared to the external DBT in winter. Both Mosques appear to maintain their internal DBT similarly in a free running building setting.
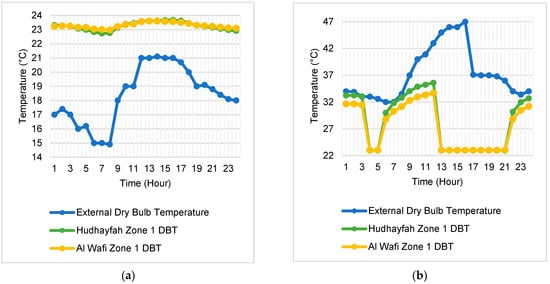
Figure 18.
(a) Comparison between Hudhayfah and Al Wafi mosque’s Zone 1 dry bulb temperatures during Day 20 (Winter); (b) Comparison between Hudhayfah and Al Wafi mosque’s Zone 1 dry bulb temperatures during Day 179 (Summer).
Figure 18b shows the same, but in summer. Hudhayfah appears to be affected slightly more by the rise of external DBT, which can be attributed to the different in U-value of the two mosques’ building envelope. Hudhayfah mosque’s walls, which consist of a 350 mm thick concrete brick wall with 50 mm thick polyurethane thermal insulation board, have a lower U-value of 0.4 W/m2·K compared to a U-value of 0.7 W/m2·K for Al Wafi mosque’s clay walls. Al Wafi mosque’s Zone 1 external walls have a glazing ratio of just 4.2% compared to a 27.5% glazing ratio for Hudhayfah Zone 1′s external walls.
Figure 19 and Figure 20 show the cooling load in each of the mosques is different. Total cooling load is higher for Hudhayfah mosque’s Zone 1 given its larger area (See Table 1 for areas of each zone). On the other hand, the cooling load per area and the cooling load per volume are the lowest for Hudhayfah mosque’s Zone 1. It is also observed that cooling load per area and per volume are substantially higher for Zone 2 of both mosques.
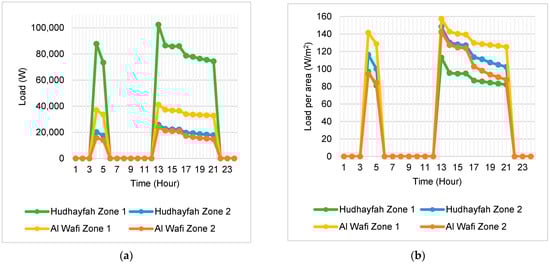
Figure 19.
(a) Comparison between Hudhayfah and Al Wafi mosque’s total cooling loads across Zones 1 and 2 for both mosques during day 179 (Summer); (b) comparison between Hudhayfah and Al Wafi mosque’s cooling loads per area across Zones 1 and 2 for both mosques during day 179 (Summer).
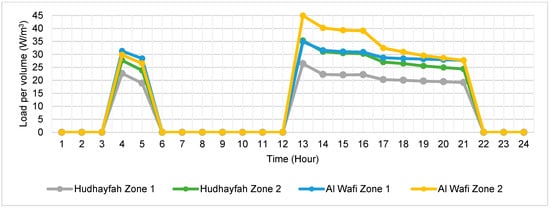
Figure 20.
Comparison between Hudhayfah and Al Wafi mosques’ cooling loads per volume across Zones 1 and 2 for both mosques during day 179 (Summer).
It could also prove that traditional mosques achieve better performance for passive cooling, while contemporary mosques achieve better performance for active cooling. It is evident that Al Wafi mosque requires the most cooling load per area and per volume as per Figure 19b and Figure 20, respectively.
4.6. Validation of Simulated Model
The simulated data was validated using measured energy consumption from electricity bills of both mosques. Cooling load from the simulated data was compared to the air conditioning energy consumption. According to ASHRAE Guideline 14–2014, the accuracy of a simulation can be checked using normalized mean bias error (NMBE) and coefficient of variance of the root mean squared error (CV RMSE) [34,35].
= measured data
= simulated data
= number of data points
= number of adjustable model parameters
= mean of measured data
According to ASHRAE Guideline 14–2014, the acceptable range of tolerances are 5% and 15% for NMBE and CV RMSE, respectively, which both buildings meet as shown in Table 5 [34].
Table 5.
NMBE and CV RMSE calibration values for Hudhayfah and Al Wafi mosques.
4.7. Application of Different Improvements to the Buildings and Its Effect on Cooling Load
There are many enhancements that can be done to improve a building’s thermal performance. In this section, several improvements were applied to both Hudhayfah Mosque and Al Wafi mosque. Zones 1 of both mosques are subsequently compared with the seven different improved cases. Zone 1 was chosen for the comparisons as it is the main prayer hall where prayer is performed, whereas Zone 2 in both mosques is used mainly as a foyer to Zone 1.
Fenestration, building envelope insulation, building material, and thermostat set point are believed to be areas for potential improvement in buildings in hot arid regions [13,36]. Fenestration can be argued as the weakest element in a building. Controlling the window-to-wall ration (or glazing ratio) is key to achieve higher building efficiency. A study conducted in mosques in Saudi Arabia concluded that the optimal value for glazing ratio is around 15% overall [14]. To see the effect of the glazing ratio on both Hudhayfah and Al Wafi mosques, the value will be halved and doubled as can be seen in 1st and 2nd cases, respectively, of Table 6 and Table 7.
Table 6.
Application of improvement cases into Hudhayfah Mosque simulation model.
Table 7.
Application of improvement cases into Al Wafi Mosque simulation model.
It is also recommended to decrease the U-value of the building envelope to limit thermal transmittance into the building [10]. The 3rd and 4th cases represent cases of halving the U-value of the roof and walls, respectively, in Table 6 and Table 7. The 5th case is an experiment to exchange between the concrete and mud wall and vice-versa for Hudhayfah and Al Wafi mosques.
Increasing the thermostat set point also yields considerable savings in cooling loads. As per a study conducted on mosques in Kuwait, an electrical energy saving of 10% was achieved by increasing the thermostat temperature by 1 °C [15]. In another study conducted on government buildings of Oman, it concluded that increasing the set point by 3 °C yielded annual energy savings of 13.23% [16]. The thermostat set point is increased by 1 and 2 °C in the 6th and 7th cases, respectively.
As per Table 6, it is evident that the insulating the roof and increasing the setpoint by 2 °C yielded cooling load savings of −7% and −6% respectively. When changing the building walls and roof from concrete to mud wall, cooling load increased by 7%.
As per Table 7, it is evident that increasing the setpoint by 1 and 2 °C yielded cooling load savings of −5% and −9% respectively. When changing the building walls and roof from clay wall to concrete, cooling load demand increased by 13%.
5. Research Limitations
- All charts indicate spot results at 60 min intervals. Values in between the 60 min intervals are not calculated.
- This research focused more on comparing the thermal performance of the buildings rather than the thermal comfort of occupants and indoor air quality of each building.
- Occupancy, lighting, and equipment gains are assumed at the same rate per square metres for both mosques.
6. Conclusions
Human thermal comfort depends on the surrounding environment, the built environment, or the human body itself. The research focused on the built environment performance in a case of two different mosques. The research methodology employed was a building thermal simulation software, Tas Engineering, which analysed both mosques’ building thermal performance. This was an interesting research to conduct given that one mosque is a traditional mosque built in the 1600s and the other is a contemporary mosque built in 2015. They have different construction and environmental characteristics, but mosques buildings in general are simple and similar in design.
The research aim is to compare between traditional and contemporary mosques’ thermal performance. The comparison between Hudhayfah and Al Wafi mosque indicate Al Wafi mosque has more consistent DBT in a free running mode during winter, and lower DBT when air conditioning is not operating during summer. Hence, it can be implied that Al Wafi mosque’s building has a better thermal performance in free running mode. Hudhayfah mosque building, on the other hand, showed less cooling load demand per area, which indicate a better thermal performance in air conditioning mode than Al Wafi mosque building.
The results of the energy modelling simulations show that buildings are controlled by a set number of parameters that need to be studied collectively to achieve optimal thermal efficiency in buildings. Recent literature has shown that there are a number of improvements that can be made to the building by altering or changing the building’s design, orientation, materials, fenestration, building envelope insulation, and thermostat set point. Seven more simulations were conducted with different improvements in each case to the validated base model of each mosque. Hudhayfah and Al Wafi mosques have seen cooling load savings of up to 6% and 9%, respectively, by increasing the thermostat set point by 2 °C. Insulating the roof also yielded a substantial cooling load saving of up to 7% and 4%, respectively. On the other hand, when exchanging the building envelope material between both mosques by using clay roof and wall in Hudhayfah mosque and using concrete roof and walls in Al Wafi, it yielded in an increase in cooling loads of 7% and 13%, respectively. This could mean that traditional mosques were designed to be passively cooled, while contemporary mosques were designed to be actively cooled.
Author Contributions
Conceptualization, M.G. and H.A.R.; methodology, M.G. and H.A.R.; software, H.A.R.; validation, H.A.R.; formal analysis, H.A.R.; investigation, H.A.R.; resources, H.A.R.; data curation, H.A.R.; writing—original draft preparation, H.A.R.; writing—review and editing, M.G. and H.A.R.; visualization, H.A.R.; supervision, M.G.; project administration, H.A.R.; funding acquisition, H.A.R. All authors have read and agreed to the published version of the manuscript.
Funding
This research received no external funding.
Data Availability Statement
The data that support the findings of this study are available from the corresponding author, H.A.R., upon reasonable request.
Conflicts of Interest
The authors declare no conflict of interest.
Abbreviations
| AC | Air Conditioning | |
| CL | Cooling Load | (Watts) |
| DBT | Dry Bulb Temperature | (°C) |
| DX System | Direct Expansion System | |
| EPW | EnergyPlus Weather File | |
| IES VE | Integrated Environmental Solutions | |
| Inf/Vent Gain | Infiltration/Ventilation heat gain | (Watts) |
| Tas | Thermal Analysis Software | |
| TMY | Typical Metrological Years |
References
- Chua, K.J.; Chou, S.K.; Yang, W.M.; Yan, J. Achieving Better Energy-Efficient Air Conditioning—A Review of Technologies and Strategies. Appl. Energy 2013, 104, 87–104. [Google Scholar] [CrossRef]
- NCSI Oman. NCSI Statistical Book 2018; National Center of Statistics and Information: Muscat, Oman, 2018. [Google Scholar]
- The Authority for Electricity Regulation. Annual Report 2019 of the Authority for Electricity Regulation; The Authority for Electricity Regulation: Muscat, Oman, 2019. [Google Scholar]
- Krarti, M.; Dubey, K. Energy Productivity Evaluation of Large Scale Building Energy Efficiency Programs for Oman. Sustain. Cities Soc. 2017, 29, 12–22. [Google Scholar] [CrossRef]
- More than 16,000 Registered Mosques in Oman—Times Of Oman. Available online: https://timesofoman.com/article/129121/oman/more-than-16000-registered-mosques-in-the-sultanate (accessed on 10 August 2020).
- Taylor, T.; Nikolopoulou, M.; Mahdjoubi, L.; Cullen, N. Vernacular Architecture and Contemporary design in Oman: Challenges in a Changing Climate. In Proceedings of the Detail Design in Architecture, Translating Sustainable Design into Sustainable Construction, Cardiff, UK, 4 September 2009. [Google Scholar]
- Oman Vision 2040. Available online: https://www.2040.om/en/national-priorities/ (accessed on 7 August 2020).
- Oman to Gradually Phase out Water, Electricity Subsidies. Available online: https://www.omanobserver.om/oman-to-gradually-phase-out-water-electricity-subsidies/ (accessed on 20 December 2020).
- Al-Hinai, H.; Batty, W.J.; Probert, S.D. Vernacular Architecture of Oman: Features That Enhance Thermal Comfort Achieved within Buildings. Appl. Energy 1993, 44. [Google Scholar] [CrossRef]
- Szokolay, S.V. Introduction to Architectural Science: The Basis of Sustainable Design; Elsevier/Architectural Press: Amsterdam, The Netherlands, 2008; ISBN 0750687045. [Google Scholar]
- Silva, A.S.; Ghisi, E. Estimating the Sensitivity of Design Variables in the Thermal and Energy Performance of Buildings through a Systematic Procedure. J. Clean. Prod. 2020, 244. [Google Scholar] [CrossRef]
- Cao, X.; Dai, X.; Liu, J. Building Energy-Consumption Status Worldwide and the State-of-the-Art Technologies for Zero-Energy Buildings during the Past Decade. Energy Build. 2016, 128, 198–213. [Google Scholar] [CrossRef]
- Azmi, N.A.; Ibrahim, S.H. A Comprehensive Review on Thermal Performance and Envelope Thermal Design of Mosque Buildings. Build. Environ. 2020, 185, 107305. [Google Scholar] [CrossRef]
- Al-Homoud, M.S. Envelope Thermal Design Optimization of Buildings with Intermittent Occupancy. J. Build. Phys. 2009, 33, 65–82. [Google Scholar] [CrossRef]
- Al-ajmi, F.F.; Loveday, D.L. Indoor Thermal Conditions and Thermal Comfort in Air-Conditioned Domestic Buildings in the Dry-Desert Climate of Kuwait. Build. Environ. 2010, 45, 704–710. [Google Scholar] [CrossRef]
- Al-Saadi, S.N.J.; Ramaswamy, M.; Al-Rashdi, H.; Al-Mamari, M.; Al-Abri, M. Energy Management Strategies for a Governmental Building in Oman. Energy Procedia 2017, 141, 206–210. [Google Scholar] [CrossRef]
- Hensen, J.L.M.; Lamberts, R. Building Performance Simulation for Design and Operation; Routledge: Florence, Italy, 2011; ISBN 9780415474146. [Google Scholar]
- Crawley, D.B.; Hand, J.W.; Kummert, M.; Griffith, B.T. Contrasting the Capabilities of Building Energy Performance Simulation Programs. Build. Environ. 2008, 43, 661–673. [Google Scholar] [CrossRef] [Green Version]
- EDSL Thermal Analysis Software TAS. (V9.5.1). 2020. Available online: https://www.edsltas.com/tas-engineering/ (accessed on 17 July 2021).
- Rotimi, A.; Bahadori-Jahromi, A.; Mylona, A.; Godfrey, P.; Cook, D. Estimation and Validation of Energy Consumption in UK Existing Hotel Building Using Dynamic Simulation Software. Sustainability 2017, 9, 1391. [Google Scholar] [CrossRef] [Green Version]
- Climate.OneBuilding.Org Climate/Weather Data Sources. Available online: http://climate.onebuilding.org/sources/default.html (accessed on 8 December 2020).
- Biancifiori, M.A. Biancifiori: Works of Architectural Restoration in Oman; De Luca Editori d’Arte: Rome, Italy, 1994; ISBN 8880160370. [Google Scholar]
- Azmi, N.A.; Arıcı, M.; Baharun, A. A Review on the Factors Influencing Energy Efficiency of Mosque Buildings. J. Clean. Prod. 2021, 126010. [Google Scholar] [CrossRef]
- Ministry of Endowments and Religious Affairs. Available online: https://www.mara.gov.om/arabic/calendar_page2.asp (accessed on 25 June 2021).
- Majid, N.H.A.; Takagi, N.; Hokoi, S.; Ekasiwi, S.N.N.; Uno, T. Field Survey of Air Conditioner Temperature Settings in a Hot, Dry Climate (Oman). HVAC R Res. 2014, 20, 751–759. [Google Scholar] [CrossRef] [Green Version]
- Al-Saadi, S.N.; Shaaban, A.K. Zero Energy Building (ZEB) in a Cooling Dominated Climate of Oman: Design and Energy Performance Analysis. Renew. Sustain. Energy Rev. 2019, 112, 299–316. [Google Scholar] [CrossRef]
- Grieser, J.; Gommes, R.; Stephen, C.; Bernardi, M. New Gridded Maps of Koeppen’s Climate Classification. Available online: http://www.fao.org/nr/climpag/globgrids/KC_classification_en.asp (accessed on 5 May 2020).
- Peel, M.C.; Finlayson, B.L.; Mcmahon, T.A. Hydrology and Earth System Sciences Updated World Map of the Köppen-Geiger Climate Classification. Hydrol. Earth Syst. Sci 2007, 11, 1633–1644. [Google Scholar] [CrossRef] [Green Version]
- Al-Azri, N.A. Development of a Typical Meteorological Year Based on Dry Bulb Temperature and Dew Point for Passive Cooling Applications. Energy Sustain. Dev. 2016, 33, 61–74. [Google Scholar] [CrossRef]
- Givoni, B. Comfort, Climate Analysis and Building Design Guidelines. Energy Build. 1992, 18, 11–23. [Google Scholar] [CrossRef]
- Ministry of Information Ministry of Information’s Website. Available online: https://www.omaninfo.om/mainsections/63 (accessed on 5 May 2020).
- Sayigh, A.; Hamid Marafia, A. Chapter 2—Vernacular and Contemporary Buildings in Qatar. Renew. Sustain. Energy Rev. 1998, 2, 25–37. [Google Scholar] [CrossRef]
- ASHRAE. 2009 ASHRAE Handbook Heat, Air, and Moisture Control in Building Assemblies-Material Properties; The American Society of Heating, Refrigerating and Air-Conditioning Engineers: Atlanta, GA, USA, 2009. [Google Scholar]
- ASHRAE. ASHRAE Guideline 14-2014: Measurement of Energy, Demand, and Water Savings; The American Society of Heating, Refrigerating and Air-Conditioning Engineers: Atlanta, GA, USA, 2014. [Google Scholar]
- Li, W.; Tian, Z.; Lu, Y.; Fu, F. Stepwise Calibration for Residential Building Thermal Performance Model Using Hourly Heat Consumption Data. Energy Build. 2018, 181, 10–25. [Google Scholar] [CrossRef]
- Alaboud, M.; Gadi, M. Indoor Environmental Monitoring of Residential Buildings in Saudi Arabia, Makkah: A Case Study. In Proceedings of the IOP Conference Series: Materials Science and Engineering; IOP Publishing: Bari, Italy, 2019. [Google Scholar]
Publisher’s Note: MDPI stays neutral with regard to jurisdictional claims in published maps and institutional affiliations. |
© 2021 by the authors. Licensee MDPI, Basel, Switzerland. This article is an open access article distributed under the terms and conditions of the Creative Commons Attribution (CC BY) license (https://creativecommons.org/licenses/by/4.0/).