
Improvement Proposal of Bottom-Up Approach for the Energy Characterization of Buildings in the Tropical Climate


Abstract
1. Introduction
2. Methodology
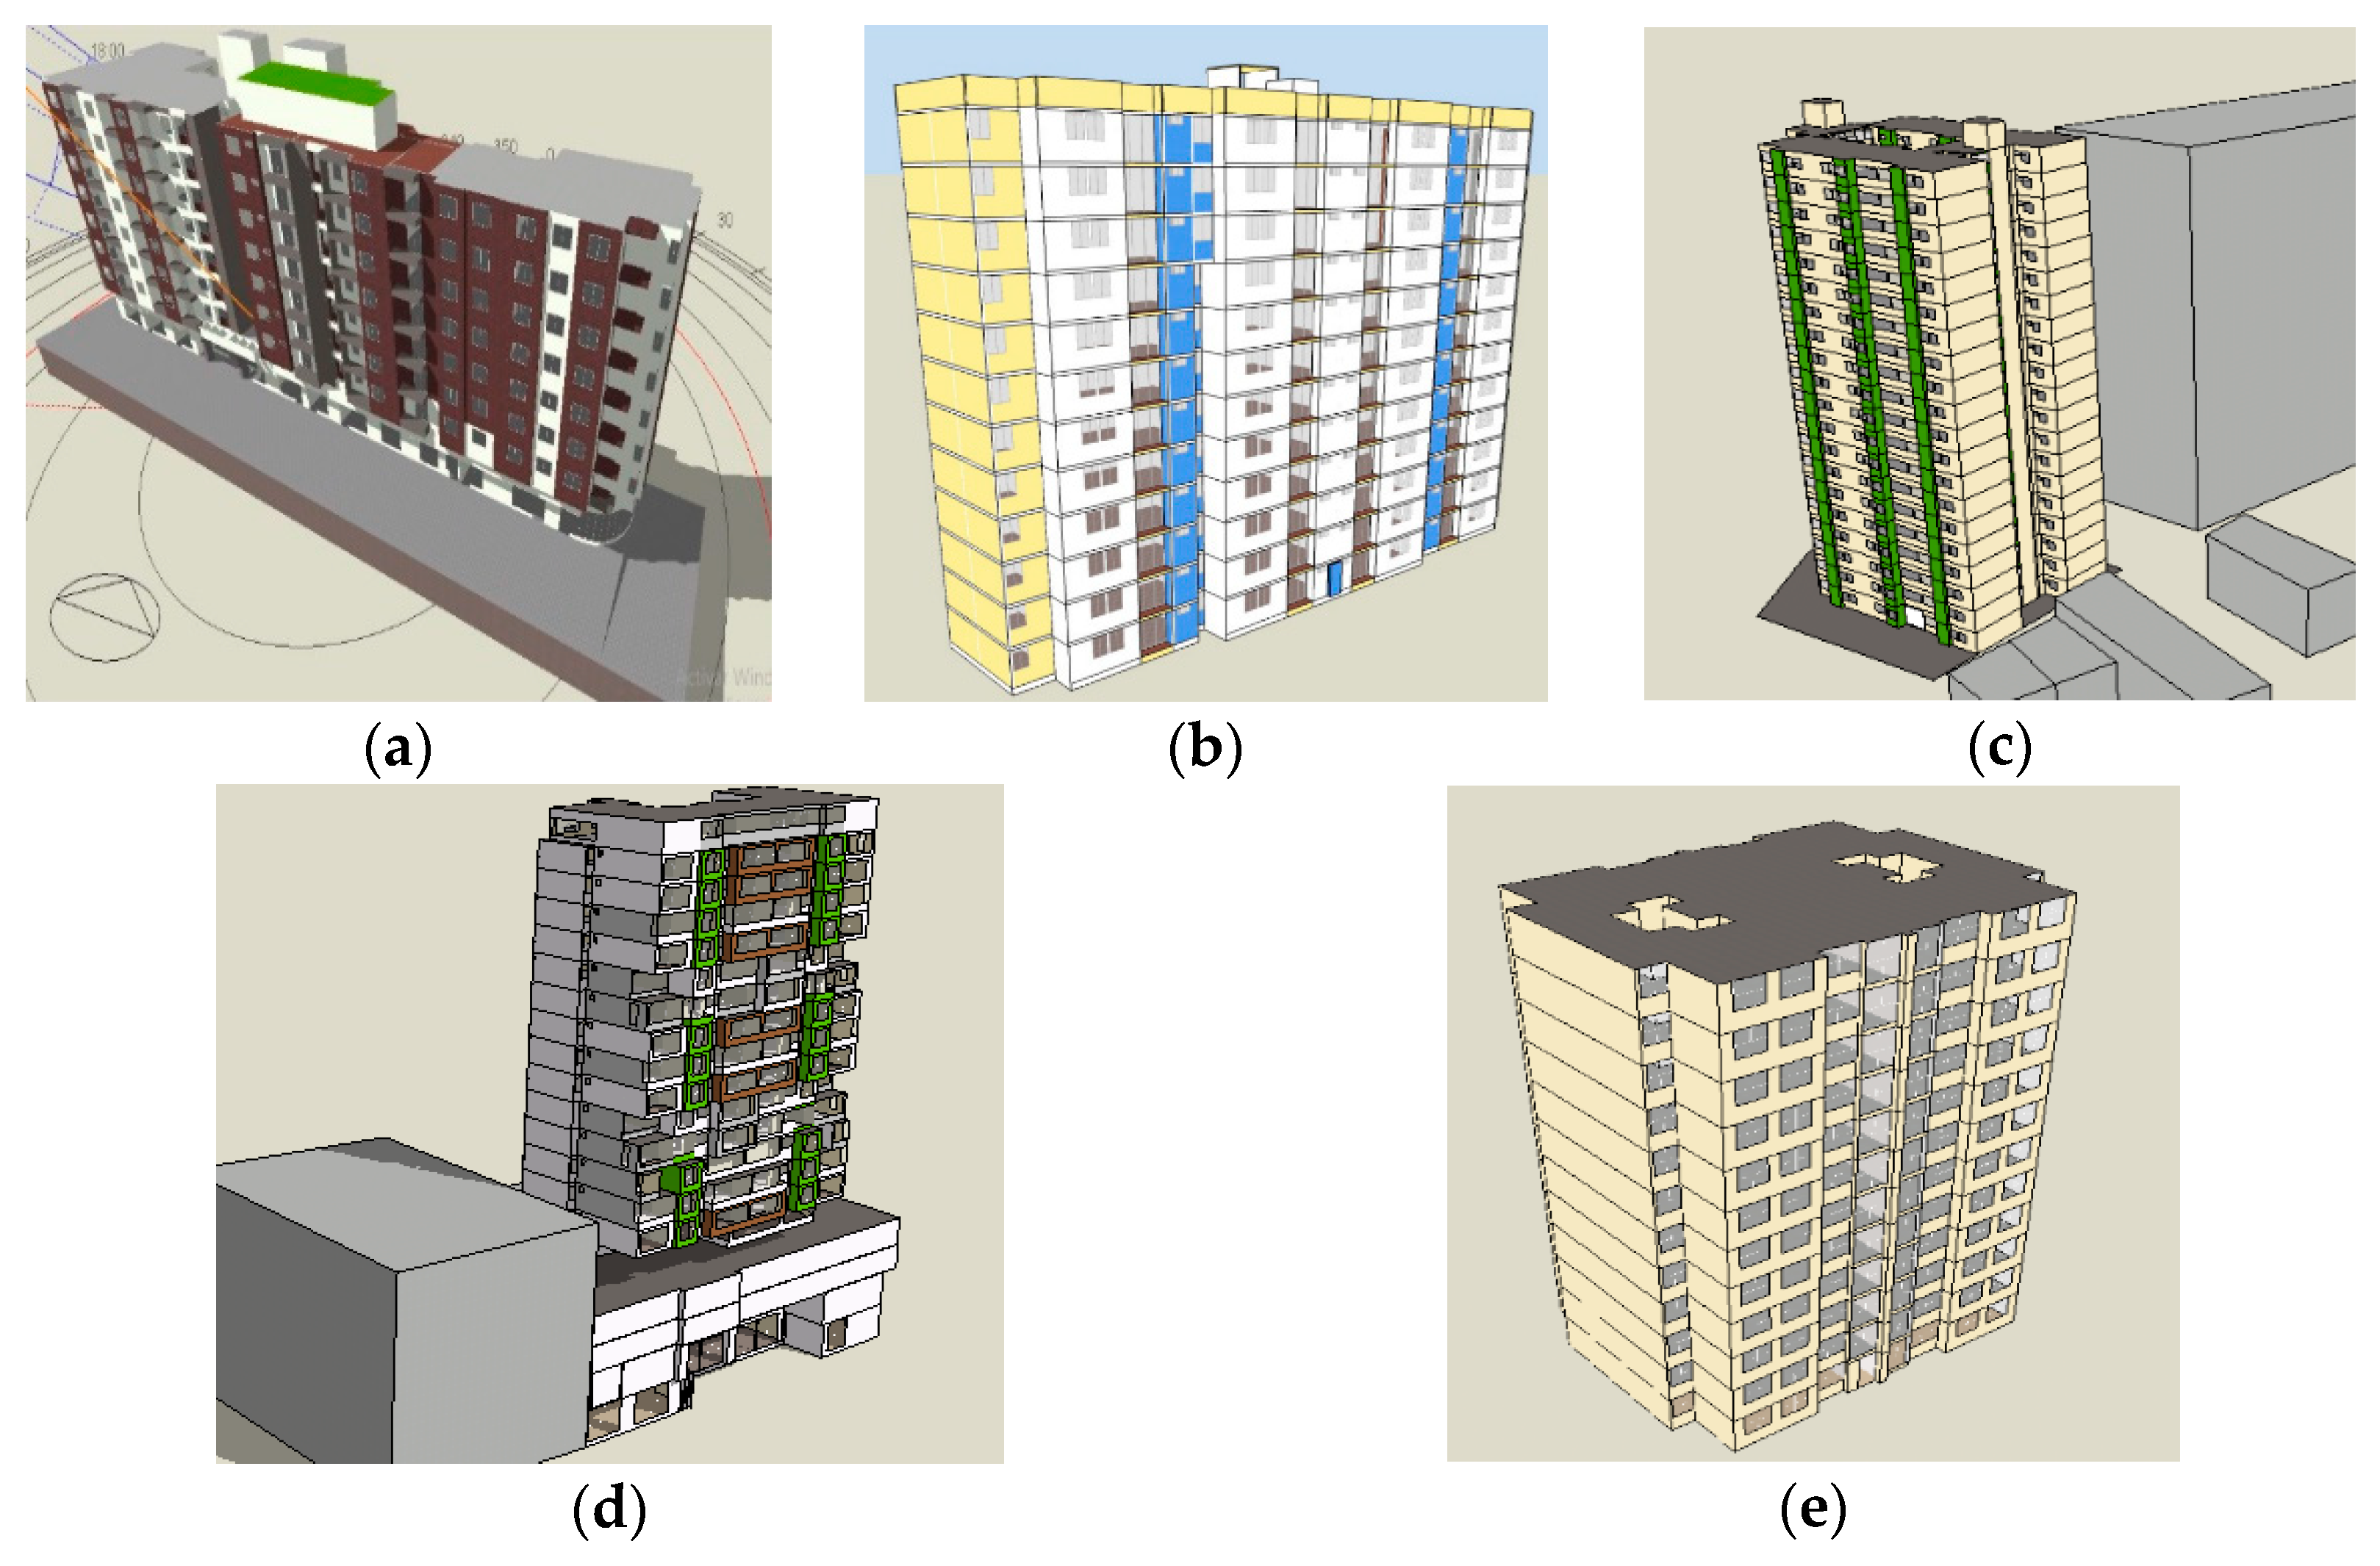
2.1. Selection of the Representative Buildings
2.2. Collection of the Input Information
2.3. Energy Modeling of the Buildings Belonging to the Sample
2.4. Energy Modeling of the Archetype
2.5. Energy Simulations
3. Results and Discussion
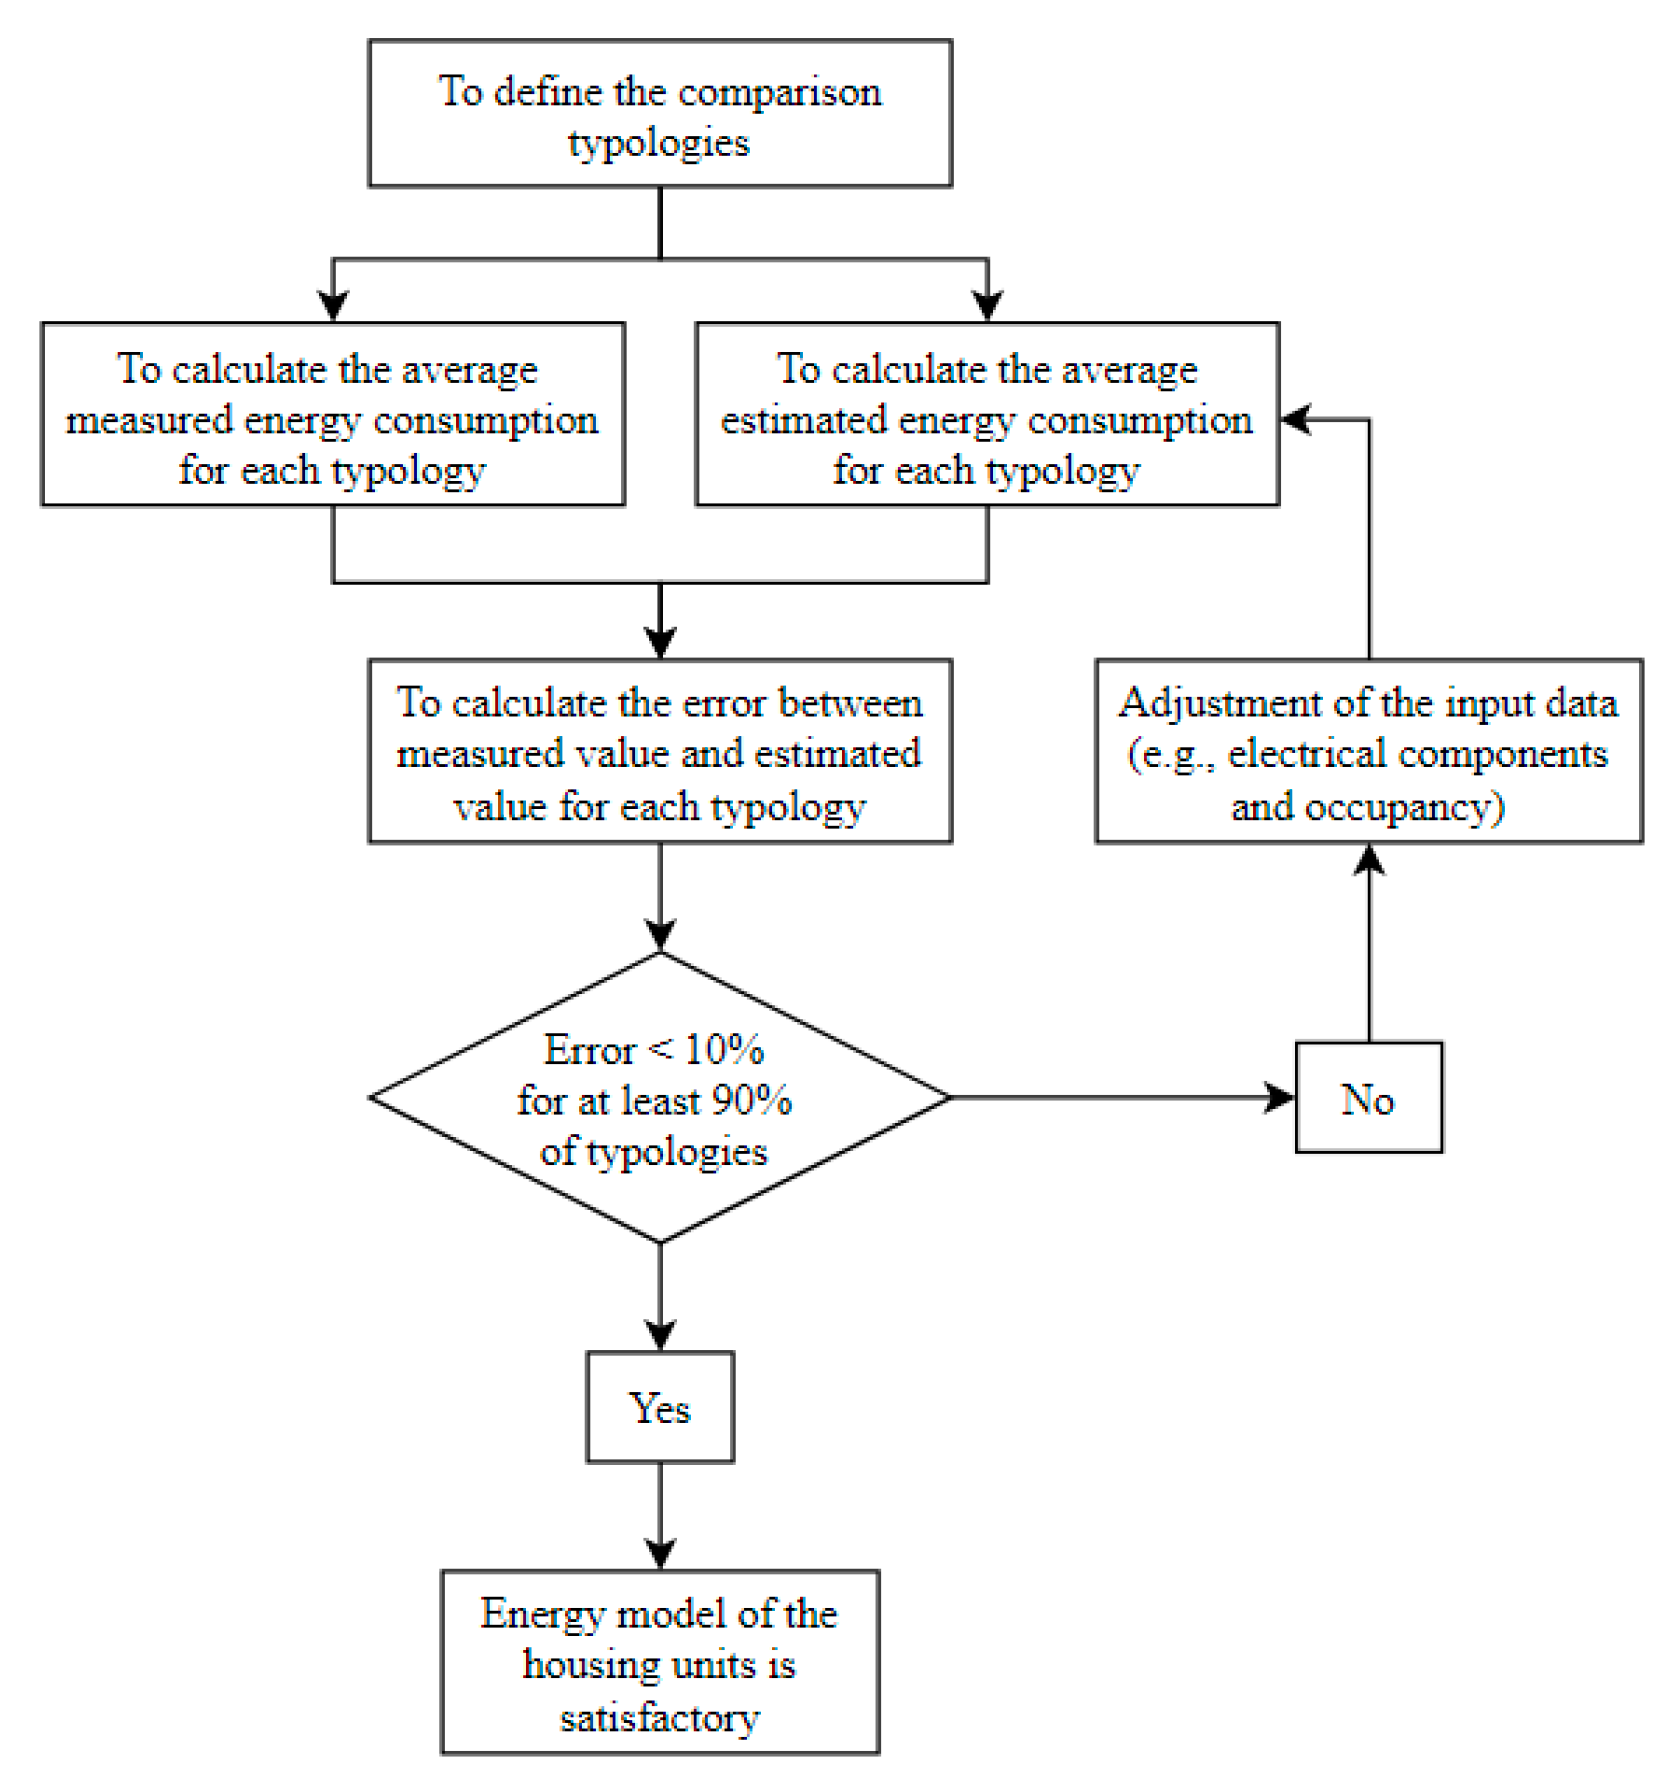
3.1. Calibration of the Energy Models Belonging to the Sample
3.2. Energy Consumption
3.3. Thermal Comfort
3.4. Heat Gains and Heat Losses
3.5. Comparative Analysis between Sample and Archetype
3.6. Discussion
4. Conclusions
Author Contributions
Funding
Institutional Review Board Statement
Informed Consent Statement
Data Availability Statement
Acknowledgments
Conflicts of Interest
References
- United Nations Environment Programme. 2020 Global Status Report for Buildings and Construction: Towards a Zero-Emission, Efficient and Resilient Buildings and Construction Sector; United Nations Environment Programme: Nairobi, Kenya, 2020. [Google Scholar]
- Ang, Y.Q.; Berzolla, Z.M.; Reinhart, C.F. From concept to application: A review of use cases in urban building energy modeling. Appl. Energy 2020, 279, 115738. [Google Scholar] [CrossRef]
- Ministerio de Vivienda, Ciudad y Territorio. Resolución 0549 de 2015; Ministerio de Vivienda, Ciudad y Territorio: Bogotá, Colombia, 2015. [Google Scholar]
- Glasgo, B.; Khan, N.; Azevedo, I.L. Simulating a residential building stock to support regional efficiency policy. Appl. Energy 2020, 261, 114223. [Google Scholar] [CrossRef]
- Fernandez, J.; del Portillo, L.; Flores, I. A novel residential heating consumption characterisation approach at city level from available public data: Description and case study. Energy Build. 2020, 221, 110082. [Google Scholar] [CrossRef]
- Wong, I.L.; Loper, A.C.M.; Krüger, E.; Mori, F.K. Energy performance evaluation and comparison of sampled Brazilian bank buildings with the existing and proposed energy rating systems. Energy Build. 2020, 225, 110304. [Google Scholar] [CrossRef]
- Krarti, M.; Aldubyan, M.; Williams, E. Residential building stock model for evaluating energy retrofit programs in Saudi Arabia. Energy 2020, 195, 116980. [Google Scholar] [CrossRef]
- Ali, U.; Shamsi, M.H.; Hoare, C.; Mangina, E.; O’Donnell, J. A data-driven approach for multi-scale building archetypes development. Energy Build. 2019, 202, 109364. [Google Scholar] [CrossRef]
- Sadafi, N.; Salleh, E.; Lim, C.H.; Jaafar, Z. Evaluating thermal effects of internal courtyard in a tropical terrace house by computational simulation. Energy Build. 2011, 43, 887–893. [Google Scholar] [CrossRef]
- Zahiri, S.; Elsharkawy, H. Towards energy-efficient retrofit of council housing in London: Assessing the impact of occupancy and energy-use patterns on building performance. Energy Build. 2018, 174, 672–681. [Google Scholar] [CrossRef]
- Corgnati, S.P.; Fabrizio, E.; Filippi, M.; Monetti, V. Reference buildings for cost optimal analysis: Method of definition and application. Appl. Energy 2013, 102, 983–993. [Google Scholar] [CrossRef]
- Brøgger, M.; Wittchen, K.B. Estimating the energy-saving potential in national building stocks—A methodology review. Renew. Sustain. Energy Rev. 2018, 82, 1489–1496. [Google Scholar] [CrossRef]
- Ahern, C.; Norton, B. A generalisable bottom-up methodology for deriving a residential stock model from large empirical databases. Energy Build. 2020, 215, 109886. [Google Scholar] [CrossRef]
- Beagon, P.; Boland, F.; Saffari, M. Closing the gap between simulation and measured energy use in home archetypes. Energy Build. 2020, 224, 110244. [Google Scholar] [CrossRef]
- Hedegaard, R.E.; Kristensen, M.H.; Pedersen, T.H.; Brun, A.; Petersen, S. Bottom-up modelling methodology for urban-scale analysis of residential space heating demand response. Appl. Energy 2019, 242, 181–204. [Google Scholar] [CrossRef]
- Diao, L.; Sun, Y.; Chen, Z.; Chen, J. Modeling energy consumption in residential buildings: A bottom-up analysis based on occupant behavior pattern clustering and stochastic simulation. Energy Build. 2017, 147, 47–66. [Google Scholar] [CrossRef]
- Hu, S.; Yan, D.; Qian, M. Using bottom-up model to analyze cooling energy consumption in China’s urban residential building. Energy Build. 2019, 202. [Google Scholar] [CrossRef]
- Panão, M.J.O.; Brito, M.C. Modelling aggregate hourly electricity consumption based on bottom-up building stock. Energy Build. 2018, 170, 170–182. [Google Scholar] [CrossRef]
- Osma-Pinto, G.; Ordóñez-Plata, G. Measuring factors influencing performance of rooftop PV panels in warm tropical climates. Sol. Energy 2019, 185, 112–123. [Google Scholar] [CrossRef]
- Osma-Pinto, G.; Ordóñez-Plata, G. Measuring the effect of forced irrigation on the front surface of PV panels for warm tropical conditions. Energy Rep. 2019, 5, 501–514. [Google Scholar] [CrossRef]
- Ascione, F.; Bianco, N.; Iovane, T.; Mauro, G.M.; Napolitano, D.F.; Ruggiano, A.; Viscido, L. A real industrial building: Modeling, calibration and Pareto optimization of energy retrofit. J. Build. Eng. 2020, 29, 101186. [Google Scholar] [CrossRef]
- Silvero, F.; Lops, C.; Montelpare, S.; Rodrigues, F. Generation and assessment of local climatic data from numerical meteorological codes for calibration of building energy models. Energy Build. 2019, 188–189, 25–45. [Google Scholar] [CrossRef]
- Yuan, T.; Ding, Y.; Zhang, Q.; Zhu, N.; Yang, K.; He, Q. Thermodynamic and economic analysis for ground-source heat pump system coupled with borehole free cooling. Energy Build. 2017, 155, 185–197. [Google Scholar] [CrossRef]
- A Abuhussain, M.; Chow, D.H.C.; Sharples, S. Sensitivity energy analysis for the Saudi residential buildings envelope codes under future climate change scenarios: The case for the hot and humid region in Jeddah. IOP Conf. Ser. Earth Environ. Sci. 2019, 329, 012039. [Google Scholar] [CrossRef]
- Bernardo, H.; Quintal, E.; Oliveira, F. Using a Calibrated Building Energy Simulation Model to Study the Effects of Improving the Ventilation in a School. Energy Procedia 2017, 113, 151–157. [Google Scholar] [CrossRef]
- Coakley, D.; Raftery, P.; Keane, M. A review of methods to match building energy simulation models to measured data. Renew. Sustain. Energy Rev. 2014, 37, 123–141. [Google Scholar] [CrossRef]
- Guerra-Santin, O.; Tweed, C.A. In-use monitoring of buildings: An overview of data collection methods. Energy Build. 2015, 93, 189–207. [Google Scholar] [CrossRef]
- Ascione, F.; Bianco, N.; Böttcher, O.; Kaltenbrunner, R.; Vanoli, G.P. Net zero-energy buildings in Germany: Design, model calibration and lessons learned from a case-study in Berlin. Energy Build. 2016, 133, 688–710. [Google Scholar] [CrossRef]
- Mustafaraj, G.; Marini, D.; Costa, A.; Keane, M. Model calibration for building energy efficiency simulation. Appl. Energy 2014, 130, 72–85. [Google Scholar] [CrossRef]
- Li, Y.; Rezgui, Y. A novel concept to measure envelope thermal transmittance and air infiltration using a combined simulation and experimental approach. Energy Build. 2017, 140, 380–387. [Google Scholar] [CrossRef]
- Liang, X.; Wang, Y.; Zhang, Y.; Jiang, J.; Chen, H.; Zhang, X.; Guo, H.; Roskilly, T. Analysis and Optimization on Energy Performance of a Rural House in Northern China Using Passive Retrofitting. Energy Procedia 2017, 105, 3023–3030. [Google Scholar] [CrossRef]
- Fabrizio, E.; Monetti, V. Methodologies and Advancements in the Calibration of Building Energy Models. Energies 2015, 8, 2548–2574. [Google Scholar] [CrossRef]
- ASHRAE. Measurement of Energy and Demand Savings; ASHRAE Guidelines 14-2002; American Society of Heating, Refrigerating and Air-Conditioning Engineers, Inc.: Atlanta, GA, USA, 2002; Volume 8400, pp. 1–165. [Google Scholar]
- Pedrini, A.; Westphal, F.S.; Lamberts, R. A Methodology for Building Energynext Term Modelling and Previous Termcalibrationnext term in Warm Climates. Build. Environ. 2002, 37, 903–912. [Google Scholar] [CrossRef]
- ASHRAE. Ashrae Standard Thermal Environmental Conditions for Human Occupancy 55-2004; American Society of Heating, Refrigerating and Air-Conditioning Engineers, Inc.: Atlanta, GA, USA, 2004; Volume 4723. [Google Scholar]


 | Parameter | Value |
| Average annual precipitation | 1279 mm | |
| Average ambient temperature | 24 °C (During the day) | |
| 27 °C (Sunlight hours) | ||
| Average maximum temperature | 31 °C | |
| Average solar irradiation | 4.8 kWh/m2/day | |
| Wind speed | 1.0–1.5 m/s |
| Building | Levels | Basements | Levels of Apartments | Average Area per Apartment (m2) | Average Occupancy per Apartment (people) |
|---|---|---|---|---|---|
| B1 | 9 | 3 | 7 | 78.11 | 2.8 |
| B2 | 12 | 0 | 12 | 57.52 | 4.0 |
| B3 | 20 | 2 | 20 | 58.50 | 3.4 |
| B4 | 21 | 0 | 16 | 88.07 | 2.5 |
| B5 | 12 | 0 | 12 | 54.80 | 2.7 |
| Source | Topic | Information |
|---|---|---|
| Construction company | Architecture | Plans of floor and facades and architectonical details |
| Electrical system | Electrical loads | |
| Mechanical system | Air conditioning | |
| Visit and survey | Building | Architectonical details |
| Use | Occupancy of inner spaces, characteristics and use of appliances, and use of general services | |
| Electricity company | Bill | Monthly energy consumption by users and general services |
| Building | B1 | B2 | B3 | B4 | B5 |
|---|---|---|---|---|---|
| Constructive system | Traditional system with frame (portico) structure | An industrialized system with plate structure and concrete walls | An industrialized system with plate structure and concrete walls | Traditional system with frame (portico) structure | An industrialized system with plate structure and concrete walls |
| Window to wall ratio—WWR | 16% | 19% | 17% | 17% | 25% |
| Configuration of external walls | Walls with clay bricks, frieze, stucco, inner painting. Total thickness: 15 cm | Concrete Wall, filler, and inner painting, graniplast (outdoor). Total thickness: 13 cm | Clay brick, filler, and inner painting, graniplast (outdoor). Total thickness: 13 cm | Clay brick, stucco, inner painting, and outdoor painting. Total thickness: 16 cm | Clay brick, filler, and inner painting, graniplast (outdoor). Total thickness: 15 cm |
| U-value (W/m²·K) external walls | 1.702 | 3.249 | 1.630 | 1.630 | 1.774 |
| Configuration of roofing | Lightweight concrete slabs, drywall ceiling, and inner painting. Mortar, asphalt cloth, and reflective paint for the outdoor surface. Total thickness: 45 cm | Solid concrete slabs, stucco, and inner painting. Mortar, asphalt cloth, and reflective Paint for the outdoor surface. Total thickness: 16 cm | Solid concrete slabs, stucco, and inner painting. Mortar, asphalt cloth, and reflective Paint for the outdoor surface. Total thickness: 16 cm | Lightweight concrete slabs, air layer, drywall ceiling, and inner painting. Mortar, asphalt cloth, and reflective paint for the outdoor surface. Total thickness: 46 cm | Solid concrete slabs, stucco, and inner painting. Mortar, asphalt cloth, and reflective Paint for the outdoor surface. Total thickness: 16 cm |
| U-value (W/m²·K) Roofing | 1.62 | 2.76 | 2.87 | 1.81 | 2.77 |
| Lighting power density—LPD (W/m2) | 4.61 | 2.22 | 1.11 | 4.33 | 2.83 |
| Electrical load density (W/m2) | 24.47 | 31.49 | 18.64 | 20.77 | 21.55 |
| Air conditioning system | Only for the main bedroom of an apartment per floor (9000 BTU) | Only for the main bedroom of some typologies o apartments (9000 BTU) | NO | NO | NO |
| Elevators | 2 × 10 HP | 1 × 7.5 HP | 1 × 10 HP | 2 × 8 HP | 1 × 6.5 HP |
| Total area of housing unit (m2) | 4920.9 | 4145.0 | 6844.9 | 4932.0 | 2981.8 |
| Total area of general services (m2) | 888.4 | 456.6 | 1295.2 | 1444.0 | 333.0 |
| Characteristic | Value/Specification | Characteristic | Value/Specification |
|---|---|---|---|
| Number of floors with apartments | 15 | U-value of glasses | 5.8 W/m2·K |
| Basements | 0 | Solar heat gain coefficient—SHGC | 82% |
| Number of apartments per floor | 6 | Effective opening for natural ventilation | 50% |
| Whole area of apartments | 5215.5 m2 | Lighting power density—LPD (W/m2) | 3.72 W/m2 |
| Average area per apartment | 58.0 m2 | Electrical load density (W/m2) | 31.13 W/m2 |
| Area of common zones | 917.9 m2 | Elevators | 12.5 HP |
| People per apartment | 4 | Composition of roofing | Lightweight-concrete |
| Height | 2.7 m | Finish of roofing | Painted asphalt cloth |
| Window to wall ratio—WWR | 40% | Composition of external walls | With a core of masonry |
| U-value of external walls | 2.77 W/m2·K | ||
| U-value of roofing | 2.20 W/m2·K | Composition of external walls | Frieze and stucco for both sides |
| Thickness of glasses | 3 mm |
| Building | Number of Typologies | Initial Error | Iterations of Adjustment | Final Error | Adjustments Made |
|---|---|---|---|---|---|
| B1 | 9 (1 with AirC) | 45.72% | 3 | 2.58% | Timetables of the use of some electrical loads Timetables of the use of air conditioning (AirC) units |
| B2 | 6 (All with AirC) | 13.66% | 3 | 3.10% | Timetables of the use of some electrical loads Timetables of the use of air conditioning (AirC) units |
| B3 | 1 | 39.48% | 1 | 3.04% | Configuration of the operation of the lighting system Rated power of some electrical loads |
| B4 | 4 | 28.15% | 2 | 4.25% | Rated power of some electrical loads Timetables of the use of some electrical loads Timetables of the use of lighting system |
| B5 | 2 | 5.34% | 0 | 5.34% | NA |
| Indicator | B1 | B2 | B3 | B4 | B5 | Average | |
|---|---|---|---|---|---|---|---|
| I1. Total annual energy consumption of the building (kWh/year) | 142 598.4 | 121 235.4 | 199 788.0 | 138 912.4 | 83 249.2 | 137 154.9 | |
| I1.1 Housing units | (kWh/year) | 111 028.6 | 106 237.0 | 154 007.3 | 84 536.5 | 71 736.1 | 105 509.1 |
| 77.9% | 87.6% | 77.1% | 60.9% | 86.2% | 76.9% | ||
| I1.2 General services | (kWh/year) | 31 560.8 | 14 998.4 | 45 780.7 | 54 375.9 | 11 513.1 | 31 645.8 |
| 22.1% | 12.4% | 22.9% | 39.1% | 13.8% | 23.1% | ||
| I2. Annual energy consumption of housing units (kWh/m2·year) | 22.57 | 25.63 | 22.50 | 17.14 | 24.06 | 22.38 | |
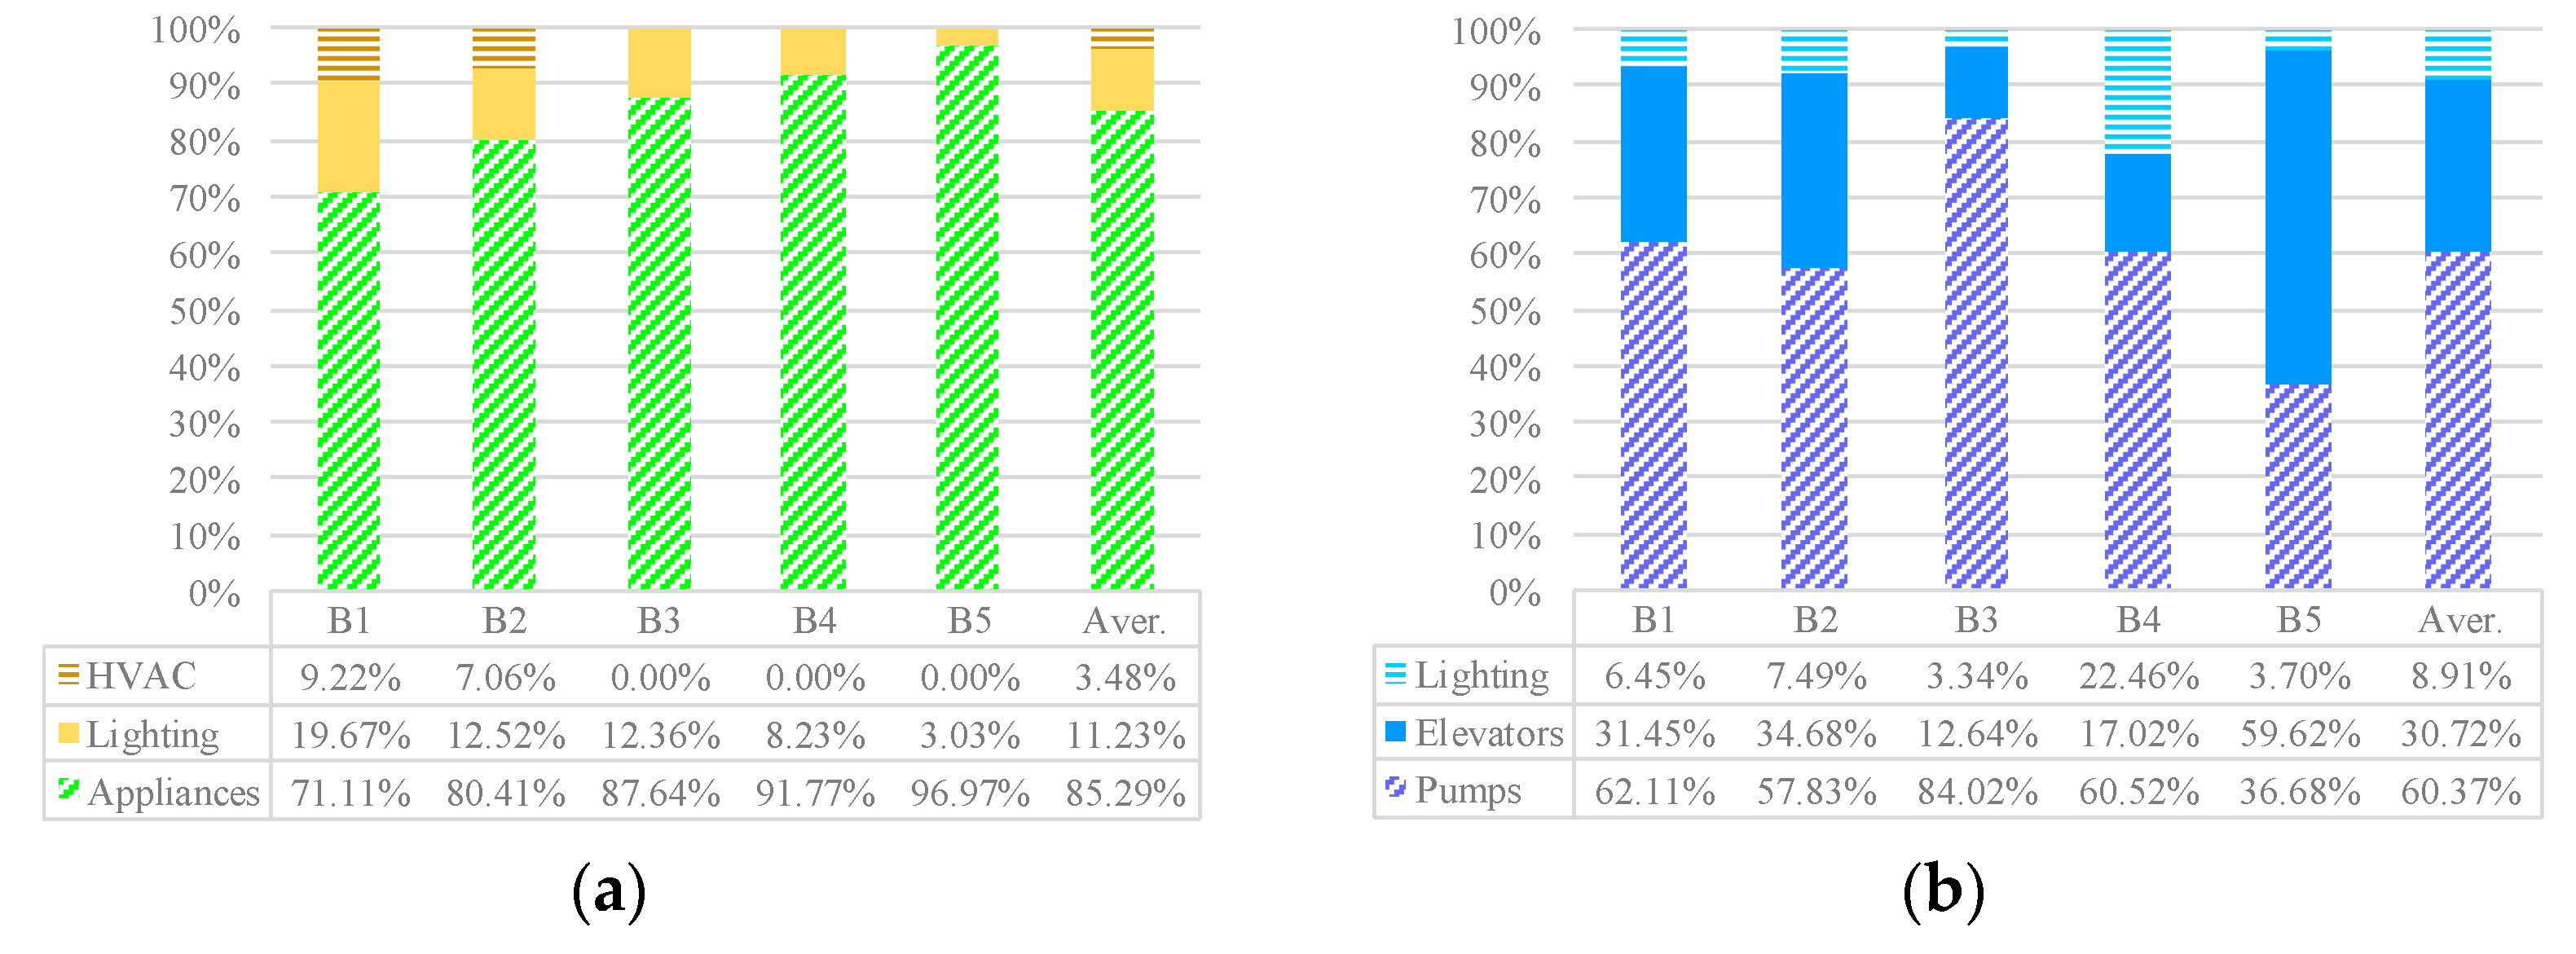
| I2.1 Energy consumption by appliances (kWh/m2·year) | 16.05 | 20.61 | 19.72 | 15.73 | 23.33 | 19.09 | |
| I2.2 Energy consumption by lighting (kWh/m2·year) | 4.44 | 3.21 | 2.78 | 1.41 | 0.73 | 2.51 | |
| I2.3 Energy consumption by AirC (kWh/m2·year) | 2.08 | 1.81 | - | - | - | 0.78 | |
| I3. Annual energy consumption of general services (kWh/m2·year) | 35.52 | 32.84 | 35.35 | 37.66 | 34.57 | 35.18 | |
| I3.1 Energy consumption by elevators (kWh/m2·year) | 11.17 | 11.39 | 4.47 | 6.41 | 20.61 | 10.81 | |
| I3.2 Energy consumption by pumps (kWh/m2·year) | 22.06 | 18.99 | 29.70 | 22.79 | 12.68 | 21.24 | |
| I3.3 Energy consumption by lighting (kWh/m2·year) | 2.29 | 2.46 | 1.18 | 8.46 | 1.28 | 3.13 | |
| Building | PPD | PMV | ASHRAE 55 SIMPLE | ASHRAE 55 Adaptative | Observations | |
|---|---|---|---|---|---|---|
| B1 | 36.9% | +1.20 | Thermal sensation between slightly warm and warm | 15.4% | 53.3% | The building has air conditioning units into the main bedroom for a typology of housing units. |
| B2 | 24.6% | +0.59 | Thermal sensation between neutral and slightly warm | 24.1% | 52.9% | |
| B3 | 16.1% | +0.41 | - | 3.1% | The building is naturally climatized | |
| B4 | 25.3% | +0.73 | - | 15.0% | ||
| B5 | 23.1% | +0.70 | - | 19.5% | ||
| Gain/Loss | B1 | B2 | B3 | B4 | B5 | ||||||
|---|---|---|---|---|---|---|---|---|---|---|---|
| C1 | People Sensible Heat Addition | 18.62 | 21.13% | 31.75 | 26.40% | 21.57 | 22.44% | 13.05 | 16.19% | 5.12 | 5.00% |
| C2 | Lights Sensible Heat Addition | 3.97 | 4.50% | 3.21 | 2.67% | 2.78 | 2.89% | 1.41 | 175% | 0.73 | 0.71% |
| C3 | Equipment Sensible Heat Addition | 14.89 | 16.90% | 20.61 | 17.13% | 19.72 | 20.52% | 15.73 | 19.52% | 23.31 | 22.76% |
| C4 | Window Heat Addition | 48.39 | 54.91% | 52.21 | 43.40% | 46.44 | 48.31% | 43.71 | 54.24% | 70.50 | 68.84% |
| C5 | Interzone Air Transfer Heat Addition | 0.31 | 0.35% | 2.72 | 2.26% | 0.22 | 0.23% | 3.39 | 34.21% | 0.25 | 0.24% |
| C6 | Infiltration Heat Addition | 0.40 | 0.45% | 0.006 | 0.00% | 0.44 | 0.46% | 0.003 | 0.00% | 0.19 | 0.19% |
| C7 | Opaque Surface Conduction and Other Heat Addition | 1.55 | 1.76% | 9.78 | 8.13% | 4.95 | 5.15% | 3.29 | 4.08% | 2.31 | 2.26% |
| Total additions | 88.13 | 120.29 | 96.12 | 80.58 | 102.41 | ||||||
| C8 | Window Heat Removal | 10.48 | 12.12% | 15.05 | 13.59% | 10.11 | 10.90% | 3.43 | 4.26% | 19.82 | 34.31% |
| C9 | Interzone Air Transfer Heat Removal | 10.60 | 12.26% | 26.00 | 23.48% | 5.06 | 5.45% | 29.79 | 36.97% | 0.81 | 1.40% |
| C10 | Infiltration Heat Removal | 59.09 | 68.32% | 49.86 | 45.03% | 60.87 | 65.61% | 28.17 | 34.96% | 0.59 | 1.02% |
| C11 | Opaque Surface Conduction and Other Heat Removal | 6.32 | 7.31% | 19.81 | 17.89% | 16.74 | 18.04% | 19.19 | 23.81% | 36.55 | 63.27% |
| Total removals | 86.49 | 110.72 | 92.78 | 80.58 | 57.77 | ||||||
| Indicator | Sample (Average) | Archetype | |
|---|---|---|---|
| I1. Total annual energy consumption of the building (kWh/year) | 137 154.9 | 176 018.4 | |
| I1.1 Housing units | (kWh/year) | 105 509.1 | 124 895.4 |
| 76.9% | 71.0% | ||
| I1.2 General services | (kWh/year) | 31 645.8 | 51 123.0 |
| 23.1% | 29.0% | ||
| I2. Annual energy consumption of housing units (kWh/m2·year) | 22.38 | 23.95 | |
| I2.1 Energy consumption by appliances (kWh/m2·year) | 19.09 | 22.44 | |
| I2.2 Energy consumption by lighting (kWh/m2·year) | 2.51 | 1.51 | |
| I2.3 Energy consumption by AirC (kWh/m2·year) | 0.78 | - | |
| I3. Annual energy consumption of general services (kWh/m2·year) | 46.0 | 55.70 | |
| I3.1 Energy consumption by elevators (kWh/m2·year) | 10.81 | 36.70 | |
| I3.2 Energy consumption by pumps (kWh/m2·year) | 21.24 | 18.35 | |
| I3.3 Energy consumption by lighting (kWh/m2·year) | 3.2 | 0.65 | |
| Building | PPD | PMV | ASHRAE 55 SIMPLE | ASHRAE 55 Adaptative | Observation | |
|---|---|---|---|---|---|---|
| Archetype | 26.66% | +0.83 | Thermal sensation between neutral and slightly warm | 90.9% | 51.5% | The building does not have an air conditioning system. |
| Gain/Loss | Value | Percentage | |
|---|---|---|---|
| C1 | People Sensible Heat Addition | 20.31 | 13.82% |
| C2 | Lights Sensible Heat Addition | 1.51 | 1.03% |
| C3 | Equipment Sensible Heat Addition | 21.17 | 14.40% |
| C4 | Window Heat Addition | 103.34 | 70.31% |
| C5 | Interzone Air Transfer Heat Addition | 0.15 | 0.10% |
| C6 | Infiltration Heat Addition | 0.25 | 0.17% |
| C7 | Opaque Surface Conduction and Other Heat Addition | 0.25 | 0.17% |
| Total additions | 146.98 | ||
| C8 | Window Heat Removal | 21.35 | 14.53% |
| C9 | Interzone Air Transfer Heat Removal | 14.33 | 9.75% |
| C10 | Infiltration Heat Removal | 65.02 | 44.24% |
| C11 | Opaque Surface Conduction and Other Heat Removal | 46.28 | 31.41% |
| Total removals | 146.98 |
Publisher’s Note: MDPI stays neutral with regard to jurisdictional claims in published maps and institutional affiliations. |
© 2021 by the authors. Licensee MDPI, Basel, Switzerland. This article is an open access article distributed under the terms and conditions of the Creative Commons Attribution (CC BY) license (https://creativecommons.org/licenses/by/4.0/).
Share and Cite
Cárdenas-Rangel, J.; Osma-Pinto, G.; Jaramillo-Ibarra, J. Improvement Proposal of Bottom-Up Approach for the Energy Characterization of Buildings in the Tropical Climate. Buildings 2021, 11, 159. https://doi.org/10.3390/buildings11040159
Cárdenas-Rangel J, Osma-Pinto G, Jaramillo-Ibarra J. Improvement Proposal of Bottom-Up Approach for the Energy Characterization of Buildings in the Tropical Climate. Buildings. 2021; 11(4):159. https://doi.org/10.3390/buildings11040159
Chicago/Turabian StyleCárdenas-Rangel, Jorge, German Osma-Pinto, and Julián Jaramillo-Ibarra. 2021. "Improvement Proposal of Bottom-Up Approach for the Energy Characterization of Buildings in the Tropical Climate" Buildings 11, no. 4: 159. https://doi.org/10.3390/buildings11040159
APA StyleCárdenas-Rangel, J., Osma-Pinto, G., & Jaramillo-Ibarra, J. (2021). Improvement Proposal of Bottom-Up Approach for the Energy Characterization of Buildings in the Tropical Climate. Buildings, 11(4), 159. https://doi.org/10.3390/buildings11040159