Article

Effects of In Content on the Microstructure and Mechanical Properties of In–Bi Alloys During Isothermal Aging

1
Joining and Welding Research Institute, Osaka University, 11-1 Mihogaoka, Ibaraki 567-0047, Japan
2
Graduate School of Engineering, Osaka University, 2-1 Yamadaoka, Suita 565-0871, Japan
3
Connected Solutions Company, Panasonic Corporation, 1-15 Matsuo-cho, Kadoma 571-8504, Japan
*
Author to whom correspondence should be addressed.
Metals 2019, 9(5), 548; https://doi.org/10.3390/met9050548
Submission received: 3 April 2019 / Revised: 30 April 2019 / Accepted: 7 May 2019 / Published: 10 May 2019

Abstract

:
Bulk In–Bi binary alloys with 50, 40, 33.7, and 30 mass% Bi and low melting temperatures were prepared and aged at 40 °C for 168, 504, and 1008 h in an oil bath. Tensile tests were performed on the bulk alloys, followed by fracture surface analysis of the tensile test samples. The effect of In content on the microstructures and mechanical properties of the alloys during thermal aging was analyzed. Ultimately, the tensile strength of the In–Bi alloys was found to decrease with aging time, while the elongation of the In–Bi alloys increased after thermal aging. The results of the tensile tests indicate that a higher In content improved the ductility of the In–Bi alloys significantly and reduced their strength. In addition, the fracture surfaces exhibited ductile fractures in the neck shapes. A comparative analysis of the microstructure and mechanical properties of the aforementioned alloys during thermal aging was also conducted.

1. Introduction

Modern electronic devices are smaller, lighter, thinner, and more energy-efficient than previous products [1,2], and flexible electronics are a representative technological innovation in the electronics industry. Flexible and wearable electronics are emerging technologies with significant potential. Recently, the market for flexible electronics boomed when foldable smartphones and rollable displays went on sale [3,4]. According to IDTechEX, the market for flexible electronics approached $31.6 billion in 2018. The forecasted market size is expected to be $77.3 billion in 2029 [5]. These market trends show how the market for flexible electronics will grow in the foreseeable future. As the market grows, flexible and bendable substrates are attracting more attention. Polypropylene (PP) and poly-(methyl methacrylate) (PMMA) are two of the materials attracting attention as next-generation substrates. These substrate materials have low melting temperatures below 170 °C [6,7]. However, the temperature of the reflow process for regularly applying environmentally friendly Sn-based solder alloys is approximately 250 °C [8], e.g., Sn–3.0Ag–0.5Cu (217 °C) [9], Sn–3.5Ag (221 °C) [10], and Sn–0.7Cu (227 °C) [11]. In this case, PP and PMMA are subject to thermal damage during the reflow process. Therefore, Sn-based low-temperature alloys, such as Sn–Zn and Sn–Bi solder alloy systems, were proposed as an alternative. In particular, the eutectic Sn–8.8 mass% Zn (Sn–9Zn) and Sn–58 mass% Bi (Sn–58Bi) alloys have low melting temperatures of about 198 and 139 °C, respectively [12,13,14,15,16]. However, these melting temperatures are still too high for PP and PMMA substrates.
In the present study, environmentally friendly In–xBi solder alloys, which have melting temperatures below 90 °C, were chosen as alternative low-temperature alloys, as shown in Table 1. Previous studies have investigated the basic properties of In–Bi alloys, as well as their thermal and mechanical properties [17]. These studies found that the melting temperature of the In–Bi alloys decreased with increasing indium content. In addition, their mechanical properties exhibited properties of ductility. Not only did the tensile strength at room temperature decrease with increasing indium content, there was also a significant increase in the elongation property. In conclusion, In–Bi alloys with melting temperatures of approximately 72.7 °C and 88.6 °C are attractive candidates for application to PP and PMMA. As highly reliable solder is necessary for electronic devices, thermal reliability studies of In–Bi alloys as low-temperature solder materials are required. Reliability tests have revealed some disadvantages of typical Sn–Ag–Cu and Sn–Bi alloys, such as microstructure coarsening and the deterioration of mechanical properties under isothermal aging [18,19]. For example, in the case of the Sn–Ag–Cu alloy, a grain coarsening of the Sn-rich phase and coarsening of the Ag3Sn intermetallic compounds (IMCs) was observed during thermal aging at 180 °C. Furthermore, mechanical properties such as tensile strength and hardness decreased with the aging time [18]. In the case of the Sn–Bi alloy, the coarsening of the Bi phase during thermal aging at 100 °C resulted in deteriorated tensile properties [19]. The reliability of solder in the user environment is important for flexible electronics. Therefore, in this study, we investigated the mechanical properties and microstructures of In–xBi alloys under isothermal aging to test and analyze their thermal reliability.

2. Experimental Procedures

2.1. Alloy Preparation and Aging Process

The In and Bi used in this study were in the form of a pure metal sheet and shot, respectively, both which are commercially available. In–Bi binary alloys were fabricated with the nominal compositions (mass%) shown in Table 1. Alloys with 50, 60, 66.3, and 70 mass% In (Nilaco., Tokyo, Japan, 99.99% pure) are herein referred to as In–50Bi, In–40Bi, In–33.7Bi (eutectic), and In–30Bi, respectively. These specimens were fabricated by dissolving the corresponding metallic sheet and shot in a furnace at 500 °C for 5 h. An equipoise with ±0.1 mg accuracy was used to weigh the elements. The alloying process was performed in a graphite crucible, in air, with manual stirring every 30 min to ensure homogeneity. The molten alloy was then chill-cast in a steel mold to form a bar-type ingot with a length of 50 mm, width of 10 mm, and thickness of 5 mm. Before the thermal aging test the In–Bi alloys were remelted at 250 °C for 1 h in a crucible. Next, they were cast into bar-shaped steel molds and machined into dumbbell shapes for tensile testing using wire-cutting electrical discharge machines (AG360L, Sodick, Kanagawa, Japan). As shown in Figure 1, the dimensions of the gauge section of the tensile test specimens were 1.0 mm (depth) × 2.0 mm (width) × 10 mm (length). The dumbbell shape allows the fracture in the middle of the samples to be observed. After machining, SiC paper was utilized to polish the specimens mechanically, up to #2000 grit. Next, polycrystalline diamond spray (3 and 1 μm; DP-spray P, Struers, Ballerup, Denmark) was used to further polish the specimens. The polished specimens were used for tensile testing after thermal aging. Eight repetitions of the tests were performed to collect the presented results and averages. The thermal aging test was conducted on alloy specimens to evaluate their morphologies and mechanical properties during aging. The samples were aged in an oil bath at a temperature of 40 °C for 168, 504, and 1008 h. After aging, the samples were removed from the oil bath and cooled to 23 °C.
The oil on the sample surfaces was removed with ethanol. An aging temperature of 40 °C was selected as it represents typical user and environmental conditions for flexible and wearable devices.

2.2. Elemental Analysis and Microstructures

The phase contents of each alloy were measured by X-ray diffraction (XRD, Ultima IV, Rigaku, Tokyo, Japan) with Cu Kα radiation (λ = 1.54059 Å) at an accelerating voltage of 40 kV. The diffraction beam was scanned in steps of 0.02° across the 2θ range of 20–80° at 2°/min. The International Center for Diffraction Data powder diffraction file cards, including #00-005-0642 for In, #01-071-0226 for BiIn2, and #01-071-0223 for Bi3In5, were used as references to identify the diffraction patterns. Quantitative phase analysis was conducted via the reference intensity ratio method using PDXL software provided by Rigaku. Phase analysis was reaffirmed by HighScore Plus software version 3.0e (PANalytical B.V, Almero, Netherlands).
A fine cutter was employed to section the samples and the bulk samples were mounted in epoxy and hardener. Next, SiC paper was employed to polish the mounted samples up to 2000 grit. DP-spray P (3 and 1 μm) was also used to polish the samples before the final step, which involved an oxide polishing suspension (OP-S, Struers). Immediately following the polishing process the samples were submerged in pure ethanol and ultrasonically cleaned for 5 min. A morphological study of the microstructure was performed using a field-emission scanning electron microscope (FE-SEM, SU-70, Hitachi, Tokyo, Japan) equipped with energy-dispersive spectroscopy (EDS, Oxford Instruments, Abingdon, UK). Elemental mapping of the microstructure was performed using an electron probe microanalyzer (EPMA, JXA-8530F, JEOL, Tokyo, Japan). The eutectic spacing of the In–33.7Bi alloy, as defined in Figure 2, was measured to quantify the magnitude of the fine structure under thermal aging using ImageJ software, which measured 30 positions under each aging condition.

2.3. Tensile Testing

The mechanical properties of the In–50Bi, In–40Bi, In–33.7Bi, and In–30Bi alloys were evaluated by tensile testing. Tensile tests were conducted using a universal testing machine (Autograph AG-X, Shimadzu) at room temperature. Using the strain rate of 0.0005 s–1, tensile properties such as the ultimate tensile strength (UTS) and elongation were obtained. Under the assumption of equivalence to the true test-strain, engineering stress–strain curves were used to present the stress–strain characteristics of the In–Bi alloys. This was possible due to their small deformation range. Further examination was performed using FE-SEM to closely analyze the necking and fracture surfaces of the In–Bi alloys after tensile testing.

3. Results and Discussion

3.1. Phase Constitution and Microstructures

We compared the phase compositions of the as-cast and thermally aged alloys. The XRD patterns of the In–Bi alloys shown in Figure 3a include BiIn2, Bi3In5, and In-phase peaks. According to the In–Bi binary phase diagram [20], two IMC phases of BiIn2 and Bi3In5 formed in the In–50Bi alloy. The Bi3In5 phase was generated from a peritectic reaction occurring at 88.9 °C. A peritectic reaction occurring between 93.5 and 49 °C also generated the ε-phase, which formed a eutectic with BiIn2 at 72.7 °C. Figure 3b shows the XRD patterns of the alloys after thermal aging for 1008 h at 40 °C. No significant differences appear between the patterns for the as-cast and thermally aged specimens, except for the intensity of the In peak, which is higher in In–33.7Bi and In–30Bi.
Figure 4a shows SEM images of the as-cast In–Bi alloys. The dark gray and bright gray colors represent the In-rich phase and BixIny IMCs, respectively. A peritectic reaction occurs when Bi3In5 isolates the liquid and the solid-solution phase of BiIn. A peritectic reaction also occurs when the In–50Bi alloy appears. The In–40Bi alloy is hypoeutectic; at the liquidus temperature the solidification of the liquid begins, leading to a solid BiIn2 phase. However, the eutectic reaction must occur in order for the solidification to finish. Cooling the alloy below 72.7 °C allows the eutectic reaction to occur for all of the remaining liquid. A transformation into a lamellar mixture of In and BiIn2 follows the cooling process; particularly for In–33.7Bi, in which eutectic microconstituents surround the solid BiIn2, as shown in Figure 4.
Figure 5 shows the backscattered electron and mapping images obtained using the EPMA. These images show several signals from In and Bi. The Bi3In5 and BiIn2 phases can be clearly identified in these images. For In–50Bi, the phases are completely separated into the Bi3In5 and BiIn2 phases. In the elemental map obtained through the EPMA the bright gray region has a composition of Bi–62In (at. %) and can be classified as Bi3In5; the dark gray region is Bi–67In (at. %) and can be classified as BiIn2. However, in In–33.7Bi the bright region is BiIn2 and the dark region is Bi–98In (at. %), and is therefore classified as an the In-rich phase, as shown in Table 2.
As defined in Figure 2, the eutectic spacing of the In–33.7Bi alloy is measured. Figure 6 shows that the eutectic spacing of the as-cast In–33.7Bi alloy is 5.12 μm. Small changes in the eutectic spacing are observed in In–33.7Bi after thermal aging at 40 °C for 168, 504, and 1008 h. The eutectic spacing gradually increases during thermal aging because of the accelerated diffusion rate between the In and Bi phases and the trend to achieve chemical equilibrium at high temperatures [20]. After 1008 h of aging at 40 °C the eutectic spacing is maximized at 6.5 μm, approximately 1.25 times larger than that of the as-cast alloy.

3.2. Mechanical Properties

The effect of thermal aging on the tensile properties of the In–Bi alloys was investigated, and the representative stress–strain curves obtained from the tensile tests are shown in Figure 7. To illustrate the measured values on the stress–strain diagrams, the cross-section and gauge length parameters were utilized to normalize the values. Figure 7 shows the stress–strain curves of a specimen measured at room temperature. Figure 7a shows the S–S curve before thermal aging. The UTS and elongation of the In–50Bi alloy, In–40Bi alloy, In–33.7Bi alloy, and In–30Bi alloy were 23.3 MPa and 41.9%, 14.8 MPa and 41.6%, 12.6 MPa and 55.7%, and 11.6 MPa and 74.8%, respectively. After thermal aging for 168 h at 40 °C, as shown in Figure 7b, the UTS and elongation of the In–50Bi alloy, In–40Bi alloy, In–33.7Bi alloy, and In–30Bi alloy were 19.3 MPa and 45.3%, 13.1 MPa and 38.6%, 12.0 MPa and 53.8%, and 11.6 MPa and 74.2%, respectively.
After thermal aging for 504 h at 40 °C, as shown in Figure 7c, the UTS and elongation of the In–50Bi alloy, In–40Bi alloy, In–33.7Bi alloy, and In–30Bi alloy were 17.9 MPa and 43.1%, 12.3 MPa and 41%, 11.4 MPa and 57.3%, and 11.0 MPa and 78.4%, respectively.
After thermal aging for 1008 h at 40 °C, as shown in Figure 7d, the UTS and elongation of the In–50Bi alloy, In–40Bi alloy, In–33.7Bi alloy, and In–30Bi alloy were 16.3 MPa and 44.5%, 12.5 MPa and 45.3%, 11.9 MPa and 64.8%, and 10.9 MPa and 76.2%, respectively. Figure 8 shows the summarized tensile properties of the In–xBi alloys.
Figure 9 illustrates the relationship between the tensile properties and indium content. After thermal aging for 168 h at 40 °C, as shown in Figure 9a, the UTS values of the In–50Bi alloy, In–40Bi alloy, In–33.7Bi alloy, and In–30Bi alloy were 19.3, 13.1, 12.0, and 11.5 MPa, respectively. After thermal aging for 1008 h, the UTS values of the In–50Bi alloy, In–40Bi alloy, In–33.7Bi alloy, and In–30Bi alloy were 16.3, 12.5, 11.9, and 10.9 MPa, respectively. The decrease in the UTS after thermal aging for 1008 h was smaller than that seen after 168 h. Even if the differences in the UTS decrease, the UTS values of the binary In–Bi alloys decrease with increasing In content. The reduction in UTS through the addition of In was most likely due to recrystallization, which leads to induced deformation [21]. As shown in Figure 9b, specimen elongation was drastically increased for higher In content under both as-cast and thermal aging conditions. After thermal aging for 1008 h the elongation values of the In–50Bi alloy, In–40Bi alloy, In–33.7Bi alloy, and In–30Bi alloy were 44.5%, 45.3%, 64.8%, and 76.2%, respectively, as shown in Figure 9b. Therefore, the elongation of binary In–Bi alloys increases with In content.
Figure 10 illustrates how the tensile properties were affected by thermal aging time. For the as-cast and 1008 h aging conditions the UTS values of the In–50Bi were 23.3 and 16.3 MPa, respectively, as shown in Figure 10a. The UTS of the 1008 h aged specimens compared to the as-cast specimens decreased by 29.8%. However, in the case of In–30Bi the UTS values were 11.6 and 10.9 MPa for the as-cast and thermally aged alloys, respectively. The reduction rate was 5.5%. The changes in UTS with aging time were not significant except for in the case of In–50Bi, as shown in Figure 10a. The elongation values of In–50Bi were 41.9% and 44.5% under the as-cast and 1008 h aging conditions, respectively, as shown in Figure 10b. The elongation of the specimens aged for 1008 h increased by 6.2% compared to the as-cast specimens. In the case of In–30Bi, the elongations values were 74.8% and 76.2% in the as-cast and 1008 h aging conditions, respectively. The elongation of the specimens aged for 1008 h increased by 1.8% compared to the as-cast specimens. The changes in elongation with aging time were not significant, as shown in Figure 10b.
The observed large increase in ductility may be caused by the addition of excess In to the binary In–Bi alloys, which causes In-rich phases to form [22]. Furthermore, the addition of excess In to the In–Bi system implies a comparatively smaller amount of Bi, which is brittle by nature, in the system, resulting in a more ductile behavior. In–Bi alloys exhibited stress–strain curves that were considerably different from those of Sn-based alloys, as shown in Figure 7. For In–50Bi, which had the smallest amount of In of the tested alloys, the elastic–plastic transition showed a sharp bend in the stress–strain curve. The deformation of In–Bi alloys can be approximated as ideal plastic behavior. Increasing the reduction in the cross-sectional area up to the neck of the sample can lead to a decrease in the measured load. Increasing the In content not only greatly increases the elongation property, but also causes the reduction in area to remain extremely high. As expected, the thermally aged In–Bi alloys showed outstanding low-temperature deformation properties owing to their stable thermal behaviors.

3.3. Fracture Modes

The as-cast and thermally aged specimens with different alloy compositions were observed after tensile testing, as shown in Figure 11. Generally, ductile fractures are caused by a simple overload of a ductile material [23]. In-based alloys exhibit outstanding low-temperature deformation properties [24]. As expected, In–33.7Bi and In–30Bi exhibited high ductility. As is common for soft alloys, the fracture surfaces showed ductile fracture features in the neck shapes for all In–Bi alloys. The different neck shapes appeared according to the In content, due to its ductility. As shown in Figure 11a,b, post necking led to a moderate ductile fracture in In–50Bi, which contained the lowest In content. On the tip of the fracture surface of the In–50Bi alloy an irregular and fibrous appearance was observed. However, alloys with greater In contents, such as In–33.7Bi and In–30Bi, also showed high ductility, as represented by reductions in the cross-sectional areas approaching 90 and 100%, respectively, as shown in Figure 11. Eventually, the contact area becomes too small to support the load, resulting in fracture. The specimen necks to a point; this type of failure is typically called rupture [25]. This can also be seen in Figure 11b. As the In content increases, the neck width decreases. In particular, In–30Bi showed a reduction in the neck width to a dot-like shape; it also showed the highest ductility of the tested In–Bi alloys. As mentioned in our previous study [17], ductile fracture is accompanied by necking and the nucleation and coalescence of microvoids. Small spherical voids form under high stress, causing the fracture of the alloy at the grain boundaries, as shown in Figure 12. As shown in Figure 13, in the case of In-30Bi the microvoids grew and coalesced into larger cavities when there was an increase in the local stress. Finally, no significant differences in fracture surfaces were observed between the as-cast and thermally aged specimens.

4. Conclusions

In this study the effects of In content on the microstructure and mechanical properties of In–Bi alloys under thermal aging were investigated. The following conclusions can be made:
(1)
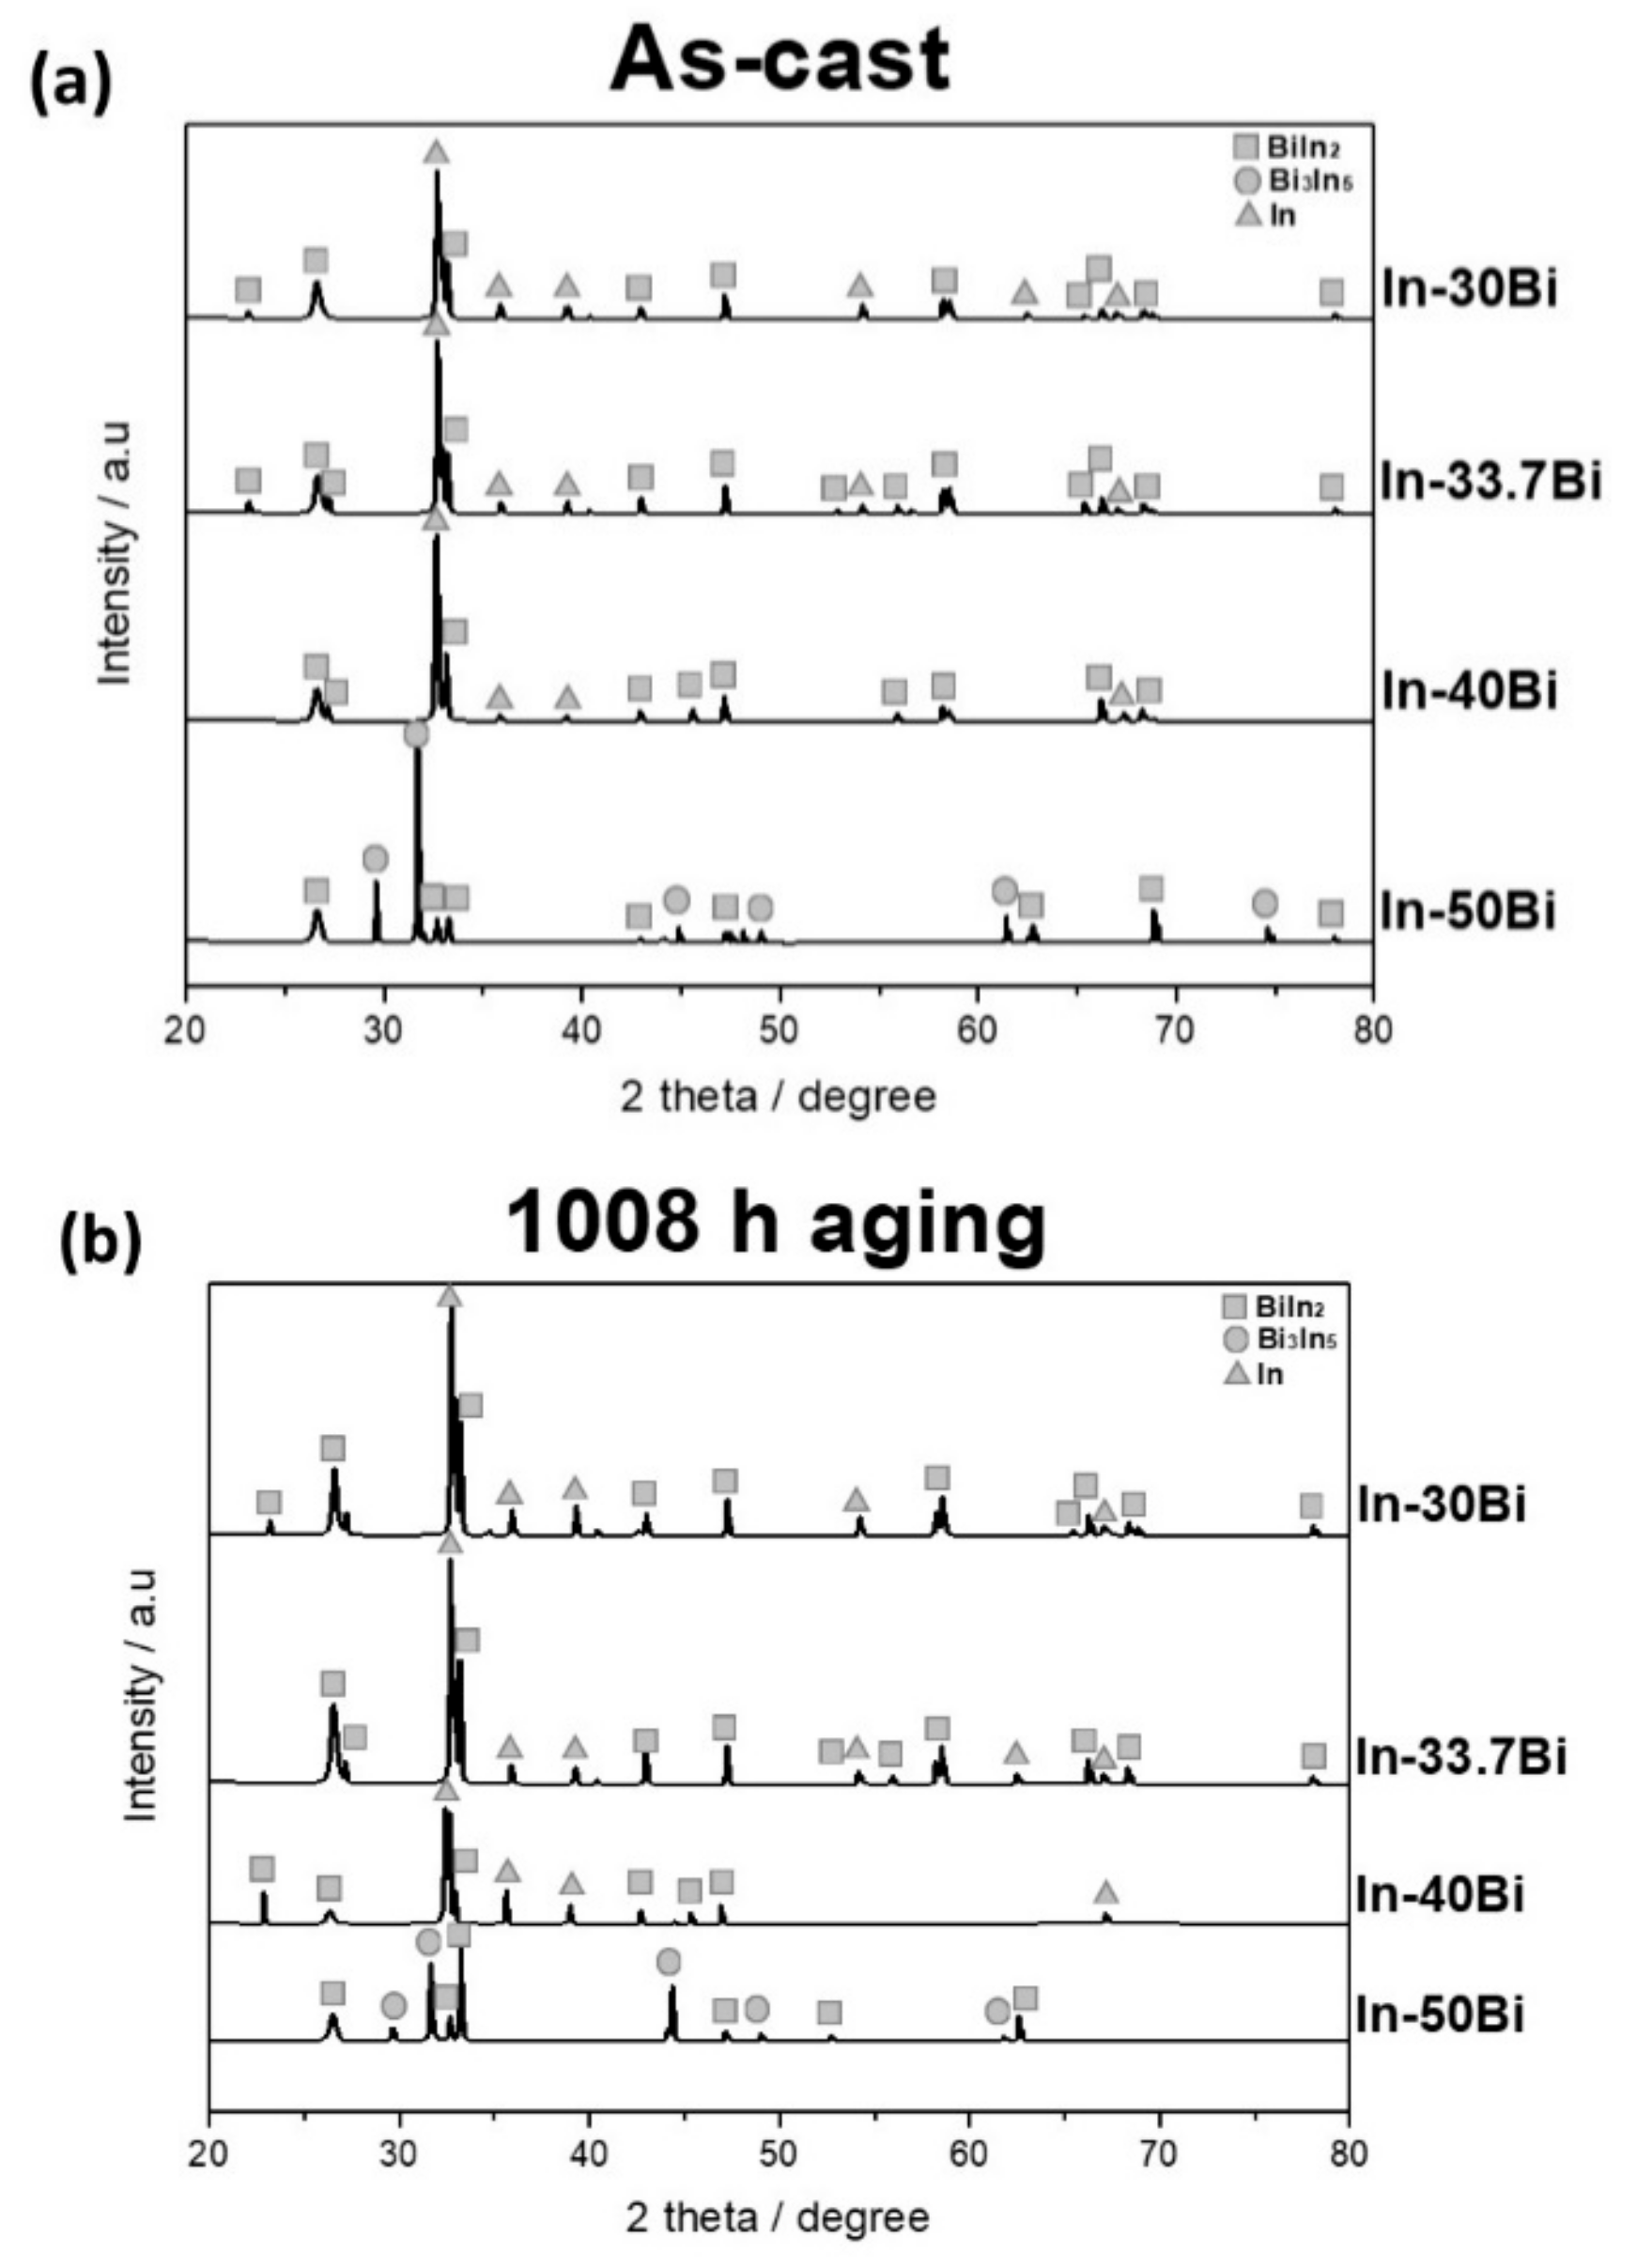
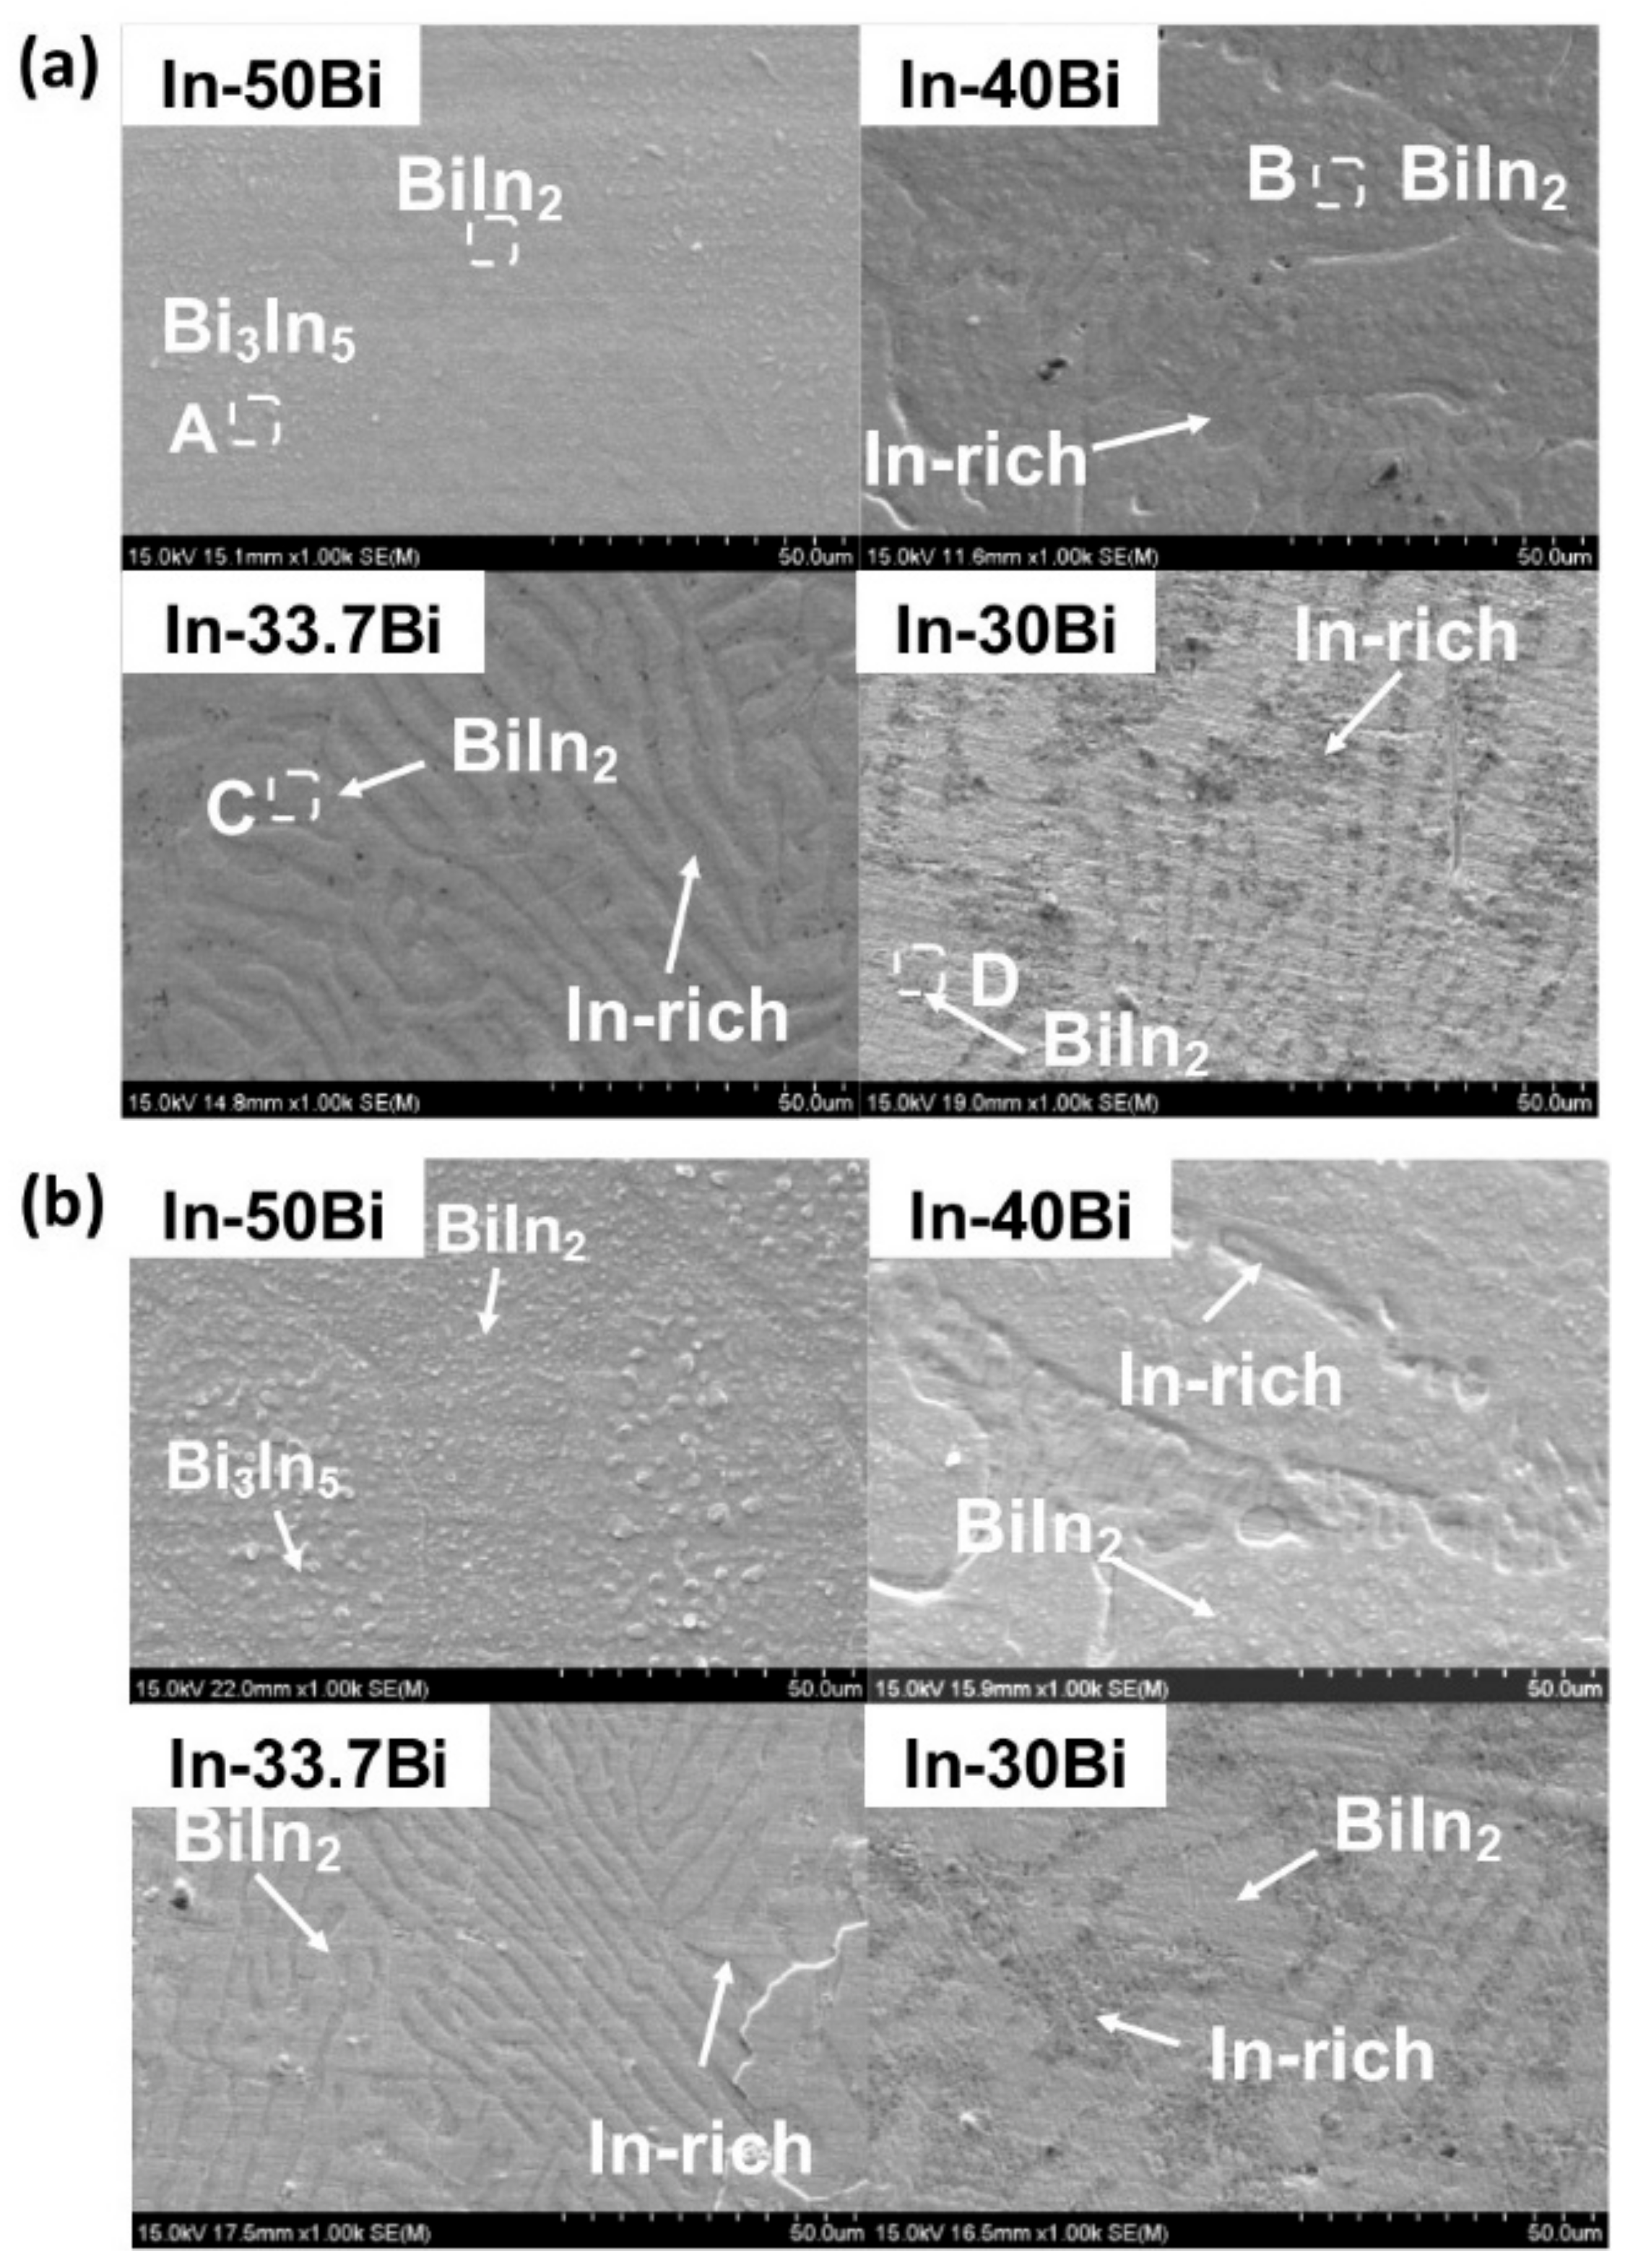
The microstructure of the In–Bi alloys containing the primary In-phase, Bi3In5, and BiIn2 phases was investigated. The In-rich phase increased with In content. However, the microstructure did not change significantly during thermal aging.
(2)
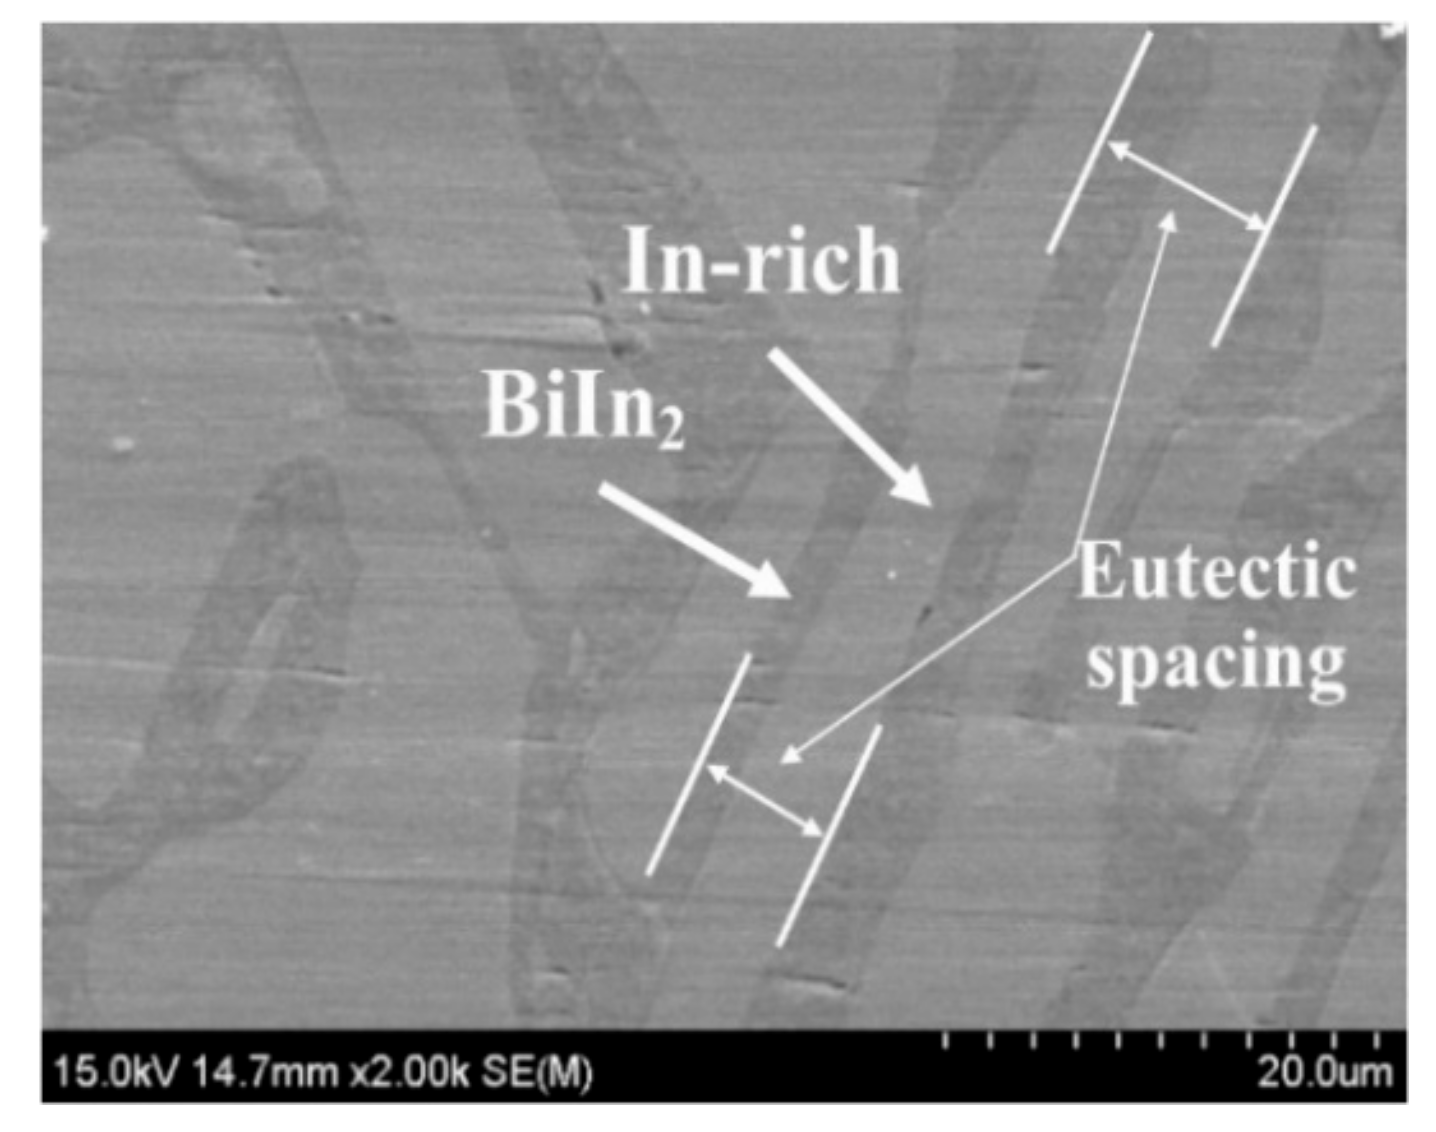
In the case of In–33.7Bi, the eutectic spacing gradually increased during thermal aging, becoming approximately 1.25 times larger than that of the as-cast alloy.
(3)
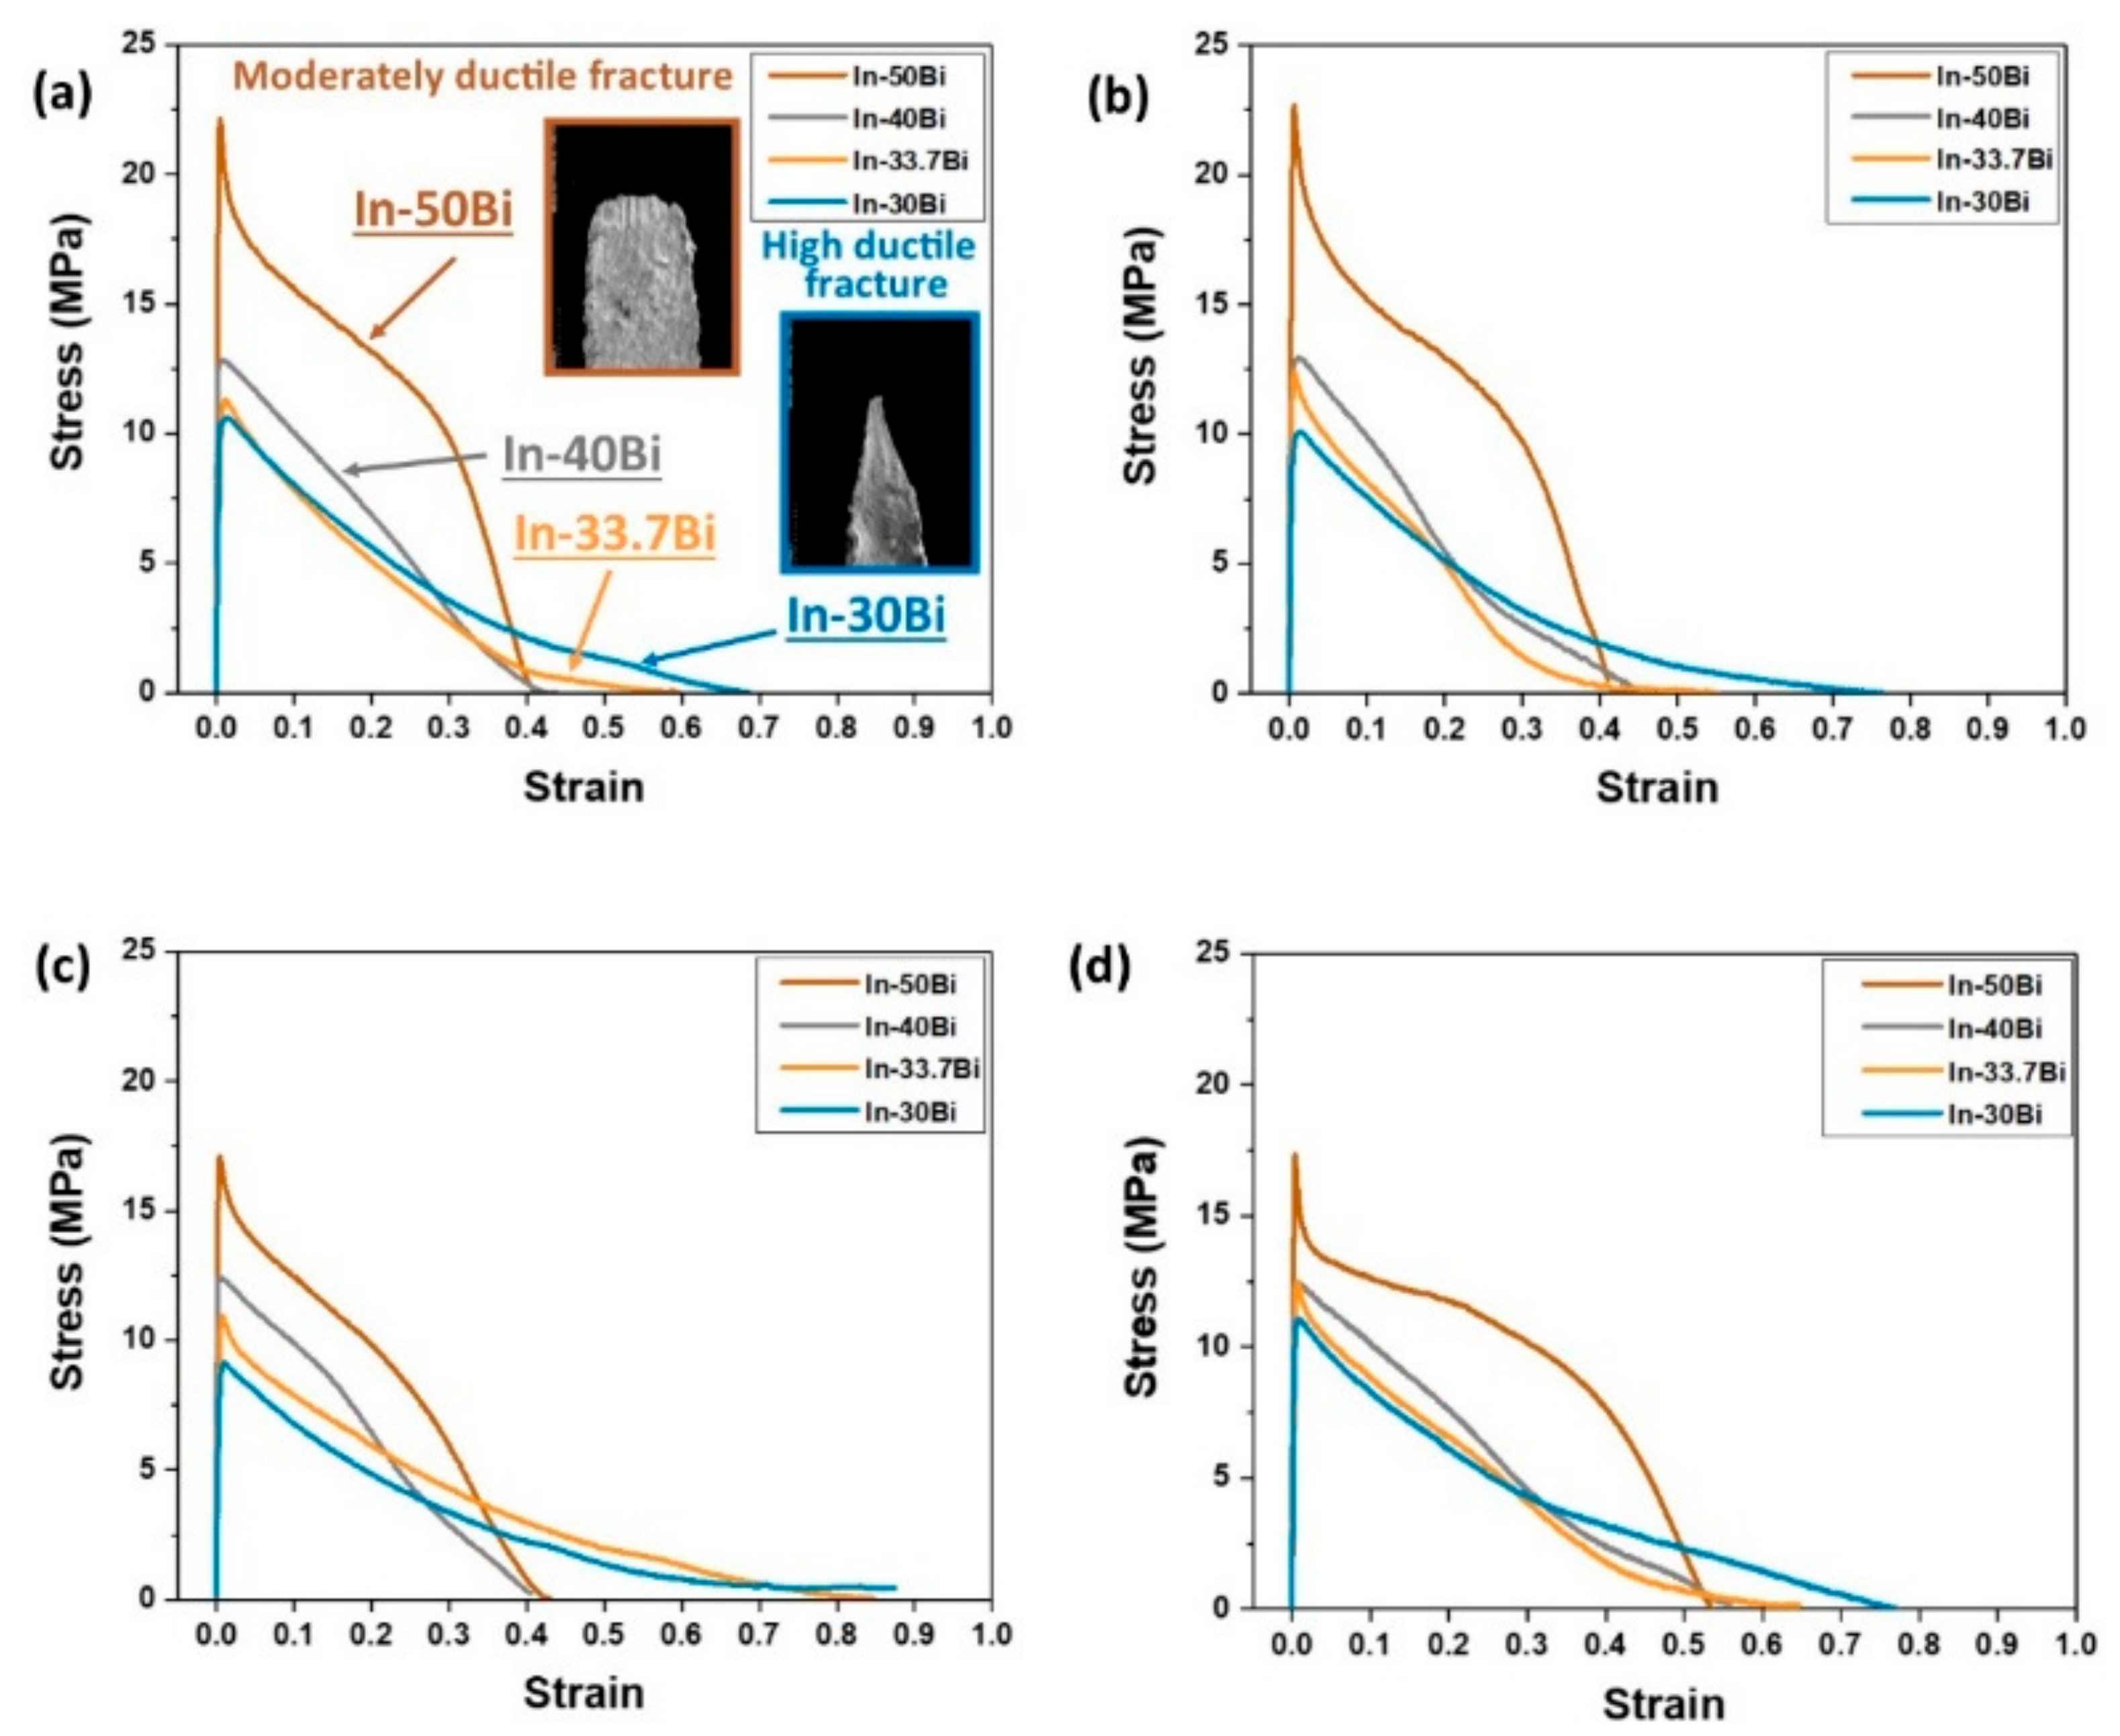
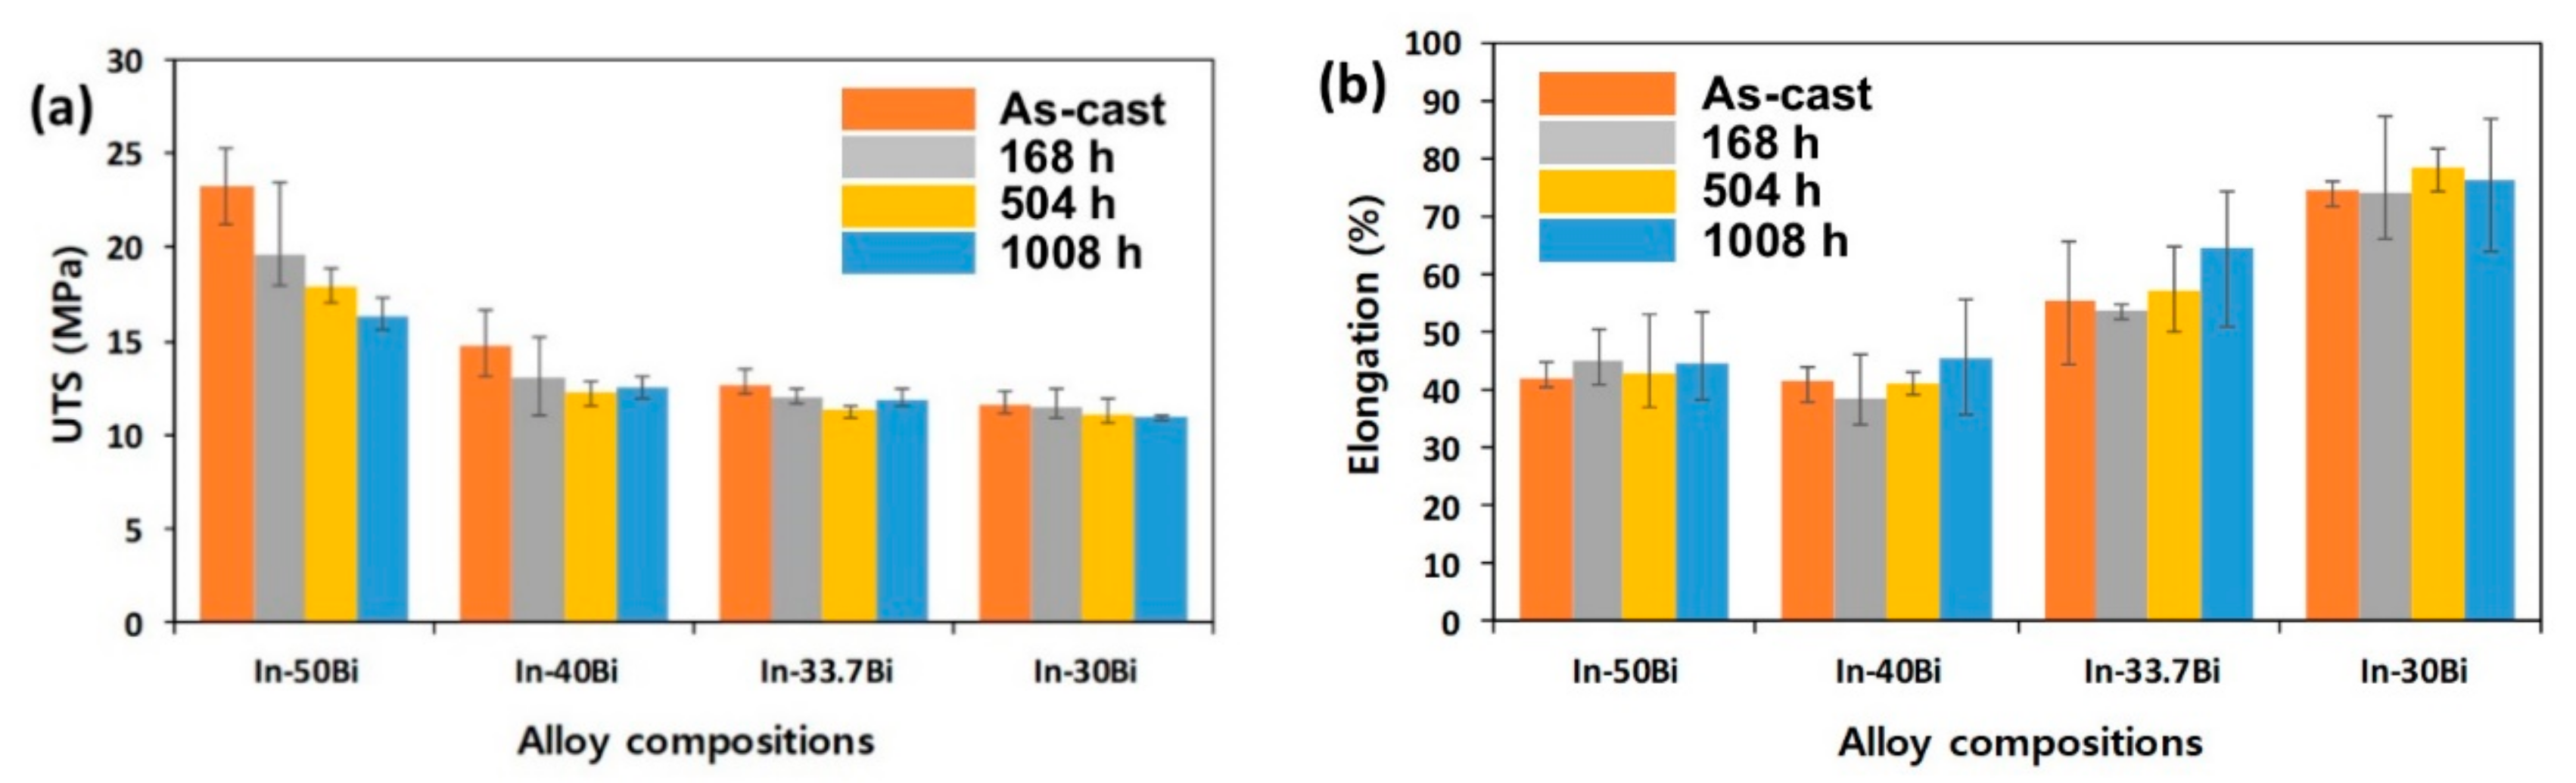
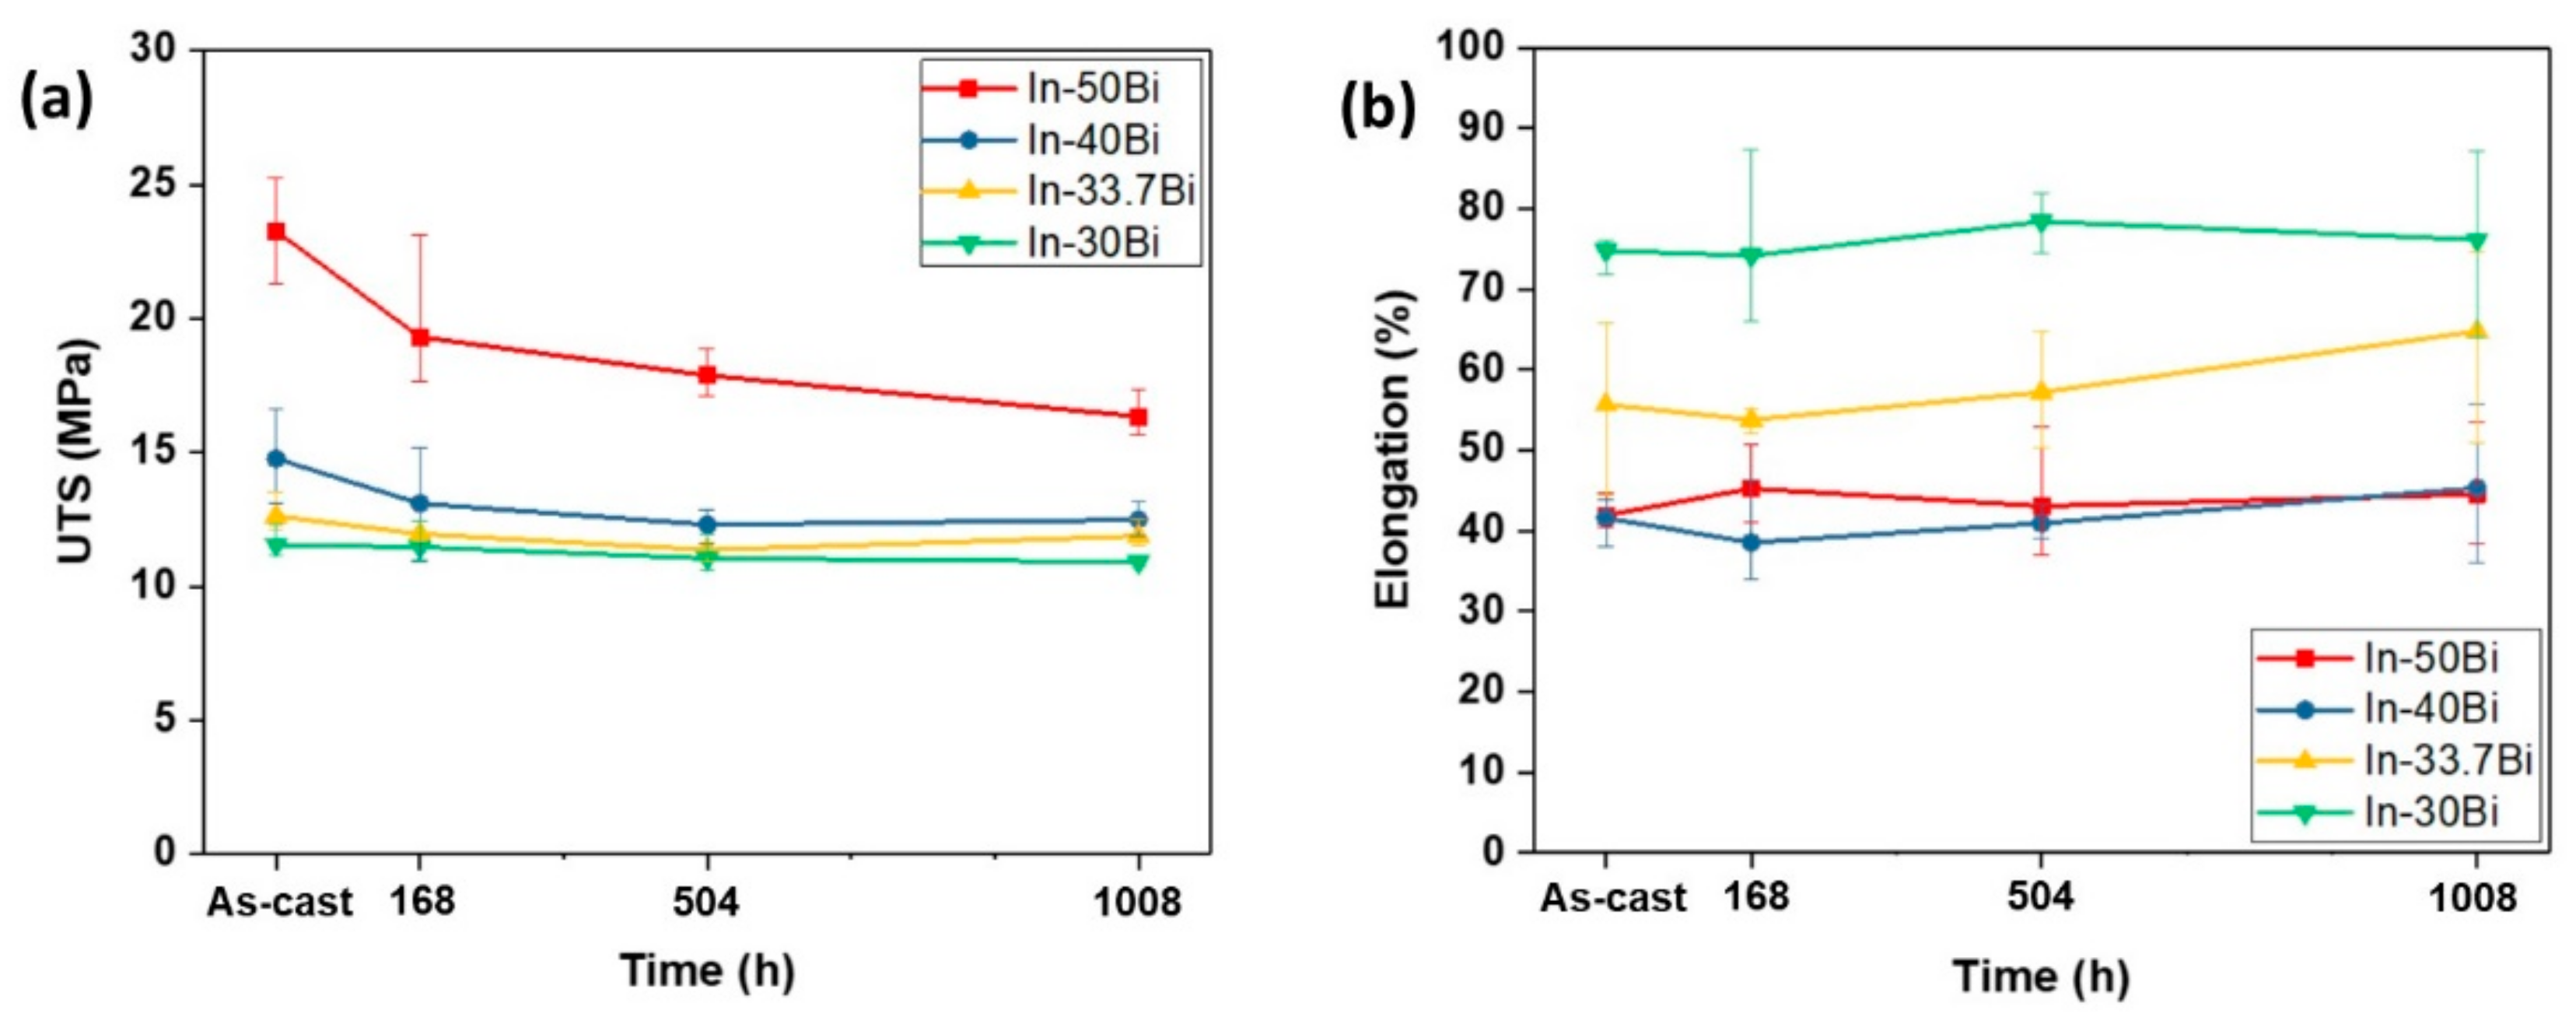
The UTS of In–Bi alloys decreased with increasing indium content and thermal aging time. However, the changes in UTS with aging time were not significant, except for in the case of In-50Bi.
(4)
The elongation of In–xBi alloys was drastically increased with increasing In content in both the as-cast and thermally aged specimens. However, the elongation behavior of these alloys did not change significantly after thermal aging. The thermally aged In–Bi alloys showed outstanding low-temperature deformation properties due to their stable thermal behaviors.
(5)
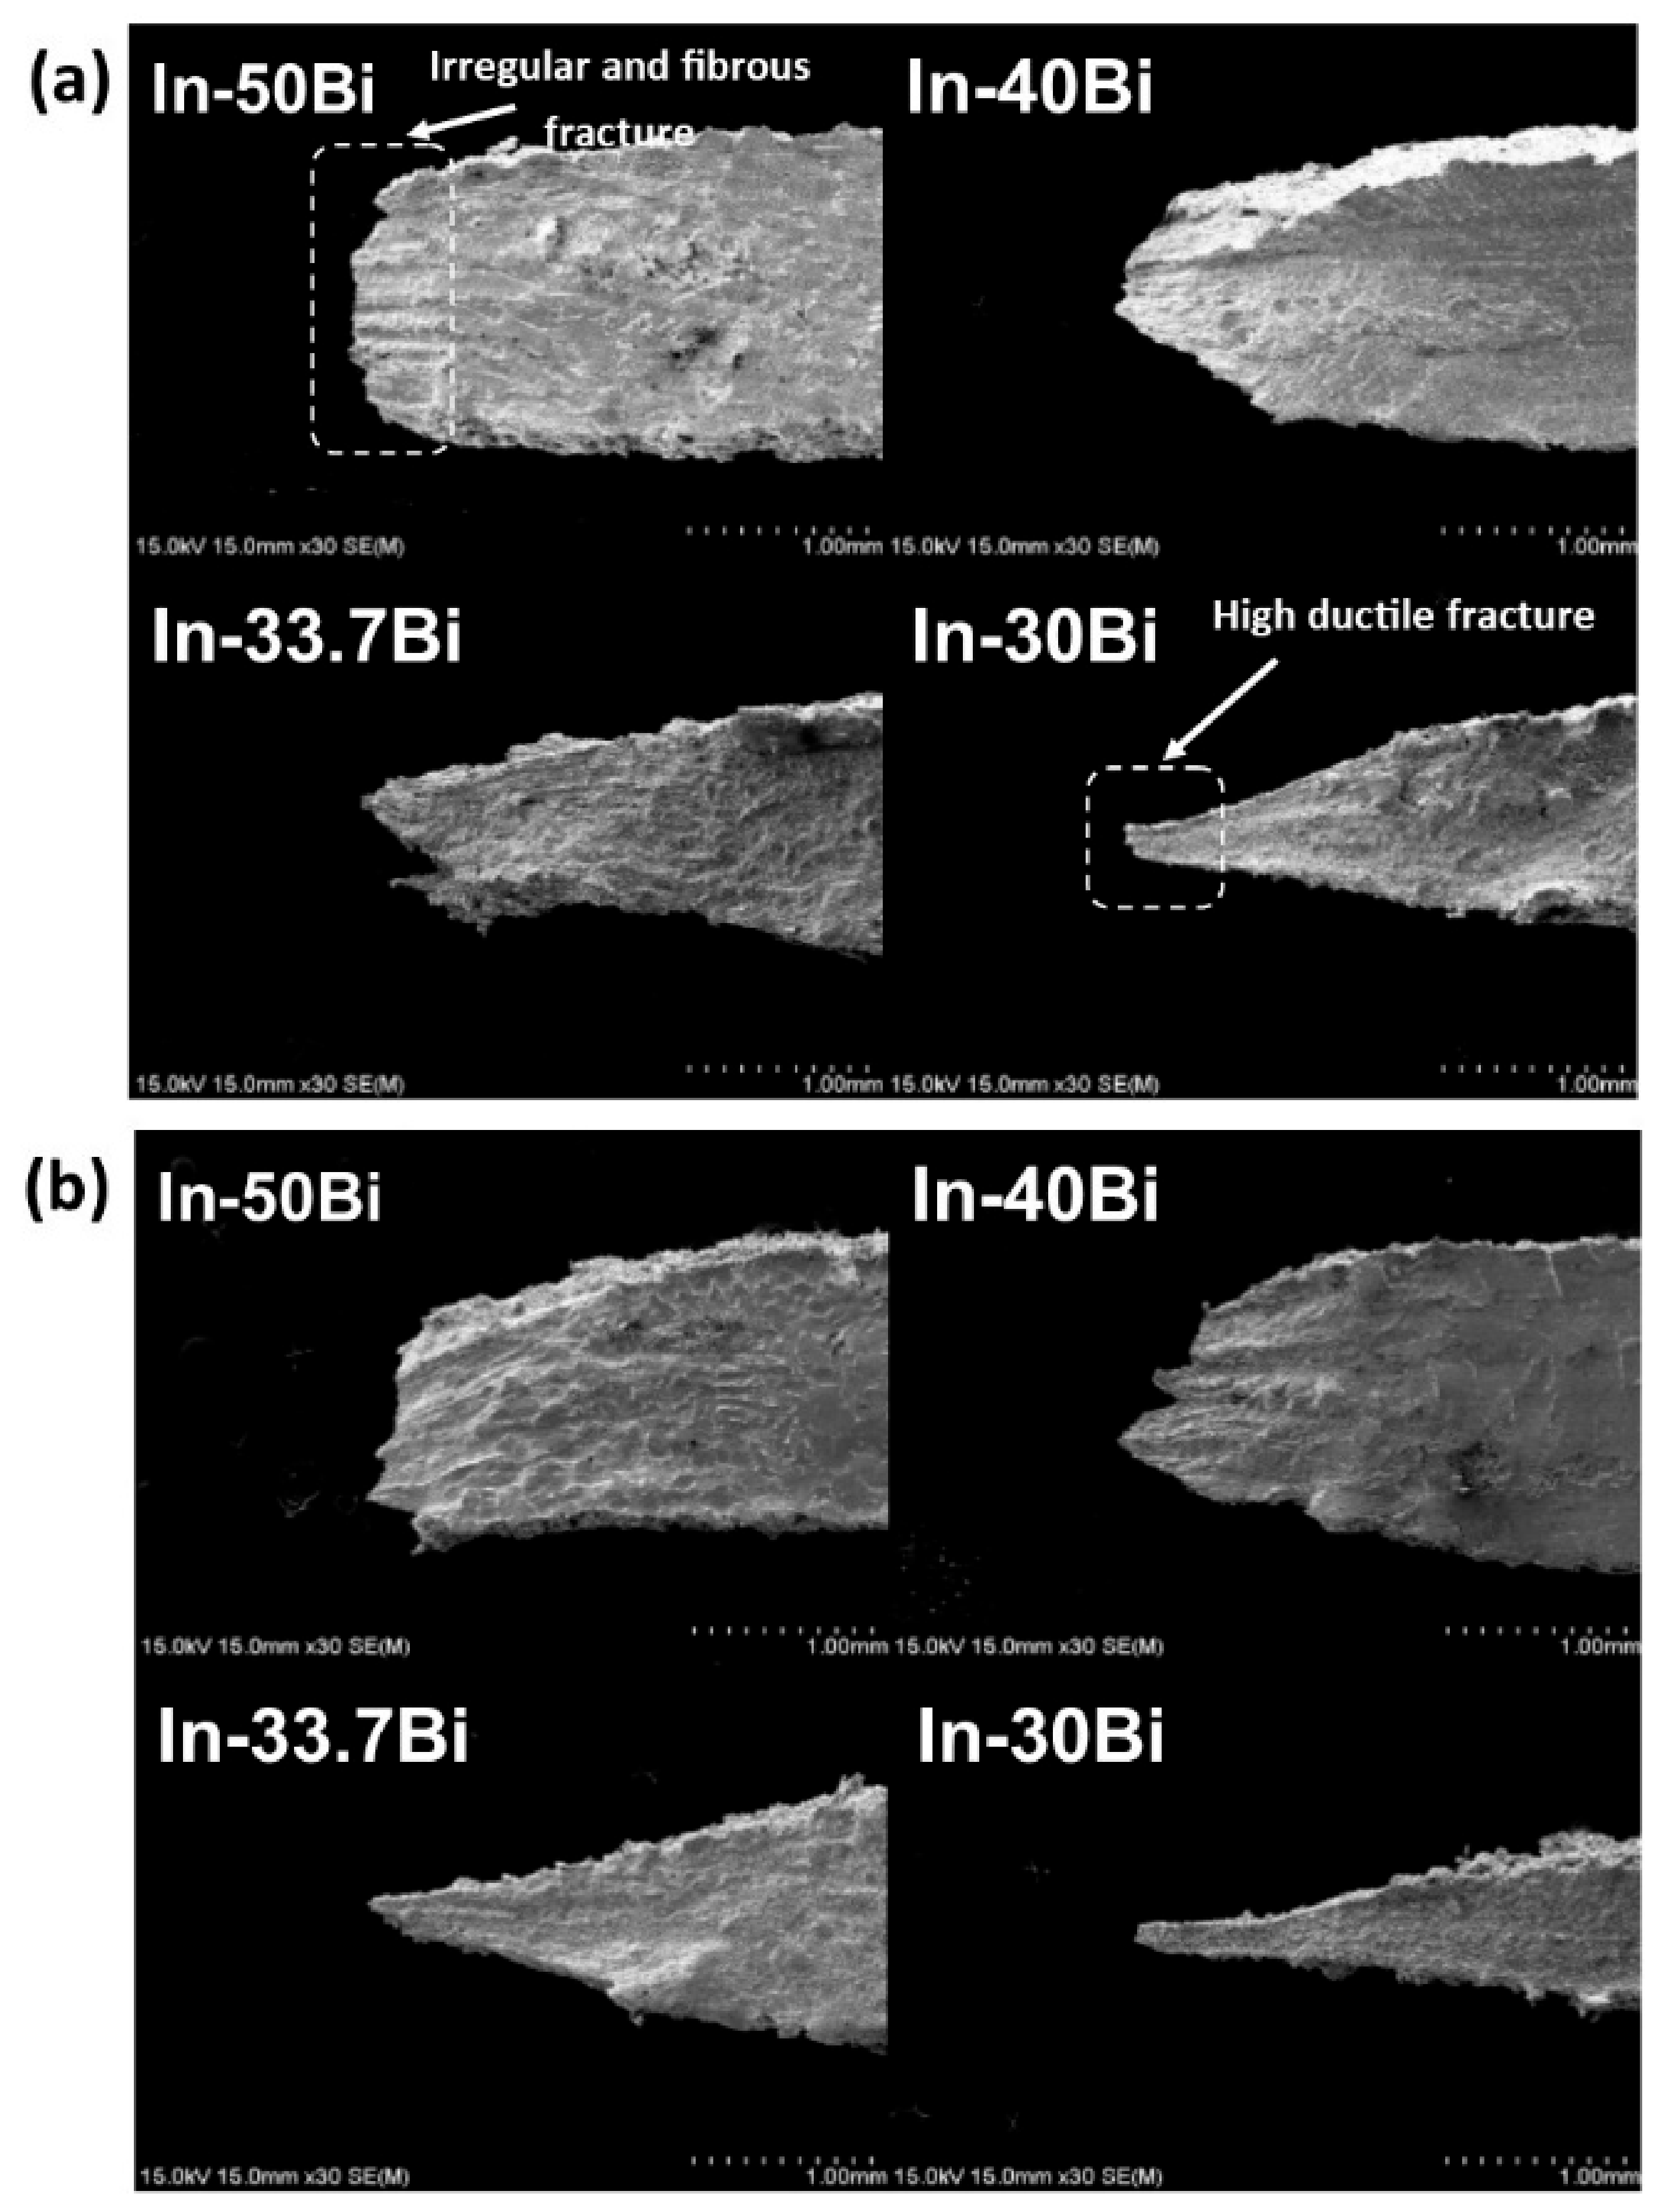
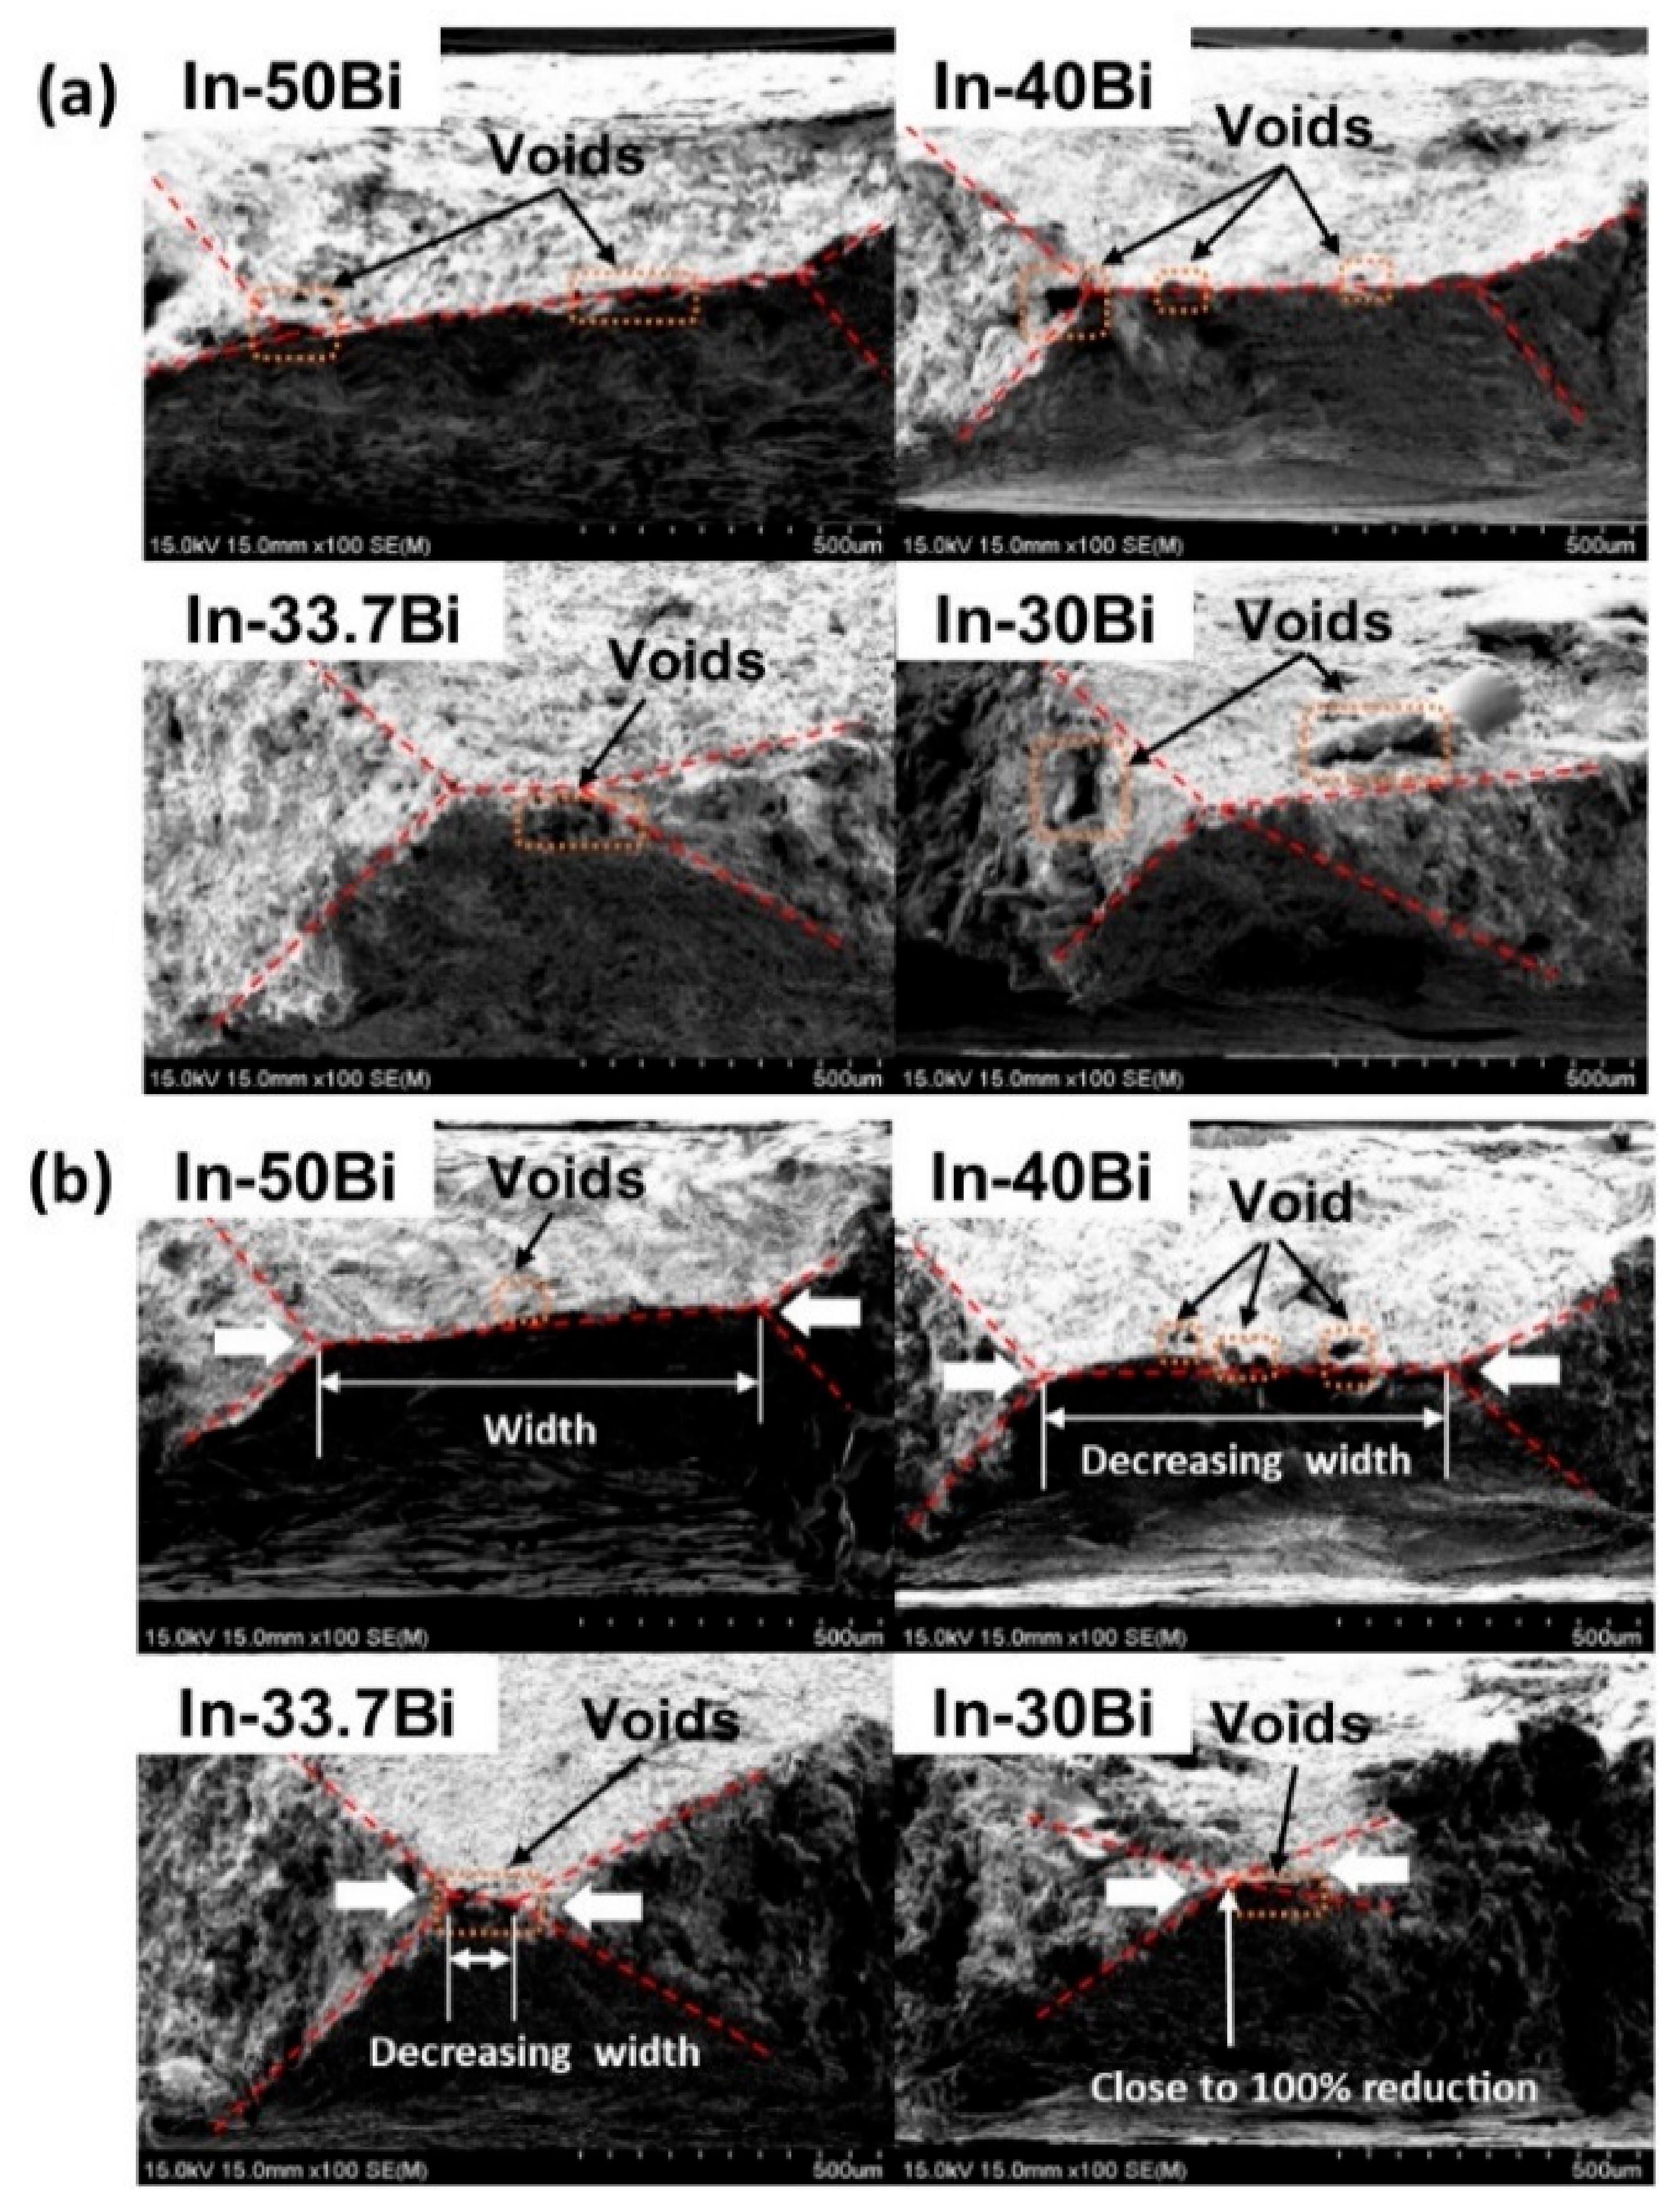
The In–Bi alloys showed typical ductile fractures. An increase in In content decreased the cross-sectional area of the tensile sample, indicating high ductility. The elongation and the area reduction remained very high at the aging temperature.
Based on these conclusions, In–xBi alloys with low melting temperatures are promising candidates for flexible electronics applications as well as for devices with PP- and PMMA-based substrates.

Author Contributions

Conceived and designed the experiments, S.J., O.M.; Performed the experiments, S.J.; Analyzed the data, S.J., S.K.; Wrote the paper, S.J.; Review and edited, O.M., H.N.

Acknowledgments

Special thanks to Junghwan Bang for his helpful suggestions and discussion in the manuscript preparation.

Conflicts of Interest

The authors declare no conflict of interest.

References

  1. Kotadia, H.R.; Howes, P.D.; Mannan, S.H. A review: On the development of low melting temperature Pb-free solders. Microelectron. Reliab. 2014, 54, 1253–1273. [Google Scholar] [CrossRef]
  2. Cheng, S.; Huang, C.-M.; Pecht, M. A review of lead-free solders for electronics applications. Microelectron. Reliab. 2017, 75, 77–95. [Google Scholar] [CrossRef]
  3. Foldable OLEDs: Introduction and Market Status. Available online: https://www.oled-info.com/foldable-oleds (accessed on 20 February 2019).
  4. Rollable OLEDs: Introduction and Market Status. Available online: https://www.oled-info.com/rollable-oleds (accessed on 07 February 2019).
  5. Flexible, Printed and Organic Electronics Forecasts 2019–2029: Players & Opportunities; IDTechEx: Boston, MA, USA, October 2019.
  6. Kalifa, P.; Chéné, G.; Gallé, C. High-temperature behaviour of HPC with polypropylene fibres: From spalling to microstructure. Cem. Concr. Res. 2001, 31, 1487–1499. [Google Scholar] [CrossRef]
  7. Koleva, M. Poly(methylmethacrylate) (PMMA). CAEDS Inject. Mould. Mater. 2014, 2, 1–5. [Google Scholar]
  8. Chowdhury, M.M.R.; Hoque, M.A.; Ahmed, S.; Suhling, J.C.; Hamasha, S.; Lall, P. Effects of mechanical cycling on the microstructure of SAC305 lead free solder. In Proceedings of the 2018 17th IEEE Intersociety Conference on Thermal and Thermomechanical Phenomena in Electronic Systems, San Diego, CA, USA, 29 May–1 June 2018; pp. 1324–1332. [Google Scholar]
  9. Gain, A.K.; Zhang, L.C.; Chan, Y.C. Microstructure, elastic modulus and shear strength of alumina (Al2O3) nanoparticles-doped tin–silver–copper (Sn–Ag–Cu) solders on copper (Cu) and gold/nickel (Au/Ni)-plated Cu substrates. J. Mater. Sci. Mater. Electron. 2015, 26, 7039–7048. [Google Scholar] [CrossRef]
  10. Gain, A.K.; Zhang, L. Thermal aging effects on microstructure, elastic property and damping characteristic of a eutectic Sn–3.5Ag solder. J. Mater. Sci. Mater. Electron. 2018, 29, 14519–14527. [Google Scholar] [CrossRef]
  11. Gain, A.K.; Zhang, L.; Quadir, M.Z. Thermal aging effects on microstructures and mechanical properties of an environmentally friendly eutectic tin-copper solder alloy. Mater. Des. 2016, 110, 275–283. [Google Scholar] [CrossRef]
  12. Suganuma, K.; Kim, K.-S. Sn-Zn low temperature solder. In Lead-Free Electronic Solders; Springer: Boston, MA, USA, 2007; pp. 121–127. ISBN 978-0-387-48431-0. [Google Scholar]
  13. Mei, Z.; Morris, J.W. Characterization of eutectic Sn-Bi solder joints. J. Electron. Mater. 1992, 21, 599–607. [Google Scholar] [CrossRef]
  14. Mokhtari, O.; Nishikawa, H. Correlation between microstructure and mechanical properties of Sn–Bi–X solders. Mater. Sci. Eng. A 2016, 651, 831–839. [Google Scholar] [CrossRef]
  15. Mokhtari, O.; Nishikawa, H. Effects of In and Ni addition on microstructure of Sn-58Bi solder joint. J. Electron. Mater. 2014, 43, 4158–4170. [Google Scholar] [CrossRef]
  16. Mokhtari, O.; Zhou, S.; Chan, Y.C.; Nishikawa, H. Effect of Zn addition on interfacial reactions between Sn-Bi solder and Cu substrate. Mater. Trans. 2016, 57, 1272–1276. [Google Scholar] [CrossRef]
  17. Kim, S.J.M.-S.; Kanayama, S.; Nishikawa, H. Microstructure and mechanical properties of indium–bismuth alloys for low melting-temperature solder. J. Mater. Sci. Mater. Electron. 2018, 29, 16460–16468. [Google Scholar]
  18. Xiao, Q.; Bailey, H.J.; Armstrong, W.D. Aging effects on microstructure and tensile property of Sn3. 9Ag0.6Cu solder alloy. J. Electron. Packag. 2004, 126, 208–212. [Google Scholar] [CrossRef]
  19. Yang, L.; Zhou, W.; Ma, Y.; Li, X.; Liang, Y.; Cui, W.; Wu, P. Effects of Ni addition on mechanical properties of Sn58Bi solder alloy during solid-state aging. Mater. Sci. Eng. A 2016, 667, 368–375. [Google Scholar] [CrossRef]
  20. Massalski, T.B.; Okamoto, H.; Subramanian, P.R.; Kacprzak, L. Binary Alloy Phase Diagrams, 2nd ed.; ASM International: Novelty, OH, USA, 1990; pp. 748–750. ISBN 978-0-87170-403-0. [Google Scholar]
  21. Reed, R.P.; McCowan, C.N.; Walsh, R.P.; Delgado, L.A.; McColskey, J.D. Tensile strength and ductility of indium. Mater. Sci. Eng. A 1988, 102, 227–236. [Google Scholar] [CrossRef]
  22. Plötner, M.; Donat, B.; Benke, A. Deformation properties of indium-based solders at 294 and 77 K. Cryogenics 1991, 31, 159–162. [Google Scholar] [CrossRef]
  23. Benzerga, A.A.; Leblond, J.-B. Ductile fracture by void growth to coalescence. Adv. Appl. Mech. 2010, 44, 169–305. [Google Scholar]
  24. Cheng, X. A Study on Indium Joints for Low-Temperature Microelectronics Interconnections. Ph.D. Thesis, Loughborough University, Loughborough, UK, 2011; pp. 74–178. [Google Scholar]
  25. Askeland, D.R.; Phulé, P.P. Microstructural features of fracture in metallic materials. In The Science and Engineering of Materials; Thomson Learning: Toronto, ON, Canada, 2003; pp. 230–233. ISBN 0-495-24442-2. [Google Scholar]
Figure 1. The geometry and size of the tensile test specimen.
Metals 09 00548 g001
Figure 2. Eutectic spacing within the eutectic In–33.7Bi alloy bulk after 1008 h of thermal aging.
Metals 09 00548 g002
Figure 3. Comparison of XRD (X-ray Diffraction) patterns for In–Bi alloys: (a) as-cast and (b) after being thermally aged for 1008 h at 40 °C.
Metals 09 00548 g003
Figure 4. Cross-sectional SEM images of In–Bi alloys: (a) as-cast and (b) thermally aged for 1008 h at 40 °C.
Metals 09 00548 g004
Figure 5. Electron probe microanalyzer (EPMA) elemental mapping results of the In–Bi alloys: (a) as-cast and (b) thermally aged for 1008 h at 40 °C.
Metals 09 00548 g005
Figure 6. Average eutectic spacing within the eutectic In–33.7Bi alloy bulk before and after thermal aging.
Metals 09 00548 g006
Figure 7. Tensile test results of In–Bi alloys: (a) as-cast and (b) thermally aged for 168 h, (c) 504 h, and (d) 1008 h at 40 °C.
Metals 09 00548 g007
Figure 8. The effect of aging on the tensile properties of In–Bi alloys: (a) ultimate tensile strength (UTS) and (b) elongation.
Metals 09 00548 g008
Figure 9. Tensile properties by indium content: (a) UTS and (b) elongation.
Metals 09 00548 g009
Figure 10. Tensile properties by thermal aging time: (a) UTS and (b) elongation.
Metals 09 00548 g010
Figure 11. Fracture surfaces of tensile specimens (side view): (a) as-cast and (b) thermally aged for 1008 h at 40 °C.
Metals 09 00548 g011
Figure 12. Fracture surfaces of tensile specimens (top view): (a) as-cast and (b) thermally aged for 1008 h at 40 °C.
Metals 09 00548 g012
Figure 13. The morphology of a ductile fracture.
Metals 09 00548 g013
Table 1. The chemical composition and onset temperature of the In–Bi alloys [17].
SampleInBiOnset Temperature (°C)
In–50Bi505088.6
In–40Bi604071.5
In–33.7Bi (eutectic)66.333.771.5
In–30Bi703071.5
Table 2. Energy-dispersive spectroscopy (EDS) point analysis results on points; A, B, C, and D.
ElementPoint A (at. %)Point B (at. %)Point C (at. %)Point D (at. %)
Bismuth37.833.42.233.1
Indium62.266.697.866.9
Total100100100100
Estimated phaseBi3In5BiIn2In-richBiIn2

