Abstract
Recent literature results have highlighted the role of small transition metal and intermetallic nanoparticles supported on graphene as catalysts for many key applications in energy and commodity chemicals industries. Specifically, metal nanoparticle catalysts down to sizes of 4 and even 1 (single atom catalysts) on graphene have been studied for the Oxygen Reduction Reaction (ORR). A recent study showed that 4-atom transition metal intermetallic nanoparticles (NP) on graphene (metal-decorated graphene (MDG)) even generate a predictive Volcano Plot for ORR activity. Initial results from that study were not completely explained, and an expanded analysis and discussion built from that work is presented in this manuscript. Specifically, in this new work, the original Volcano Plot for 4-atom MDG NP catalysts for the ORR is analyzed for its counter-intuitive thermodynamic inversion between the rate limiting steps of O* hydrogenation and OH* hydrogenation. The Volcano Plot is then further studied for dependence on solvent correction energy, system pH, and with an initial probe on the sensitivity of descriptor values on doping of the graphene support via B and N atoms. Recommendations for optimum 4-atom MDG NP catalyst operation for the ORR are provided, and directions for future work and study are provided.
1. Introduction
Graphene and graphene-metal hybrid systems have received considerable attention recently as a novel material(s) for applications in catalysis. Specifically, graphene itself has been considered in the context of both being an active catalyst for reactions such as the ORR, OER, HER, NRR, and more (the Oxygen Reduction, the Oxygen Evolution, the Hydrogen Evolution, and the Nitrogen Reduction Reactions, respectively). It has also been functionalized, doped, and used as a support for nanoparticle anchoring (metal-decorated graphene (MDG)) [1,2,3,4].
In this work we present a detailed expansion, examination, and explanation of the results from recently presented calculations to further examine the extent to which MDG (via small 4 atom nanoparticles) can function to effectively up or downshift the adsorption energy of oxygen and hydroxyl species [5]. (These species typically function as a proxy for reaction activity for the ORR in general [5,6,7,8,9,10].) The hydrogenation of oxygen to hydroxyl is often the slowest or next to slowest step in the oxygen reduction reaction when considered on oxophilic base metal catalyst surfaces; the thermodynamics of these steps alone is often limiting regardless of and in addition to the kinetic overbarriers. As the ORR currently relies on platinum-based or platinum-metal-group (PMG) based catalysts for high rate and efficiency (low overpotential), we seek to understand and identify novel materials which may someday help replace PMG-based catalysts for this reaction. To do so, we are currently focusing on a broader understanding of the ability of predictive DFT calculation-based Volcano Plots to identify more economical and sustainable catalyst NP for ORR on subnanometer MDG ORR catalysts across ranges of pH and solvation stabilization; some of the systems in this study use rare and PMG elements to help understand relative trends in activity/performance, and to further strengthen the statistical validity of the scaling relations used to generate the Volcano plots. As will be discussed in the results and future work suggestions, we have identified where some composition, pH, and solvation interplay indicate it might be possible to engineer 4-atom or related subnanometer MDG ORR catalysts that outperform their PMG neighbors on the Volcano Plot. The reasons for this interesting outcome involve the change in OH* and O* thermodynamics of adsorption on PMG vs non-PMG ORR catalysts at these size limits. Specifically, recently published results for an overall Volcano Plot for the ORR on these types of materials (4 atom MDG across alloy/intermetallic composition, including some PMG systems) showed intriguing but counter-intuitive results [5]. Specifically, results show that there was no regime whereby hydrogenation of O* to OH* was the identified rate limiting step (RLS) in the overall reaction pathway [8,11]. This result would seem to be at odds with the typical observation on single crystal metal surfaces of strongly oxophilic base metals where O* hydrogenation is hypothesized to be the RLS [6,7,8,9,10,11,12,13,14]. Because 4 atom NP of transition metals on MDG are even more undercoordinated than the corresponding single crystal surfaces of such catalysts typically studied for the ORR, it might be expected that highly oxophilic 4 atom MDG NP would be even more susceptible to oxygen poisoning or a larger regime where O* hydrogenation is the RLS [6,7,8,9,10,11,12,13,14]. However, this was not observed. In fact in the recently published work, the entire “oxophilic” regime was found to share a RLS that involved the hydrogenation of OH* to water [5].
The results presented in this work show in detail and help explain this interesting and counter-intuitive observation and the conditions under which it may persist. The metals chosen to construct the intermetallic NP in this work were selected based on previous calculations for theoretically stable NP on MDG and which span the inner d-block of the periodic table and could-potentially-lower the cost for ORR catalysts if their activity can be made to match that out state-of-the-art Pt catalysts. Specifically, we highlight an inversion of the typical high endergonicity of this reaction step on the “base metal” like MDG NP studied. Further, we explain why there is a crossover between the coinage metals and the base metal intermetallics studied and why the overall stability of OH* on these MDG NP systems is novel and important for their role as possible next-gen ORR catalysts. We provide a discussion on the effects of solvation, pH, on the predicted ORR activity of these systems, while also acknowledging the limits of this approach and the inability to guarantee stability or durability of all systems at all conditions examined. Finally, we present a small set of initial results for down and upshifting of O* and OH* energies on doped graphene for the best MDG NP identified at the conditions reported in this manuscript. Our work in this manuscript provides a detailed examination of the boundaries on the range of which small, subnanometer intermetallic NP may present for O* adsorption energies, ORR activity, and ORR overpotential, and points the direction for future efforts to further search and screen for efficient, Pt-free ORR catalyst systems in the future.
2. Materials and Methods
To determine the detailed structure and energetic difference analysis of the aforementioned catalyst-support systems, plane-wave Density Functional Theory (DFT) calculations were performed using the Vienna Ab-Initio Simulation Package (VASP), as implemented in MEDEA-VASP, supplied by Materials Design [15,16,17,18,19,20]. Calculations were run by placing M4−xNx intermetallic/alloy nanoparticles (where M and N were differing transition metals) on a graphene “slab” one layer thick. Local structure optimizations were performed on all atoms in the calculated system.
Calculations were performed with the VdW corrected opt-PBE functional, with a Methfessel- Paxton fermi smearing width of 0.2 eV [21,22,23,24,25,26,27,28]. Calculations were performed at the gamma k-point, with self-consistent convergence of the electronic ground state to at least 10−5 eV. Structural minimizations were performed until the total force on all relaxed atoms were below total magnitudes of 0.03 eV/Å. The structures described in this manuscript were all placed in a total surface cell containing at least 16 Å of vacuum (16 Å having been identified as a spacing that achieved convergence of total energy per cell and minimal Bader charge on the “vacuum”). Surface supercells were constructed to minimize effects from lateral particle-particle interactions; as such, cells were large enough that metal nanoparticles were separated by at least 8 Å in x and y directions (more specifically, the in-plane directions as measured relative to the plane of graphene). Dipole corrections were applied in the direction parallel to the surface normal although prior work showed the magnitude of this effect to be minimal [5]. Free energies were computed in the formalism previously adopted [5,8,9]. For the remainder of this manuscript, denotation of species with a tailing superscripted * indicates they are chemisorbed to an MDG NP. An example of O* therefore means chemisorbed monoatomic oxygen on the corresponding MDG NP. Figure 1 shows a representative structure graphic of the materials studied and reported in this manuscript.
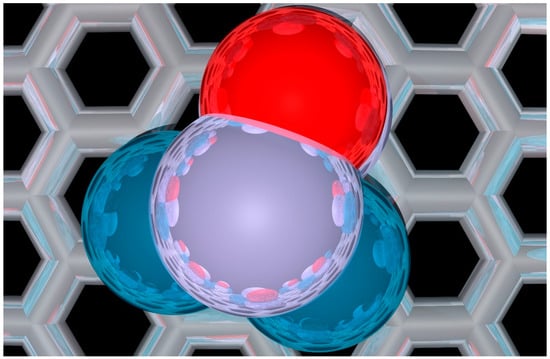
Figure 1.
Representative top-down view of a 4 atom metal-decorated graphene (MDG) nanoparticles (NP) as studied in this work. Specifically in this figure, O* adsorbed on Pd2Pt2 is shown. Pd in dark blue, Pt in lavender, Graphene in silver, and Oxygen in red.
3. Results and Discussion
3.1. Further Understanding Bandwith and Correlations for Hydrogenation of O* and OH* on Graphene (Counter-Intuitive Trends Explanation)
Adsorption energies in the context of this paper refer to the DFT Energy of the adsorbed species on the catalyst/support minus the sum of the species in the gas phase and the decorated graphene/nanoparticle ‘surface’. This convention is denoted in the Equation (1) below.
These energies can be further extrapolated to free energies by accounting for change in entropy upon adsorption, zero point energy, and pH via the established approach of Nørskov et al. [8]. The adsorption energies of O and OH are presented in Figure 2 and Figure 3 that follow. There are several interesting effects to be observed in each plot. Firstly, it should be noted in Figure 2 that the adsorption energy of monoatomic oxygen (O*) on these materials varies from approximately −5.5 eV to almost 0.0 eV (a bandwidth of 5.5 eV). This bandwidth is much larger than that seen on typical single surface face transition metal catalysts [5,6,8,9,10,12]. Next, the same level of analysis can be applied to surface bound hydroxyl (OH*), as is presented in Figure 3. Here these materials’ adsorption energies vary from approximately −5.5 eV to almost −2.00 eV (a band width of 3.5 eV). It may not be immediately clear from Figure 2 and Figure 3 whether these values are correlated in a linear fashion. However, previously published work has shown that overall there is enough ‘linearity’ in these systems and related systems to generate predictive volcano plots for the overall reaction mechanism(s) being postulated [5]. Specifically in the case of subnanometer MDG for the ORR (this work), the volcano plot(s) so far revealed but have not explained counter-intuitive results for base metal behavior in the ultra-small size regime of 4-atom NP. Figure 2 and Figure 3 also show separately the similarities and differences for each species, catalyst, and site type for adsorption. The volcano plot(s) presented in this work involved a set of all typical ORR reaction mechanisms and elementary steps typically studied in aqueous media, including: O2 dissociation, O hydrogenation, OH hydrogenation, O2 hydrogenation, OOH dissociation, and H2O desorption. The specific elementary steps which form the RLS and volcano presented in this manuscript include OH hydrogenation/removal on the oxophilic side of the volcano, and O2 hydrogenation and dissociation on the oxophilic side of the volcano [5].
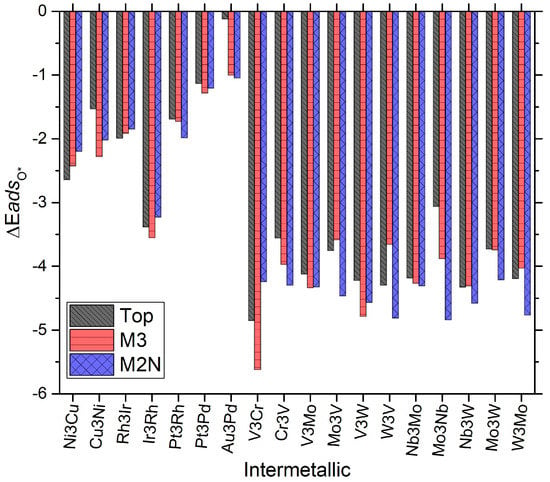
Figure 2.
Plot of energy bandwidths for adsorption of monoatomic oxygen (O*) on the candidate systems studied in this work for 4 atom MDG NP. Various site types are presented in each set of the columns. Energies given are in units of eV/mol. The formalism/reference state for calculating the energy is given in Equation (1).
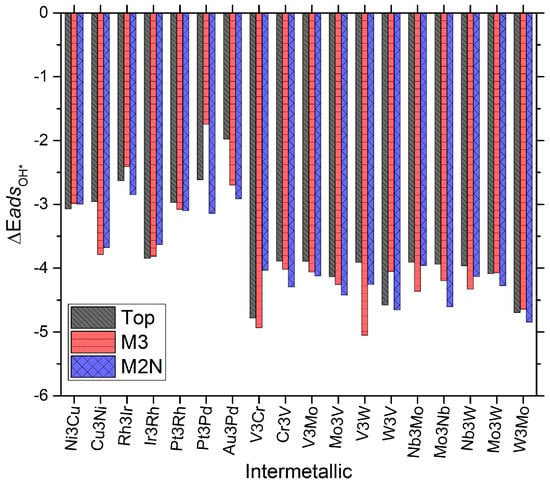
Figure 3.
Plot of energy bandwidths for adsorption of hydroxyl (OH*) on the candidate systems studied in this work for 4 atom MDG NP. Various site types are presented in each set of the columns. Energies given are in units of eV/mol. The formalism /reference state for calculating the energy is analogous to that given in Equation (1) for O*.
We will return to our explanation of this effect later in the manuscript. Before doing so, it is obvious that several trends however do seem to immediately stand out from visual inspection of Figure 2 and Figure 3. The top site is almost never the lowest energy site on these nanocatalysts. Of most important interest, we must point out the following:
Though it may (have been) be possible to intuitively deduce so a priori, AuPd intermetallics are the weakest oxygen binding species, (even more so than Au4 MDG NP) and hydroxyl bonding species as well; a somewhat surprising result given small particle size and the known behavior that AuPd can be tuned as novel and industrially viable peroxide synthesis catalysts with appreciable rate [9,29,30].
Figure 4 shows the striking similarity across all the possible compositional space and site-type space of the MDG materials reported in this work. Specifically, in Figure 4 we report the strong correlation between the OH* and O* binding energies as an ensemble. It can be seen from the reported statistics that the correlation is strong even though the bandwidths of O* and OH* adsorption energies are large and distributed. The reported slope of ~0.5 for the linear correlation fit of the adsorption energy of ΔEadsOH* to ΔEadsO* across the various compositions and site-types is striking. This is because the typical slope reported for this correlation on the low Miller Index single crystal surface of the transition metals is typically on the order of 0.5 as well. This has traditionally been speculated or hypothesized to be intuitive due to the argument of bond-counting. That is to say- because H forms a shared covalent pair with one of the lone pair electrons in O, the bonding to the “surface” (here, NP) should scale as approximately 50% as strong as that of O* itself which can use both lone pair electrons to form chemisorption bonds to a surface it is interacting with. The results in this work show this hypothesis can generalize out to the smallest of metallic NP across all compositions and site-types and the general argument seems to hold. We are not aware of an exhaustive test of this to date in the literature. Although there is scatter in the data, the correlation r-square of ~0.84 is as good as or better than those reported in other subnanometer catalyst studies in the literature [5,31,32,33,34,35,36].
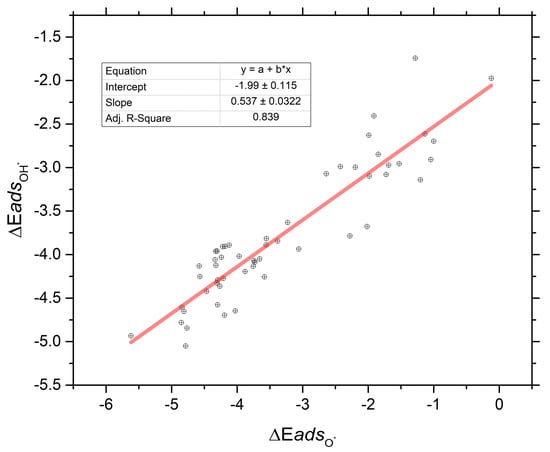
Figure 4.
Plot of the correlation of the hydroxyl (OH*) adsorption energy on the MDG NP in this work to that of the corresponding monoatomic oxygen (O*) adsorption energy on the same MDG NP and site(s). The slope, intercept, and R2 values are reported for the simple linear fit to the data. Energy units for this plot are the same as those in Figure 2 and Figure 3; ev/mol.
Figure 5 shows another effect that comes from the determination of the linear scaling relation in the ΔEadsOH* to ΔEadsO* data shown in Figure 4 and previously reported and now in discussion and clarification in this manuscript [5]. Although the slope of 0.5 is similar to that previously reported in the literature for those species on single-crystal metallic surface of low Miller Index, the intercept is much more pronounced (more negative by ~0.5 to 1.0 eV). In this context, the intercept relates to the overall difference in the thermodynamics of forming these species, regardless of the specific surface they chemisorb to. Because in our work in this manuscript graphene does not typically fully chemisorb the metallic NP, they can be much further stabilized by adsorption and formation of O* and OH* than low energy stable surfaces of single crystal metal NPs can be. Specifically in this case, the intercept difference is enhanced by between 0.5 eV and 1.0 eV relative to the typical values previously reported. In other words, OH is more stable on these types of MDG NP than it is on the correspondingly strong (or weak) binding O* value on a single crystal face-centered cubic (FCC) (111) type metal surface. This effect has two pronounced consequences. One was previously seen and reported (although not discussed).
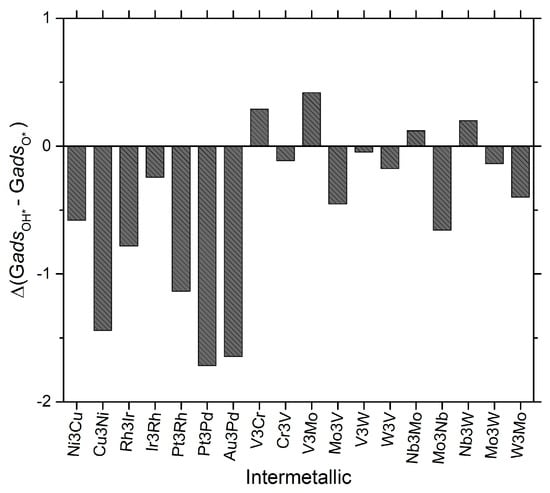
Figure 5.
A plot of the free energy of formation for the hydrogenation of O* to OH* is given for some of the candidate materials studied in this work. For this plot, the data given shows the difference in free energy of the lowest energy site of OH* and the lowest energy site of O* on a given MDG NP. This is in the spirit of the Volcano Plot analysis previously identified in the literature [5]. In the formalism of this manuscript, negative sign convention in this plot denotes exergonic reaction steps. Units of the plot are given as ev/mol.
1. That first effect is that the identified Volcano plot for the ORR on these types of MDG catalyst systems only has OH* removal as a possible rate limiting step on the “strongly oxophilic” regime of the volcano. This is contrary to previously reported works on single crystal, and especially single crystal PMG, catalysts where O* hydrogenation to OH* was typically considered as a potential RLS as well. One might assume that stronger binding (on a relative basis) small metal NP would therefore be even more susceptible to O* hydrogenation to OH* as a possible RLS for the ORR. As an example, Fe surfaces might even just form O* poisoned surfaces and reconstruct into FeO. However, as we have reported, this is not the case, even on the most oxophilic of base metal subnanometer MDG NP catalysts 1.
2. The answer to why this is observed comes from the data presented in the correlation in Figure 4 and the data shown explicitly in Figure 5. Figure 5 in fact shows there is a marked inversion in the qualitative and quantitative behavior of the ΔGadsOH* to ΔGadsO* formation between the MDG NP composed of more base-metals and those of more precious-metals composition. Because OH* is more stabilized (compared to single crystal surfaces previously studied in the ORR), on the weaker binding O* MDG systems, OH* formation becomes more exergonic. These materials typically have OOH* formation or cleavage as the RLS in the ORR formation on both the MDG systems reported in this work, as well as the traditional single crystal surfaces extensively studied to date. However, as oxophilicity of the MDG increases, OH* formation energies become subject to a competition between the stabilizing effect they have on the MDG NP itself as well as the overall enhanced bonding due to the oxophilicity of the MDG NP itself. Around a value of ΔGadsO*~ = −3 eV, the transition occurs whereby this step in the ORR reaction mechanism switches from strongly exergonic to approximately thermoneutral (with some specific fluctuations above and below 0 as seen in Figure 5). This result explains why in our previously reported volcano plot, that even on small 4 atom NP with very large bandwidths of energies for formation of O* and OH*, there is no regime observed in the Volcano plot for ORR where the O* hydrogenation step is rate limiting.
Of further note, Pt/Pd systems, which are among the hypothetical best ORR catalysts for alloys made into larger NPs/single-crystal surfaces, show almost the most exergonic character for this specific reaction step in the overall ORR mechanism for these catalyst systems. This result implies there is clearly a size limit beyond which Pt or Pt-Pd based ORR catalysts must be critically limited in their overall performance due to this strong stabilization of OH* on them as ORR/MDG catalyst systems.
3.2. Sensitivity of Correlations and Volcano Plot to effects of Solvation and/or pH
In the preceding section, results were presented and discussed in the context of expanding on phenomena previously reported but not thoroughly explained; in this case, the inversion of the thermodynamic nature of various mechanistic steps in the overall ORR process on MDG NP. However, concerning the discussion in the preceding section(s), the free energy analysis, Volcano Plot(s), and conclusions were based on the approach of Nørskov et al and used a common solvation energy correction for potentially H-bond stabilized species (such as OH*), and assumed reaction to only occur at a condition of pH = 0 [5,8,9,12]. Such an approach carries numeric limitations which might bias the conclusions drawn from a Volcano Plot study based on the corresponding assumptions and approximations; specifically, the relative location of various MDG NP with respect to the Volcano Plot maximum, as well as the shape, and rate at the Volcano Plot maximum may shift with changes to either the assumed solvation correction for H-bound species or for operation at differing pH.
In this section, results are presented which examine the effect(s) of changes to both solvation correction energy, as well as pH. For consistency with the known fact that ORR mechanisms can shift to using OH- instead of H+ in alkaline media, we have not studied the effects past pH = 7 in this manuscript. In Figure 6, results are presented which at pH = 0 vary the solvation correction from −0.45 eV/mol for each bond of an H-bound species to a value of 0.00 eV. These values correspond to the value used initially (−0.45 eV) in the previously reported study to a value of 0.00 eV, which implies that there is no physical or electrostatic stabilization of species such as OH* on the MDG NP when surrounded by aqueous solvent. While the latter case is likely not a physically relevant assumption, it provides an opposite limit for the possible behavior of this case of catalyst-support system for aqueous electrochemical ORR. The likely case for real working systems should possibly be an intermediate solvation correction energy—perhaps something like −0.35 or −0.20 eV/mol for each bond. Volcano Plots corresponding to values in this range are also presented in Figure 6. Figure 7, Figure 8 and Figure 9, respectively reveal the effects of the same type of sensitivity analysis for solvation correction energy, but at pH = 1, 3, and 7, respectively. (We note that larger size images of the plots in Figure 6, Figure 7, Figure 8, Figure 9, Figure 10 and Figure 11 are given as separate files/figures in the supplied Supplementary Information document, Figures SI.1 through SI.5, respectively). Figure 10 shows the effect of pH at a solvent correction energy of −0.20 eV/mol. We would like to point out that in the Volcano Plots, Figure 6, Figure 7, Figure 8, Figure 9 and Figure 10, the color axis for activity is given as log10 of the maximum thermodynamic activity of the mechanism(s) studied. The maximum activity with a thermodynamic overbarrier of 0 eV at the RLS would therefore have an activity of 1012 if a prefactor of 1012 was assumed for all steps (as was done in this analysis). This activity is in the spirit of previous treatments in the literature as pioneered by Norskov et al. [8]. At 298 K, therefore, a maximal thermodynamic barrier of 0.4 eV would correspond to a predicted activity of 105 s−1.
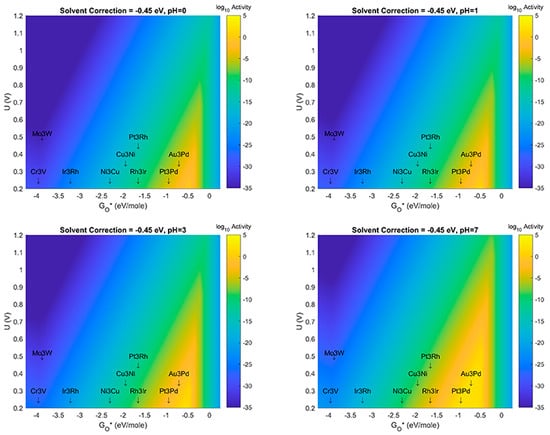
Figure 6.
Volcano Plot analysis for Oxygen Reduction Reaction (ORR) activity at solvent correction value of −0.45 eV. Top left (pH = 0), Top right (pH = 1), Bottom left (pH = 3), Bottom Right (pH = 7). Blue denotes lowest activity, yellow denotes highest activity. All plots use same color-axis scale hence some saturation at maximum activity and minimum activity. Activity given in log10 scale to show more detail in plot (For Figure 6, Figure 7, Figure 8 and Figure 9, zoomed in level plot details are given in the Supporting Information, Figures SI1 through SI4, respectively).
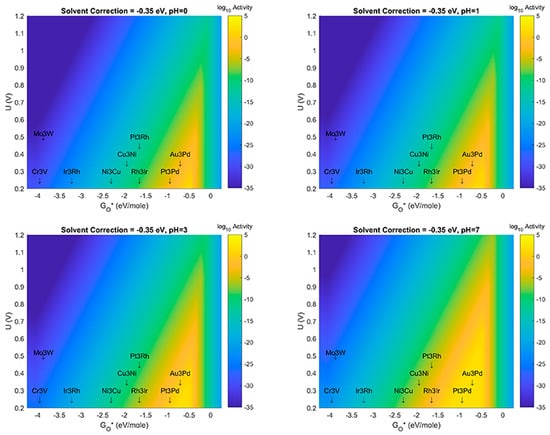
Figure 7.
Volcano Plot analysis for ORR activity at solvent correction value of −0.35 eV. Top left (pH = 0), Top right (pH = 1), Bottom left (pH = 3), Bottom Right (pH = 7). Blue denotes lowest activity, yellow denotes highest activity. All plots use same color-axis scale hence some saturation at maximum activity and minimum activity. Activity given in log10 scale to show more detail in plot.
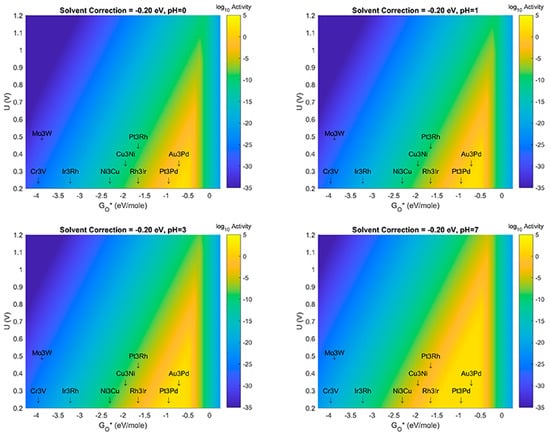
Figure 8.
Volcano Plot analysis for ORR activity at solvent correction value of –0.20 eV. Top left (pH = 0), Top right (pH = 1), Bottom left (pH = 3), Bottom Right (pH = 7). Blue denotes lowest activity, yellow denotes highest activity. All plots use same color-axis scale hence some saturation at maximum activity and minimum activity. Activity given in log10 scale to show more detail in plot.
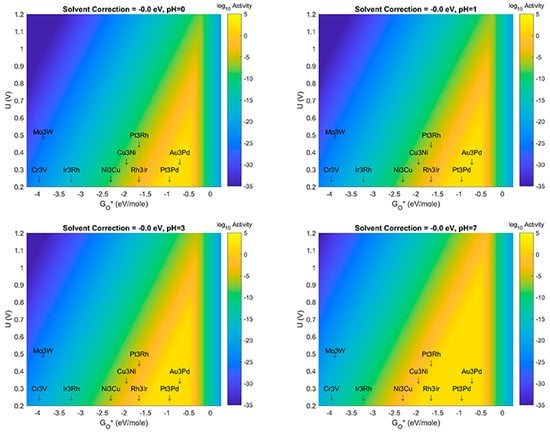
Figure 9.
Volcano Plot analysis for ORR activity at solvent correction value of −0.00 eV (no solvent correction to free energy of system). Top left (pH = 0), Top right (pH = 1), Bottom left (pH = 3), Bottom Right (pH = 7). Blue denotes lowest activity, yellow denotes highest activity. All plots use same color-axis scale hence some saturation at maximum activity and minimum activity. Activity given in log10 scale to show more detail in plot.
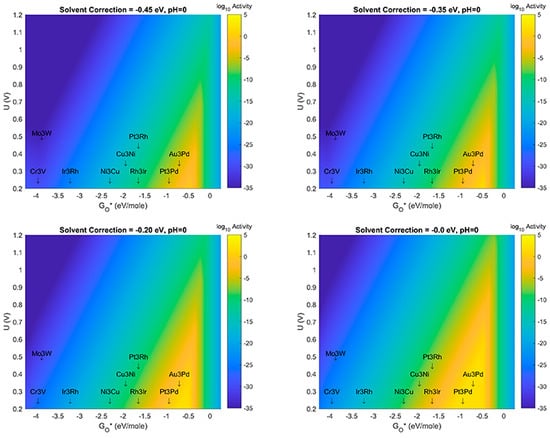
Figure 10.
Volcano Plot analysis for ORR activity at pH = 0. Top left (Solvent correction = −0.35 eV), Top right (Solvent correction = −0.45 eV), Bottom left (Solvent correction = −0.20 eV), Bottom Right (Solvent correction = −0.00 eV). All plots at pH = 0. Blue denotes lowest activity, yellow denotes highest activity. All plots use same color-axis scale hence some saturation at maximum activity and minimum activity. Activity given in log10 scale to show more detail in plot.
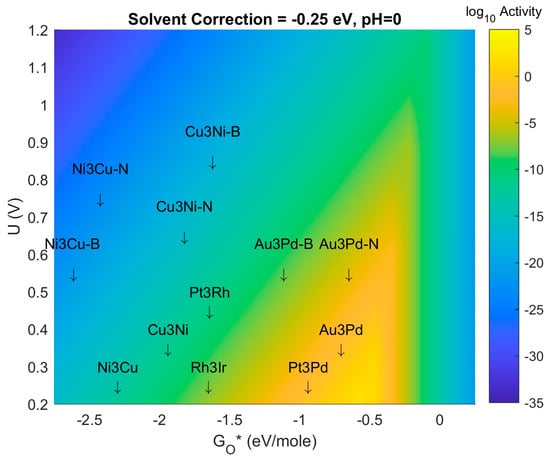
Figure 11.
Volcano Plot with calculated descriptor values for 4-atom intermetallic MDG NP on B-doped and N-doped graphene. “-B” denotes Boron doping, “-N” denotes Nitrogen doping. Same color scheme and unit conventions as previously used in prior Volcano Plot(s) in this manuscript.
The results shown in Figure 6, Figure 7, Figure 8, Figure 9 and Figure 10 show several important observations that merit discussion and consideration for future study. First: the stabilization of OH* compared to O*, as described in previous section(s) of this manuscript, is likely sensitive to effects of solvent correction and pH, at certain extrema. Second: as the solvent correction energy increases (becomes less negative) the effect on the Volcano plots is a broadening of the ’horizontal’ width of the Volcano Peak combined with a ’vertical’ broadening of the area around the peak and an increase in the amount/size of the peak with maximal activity (decrease of the overpotential). This suggests that if in fact our initial assumption on the strength of solvation was overly generous, the catalyst systems reported in this work may offer better overpotential performance (yellow regions moving up the y-axis) and extend to more possible candidate materials (yellow regions growing wider on the x-axis). Third: as the effect (strength) of the solvation correction is reduced, the width of the Volcano Peak at the lowest potentials widens with pH to approximately 1.0, 1.25, 1.50, and 1.75 eV, respectively. Fourth: at a constant pH, the effect of changes to the solvent correction energy can cause the predicted overpotential to change by more than 0.3 eV (Figure 10). Fifth: That at certain ranges of solvent correction energy and pH, Cu3Ni catalysts start to fall on the border of the yellow region of the Volcano Peak; this is a critical result which hints that it may eventually become possible to engineer Pt-free ORR catalyst systems which offer competing activity and current density to state-of-the-art Pt-based ORR catalysts for PEM Fuel Cells. The optimal materials for operation of ORR electrocatalysis using small 4 atom intermetallic NP on MDG could potentially include less rare and costly constituent elements than Pt; these include Au, Pd, Rh, Ir, Cu, and Ni in various compositions. At the likely pH and solvent stabilization of real working fuel cells, not all of these systems may be thermodynamically or kinetically stable; however, our results provide context for the limits upon which systems may perform and the theoretical overpotentials which they may achieve. Specifically, metallic NP such as Cu3Ni are not likely to be stable on MDG at pH values of 0 or 1; working ORR MDG Cu3Ni would likely need to be operated at weaker pH to prevent dissolution of durability issues, or larger catalyst NP would potentially overcome this issue [35,36,37,38,39,40]. (We note larger catalyst NP to be studied are beyond the scope of the work in this manuscript). A way to compensate for the activity (overpotential losses) associated with such a shift could be to modulate the effect of the solvent correction by using unreactive bystander species that promote H-bonding as H2O does, or to further stabilize the intermetallic NP to the graphene support through the use of dopants in the graphene that may more strongly chemisorb the NP than pure graphene does. A discussion of the possibilities of this latter effect is given in the next subsection of this manuscript. The strongest outcome of this approach while acknowledging the possible limitations on stability is to emphasize the range of activities and descriptor-value-shifts which are possible when combining pH, solvation, and support dopant.
3.3. Effects of Element Dopants in Graphene Substrate under Catalytic NanoParticle
In the preceding sub-section of this manuscript, the concluding observations were given that at certain pH and solvent correction energy regimes, Cu3Ni catalysts for MDG NP in the ORR may fall on the outer edge of the Volcano Peak. This is a promising observation which could point towards viability of these systems as competing ORR catalyst technologies. However, the theoretical performance of such MDG NP can possibly be further modified by up or downshifting the O* adsorption energy, ΔEadsO*, on them through doping of the graphene support under the MDG NP catalyst. In the preliminary results presented and discussed below, the first possible insight is provided which shows the degree to which the bandwidth of the O* adsorption energy of 4 atom MDG NP can be tuned via doping of the graphene support. Specifically, we present results for the up or downshift of O* adsorption energies, ΔEadsO*, on PdAu, NiCu, and CuNi MD (doped)G NP which provided interesting candidate materials as described and shown in the previous study and discussed in detail in this manuscript.
In Figure 11 we show the Volcano Plot of pH = 0, solvent correction energy = −0.25 eV/mol. In this figure we show the relative position on the x-axis descriptor for N-doped and B-doped graphene with 1 atom directly under the edge of the 4-atom catalyst NP. The upshift or downshift of the adsorption energy of O*, ΔEadsO*, the descriptor, can be seen to be sensitive to the effects of doping. Specifically, for the 3 intermetallic systems CuNi, NiCu, and PdAu, the following observations can be made for the bandwidth of on MD (doped) Graphene NP for the ORR: on average a bandwidth of approximately 0.5 eV, and a lack of common behavior for B downshift/upshift or N downshift/upshift. The persistence of this latter effect with more candidate materials will provide the basis for a more detailed future study, as discussed in the next subsection.
3.4. Candidate Material and Conditions for Optimal 4-atom MDG ORR Catalysts
For the systems analyzed to date, the results indicate that AuPd MDG NP on N-doped graphene fall closest to the predicted volcano maximum. The proximity to the volcano maximum is increased by a shift in the ΔEadsO* descriptor value when the graphene substrate is doped; the proximity is further enhanced if the solvation correction energy and system pH can be controlled at certain values; in this case a solvation energy correction of −0.25 eV/mol and a pH of 0. At weaker solvation or more dilute pH the Volcano Peak could expand out to include some of the NiCu or CuNi MDG NP. The results described above provide a preliminary set of investigations on this effect. More work is underway to characterize this effect (doping shift to descriptor bandwidth) but is beyond the scope of this manuscript and should be the subject of a future study and publication. Specifically, identification of trends and mixing rules between dopants and intermetallic composition, as well as NP size effect, are key to finding the truly optimal MDG NP Catalyst for the ORR.
4. Conclusions
Plane-wave DFT calculations were performed to investigate the wide bandwidths in adsorption energies of O* and OH* (key intermediates in the catalytic oxygen reduction reaction (ORR)) of small 4 atom alloy/intermetallic composition nanoparticles supported on graphene and doped graphene (doping via B or N atoms). The previously reported observation of single RLS in the oxophilic region of the associated Volcano plot was examined and explained. The seeming contradiction with the performance of single crystal FCC (111) ORR catalysts, which show an O* hydrogenation RLS, was explained via the thermodynamic inversion of the hydrogenation energetics on 4-atom MDG NP. The analysis was supplemented with a study on the Volcano Peak and descriptor location relative to the peak when the solvation correction energy and pH of the system were allowed to vary between the prior assumptions and other competing extrema/limits. Results from the calculations across composition and site-type of the MDG NP candidates—and at various pH and solvent correction energies—explain the interesting (and counter-intuitive) result that there is no regime in the identified Volcano Plot for ORR on these materials whereby this possible RLS exists [1,5,6,7]. This effect is due to the fact that these small MDG have different site preference for O* and OH* and the corresponding energetics for the hydrogenation thermodynamics of O* to OH* cause an inversion from highly exergonic to only mildly endergonic even on the most strongly of oxophilic MDG systems studied.
This surprising result carries further significance as it was identified that the bond-counting hypothesis for the predicted slope between ΔEadsOH* to ΔEadsO* is almost identical to that found on the single crystal FCC (111) surfaces widely studied in the literature (value of slope ~0.5). The qualitative explanation for this phenomenon lies in the observation in this work that OH* is further stabilized on these small MDG catalysts compared to the corresponding single crystal surfaces because the MDG themselves are stabilized by the chemisorption; they are not strongly chemisorbed to the graphene support themselves. This observation is however sensitive to the specific solvation energy correction and pH the system is assumed to be run at. Future work should consider a dependence of this effect on NP size, and how generalizable this effect is to various compositional changes around the 75/25 intermetallic composition. The conclusions from this work and from related future studies can be used to compare down to the Single Atom Catalysts (SAC), which are currently under much study in the literature and combined to form an optimal design plan for nanoscale Pt-free ORR catalysts.
Supplementary Materials
The following are available online at http://www.mdpi.com/2075-4701/9/2/227/s1, Figure SI1: Volcano Plot analysis for Oxygen Reduction Reaction (ORR) activity at solvent correction value of −0.45 eV: Zoomed Level Detail per Panel, Figure SI2: Volcano Plot analysis for Oxygen Reduction Reaction (ORR) activity at solvent correction value of −0.35 eV: Zoomed Level Detail per Panel, Figure SI3: Volcano Plot analysis for Oxygen Reduction Reaction (ORR) activity at solvent correction value of −0.20 eV: Zoomed Level Detail per Panel, Figure SI4: Volcano Plot analysis for Oxygen Reduction Reaction (ORR) activity at solvent correction value of −0.00 eV: Zoomed Level Detail per Panel.
Author Contributions
R.B.R. was responsible for the majority of writing, editing, final analysis of data presented and discussed in this manuscript, and supervision of T.L. research work. T.L. was responsible for performing calculations, preliminary data analysis, and formulation of manuscript structure, and initial creation of the manuscript outline.
Funding
This research received no external funding.
Acknowledgments
R.B.R. gratefully acknowledges financial and research support from the Department of Chemical Engineering at Villanova University through his startup package fund. T.L. acknowledges financial support from the Department of Chemical Engineering and the College of Engineering at Villanova University as well. Both authors acknowledge assistance and support from Villanova U.N.I.T. for maintenance and deployment of computational resources necessary in this work. Both authors acknowledge helpful discussions with Sahithi Ananthaneni, Michael A Smith, and Charles Coe (all Chemical Engineering, Villanova University).
Conflicts of Interest
The authors declare no financial conflict of interest. “The funders had no role in the design of the study; in the collection, analyses, or interpretation of data; in the writing of the manuscript, or in the decision to publish the results. The corresponding author, RB Rankin, serves as a Guest-Editor and reviewer for this journal, Metals, and its upcoming special issue “Graphene-Metal-Composite”. He has openly declared this role in this sub-section, and in the cover letter to the journal upon submission to the journal and via private correspondence with the editorial board/team. He has requested the Editor-in-chief, journal, and publisher route the manuscript, review assignments on the manuscript, and final decision on the manuscript through the Editor-In-Chief or another associate Editor. Accordingly, RB Rankin has no active role, power, or verdict in the decision the journal makes to publish this manuscript in the special issue he is Guest-Editing.
References
- Hu, M.; Yao, Z.; Wang, X. Graphene-based nanomaterials for catalysis. Ind. Eng. Chem. Res. 2017, 56, 3477–3502. [Google Scholar] [CrossRef]
- Wang, Z.; Ping, Y.; Fu, Q.; Pan, C. Preparation of metal nanoparticle decorated graphene hybrid composites: A review. MRS Adv. 2018, 3, 849–854. [Google Scholar] [CrossRef]
- Huang, X.; Qi, X.; Boey, F.; Zhang, H. Graphene-based composites. Chem. Soc. Rev. 2012, 41, 666–686. [Google Scholar] [CrossRef] [PubMed]
- Huang, C.; Li, C.; Shi, G. Graphene based catalysts. Energy Environ. Sci. 2012, 5, 8848–8868. [Google Scholar] [CrossRef]
- Lozano, T.; Rankin, R.B. Computational predictive design for metal-decorated-graphene size-specific subnanometer to nanometer ORR catalysts. Catal. Today 2018, 312, 105–117. [Google Scholar] [CrossRef]
- Bandarenka, A.S.; Hansen, H.A.; Rossmeisl, J.; Stephens, I.E. Elucidating the activity of stepped Pt single crystals for oxygen reduction. Phys. Chem. Chem. Phys. 2014, 16, 13625–13629. [Google Scholar] [CrossRef] [PubMed]
- Greeley, J.; Rossmeisl, J.; Hellmann, A.; Nørskov, J.K. Theoretical trends in particle size effects for the oxygen reduction reaction. Z. Phys. Chem. 2007, 221, 1209–1220. [Google Scholar] [CrossRef]
- Nørskov, J.K.; Rossmeisl, J.; Logadottir, A.; Lindqvist, L.; Kitchin, J.R.; Bligaard, T.; Jónsson, H. Origin of the overpotential for oxygen reduction at a fuel-cell cathode. J. Phys. Chem. B 2004, 108, 17886–17892. [Google Scholar] [CrossRef]
- Rankin, R.B.; Greeley, J. Trends in selective hydrogen peroxide production on transition metal surfaces from first principles. ACS Catal. 2012, 2, 2664–2672. [Google Scholar] [CrossRef]
- Greeley, J.; Stephens, I.E.L.; Bondarenko, A.S.; Johansson, T.P.; Hansen, H.A.; Jaramillo, T.F.; Rossmeisl, J.; Chorkendorff, I.; Nørskov, J.K. Alloys of platinum and early transition metals as oxygen reduction electrocatalysts. Nat. Chem. 2009, 1, 552–556. [Google Scholar] [CrossRef]
- Deshpande, S.; Kitchin, J.R.; Viswanathan, V. Quantifying uncertainty in activity volcano relationships for oxygen reduction reaction. ACS Catal. 2016, 6, 5251–5259. [Google Scholar] [CrossRef]
- Wang, C.; Li, D.; Chi, M.; Pearson, J.; Rankin, R.B.; Greeley, J.; Duan, Z.; Wang, G.; van der Vliet, D.; More, K.L.; et al. Rational development of ternary alloy electrocatalysts. J. Phys. Chem. Lett. 2012, 3, 1668–1673. [Google Scholar] [CrossRef] [PubMed]
- Nørskov, J.K.; Scheffler, M.; Toulhoat, H. Density functional theory in surface science and heterogeneous catalysis. MRS Bull. 2006, 31, 669–674. [Google Scholar] [CrossRef]
- Stamenkovic, V.R.; Fowler, B.; Mun, B.S.; Wang, G.; Ross, P.N.; Lucas, C.A.; Marković, N.M. Improved oxygen reduction activity on Pt3Ni(111) via increased surface site availability. Science 2007, 315, 493–497. [Google Scholar] [CrossRef] [PubMed]
- Kresse, G.; Furthmüller, J. Efficiency of ab-initio total energy calculations for metals and semiconductors using a plane-wave basis set. Comput. Mater. Sci. 1996, 6, 15–50. [Google Scholar] [CrossRef]
- Kresse, G.; Furthmüller, J. Efficient iterative schemes for ab initio total-energy calculations using a plane-wave basis set. Phys. Rev. B 1996, 54, 11169. [Google Scholar] [CrossRef]
- Kresse, G.; Hafner, J. Ab initio molecular dynamics for open-shell transition metals. Phys. Rev. B 1993, 48, 13115–13118. [Google Scholar] [CrossRef]
- Kresse, G.; Hafner, J. Ab initio molecular-dynamics simulation of the liquid-metal-amorphous-semiconductor transition in germanium. Phys. Rev. B 1994, 49, 14251–14269. [Google Scholar] [CrossRef]
- Kresse, G.; Joubert, D. From ultrasoft pseudopotentials to the projector augmented-wave method. Phys. Rev. B 1999, 59, 1758. [Google Scholar] [CrossRef]
- Available online: https://www.materialsdesign.com/compute-engines (accessed on 5 February 2019).
- Perdew, J.P.; Ruzsinszky, A.; Csonka, G.I.; Vydrov, O.A.; Scuseria, G.E.; Constantin, L.A.; Zhou, X.; Burke, K. Restoring the density-gradient expansion for exchange in solids and surfaces. Phys. Rev. Lett. 2008, 100, 136406. [Google Scholar] [CrossRef]
- Hammer, B.H.L.B.; Hansen, L.B.; Nørskov, J.K. Improved adsorption energetics within density-functional theory using revised Perdew-Burke-Ernzerhof functionals. Phys. Rev. B 1999, 59, 7413–7421. [Google Scholar] [CrossRef]
- Adamo, C.; Barone, V. Physically motivated density functionals with improved performances: The modified Perdew–Burke–Ernzerhof model. J. Chem. Phys. 2002, 116, 5933–5940. [Google Scholar] [CrossRef]
- Klimeš, J.; David, R.B.; Angelos, M. Chemical accuracy for the van der Waals density functional. J. Phys. Condens. Matter 2010, 22, 022201. [Google Scholar] [CrossRef] [PubMed]
- Klimeš, J.; Bowler, D.R.; Michaelides, A. Van der Waals density functionals applied to solids. Phys. Rev. B 2011, 83, 195131. [Google Scholar] [CrossRef]
- Thonhauser, T.; Cooper, V.R.; Li, S.; Puzder, A.; Hyldgaard, P.; Langreth, D.C. Van der Waals density functional: Self-consistent potential and the nature of the van der Waals bond. Phys. Rev. B 2007, 76, 125112. [Google Scholar] [CrossRef]
- Methfessel, M.; Paxton, A.T. High-precision sampling for Brillouin-zone integration in metals. Phys. Rev. B 1989, 40, 3616–3621. [Google Scholar] [CrossRef]
- Seo, M.G.; Kim, H.J.; Han, S.S.; Lee, K.Y. Direct synthesis of hydrogen peroxide from hydrogen and oxygen using tailored Pd nanocatalysts: A review of recent findings. Catal. Surv. Asia 2017, 21, 1–12. [Google Scholar] [CrossRef]
- Staszak-Jirkovský, J.; Ahlberg, E.; Panas, I.; Schiffrin, D.J. The bifurcation point of the oxygen reduction reaction on Au–Pd nanoalloys. Faraday Discuss. 2016, 188, 257–278. [Google Scholar] [CrossRef] [PubMed]
- Ferguson, G.A.; Mehmood, F.; Rankin, R.B.; Greeley, J.P.; Vajda, S.; Curtiss, L.A. Exploring computational design of size-specific subnanometer clusters catalysts. Top. Catal. 2012, 55, 353–365. [Google Scholar] [CrossRef]
- Mehmood, F.; Rankin, R.B.; Greeley, J.; Curtiss, L.A. Trends in methanol decomposition on transition metal alloy clusters from scaling and Brønsted–Evans–Polanyi relationships. Phys. Chem. Chem. Phys. 2012, 14, 8644–8652. [Google Scholar] [CrossRef]
- Halder, A.; Curtiss, L.A.; Fortunelli, A.; Vajda, S. Perspective: Size selected clusters for catalysis and electrochemistry. J. Chem. Phys. 2018, 148, 110901. [Google Scholar] [CrossRef] [PubMed]
- Heiles, S.; Johnston, R.L. Global optimization of clusters using electronic structure methods. Int. J. Quantum Chem. 2013, 113, 2091–2109. [Google Scholar] [CrossRef]
- Hussein, H.A.; Johnston, R.L. Chapter 4—The DFT-genetic algorithm approach for global optimization of subnanometer bimetallic clusters. In Frontiers of Nanoscience; Elsevier: Amsterdam, The Netherlands, 2018. [Google Scholar]
- Chirieac, A.; Dragoi, B.; Ungureanu, A.; Ciotonea, C.; Mazilu, I.; Royer, S.; Mamede, A.S.; Rombi, E.; Ferino, I.; Dumitriu, E. Facile synthesis of highly dispersed and thermally stable copper-based nanoparticles supported on SBA-15 occluded with P123 surfactant for catalytic applications. J. Catal. 2016, 339, 270–283. [Google Scholar] [CrossRef]
- Saha, S.; Ramanujachary, K.V.; Lofland, S.E.; Ganguli, A.K. Cu-Co-Ni alloys: An efficient and durable electrocatalyst in acidic media. Mater. Res. Express 2016, 3, 016501. [Google Scholar] [CrossRef]
- Shen, Y.; Lua, A.C.; Xi, J.; Qiu, X. Ternary platinum–copper–nickel nanoparticles anchored to hierarchical carbon supports as free-standing hydrogen evolution electrodes. ACS Appl. Mater. Interfaces 2016, 8, 3464–3472. [Google Scholar] [CrossRef] [PubMed]
- Shen, Y.; Zhou, Y.; Wang, D.; Wu, X.; Li, J.; Xi, J. Nickel–copper alloy encapsulated in graphitic carbon shells as electrocatalysts for hydrogen evolution reaction. Adv. Energy Mater. 2018, 8, 1701759. [Google Scholar] [CrossRef]
- Sidhaye, D.S.; Bala, T.; Srinath, S.; Srikanth, H.; Poddar, P.; Sastry, M.; Prasad, B.L.V. Preparation of nearly monodisperse nickel nanoparticles by a facile solution based methodology and their ordered assemblies. J. Phys. Chem. C 2009, 113, 3426–3429. [Google Scholar] [CrossRef]
- Yang, Y.; Reber, A.C.; Gilliland, S.E.; Castano, C.E.; Gupton, B.F.; Khanna, S.N. Donor/acceptor concepts for developing efficient suzuki cross-coupling catalysts using graphene-supported Ni, Cu, Fe, Pd, and bimetallic Pd/Ni clusters. J. Phys. Chem. C 2018, 122, 25396–25403. [Google Scholar] [CrossRef]
© 2019 by the authors. Licensee MDPI, Basel, Switzerland. This article is an open access article distributed under the terms and conditions of the Creative Commons Attribution (CC BY) license (http://creativecommons.org/licenses/by/4.0/).