Abstract
The synergistic effects of Nd and Ga on the microstructure and mechanical properties of ER4047 alloy wires and the resulting MIG(Melt inert-gas welding) joints were investigated. Experimental results show that the hydrogen content in the liquid and solid alloy decreases rapidly and then increases slowly with the addition of Nd in the range of 0–0.8 wt.%. Under the same conditions, the hydrogen content ratio in the solid and liquid is between 1.9 and 2.1. After adding 0.08–0.2 wt.% Nd, the α-Al dendrites and eutectic Si phases in the ER4047 alloys are refined and modified, respectively; the quality index of the cast rod increases and the weld percent porosity of the MIG joint significantly decreases. However, when 0.8 wt.% Nd is added, although the size of the eutectic Si phase reaches a minimum value, a large number of coarse needle-like Nd-rich phases precipitate in the structure. Moreover, Ga inhibits the precipitation of the Nd-rich phases, thus improving the mechanical properties, especially the elongation of the cast rod. When 0.2 wt.% Nd and 0.05 wt.% Ga are added into the alloy wire, the porosity of the MIG joint reaches the lowest value herein, and the tensile strength and face/back bending angles reach their maximum values.
1. Introduction
In recent years, due to the demand for “lightweight manufacturing”, aluminum alloy structural materials have been widely used in rail and highway transportation systems, shipbuilding, military equipment and other fields [1]. Currently, the rail transportation industry in China, such as high-speed trains, requires 3000–4000 tons of aluminum alloy wires every year, and vehicle manufacturing industries, such as trucks, tankers and cars, require 6000–8000 tons. To decrease vehicle weight and reduce energy consumption, cast aluminum alloys and 2XXX and 6XXX wrought aluminum alloys are widely used in the automobile manufacturing industry [2]. Among them, Al-Si alloy wires (mainly ER4043 and ER4047) have attracted substantial attention as the preferred alloy wires for automobile welding.
Compared with those of ER4043 alloy wires, ER4047 alloys are a near-eutectic Al-Si alloy, which has a lower melting point, a smaller melt interval and good fluidity [3]. ER4047 alloy wire can be used as a brazing and/or welding alloy [4], which reduces the tendency of hot cracking in welds and increases the shear strength of the fillet weld. This is particularly recommended for brazing materials and welding alloys for Al-Cu-Mg, Al-Mg-Si, Al-Zn-Mg-Cu sheets and tubes that have a strong hot cracking tendency, as well as cast aluminum products [5]. For welding or brazing, the properties and microstructures of ER4047 alloy wires have an important effect on the quality of the welded or brazed joints. On the one hand, the as-cast properties of an ER4047 alloy determine the difficulty of the wire drawing process (characterized by the drawing broken-line rate) and shaving process (characterized by surface quality) and then affect the welding process, such as the wire feedability [6]. On the other hand, the weld zone (WZ) is a zone where an as-cast microstructure is formed by remelting, mixing and solidification of the ER4047 alloy wire and the base metal (BM) near the groove. The properties of the solidified welded joint are affected by the properties of the ER4047 alloy wire. Therefore, it is of great significance to study the microstructure and properties of ER4047 alloy wires to improve their processing properties and obtain welded joints of a high quality.
The as-cast structure of an unmodified ER4047 alloy consists of a large number of long acicular eutectic Si phases, a certain volume fraction of coarse α-Al dendrites, and large primary Si phases, which severely separate the matrix and deteriorate the mechanical properties of the alloy, especially the toughness [7,8]. Therefore, it is necessary to modify the Si phases in Al-Si alloys. The commonly used treatment methods are melt treatment [9], dynamic refinement [10], rapid solidification refinement [11], and alloying [12,13,14,15,16]. Among the existing reports, chemical modifiers are the most widely used. Generally, industrial modifier Sr, which has excellent modification effects, is often used in manufacturing of Al-Si alloys [17,18]. However, according to the relevant research results [19,20], Sr modification can increase the hydrogen absorption tendency of an Al-Si melt. According to the solubility of hydrogen in aluminum at different temperatures shown in Figure 1, the solubility of hydrogen in the alloy melt reaches a certain equilibrium state after being refined and held for a certain time [21]; however, when the alloy melt begins to solidify, the solubility of the hydrogen in the melt does not decrease slowly but decreases sharply near the melting point. The solubility of the hydrogen in liquid and solid aluminum is quite different, where the ratio of the two is approximately 20:1. Therefore, when the cooling rate of the melt is relatively high, although the atomic hydrogen dissolved in the melt becomes supersaturated and then precipitates molecular hydrogen, the molecular hydrogen cannot escape from the melt at all. Finally, most of the hydrogen remains in the solid alloy in the form of porosity. Therefore, the addition of Sr element can result in an increase in the porosity and a decrease in the density of the as-cast alloy.
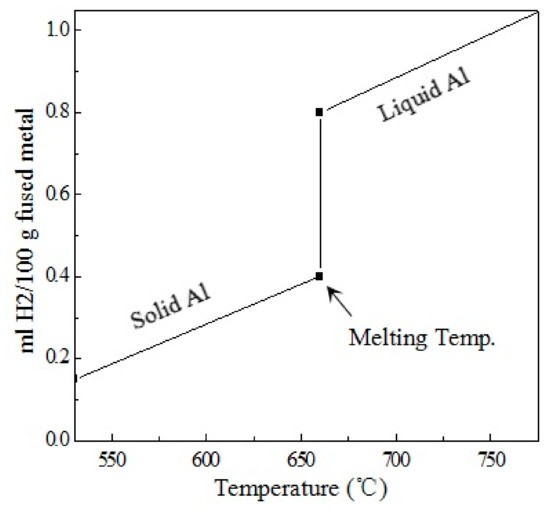
Figure 1.
Solubility of hydrogen in aluminum at different temperatures.
Rare earth elements have special physical and chemical properties. Many studies have shown that rare earth elements can effectively reduce the hydrogen content in melts, and an appropriate addition can improve the mechanical properties of alloys [8,22,23]. For example, Xing et al. [8] found that adding 0.3 wt.% Er into an Al-12.6Si alloy can reduce the size of the eutectic Si phases and change the morphology from coarse needles to fine fibers, thus improving the wear resistance of the alloy and reducing the friction coefficient. However, Tsai et al. [24] found that the effect of 1.0 wt.% La on the microstructure and mechanical properties of an A356 alloy was equal to that of 0.012 wt.% commercial modifier Sr, which indicated that the modification effect of the rare earth on the eutectic Si phase in the Al-Si alloy was weak. It was also reported that excessive amounts of rare earth elements (>0.3 wt.%) react with other alloying elements to produce acicular intermetallic compounds, which can deteriorate the mechanical properties of Al-Si alloys [25]. One study [26] showed that excessive amounts of rare earths (>0.3 wt.%) causes an increase in the porosity of the alloy, which may be due to an increase in the hydrogen solubility in liquid aluminum that contains an excessive amount of rare earths. In addition, some researchers have studied the interaction between rare earth elements and commercial modifier Sr in Al melts. Alkahtani et al. [27] studied the effects of La and Ce additions on the structure and properties of an A356 alloy containing Sr. The experimental results showed that La and Ce tended to react with Sr and resulted in fading of the modification effect of the Sr. The eutectic Si phases could be obviously modified again only when the addition of rare earth elements exceeded 1.5 wt.%. However, excessive rare earths result in the precipitation of a large number of rare earth intermetallic compounds (IMCs), which have negative effects on the properties of alloys. Contrary to the results of Alkahtani et al., Qiu et al. [16] noted that Sr and La exhibited a better synergistic modification effect. Based on this finding, an Al-6Sr-7La master alloy was successfully developed, and the effect of the master alloy on the microstructure and properties of A356.2 was investigated. The results showed that when the addition of the Al-6Sr-7La master alloy was 0.5 wt.%, the secondary dendrite arm spacing was reduced to 17.9 μm, and the acicular eutectic Si phases transformed into fine fibers; the microstructure was optimized, and the mechanical properties of the alloy were maximized. In summary, whether the interaction mechanism between the rare earths and Sr represents a synergistic reaction or causes mutual contamination is an open question. Moreover, rare earths can reduce the hydrogen content in Al melts while commercial modifier Sr increases the hydrogen absorption tendency in the melt, so the real hydrogen content in the Al-Si melt with the combination of Sr and rare earth element remains to be studied and analyzed.
Ga is a rare and precious metal and is located in the third main group of the third period in the periodic table of the elements. The cost of the Ga element is very high. Ga and Al belong to the same main group and have similar external electronic structures. The atomic radii of Ga and Al are similar. Ga has a substantial solid solubility in Al. The maximum solid solubility of Ga in Al is up to 20.0 wt.%, which enables the formation of a substitutional solid solution with large solid solubility. Because the lattice distortion caused by Ga is small, the effect of adding Ga alone on the microstructure and solution strengthening of aluminum alloys is not obvious. However, according to existing research results [28], adding appropriate amounts of Ga and Nd to low-silver lead-free solders can inhibit the formation of Nd-rich IMCs. Based on previous research results, ER4047 alloy wires produced by horizontal continuous casting were chosen to maximize the purification and modification efficiency of the rare earth element, and Nd and Ga elements were added separately to the ER4047 alloy. The effects of the Nd/Ga on the hydrogen content of the alloy wire, the microstructure of the as-cast alloy and the mechanical properties of the resulting welded joints were studied. The synergistic mechanism of Nd and Ga in Al-Si alloy was analyzed. The experimental results can provide new approaches and support for the development of high-strength ER4047 alloy wires containing a low amount of hydrogen.
2. Materials and Methods
2.1. Preparation of the ER4047 Alloy Wire Samples
ER4047 alloy wire for experiments was prepared using pure aluminum (99.7 wt.% purity), Al-20Si master alloy. Trace element Nd and Ga were added separately in the form of Al-10Nd master alloy and pure Ga metal coated with aluminum foil at 720–750 °C, and the melt was purged with hexachloroethane (C2Cl6). The casting process was conducted using a continuous casting and direct water-cooling method. The prepared Φ 10.0 mm cast rods subsequently underwent these procedures, which included homogenizing, drawing, process annealing, shaving and cleaning, to produce the 1.6 mm diameter alloy wire. The chemical compositions of alloy wires are listed in Table 1. The experimental alloy wire numbered CS is Al-12Si-0.02Sr alloy prepared under the same process conditions for comparison.

Table 1.
Chemical compositions of the experimental alloy wires (wt.%).
2.2. Measurement of the Hydrogen Content in the Melt and Solid Alloy Wires
The detection of hydrogen content in melt was carried out according to the trade standard for nonferrous metals industry: “YS/T 600-2009: Analysis method of hydrogen in liquid aluminum and aluminum alloys—The method of the closed gas loop circulation”. An ALSCAN (ABB, Quebec City, QC Canada) type hydrogen determinator was adopted, and the schematic diagram of quantitative determination of hydrogen in melt is as shown in Figure 2. Nitrogen or Argon with 99.999% purity was used as the carrier gas of the determinator. The probe for hydrogen measurement is P/N HME 1200D (ABB, Quebec City, QC Canada), and the range of hydrogen measurement is 0–0.99 mL/100g Al. The temperature of the melt is also recorded while the hydrogen content of the melt is measured. A K-type thermocouple is used as the temperature probe, and the temperature range is 650–800 °C. The hydrogen measurement test needs to be repeated at least twice. When the difference between the two adjacent data does not exceed the stipulation of Table 2, the hydrogen measurement in melt is completed. The last measurement data is taken as the result of hydrogen measurement and retained to two decimal places.
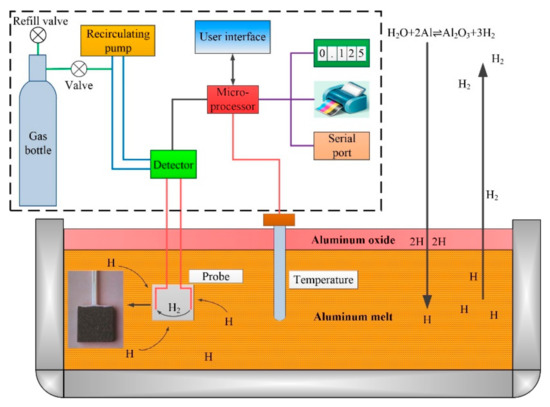
Figure 2.
Schematic diagram of the quantitative determination of the hydrogen content in the melts.
Table 2.
Criteria for determination of hydrogen in the melts.
The detection of hydrogen content in solid alloy wire was carried out according to the national military standard: “GJB 5909-2006: Determination of hydrogen in aluminum and aluminum alloys-Heating extraction—Thermal conductivity method”. A LECO RHEN602 (LECO, Saint Joseph, MI USA) hydrogen determinator is used. The weight of the solid alloy wire sample is required to be 3.0–6.5 g. The maximum diameter and length of the sample are 10.5 mm and 24 mm. The range of hydrogen measurement is 0.05–2.0 ppm. The average values of three measurements are taken as the final results of hydrogen measurement. Pulse heating and thermal conductivity detection (TCD) is the testing principle of RHEN602 (LECO, Saint Joseph, MI USA) hydrogen determinator. As shown in Figure 3, the programmable pulse electrode furnace can realize steeped heating, thermal insulation and reheating process, which can be precisely controlled. The surface hydrogen of the solid alloy wire sample is released completely under the action of 450 W pulse power. Under the action of 1400 W pulse power, the sample melts completely. At the same time, the real hydrogen content of the sample, i.e., the bulk hydrogen value, is detected by the thermal conductivity cell.
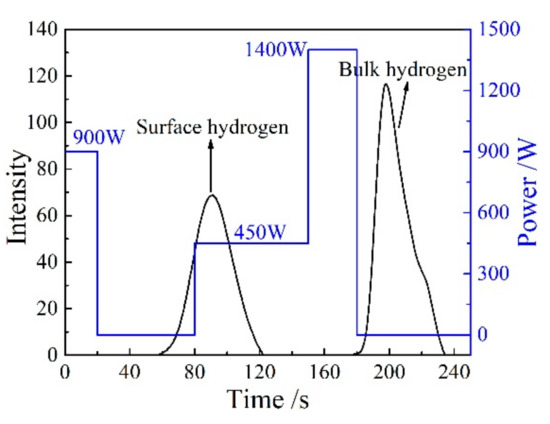
Figure 3.
Separation of the surface and bulk hydrogen through stepped furnace analysis.
2.3. Performance Tests and Microstructural Observations
The base metal was 6082-T6 alloy with dimensions of 12 × 175 × 350 mm intended for MIG. Prior to welding, the base material coupons were wire brushed and degreased with acetone. In addition, the coupons were preheated due to the high thermal conductivity of the aluminum alloy (the thermal conductivity of 6082-T6 alloy is 180 W·(m·K)−1). The welding process was carried out according to the standard developed by American Bureau of Shipping (ABS): “ABS-2018: Rules for materials and welding—Part 2: Aluminum and fiber reinforced plastics (FRP)”. An AOTAI P-MIG 500 welder (Aotai Electric, Jinan, China) was employed to weld the AA6082 plate. Argon with a purity of 99.99% was used as the shielding gas. All plates had the same welding current and gas flow, the specific values were 145–155 A and 16 L/min. All of the welds performed were nondestructively inspected for possible defects, especially porosity, using an X-ray film photographic inspection method. The radiography test was performed according to national standard DIN EN ISO 10042:2006 by using an XY-2512 X-ray flaw detector (Zhongyi Electroinc, Dandong, China).
Full-size transverse tensile specimens and bending specimens were prepared from the MIG joints welded with different kinds of ER4047 alloy wires. The schematic diagrams of the tensile specimens and bending specimens were shown in Figure 4. To avoid the effect of weld profile on the stress concentration during the tensile test and bending test, the weld reinforcement was grinded with a polisher (Fujian Hitachi Koki Co., Ltd., Fuzhou, China) prior to being tested. Tensile tests and bending tests were performed both on a WAW-300B hydraulic universal testing machine (Zhejiang Jingyuan Mechanical Equipment Co., Ltd., Jinhua, China) operating at room temperature. The elongation of the tensile specimen was the ratio of the variation in the gauge length to the original gauge length value. The bending tests were performed at room temperature with a rate of 1 mm/min and the face/back bending fracture angles were calculated.
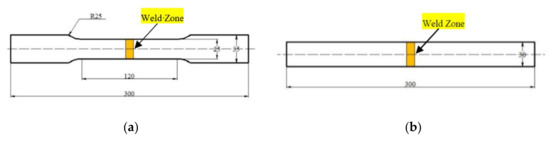
Figure 4.
Schematic diagrams of welded joint samples for mechanical properties testing: (a) tensile specimen and (b) bending specimen (unit: mm).
The specimens from the as-cast ER4047 wire alloys and the resulting butt-welded joints were suitably sectioned, mounted, mechanically polished, and etched. The etchant was 0.5% HF solution. For microstructural observations and analyses of fracture surfaces, the specimens were observed using a TV-400D optical microscopy (Shanghai Tuanjie Instrument Manufacturing Co., Ltd., Shanghai, China) and a ZEISS ΣIGMA field-emission scanning electron microscope coupled to an energy dispersion X-ray (FE-SEM/EDX; Carl Zeiss, Oberkochen, Germany). The detector type is annular scintillator-based (AsB) backscattered electron detector. Please refer to the bottom information of specific SEM images for accelerating voltage, working distance and so on. EDX measurements were mainly for the analysis of specific points in the SEM images.
3. Results and Discussion
3.1. Effect of Nd and Ga Additions on the Hydrogen Content in the Melts and Solid Alloy Wires
The effects of Nd content (0, 0.01, 0.03, 0.08, 0.2, 0.5, 0.8 wt.%) and Ga (0, 0.05 wt.%) on the hydrogen contents in the ER4047 melt and solid alloy wire are shown in Figure 5. As shown in Figure 5a, the hydrogen content in the melt without adding Nd and Ga was 0.21 mL/100 g Al. The hydrogen content in the melt decreased rapidly when the proper amount of rare earth Nd element was added in the range of 0–0.2 wt.%. When the addition of Nd was 0.2 wt.%, the hydrogen content in the melt reached the lowest value herein of 0.10 mL/100 g Al, which decreased by 52.4% compared with that of the unmodified ER4047 melt. According to existing research results [23,26,29], it can be inferred that an appropriate addition of rare earth Nd can improve the protection of the oxide film on the surface of the melt, reduce the tendency for hydrogen absorption, remove the oxide inclusions in the melt, purify the melt and inhibit the nonspontaneous nucleation of bubbles. Rare earth Nd can also react with free hydrogen to form NdH2 during solidification. As a result, the amount of the free hydrogen in liquid metals can be effectively reduced. Hydrogen in the form of compounds does not accumulate to form bubbles, so the porosity of the solidified alloys can be reduced eventually. When the addition of Nd was further increased, the hydrogen content in the melt did not decrease but increased; however, it was still lower than that of the melt without Nd. One study [30] showed that excessive amounts of rare earths (>0.3 wt.%) causes an increase in the porosity of the alloy, which may be due to an increase in the hydrogen solubility in liquid aluminum that contains an excessive amount of rare earths.
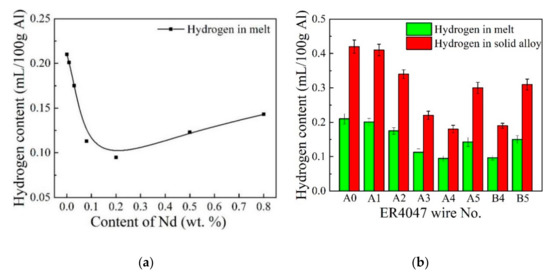
Figure 5.
Hydrogen content of ER4047 melt and alloy wires: (a) hydrogen content in the melt with Nd addition alone and (b) hydrogen content in the melt and alloy wire with Nd and Nd-Ga additions.
Figure 5b shows that the hydrogen content in the A4 melt was basically the same as that of the B4 melt, and the hydrogen content of the A5 and B5 melt was basically the same, which indicates that Ga had no effect on the hydrogen absorption tendency of the ER4047 alloy melt that contained rare earth Nd. In addition, it can also be seen from Figure 5b that the hydrogen content in the ER4047 solid alloys was also reduced by adding an appropriate amount of rare earth Nd; that is, the trend in the variation of the hydrogen content in the melt and the hydrogen content in the solid alloy due to the Nd was similar. This result can be explained by the following analysis. According to the solubility of hydrogen in aluminum at different temperatures shown in Figure 1 [21], most of the hydrogen remains in the solid alloy in the form of porosity, which can be detected by a hydrogen determinator for the solid alloy wire. Therefore, the hydrogen content of the Al-12Si-xNd solid alloy in Figure 5 maintains the same trend as that of the alloy melt. That is, under certain other conditions, the hydrogen content level of the ER4047 melt directly determines the hydrogen content level of the resulting solid alloy wire.
The data in Figure 5 shows that under the same process conditions, the hydrogen content values of the solid alloy wires were obviously higher than those of the alloy melt. The hydrogen content ratio of the solid alloy wire and alloy melt remained between 1.9 and 2.1. The possible reasons for this result are as follows. (1) The ALSCAN hydrogen analyzer was located before the final transferring and casting processes. The transfer and casting of liquid aluminum led to a substantial increase in the specific surface area of the melt in contact with air. It also caused the agitation of the melt and the rupture of the oxide film on the surface of the melt, resulting in the breakdown of the hydrogen partial pressure equilibrium during the final stage of the smelting process. The melt dissolved a large amount of hydrogen again, which ultimately increased the hydrogen content of the solid alloy wire. (2) The principle behind the two kinds of hydrogen measurements is different. Although both devices used the thermal conductivity method to measure the hydrogen, the RHEN602 hydrogen determinator directly extracted hydrogen from a sample of the solid alloy wire by heating. Because the sample of aluminum alloy wire was easily oxidized or contaminated, it would be easy to cause the measured value of the bulk hydrogen content to be higher than that of the true value. Therefore, the preparation and storage time of the sample to be measured are highly required according to the national military standard GJB 5909-2006. The principle of the ALSCAN hydrogen analyzer for measuring hydrogen in liquid aluminum and aluminum alloys involves closed-loop gas circulation. Between the two measurement techniques, the experimental data measured by the ALSCAN hydrogen analyzer had better reproducibility. The online ALSCAN hydrogen analyzer and RHEN602 hydrogen determinator have their own advantages and disadvantages. They can complement each other. For the production inspection and quality control of aluminum alloy wires, the two kinds of equipment need to be used together to comprehensively and accurately reflect the internal quality of aluminum alloy wires.
3.2. Effect of Nd and Ga Additions on the Mechanical Properties of the ER4047 Alloy Wires
The effect of Nd addition on the mechanical properties of Φ10.0 mm ER4047 cast rods is shown in Figure 6a. Figure 6a shows that with increasing Nd content, the yield strength and tensile strength increased gradually, and the elongation first increased and then decreased. When the Nd content reached 0.08 wt.% in the range of 0–0.08 wt.%, the maximum tensile strength, yield strength and elongation of the cast rod were 193.1 MPa, 175.0 MPa and 5.17%, respectively, which is 6.9%, 15.2% and 111.0% higher than that of ER4047 cast rods without Nd addition, respectively. When the Nd content increased further in the range of 0.08–0.8 wt.%, the tensile strength and yield strength of the cast rod remained unchanged and then increased, while the elongation first remained unchanged and then decreased. When the Nd content was 0.8 wt.%, the tensile strength, yield strength and elongation of the cast rod were 199.8 MPa, 180.0 MPa, 3.47%, respectively. Compared with the maximum mechanical properties of the cast rods with Nd in the range of 0–0.08 wt.%, the tensile strength and yield strength of the A5 (Al-12Si-0.8Nd) cast rod increased by 3.5% and 2.9%, respectively, but the elongation decreased by 32.9%. In general, the mechanical properties of the ER4047 cast rods with rare earth Nd were better than those without Nd. To select the optimum amount of Nd in the ER4047 alloy, the mechanical properties of Al-Si cast rods were evaluated according to a quality index (Q) [31]. According to the existing research results [32], the quality index Q, which combines the tensile strength Rm and the elongation A, is an important index to measure the comprehensive mechanical properties of an alloy ingot. For the Al-Si alloy system, the quality index Q can be expressed by the following formula [32]:
Q = Rm + 150 × lg A
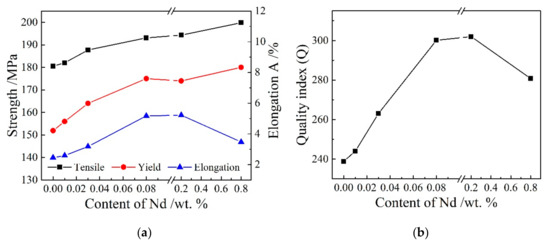
Figure 6.
Effect of Nd on the mechanical properties and quality index of the Φ10.0 mm ER4047 cast rods: (a) mechanical properties and (b) quality index.
According to Formula (1) and the data points for the tensile strength and elongation in Figure 6a, the curve for the quality index Q and rare earth addition can be drawn. As shown in Figure 6b, when the content of Nd was 0.08 wt.% and 0.2 wt.%, the values of Q were 300.1 and 302.0, respectively. Therefore, from the point of view of the mechanical properties of the cast rods, the appropriate amount of Nd in the ER4047 alloy should be 0.08–0.2 wt.%.
The mechanical properties and quality index for the Al-12Si-xNd-yGa cast rods are shown in Table 3, which shows that elemental Ga can further improve the mechanical properties, especially the elongation of ER4047 alloys containing rare earth elements. Comparing the quality index Q of the A3, A4, A5, B4 and B5 cast rods, the Q value of the ER4047 cast rod can reach a maximum of 321.1 when 0.2 wt.% Nd and 0.05 wt.% Ga were added together.
Table 3.
Mechanical properties and quality index of the Al-12Si-xNd-yGa cast rods.
3.3. Effect of Nd and Ga Additions on the Microstructure of the ER4047 Alloy Wires
The as-cast microstructures of the ER4047 alloy wire without modification are shown in Figure 7. In addition to the main eutectic Si phases, there were primary Si and α-Al phases in the structure. It can be seen from Figure 7a that the primary α-Al dendrites were relatively developed, but their morphology and orientation were relatively disordered, and the secondary dendrite arm spacing was large. From Figure 7b, it can be seen that the eutectic Si phases in the structure were thick flake- or needle-like, and there were many angular and bulk primary Si phases. By further investigating the detailed characteristics of the microstructures, as shown in Figure 7c,d, it can be seen that there was a white fishbone-like phase A, white Chinese script-like phase B, and white needle-like phase C in the alloys. To further analyze the elemental composition of these phases, energy-dispersive spectroscopy analysis was carried out. The experimental results are shown in Table 4. According to the relevant data [33], it can be seen that in the microstructure of the unmodified ER4047 alloy, phase A and phase B comprised α-Fe intermetallic compounds (IMCs) and phase C comprised β-Fe IMC. The volume fraction of the α-Fe IMC was obviously higher than that of the β-Fe IMC.
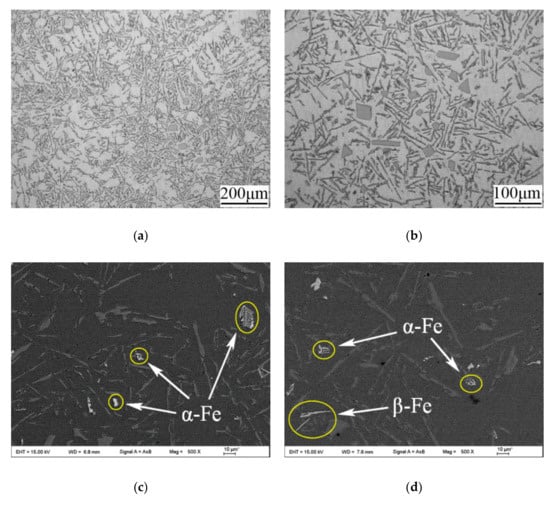
Figure 7.
Microstructures of the as-cast ER4047 alloy wire without modification: (a) metallographic image, 100-fold magnification; (b) metallographic image, 200-fold magnification; (c) SEM (scanning electron microscope) image, α-Fe, 500-fold magnification; and (d) and SEM image, coexisting α-Fe and β-Fe, 500-fold magnification. Letters A-C indicate the points for EDX analysis.
Table 4.
EDX analysis results of the positions indicated in Figure 7 (wt.%).
The size of α-Al dendrites can be represented by secondary dendrite arm spacing (SDAS). The metallographic images of the as-cast structure in the ER4047 alloys with different contents of rare earth Nd are shown in Figure 8. The SDAS of each image was calculated and showed in the title of Figure 8. When the addition of Nd was low (0.01–0.03 wt.%), as shown in Figure 8a,b, the eutectic Si phase still retained a long needle-like structure, and the grain size of the α-Al phases, which still maintained a columnar dendritic morphology, decreased slightly. As shown in Figure 8c–e, when the Nd content was 0.08–0.8 wt.%, the size of eutectic Si phase decreased gradually, and the morphology changed from long needles to short needles, short rods and a granular structure in turn. The α-Al dendrites were clearly refined according to the SDAS data. In conclusion, the addition of an appropriate amount of rare earth Nd can refine both the α-Al dendrites and eutectic Si phases in as-cast ER4047 alloys.
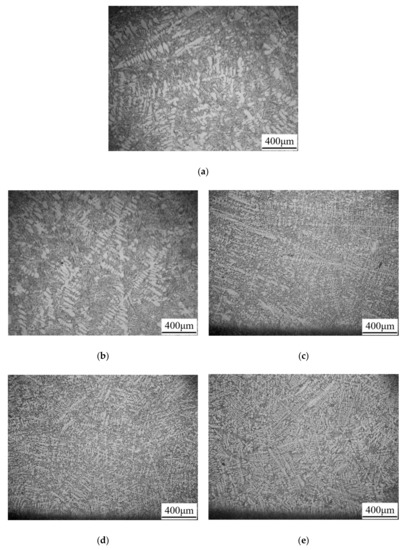
Figure 8.
Metallographic images of the microstructure of the as-cast Al-12Si-xNd alloy wires: (a) A1, SDAS = 55.4 μm; (b) A2, SDAS = 43.5 μm; (c) A3, SDAS = 30.1 μm; (d) A4, SDAS = 26.4 μm; and (e) A5, SDAS = 16.9 μm.
Figure 9 and Figure 10 show SEM photos of as-cast ER4047 alloy wires with different contents of Nd and Ga. By comparing Figure 9a–c, it can be seen that the corners of the primary Si phase became rounded and that the size of the primary Si phase decreased with increasing Nd content in the range of 0.01–0.08 wt.%. By comparing Figure 6, Figure 7, Figure 8 and Figure 9, according to the microstructure evolutions and mechanical property changes of the ER4047 alloys wires bearing Nd, it can be concluded that with the addition of Nd in the range of 0.01–0.08 wt.%, the microstructures were optimized, which leads to the improvement of the mechanical properties of the alloy wires. As shown in Figure 10a, the morphology of the Fe-containing phase, which was distributed at the edge of the eutectic Si phase, mainly comprised small Chinese script-like or fishbone-like structures. According to the EDX analysis results of Point D in Table 5, the Fe-containing phase was an α-Fe IMC. The eutectic Si phase retained a needle-like structure, but its size decreased slightly. When the addition of Nd was 0.2 wt.%, as shown in Figure 9d and Figure 10b, the size of the eutectic Si phase and primary Si phase decreased further. In addition, a small needle-like grey phase (Point E) and a needle-like white bright phase (Point F) appeared in the structure. According to the EDX analysis results of Points E and F in Table 5, the needle-like grey phase and the white bright phase were a β-Fe IMC and Nd-rich phase, respectively. By further observing the morphology and location of the β-Fe IMC and Nd-rich phase, it can be concluded that when the content of Nd increased to a certain extent, there was an obvious enrichment of rare earth Nd, and small needle-like Nd-rich phases were formed. The needle-like Nd-rich phases acted as the substrate for the nucleation of the Fe-containing phases, which resulted in the precipitation of a small amount of β-Fe in the alloys. This indicates that in the microstructure of the ER4047 alloy, the enriched Nd phases promoted the transformation of part of the α-Fe IMC to β-Fe IMC.
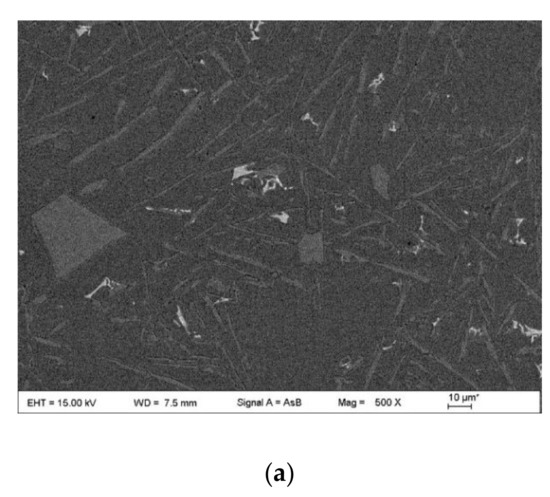
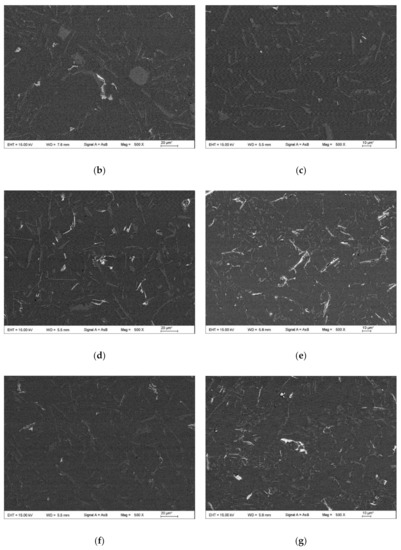
Figure 9.
SEM images at low magnification of the microstructures of the as-cast Al-12Si-xNd-yGa alloy wires: (a) A1, (b) A2; (c) A3; (d) A4; (e) A5; (f) B4; and (g) B5.
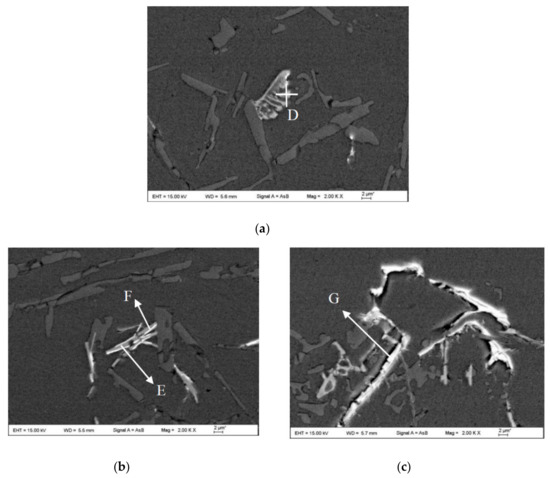
Figure 10.
SEM images at high magnification of the microstructures of the as-cast Al-12Si-xNd alloy wires: (a) A3; (b) A4; (c) A5. Letters D-G indicate the points for EDX analysis.
Table 5.
EDX analysis results of the positions indicated in Figure 9 (wt.%).
When the content of Nd increased to 0.8 wt.%, as shown in Figure 9e and Figure 10c, the eutectic Si and primary Si phases were obviously refined and modified, but at the same time, a large number of coarse white needle-like Nd-rich phases (such as Point G) precipitated in the structure, and the size of the β-IMC also increased. In addition, there were obvious cracks or voids at the interface between the Nd-rich phase and the α-Al matrix, which indicates that the bonding force between the Nd-rich phase and the matrix structure was very poor. Considering the size effect, the coarse Nd-rich phase formed a new second phase that decreased the mechanical properties of the α-Al matrix. In summary, when the addition of Nd was high (>0.2 wt.%), a large number of acicular Nd-rich phases precipitated in the structure. The presence of coarse needle-like Nd-rich phases and β-Fe IMCs deteriorated the mechanical properties of the alloy.
By comparing the EDX analysis results of the α-Fe IMC (Points A, B and D) and β-Fe IMC (Points C and D) in Table 4 and Table 5, it can be seen that the elemental composition varied as follows. When the mass fraction ratio of Fe to Si, namely, ω(Fe)/ω(Si), was greater than 1, the Fe-containing IMCs tended to form the Chinese script-like structure, and when the ω(Fe)/ω(Si) was close to 1, the Fe-containing IMCs tended to form the long needle-like structure. The abovementioned law is basically the same as that obtained by Wang et al. [34]. According to Table 5, the Nd content in the α-Fe IMC (Point D) was 0.1 wt.%. The element analysis accuracy of the Bruker Nano XFlash Detector 5010 Spectrometer is ±0.1 wt.%. Therefore, it was not possible to determine whether the rare earth Nd was contained in the α-Fe IMC. For Point E in Table 5, the content of Nd in the β-Fe IMC was 2.78 wt.%, so it can be inferred that the high amount of Nd in the ER4047 alloy participated in and promoted the nucleation and precipitation of the β-Fe IMC.
Compared with that for the Al-12Si-xNd (x = 0.2, 0.8) alloys without Ga addition, the number of needle-like Nd-rich phases in the microstructures of the Al-12Si-0.2Nd-0.05Ga and Al-12Si-0.8Nd-0.05Ga alloys decreased significantly with the addition of Ga, as shown in Figure 9d–g. This indicates that an amount of 0.05 wt.% Ga obviously inhibited the aggregation and growth of the rare earth Nd phases. The above microstructural evolution rules can be used to explain the differences in the mechanical properties and quality indexes of the A3, A4 and B4 cast rods in Table 3. When 0.2 wt.% Nd was added alone to the A4 alloy, the size of the α-Al dendrites changed little compared with those in the A3 alloy, and the eutectic Si phase was refined further. At the same time, acicular rare earth phases began to precipitate in the structure. The improvement in the mechanical properties caused by the eutectic Si modification competed with the deterioration of the mechanical properties resulting from the acicular rare earth phase precipitation, resulting in the quality index of A3 alloy, becoming close to that of the A4 alloy. However, when 0.2 wt.% Nd and 0.05 wt.% Ga were added into the ER4047 alloy, none of the Nd-rich phase precipitated in the B4 alloy. At this time, the modification of the eutectic Si phase played a leading role, which further improved the mechanical properties and quality index of the alloy, especially its plasticity. In addition, combined with the mechanical properties of the B5 alloy in Table 3 and the SEM image in Figure 9g, it can be seen that, due to the excessive addition of rare earth Nd, the Ga can only restrain the precipitation of the coarse needle-like Nd-rich phases in the structure of B5 to a limited extent. Therefore, the quality index of the B5 cast rod is lower than that of the B4 cast rod.
Ga and rare earth Nd are surface-active elements. When adding appropriate amounts of Ga and Nd, a certain amount of Ga-Nd phase precipitates due to the enrichment effect of Ga [35] and greatly changes the actual Gibbs free energy of the original rare earth compounds. The formation of the Ga-Nd phase takes precedence over the original Nd-rich phase. It is precisely because Ga preferentially consumes rare earth Nd that the segregation of the coarse needle-like Nd-rich phase is inhibited to a certain extent. In conclusion, the synergistic effect of the Ga and Nd is the fundamental factor that improved the microstructure and properties of ER4047 alloy wires.
3.4. Effect of Nd and Ga Additions on the Quality of MIG Welded Joints
According to standard ISO 10042:2006, the weld percent porosity (WPP) is quantified by the ratio of the porosity area to the weld projected area. The MIG welded joints were detected by the NDT (nondestructive testing) method. Figure 11 shows the WPP of the MIG welded joints with the A0, A3, B4 and CS alloy wires. As shown in Figure 11, the WPP value of the joint welded by the unmodified ER4047 alloy wire was 1.3%, which was determined to be unqualified. When 0.02 wt.% Sr was added alone to the ER4047 alloy wire, the WPP of the resulting welded joint was 5.38%. The NDT image of the joint welded by the CS alloy wire is shown in Figure 12a. The formation of a large number of pores was mainly related to the high hydrogen absorption tendency of the melt during the smelting process and the molten pool during the welding process due to the Sr. By comparing the WPP values of the A0, A3 and B4 wires, it can be seen that when rare earth Nd was added in the range of 0–0.2 wt.%, the WPP of the joints decreased gradually with increasing Nd content. As shown in Figure 12b, there were no pores at the microscale in the MIG joint welded with the Al-12Si-0.2Nd-0.05Ga alloy wire. This indicates that the rare earth Nd added to the ER4047 alloy still retained good hydrogen fixation and dehydrogenation in the molten pool under the condition of secondary melting and mixing of the ER4047 alloy wire and 6082 base metal. Rare earth Nd significantly inhibited the generation of porosity and improved the compactness of the welded joints.
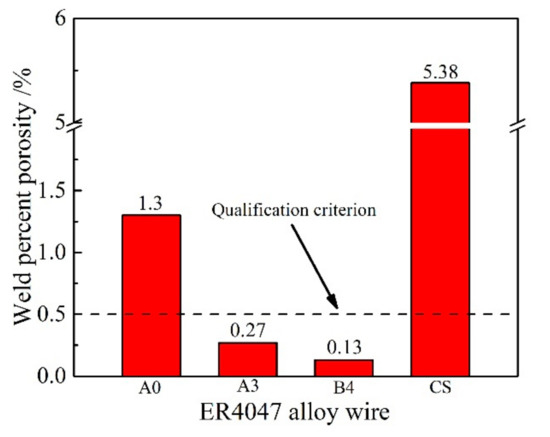
Figure 11.
Weld percent porosity of MIG joints welded with different kinds of ER4047 alloy wires.
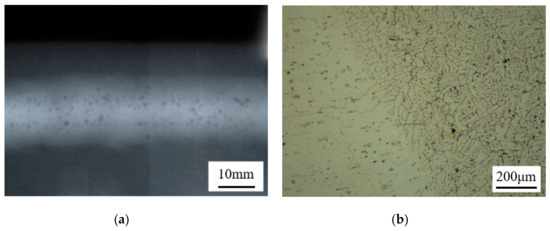
Figure 12.
(a) Nondestructive testing photograph of the MIG joint welded with the Al-12Si-0.02Sr alloy wire; and (b) cross-sectional microstructure of the MIG joint welded with Al-12Si-0.2Nd-0.05Ga.
Table 6 shows the mechanical properties of the MIG joints welded with the A0, A3, B4 and CS alloy wires. In Table 6, it can be seen that the fracture of the MIG joints welded with the A0 alloy wire and CS alloy wire both occurred in the WZ. The rupture in the case of joints welded with A0 alloy wires was because the WZ experienced neither refinement nor modification; second, there were many pore defects in the WZ. The reason for the rupture in the case of joints welded with CS alloy wires was that although the α-Al dendrites and eutectic Si phases in the WZ were refined and modified, there was also an excessive number of pores. The pore led to a sharp decrease in the effective bearing area of the WZ and ultimately resulted in a fracture in the WZ. The MIG joints welded by the A3 and B4 wires both had qualified WPP values and good compactness. The proper amount of rare earth Nd can purify the molten pool, refine the α-Al dendrites and eutectic Si phases of WZ. In addition, for a MIG welded joint of AA6082-T6, the strength of the heat-affected zone (HAZ) decreased rapidly due to the overaging softening of the HAZ under the conditions of the welding thermal cycle [36]. The microstructure and properties in the WZ were improved while there was overaging softening in the HAZ. Finally, the fracture of the joint occurred in the HAZ under uniaxial tension. The tensile strength and elongation of the A3 joint and B4 joint were similar, which indicates that the mechanical properties of the joints where the fracture occurred in HAZ were only related to the heat input from the welding.
Table 6.
Mechanical properties of the MIG joints welded with different kinds of ER4047 alloy wires.
Figure 13 shows the macroscopic and SEM fracture morphologies of MIG joints welded with the A0, B4 and CS wires. As shown in Figure 13a, the fracture mainly occurred in the WZ. Point A is located at the edge of WZ near the fusion line, and B is located at the center of the WZ. Figure 13a shows that the tensile fracture began in the WZ near the fusion line and eventually extended to the center of the weld. Figure 13b,c shows that there were a large number of pore defects in the center and at the edge of the weld, which corresponds to the excessive WPP result of the MIG joint welded by the A0 alloy wire, as shown in Figure 11.
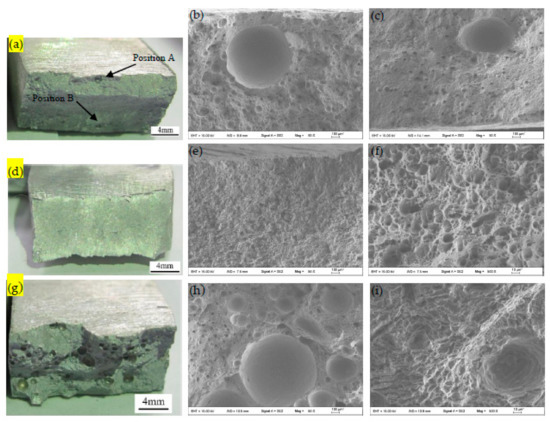
Figure 13.
Macroscopic fracture morphologies of MIG joints welded with: (a) A0 wire; (d) B4 wire; and (g) CS wire. SEM fracture morphologies of MIG joints welded with (b) A0 wire, position A in Figure 13a, 50×; (c) A0 wire, position B in Figure 13a, 50×; (e) B4 wire, 50×; (f) B4 wire, 500×; (h) CS wire, 50×; and (i) CS wire, 500×.
As shown in Figure 13d, the tensile fracture of the B4 joint occurred in the HAZ. The fracture was sheared along 45° from the HAZ adjacent to the fusion line towards the BM. This indicates that the weakest point of the welded joint was located in the HAZ. The main reason for the lower strength of the HAZ was that overaged growth of the Mg2Si strengthening phases occurred in the HAZ under the action of the welding heat cycle, and then, the aging strengthening effect decreased obviously, resulting in the deterioration of the tensile strength. As shown in Figure 13e,f, there were a large number of elongated shear fracture dimples on the fracture surface, which indicates that the tensile fracture mechanism was ductile in nature.
Figure 13g–i shows the fracture morphologies of the MIG joint welded by the CS alloy wire. As shown in Figure 13g, the fracture mainly occurred in the WZ. Compared with the fracture morphologies of the A0 joint (Figure 13a–c), the number and size of the pores in the WZ of the joint containing Sr modification increased significantly. As shown in Figure 13i, there were a large number of fine dimples with a uniform distribution in the fracture surface, which indicates that the microfracture had the characteristics of plastic fracture [36]. According to Figure 11 and Table 6, although the WPP of the joint welded by the CS alloy wire was the largest herein, the percentage elongation after fracture (4.8%) was not the lowest. Compared with the elongation of the A0 joint (2.9%), the elongation of the CS joint increased by 65.5%. This was mainly because Sr played a significant role in the modification of the eutectic Si phase in the WZ and inhibited the propagation of the cracks in the eutectic Si phase at the grain boundaries. Therefore, although there were excessive pores in the WZ, the weld metal only experienced transgranular fracture through the aggregation and connection of the micro-holes in the α-Al matrix, which eventually led to a large number of small dimples on the surface of the fracture.
Table 7 shows the bending test results of the MIG joints in the AA6082-T6 sample with different kinds of ER4047 alloy wires. All the bending specimens of the A0 joint broke after the bending test, and the face bending and back bending angles were 23° and 19°, respectively, which indicated that the plasticity of the unmodified weld metal was poor. When 0.08 wt.% Nd was added alone, the face bending and back bending angles of the A3 joint increased to 34° and 29°, respectively. This is because rare earth Nd reduced the WPP and refined the α-Al dendrites and eutectic Si phases in the WZ microstructure, thus improving the plastic deformation ability of the weld metal. When 0.2 wt.% Nd and 0.05 wt.% Ga were added to the ER4047 alloy, the face bending and back bending angles of the joint reached maximum values of 44° and 43°, respectively. Compared with the unmodified A0 joint, the bending angles of the B4 joint increased by more than 100%. Moreover, the difference in the face bend and back bend angles of the B4 joints decreased obviously, which further showed the advantages of B4 alloy wires in obtaining better mechanical properties of the welded joint.
Table 7.
Bending properties of the MIG welded joints with different kinds of ER4047 alloy wires.
Figure 14 shows the SEM microstructures of the weld center in the MIG joints welded with the A3 and B4 alloy wires. The morphology of the eutectic Si phases in the weld center of the A3 joint is strip-like or fine needle-like, and the distribution is not uniform. The morphology of the eutectic Si phases in the center of the B4 joint is fine fiber-like, and the size of the phases is smaller, and the distribution is more uniform than those in the A3 joint. The comparison between Figure 14a,b shows that the addition of 0.2 wt.% Nd and 0.05 wt.% Ga on the eutectic Si phases is beneficial in the WZ of the B4 joint. According to the principle that the structure of a metal material determines its properties, the bending properties of the MIG joint welded by the Al-12Si-0.2Nd-0.05Ga alloy wire were the best among the samples herein.
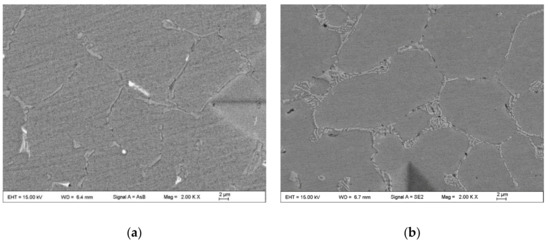
Figure 14.
SEM microstructures of the weld center of the MIG joints welded with the (a) A3 wire and (b) B4 wire.
4. Conclusions
The synergistic effects of rare earth Nd and Ga on the microstructure evolution and mechanical properties of ER4047 alloy wires and the resulting MIG joints were successfully investigated. The conclusions are as follows.
- (1)
- When Nd was added alone to the ER4047 alloy wire in the range of 0–0.8 wt.%, the hydrogen content in liquid and solid alloy decreased rapidly and then increased slowly with increasing Nd content. Ga had no effect on the liquid and solid hydrogen content of alloy containing Nd. Under the same conditions, the hydrogen content ratio of solid to liquid was between 1.9 and 2.1.
- (2)
- The quality index of the Φ 10.0 mm cast rod first increased and then decreased with increasing Nd content in the range of 0–0.8 wt.%. The optimum addition of Nd was 0.08–0.2 wt.%. Ga further improved the mechanical properties, especially the elongation of the cast rod. When adding 0.2 wt.% Nd and 0.05 wt.% Ga, the quality index reached the maximum value herein.
- (3)
- When 0.8 wt.% Nd was added, although the size of the eutectic Si phase reached its minimum value, a large number of coarse Nd-rich phases and needle-like Fe-containing IMCs precipitated in the structure. Adding 0.05 wt.% Ga to alloys containing 0.2–0.8 wt.% Nd significantly inhibited the precipitation of the Nd-rich phases.
- (4)
- Adding an appropriate amount of Nd can significantly reduce the porosity of a MIG joint. When 0.2 wt.% Nd and 0.05 wt.% Ga were added simultaneously, the tensile strength of the welded joint was the highest and the bending properties of the joint were the best among the samples herein; and the face and back bending angles reached 43 and 44°, respectively.
Author Contributions
Conceptualization, P.X. and J.T.; methodology, P.X. and B.W.; software, P.X. and J.T.; validation, P.X., B.W. and P.H.; formal analysis, P.X. and B.W.; investigation, P.X. and W.L.; resources, W.L., S.Z. and J.L.; data curation, P.X., B.W. and P.H.; writing—original draft preparation, P.X.; writing—review and editing, P.H.; visualization, P.X., S.Z. and J.L.; supervision, P.H. and W.L.; project administration, P.X.; funding acquisition, P.X. and P.H.
Funding
This research received no external funding.
Acknowledgments
This work is supported by the National Natural Science Foundation of China (Grant No. 51605226) and the Zhejiang Postdoctoral Science Foundation.
Conflicts of Interest
The authors declare no conflict of interest.
References
- Chen, C.; Zhao, S.D.; Han, X.L.; Zhao, X.Z.; Ishida, T. Experimental Investigation on the Joining of Aluminum Alloy Sheets Using Improved Clinching Process. Materials 2017, 10, 887. [Google Scholar] [CrossRef] [PubMed]
- Arowosola, A.; Gaustad, G. Estimating increasing diversity and dissipative loss of critical metals in the aluminum automotive sector. Resour. Conserv. Recycl. 2019, 150, 104382. [Google Scholar] [CrossRef]
- Cao, G.; Kou, S. Liquation cracking in full-penetration Al-Si welds. Weld. J. 2005, 84, 63s–71s. [Google Scholar]
- Demir, A.G.; Biffi, C.A. Micro laser metal wire deposition of thin-walled Al alloy components: Process and material characterization. J. Manuf. Mater. Processes 2019, 37, 362–369. [Google Scholar] [CrossRef]
- Pinto, L.A.; Quintino, L.; Miranda, R.M.; Carr, P. Laser Welding of Dissimilar Aluminium Alloys with Filler Materials. Weld. World 2010, 54, R333–R341. [Google Scholar] [CrossRef]
- Wang, B.; Xue, S.B.; Ma, C.L.; Wang, J.X.; Lin, Z.Q. Study in wire feedability-related properties of Al-5Mg solid wire electrodes bearing Zr for high-speed train. Metals 2017, 7, 520. [Google Scholar] [CrossRef]
- Shi, W.X.; Gao, B.; Tu, G.F.; Li, S.W. Effect of Nd on microstructure and wear resistance of hypereutectic Al–20%Si alloy. J. Alloys Compd. 2010, 508, 480–485. [Google Scholar] [CrossRef]
- Xing, P.F.; Gao, B.; Zhuang, Y.X.; Liu, K.H.; Tu, G.F. Effect of erbium on properties and microstructure of Al-Si eutectic alloy. J. Rare Earths 2010, 28, 927–930. [Google Scholar] [CrossRef]
- Li, Q.L.; Xia, T.D.; Lan, Y.F.; Li, P.F. Effects of melt superheat treatment on microstructure and wear behaviours of hypereutectic Al–20Si alloy. Mater. Sci. Technol. 2014, 30, 835–841. [Google Scholar] [CrossRef]
- Das, A.; Kotadia, H.R. Effect of high-intensity ultrasonic irradiation on the modification of solidification microstructure in a Si-rich hypoeutectic Al–Si alloy. Mater. Chem. Phys. 2011, 125, 853–859. [Google Scholar] [CrossRef]
- Hosch, T.; Napolitano, R.E. The effect of the flake to fiber transition in silicon morphology on the tensile properties of Al–Si eutectic alloys. Mater. Sci. Eng. A 2010, 528, 226–232. [Google Scholar] [CrossRef]
- Gao, T.; Bian, Y.H.; Liu, X.F. A novel Zn-Cu-P master alloy and its modification performance on primary Si of A390 alloy. Results Phys. 2019, 12, 1006–1010. [Google Scholar] [CrossRef]
- Qin, J.Y.; Zuo, M.; Gu, T.K.; Liu, X.F. The featured local structural units in liquid Al80Si15P5 alloy and their relationship with Si modification. J. Alloys Compd. 2010, 492, 525–528. [Google Scholar] [CrossRef]
- Kim, M. Electron back scattering diffraction (EBSD) analysis of hypereutectic Al−Si alloys modified by Sr and Sc. Met. Mater. Int. 2007, 13, 103. [Google Scholar] [CrossRef]
- Kilicaslan, M.F.; Lee, W.-R.; Lee, T.-H.; Sohn, Y.; Hong, S.-J. Effect of Sc addition on the microstructure and mechanical properties of as-atomized and extruded Al–20Si alloys. Mater. Lett. 2012, 71, 164–167. [Google Scholar] [CrossRef]
- Qiu, C.R.; Miao, S.N.; Li, X.R.; Xia, X.C.; Ding, J.; Wang, Y.N.; Zhao, W.M. Synergistic effect of Sr and La on the microstructure and mechanical properties of A356.2 alloy. Mater. Des. 2017, 114, 563–571. [Google Scholar] [CrossRef]
- Tang, P.; Li, W.F.; Zhao, Y.J.; Wang, K.; Li, W.Z.; Zhan, F. Influence of strontium and lanthanum simultaneous addition on microstructure and mechanical properties of the secondary Al-Si-Cu-Fe alloy. J. Rare Earths 2017, 35, 485–493. [Google Scholar] [CrossRef]
- Dong, Y.; Zheng, R.G.; Lin, X.P.; Ye, J.; Sun, L. Investigation on the modification behavior of A356 alloy inoculated with a Sr-Y composite modifier. J. Rare Earths 2013, 31, 204–208. [Google Scholar] [CrossRef]
- Farahany, S.; Ourdjini, A.; Abu Bakar, T.A.; Idris, M.H. A new approach to assess the effects of Sr and Bi interaction in ADC12 Al–Si die casting alloy. Thermochim. Acta 2014, 575, 179–187. [Google Scholar] [CrossRef]
- Farahany, S.; Idris, M.H.; Ourdjini, A. Effect of bismuth and strontium interaction on the microstructure development, mechanical properties and fractography of a secondary Al–Si–Cu–Fe–Zn alloy. Mater. Sci. Eng. A 2015, 621, 28–38. [Google Scholar] [CrossRef]
- Praveen, P.; Yarlagadda, P.K.D.V. Meeting challenges in welding of aluminum alloys through pulse gas metal arc welding. J. Mater. Process. Technol. 2005, 164, 1106–1112. [Google Scholar] [CrossRef]
- La Torre, E.A.-D.; Pérez-Bustamante, R.; Camarillo-Cisneros, J.; Gómez-Esparza, C.D.; Medrano-Prieto, H.M.; Martínez-Sánchez, R. Mechanical properties of the A356 aluminum alloy modified with La/Ce. J. Rare Earths 2013, 31, 811–816. [Google Scholar] [CrossRef]
- Ouyang, Z.Y.; Mao, X.M.; Hong, M. The influence of strontium and rare earth elements on the surface oxide film’s protective effect of A356 aluminum alloy melt. Foundry 2006, 10, 1071–1074. [Google Scholar]
- Tsai, Y.C.; Chou, C.Y.; Lee, S.L.; Lin, C.K.; Lin, J.C.; Lim, S.W. Effect of trace La addition on the microstructures and mechanical properties of A356 (Al–7Si–0.35Mg) aluminum alloys. J. Alloys Compd. 2009, 487, 157–162. [Google Scholar] [CrossRef]
- Jiang, W.M.; Fan, Z.T.; Dai, Y.C.; Li, C. Effects of rare earth elements addition on microstructures, tensile properties and fractography of A357 alloy. Mater. Sci. Eng. A 2014, 597, 237–244. [Google Scholar] [CrossRef]
- Han, K.; Mao, X.M.; Ouyang, Z.Y.; Miao, C.R.; Zhang, G.Q. RE alloy behavior in cast Al alloy melt during degassing. Spec. Cast. Nonferr. Alloys 2004, 2, 61–62. [Google Scholar]
- Alkahtani, S.A.; Elgallad, E.M.; Tash, M.M.; Samuel, A.M.; Samuel, F.H. Effect of Rare Earth Metals on the Microstructure of Al-Si Based Alloys. Materials 2016, 9, 45. [Google Scholar] [CrossRef]
- Xue, P.; Zhou, Q.; Wang, K.H.; Zhang, D.K.; He, P.; Long, W.M.; Zhong, S.J. Effect of Ga/Nd composite additive on the wettability and microstructure of low silver Sn-Ag-Cu solder. Trans. Chin. Weld. Inst. 2016, 37, 33–36. [Google Scholar]
- Wang, X.Q.; Ding, W.Z. Research of gas activity in aluminum alloys. J. Chin. Rare Earth Soc. 2002, 20, 241–245. [Google Scholar]
- Li, D.Y.; He, Z.M.; Zhao, Y.G.; Wang, S.S.; Liu, Z.D. Effect of rare earth elements on the formation of gas blowholes in cast aluminum alloy. J. Chin. Rare Earth Soc. 1987, 5, 39–46. [Google Scholar]
- Drouzy, M.; Jacob, S.; Richard, M. Interpretation of tensile results by means of quality index and probable yield strength-application to Al-Si7 Mg foundry alloys-France. Int. Cast Met. J. 1980, 5, 43–50. [Google Scholar]
- Samuel, A.M.; Gauthier, J.; Samuel, F.H. Microstructural aspects of the dissolution and melting of Al2Cu phase in Al-Si alloys during solution heat treatment. Metall. Mater. Trans. A 1996, 27, 1785–1798. [Google Scholar] [CrossRef]
- Liao, H.C.; Sun, G.X. Mutual poisoning effect between Sr and B in Al–Si casting alloys. Scr. Mater. 2003, 48, 1035–1039. [Google Scholar] [CrossRef]
- Wang, B.; Xue, S.B.; Wang, J.X.; Lin, Z.Q. Effect of combinative addition of mischmetal and titanium on the microstructure and mechanical properties of hypoeutectic Al-Si alloys used for brazing and/or welding consumables. J. Rare Earths 2017, 35, 193–202. [Google Scholar] [CrossRef]
- Xue, P.; Liang, W.L.; Wang, K.H.; He, P.; Long, W.M.; Zhong, S.J.; Luo, H.M. Mechanical property of joint soldered with SnAgCu containing ultra-low silver content. Trans. Chin. Weld. Inst. 2017, 38, 29–32. [Google Scholar]
- Wang, B.; Xue, S.B.; Ma, C.L.; Wang, J.X.; Lin, Z.Q. Effects of Porosity, Heat Input and Post-Weld Heat Treatment on the Microstructure and Mechanical Properties of TIG Welded Joints of AA6082-T6. Metals 2017, 7, 463. [Google Scholar] [CrossRef]
© 2019 by the authors. Licensee MDPI, Basel, Switzerland. This article is an open access article distributed under the terms and conditions of the Creative Commons Attribution (CC BY) license (http://creativecommons.org/licenses/by/4.0/).