Abstract
Submerged entry nozzle (SEN) clogging is a troublesome phenomenon in the continuous casting process that can induce the asymmetric mold flow, and thus, lowering the steel product quality. In this paper, a mathematical model coupling the electromagnetic and flow fields, was developed to investigate the influence of the SEN clogging rate on the flow field and the influence of electromagnetic stirring (EMS) on the asymmetric mold flow. Slag entrapment index Rc was introduced to quantify the possibility of slag entrapment, and symmetric index S was introduced to quantify the symmetry of the flow field. The results show that as the SEN clogging rate increased, the slag entrapment index Rc increased, while the symmetric index S decreased. EMS can greatly improve the symmetry of the flow field with SEN clogging, but it cannot remove the asymmetric phenomenon completely because the stirring intensity should be controlled below the safe level to avoid slag entrapment.
1. Introduction
In the continuous casting process, submerged entry nozzle (SEN) clogging is a severe problem [1,2] because SEN clogging can induce asymmetric flow in the mold, resulting in several undesirable consequences, such as reduced productivity, increased casting costs, and degradation of the quality of the steel product [3]. Therefore, the prevention of SEN clogging and the optimization of the asymmetric flow are important to improve the steel quality.
Many fluid dynamical investigations regarding SEN clogging have been performed. Their focuses were mainly on clogging classification [4,5], clogging causes [6,7], and clogging mechanisms [6,8]. On the other hand, several methods have also been adopted to avoid SEN clogging: argon injection [3,9], SEN material modification [10,11,12], and SEN geometry modification [13,14]. Despite a large number of scientific contributions, only a few studies have investigated the influence of the SEN clogging rate on the flow pattern in the mold. By clogging one of the SEN ports, Cho et al. [15] applied the computational and experimental approaches with a one-third scale water model to investigate the effect of the nozzle clogging rate on the surface flow and vortex formation in a continuous casting mold. Srinivas et al. [16] used a water model to study the vortex characteristics induced by the nozzle clogging rate in a slab mold. However, research of the quantitative relationship between the clogging rate and the mold flow is still lacking.
It seems that almost all of these previous experiments were conducted to study the prevention and reduction of SEN clogging rather than to find a way to optimize the adverse flow pattern of SEN clogging. Argon gas is often injected to prevent SEN clogging, which can also change the flow pattern in the mold [17,18]. Unfortunately, argon gas injections can produce residual bubbles, which cannot be removed completely, resulting in interior defects [19,20]. Instead, electromagnetic stirring (EMS) is a more attractive method to dynamically control the flow behavior due to its lack of contact with molten steel [21,22]. EMS has shown the ability to optimize the adverse mold flow without inducing other negative effects [23,24]. However, few researchers have attempted to use EMS to optimize the asymmetric mold flow with SEN clogging.
The aim of this paper is to clarify the influence of the SEN clogging rate on the mold flow and to investigate whether EMS can optimize the asymmetric mold flow with SEN clogging or not. In this study, a mathematical model coupling the electromagnetic and fluid flow fields is developed. The calculated electromagnetic flux density data were compared with the measured results to verify the electromagnetic field model. The influence of the SEN clogging rate on free-surface flow and the symmetry of the flow field is analyzed. Finally, the influence of EMS on the asymmetric mold flow with SEN clogging is discussed.
2. Mathematical Model
In this study, numerical simulation of the asymmetric mold flow with EMS was divided into two steps. Firstly, Maxwell’s equations were solved to determine the electromagnetic field using the commercial software ANSYS Multiphysics (ANSYS 18.0, ANSYS Inc., Pittsburgh, PA, USA). Secondly, the time-averaged electromagnetic volume force data were loaded into the momentum equation as a source term to simulate the flow behavior in the slab continuous casting mold using the software CFX (ANSYS 18.0, ANSYS Inc., Pittsburgh, PA, USA), taking the influence of EMS into consideration. The following assumptions were made to simplify our numerical simulation:
- (1)
- Molten steel was considered as a steady and incompressible Newtonian flow. The solidification process was neglected [25].
- (2)
- All material properties were constant.
- (3)
- The mold curvature was not taken into consideration [25].
- (4)
- The level fluctuation of the steel–slag interface was ignored.
- (5)
- The influence of molten steel on the electromagnetic field was neglected due to the very small magnetic Reynolds number [26].
2.1. Electromagnetic Model
The electromagnetic field was determined by solving Maxwell’s equations:
where is magnetic flux density, T; σ is electric conductivity, S/m; is electric field strength, V/m; is induced current density, A/m2; is magnetic field strength, A/m.
Because the electromagnetic field period is far shorter than the momentum response time of molten steel, the time-average induced electromagnetic volume force could be used to couple with the flow field. It can be defined as [27]:
where is time-average electromagnetic volume force, N/m3; is the complex conjugate of ; and denotes the real part of the complex quantity.
2.2. Fluid Flow Model
Both continuity and momentum equations were used to describe the flow field of molten steel in the mold.
Continuity equation:
Momentum equation:
where ρ, , p and are the density (kg/m3), fluid velocity (m/s), pressure (Pa), and the time-average electromagnetic volume force (N/m3), respectively; and is the effective turbulent viscosity (Pa·s), as follows:
where is the molecular viscosity of molten steel (Pa·s); is the turbulent viscosity (Pa·s).
The κ−ε model assumes that the turbulence viscosity is linked to the turbulence kinetic energy and dissipation, via the following relation:
Turbulent kinetic equation:
Dissipation rate of turbulent kinetic energy:
where the empirical constants, Cε1, Cε2, Cμ, σκ, and σε take the standard values of 1.44, 1.92, 0.09, 1.0, and 1.3, respectively [21]; and Pκ is the production of turbulence kinetic energy due to the mean velocity gradients:
2.3. Geometrical Model and Boundary Conditions
2.3.1. Geometry Model
Figure 1a shows the geometry model for electromagnetic calculation. Two electromagnetic stirrers were installed on both sides of the mold, and each stirrer had 36 coils around the straight iron core. The thickness of the narrow and wide walls of the mold were 40 and 25 mm, respectively. The stirrer was fed by a three-phase AC power with a frequency of 3 Hz to generate a traveling magnetic field. Figure 1b shows the geometry model for fluid flow calculation. The whole fluid domain was divided into 1.83 million hexahedral meshes. Three different SENs with different clogging rates are illustrated to describe the clogging condition in Figure 2. Clogged SEN ports had the cross-sectional areas of their left ports decreased by 0%, 20%, and 40%, relative to the non-clogged right port. Some other geometric parameters and material properties used in our simulation are listed in Table 1.
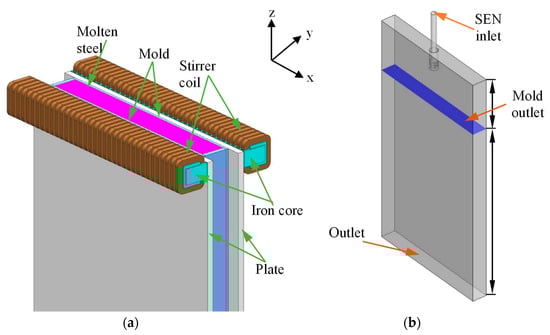
Figure 1.
Schematics of the simulated model. (a) Electromagnetic model, (b) fluid flow model.
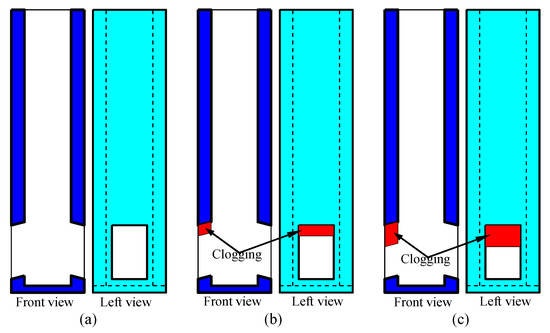
Figure 2.
Schematic of the submerged entry nozzle (SEN; dimensions are in mm): (a) non-clogging; (b) 20% clogging rate; (c) 40% clogging rate.

Table 1.
Main dimensions and parameters.
2.3.2. Boundary Conditions for Electromagnetic Simulation
To capture a great part of the magnetic field lines closing in the surrounding air, an air cuboid (3.3 m × 2.0 m × 4.5 m) around the whole geometry model was adopted. Magnetically flux parallel boundary conditions were employed for the external surfaces of the surrounding air cuboid [28].
2.3.3. Boundary Conditions for Flow Simulation
The inlet velocity was determined through the mass conservation between the inlet and the outlet, regarding the casting speed. The values of turbulent kinetic energy and its dissipation rate were computed using the semi-empirical equations. The free-surface was specified with the free-slip boundary condition. Pressure outlet boundary condition was adopted for the outlet. No-slip condition and standard wall function laws were applied to the other walls [29].
3. Results and Discussion
3.1. Validation of Electromagnetic Model
In order to confirm the accuracy and usefulness of the electromagnetic calculation model, we compared the measured and the calculated electromagnetic flux density data, as shown in Figure 3. The electromagnetic flux density with an EMS current of 600 A and a frequency of 3 Hz was measured in an empty mold. The validated current of 600 A is also the default current value used for the industrial operation. The calculated electromagnetic flux density distribution at the central level of the stirrer across the wide face matched well with the measured results, and the predicted value and distribution tendency were both consistent.
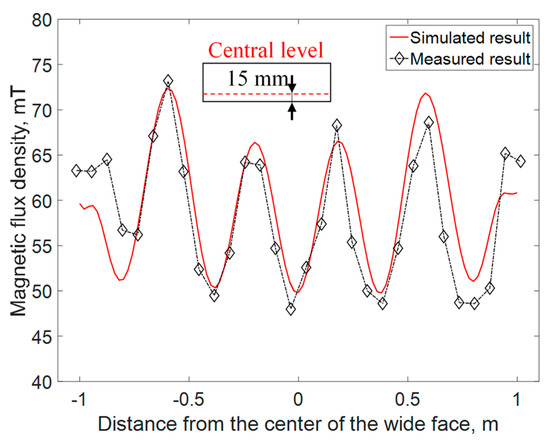
Figure 3.
Distribution of electromagnetic flux density with EMS current of 600 A and frequency of 3 Hz.
3.2. Effect of EMS Current on Electromagnetic Field
Figure 4a shows the vector and contour distribution of electromagnetic flux density on the central level of the stirrer. The distribution of electromagnetic flux density is centrosymmetric. Five minimum zones appear at the interior of the cross section. Electromagnetic flux density at the edge is much larger. The value of electromagnetic flux density ranges from 10 to 85 mT. Figure 4b shows the vector and contour distribution of time-averaged electromagnetic force. The distribution of electromagnetic force is also centrosymmetric, originating from the similar distribution of electromagnetic flux density. The tangential components of electromagnetic force near the parallel edges were the same, but their directions were opposite to each other, thus, producing a horizontal recirculation. Electromagnetic force at the edge of a wide face was larger and decreased gradually with distance from the exterior to the interior. Six eddy distributions of electromagnetic force occurred in the interior region. Furthermore, the minimum and the maximum values were 400 and 2800 N/m3, respectively.
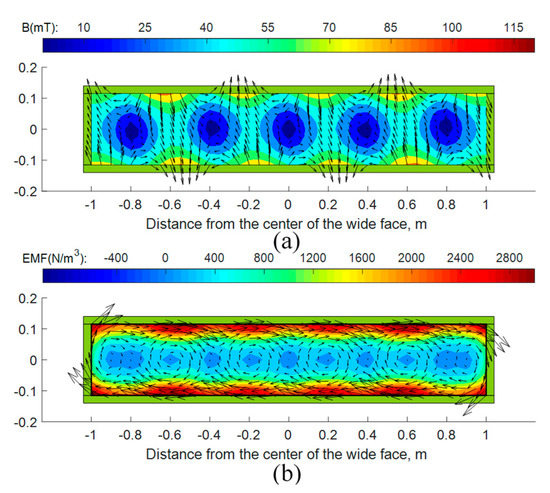
Figure 4.
Vector and contour distribution of the electromagnetic field with an EMS current of 600 A and frequency of 3 Hz. (a) Electromagnetic flux density; (b) time-averaged electromagnetic force.
Figure 5 shows the distribution of time-averaged electromagnetic force with different EMS currents along the central line of X = 0 m and Y = 0.1 m. The black dashed line in this picture represents the central level of the stirrer. It can be concluded that the electromagnetic force increased with the increase of the EMS current. With the increase of distance from the meniscus, the electromagnetic force first increased and then decreased, while the maximum value occurred 0.032 m below the central level of the stirrer (shown as the red dashed line). This is more likely due to the fact that an electromagnetic force is generated from the interaction between the magnetic field and the induced current, while the distribution of the induced current near the meniscus is restricted due to the existence of the top surface of the mold. Moreover, it should be noticed that for the region of 0.4 m below the meniscus, the electromagnetic force was close to zero, suggesting that the influence of EMS on fluid flow could be ignored.
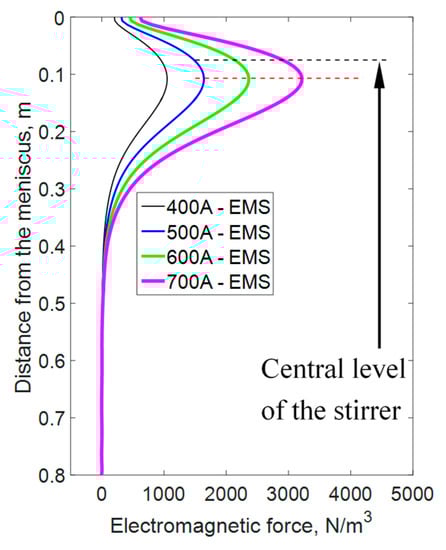
Figure 5.
Distribution of time-averaged electromagnetic force along the longitudinal central line of the wide face with an EMS frequency of 3 Hz.
3.3. Effect of SEN Clogging Rate on Mold Flow
3.3.1. Effect of SEN Clogging Rate on Free Surface Flow
Free-surface flow plays a significantly important role in the continuous casting process because the solidification begins below the meniscus. A too-high free surface flow velocity may destroy the stability of the steel–slag interface, resulting in slag entrapment. Chaudhary reported that the free surface velocity should be smaller than 0.4 m/s [30]. In order to quantify the possibility of slag entrapment, slag entrapment index Rc was introduced. The definition of index Rc is as follows:
where v is the velocity of free-surface flow, m/s; vc is the critical velocity, 0.4 m/s; Sv>vc is the area of the region where the flow velocity was larger than the critical velocity, m2; Stop is the total area of the top face of the mold, m2. We believe slag entrapment may become serious with the increase of Rc.
Figure 6 depicts the vector distribution of the velocity field without EMS at the free surface under different SEN clogging rates. All of them were performed under the same casting speed of 1.5 m/min. The red dashed lines in these pictures represent the critical free-surface velocity of 0.4 m/s; within them, the flow velocity was larger than the critical velocity, named as the excessive active region. Meanwhile, beyond them, the flow velocity was smaller than the critical velocity.
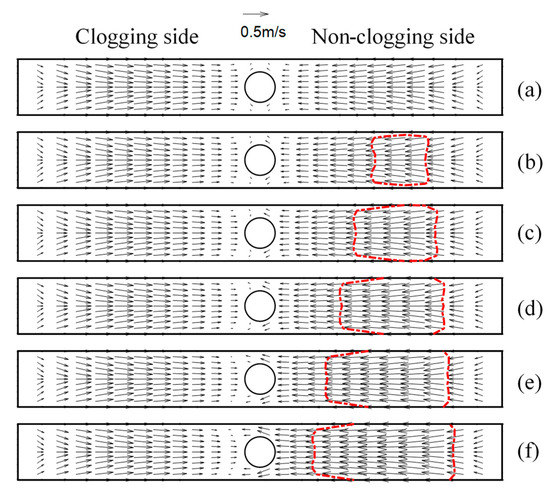
Figure 6.
Vector distribution of velocity field without EMS at the free surface. (a) Non-clogging, (b) 10%-clogging rate, (c) 20%-clogging rate, (d) 30%-clogging rate, (e) 40%-clogging rate, (f) 50%-clogging rate.
In Figure 6, it can be seen that when EMS was not applied, molten steel tended to flow from the narrow face to the SEN. However, when the SEN clogging occurred, the flow at the non-clogging side was much stronger than that at the clogging side. This suggests that when the SEN port is clogging, more molten steel tends to escape from the non-clogging side rather than the clogging side, and the symmetry of flow field is destroyed by SEN clogging. Furthermore, as the SEN clogging rate increases, the excessive region at the non-clogging side becomes larger, and the difference between the clogging side and the non-clogging side becomes more obvious.
Figure 7 shows the slag entrapment index Rc under different SEN clogging rates. From this figure, it can be observed that with the increase of SEN clogging rate, the slag entrapment index increased. When the SEN clogging rate increased from 10% to 50%, the slag entrapment index Rc increased from 0.125 to 0.337. This indicates that high SEN clogging rate may aggravate the slag entrapment phenomenon.
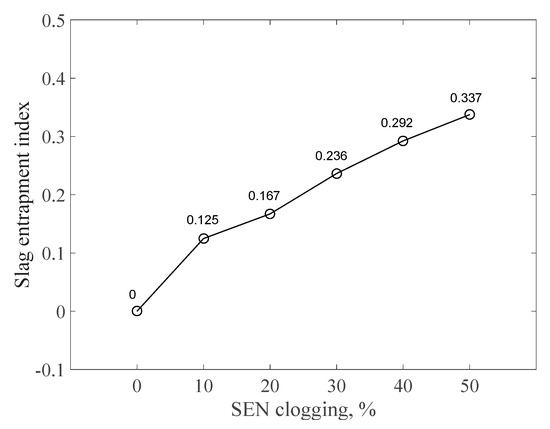
Figure 7.
Slag entrapment index under different SEN clogging rates.
3.3.2. Effect of SEN Clogging Rate on the Symmetry of Flow Field
SEN clogging can destroy the symmetry of the flow field. This means that the distribution of the temperature field with SEN clogging is not uniform, inducing the non-uniform development of the solidified shell. In our previous paper, we introduced the symmetric index S to quantitatively judge whether the horizontal flow pattern is symmetric or not [31]. In this study, we chose the symmetry of the horizontal plane where the electromagnetic force reached its maximum to characterize the symmetry of flow field with SEN clogging. The definition of symmetric index S is as follows:
where u is the 2D velocity of the characterized point, m/s; subscript Mi and Ni denote the centrosymmetric points; n = 201; ux is the x-component velocity, m/s; and uy is the y-component velocity, m/s. The integration paths in Equation (14) are described as the two black dash lines in Figure 8. S index indicates the symmetry of the flow field. Symmetric index S is close to 1 when the flow field is close to symmetry, while S is close to 0 when the flow field is not close to symmetry.
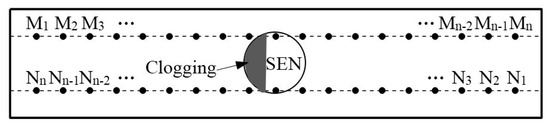
Figure 8.
Integral path for symmetric index.
Figure 9 shows the symmetrical index of the flow field without EMS under different SEN clogging rates. It can be observed from Figure 9 that the symmetry of the flow field without EMS decreased with the increase of the SEN clogging rate. For example, when the SEN clogging rate increased from 0 to 50%, the symmetrical index decreased from 1 to 0.57. This suggests that SEN clogging can destroy the symmetry of the flow field, and with the increase of the SEN clogging rate, the asymmetric phenomenon becomes serious.
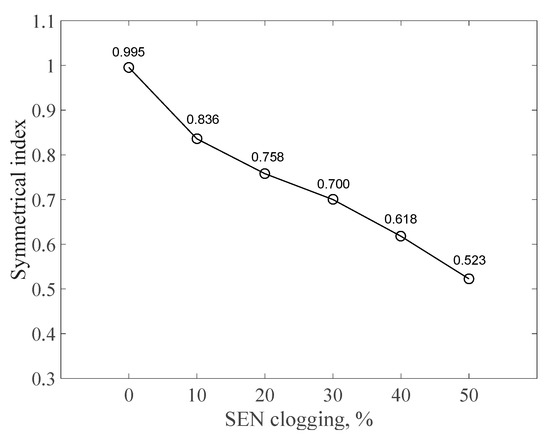
Figure 9.
Symmetrical index under different SEN clogging rates.
3.4. Effect of EMS on the Asymmetric Mold Flow
3.4.1. Effect of EMS on Free Surface Flow with SEN Clogging
The previous discussions have shown that SEN clogging can destroy the symmetry of the flow field, inducing the asymmetric phenomenon in the mold, and thus, resulting in some undesirable consequences, such as the unreasonable free-surface flow, the non-uniform solidified shell, and the uneven distribution of the residual inclusions. Therefore, in order to eliminate the adverse effects of SEN clogging, we attempted to introduce EMS to optimize the asymmetric phenomenon in the mold.
Figure 10 shows the vector distribution of the velocity field with the 50%-clogging rate at the free surface under different EMS currents. All of them were performed under the same casting speed of 1.5 m/min. When EMS was not applied, molten steel tended to flow from the narrow face to the SEN, and the flow at the non-clogging side was stronger than that at the clogging side. But, when EMS was applied, a horizontal recirculating flow was generated, and the flow near the mold wall was accelerated. Furthermore, as the EMS current increased, the recirculating tendency became obvious, but the area of the excessive active region reduced first and then enlarged, and the excessive active region transferred from the non-clogging side to the clogging side, following the recirculation direction of the electromagnetic force. This suggests that the asymmetric free-surface flow can be optimized by the application of EMS. However, there was no eddy distribution of the velocity field at the free surface, which was different from the distribution of the electromagnetic force (shown in Figure 4b). This can be attributed to the large inertia force of molten steel.
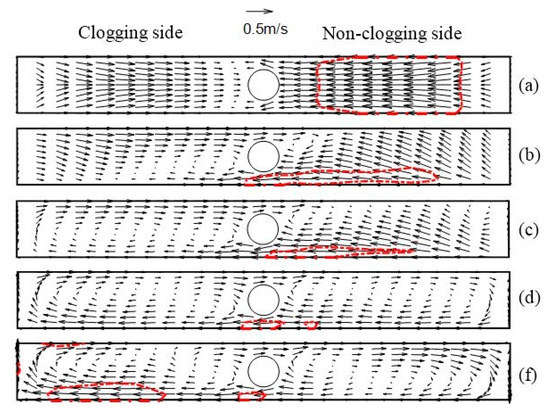
Figure 10.
Vector distribution of velocity field at the free surface with 50%-clogging rate: (a) 0 A EMS, (b) 400 A EMS, (c) 500 A EMS, (d) 600 A EMS, (e) 700 A EMS.
Figure 11 depicts the contour map of Rc with different EMS currents and different SEN clogging rates. From this figure, it can be seen that Rc increased with the increase of SEN clogging rate, indicating that SEN clogging can stimulate free-surface flow, and thereby, destroying the stability of the steel-slag interface, leading to slag entrapment. On the other hand, when the SEN port was not clogging, Rc increased with the increasing EMS current. However, when the SEN port was clogging and the EMS current increased, Rc decreased first and then increased. To quantify the influence of the SEN clogging rate and EMS current, a critical Rc of 0.15 (shown as the red dashed line) was chosen in this paper, below which Rc should be controlled to avoid slag entrapment. As depicted in Figure 11, for the SEN clogging rate of 50%, the EMS current should range from 440 A to 670 A. Therefore, it can be concluded that EMS can optimize the asymmetric free-surface flow to some extent, but the stirring intensity should be controlled below a safe level to avoid slag entrapment.
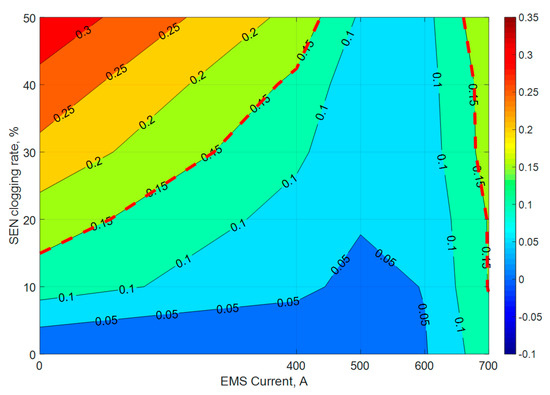
Figure 11.
Contour map of Rc with different EMS currents and different clogging rates.
3.4.2. Effect of EMS on the Symmetry of Flow Field with SEN Clogging
Figure 12 shows the symmetrical index under different EMS currents and different SEN clogging rates. From this figure, it can be seen that when EMS was not applied, the symmetry of the flow field became worse with the increase of the SEN clogging rate. For example, when the SEN clogging rate increased from 0 to 50%, the symmetrical index decreased from 1 to 0.57 because when the SEN clogging occurs, molten steel tends to escape from the non-clogging side rather than the clogging side. But when EMS was applied, the symmetrical index was improved greatly, and with the increase of EMS current, the symmetrical index also increased. When the EMS current increased from 400 A to 700 A, the symmetrical index of the flow field with 50%-clogging rate increased from 0.57 to 0.75. This indicates that EMS can optimize the symmetry of the flow field to some extent, and increasing the EMS current can improve the optimization effect. However, an EMS current of 700 A cannot be applied in the actual operating process, because too strong stirring intensity may destroy the stability of the steel–slag interface, inducing slag entrapment. Thus, it can be concluded that when the SEN clogging is slight, EMS can optimize the asymmetrical phenomenon; but when the SEN clogging is serious, the asymmetric phenomena of flow field cannot be removed completely by EMS.
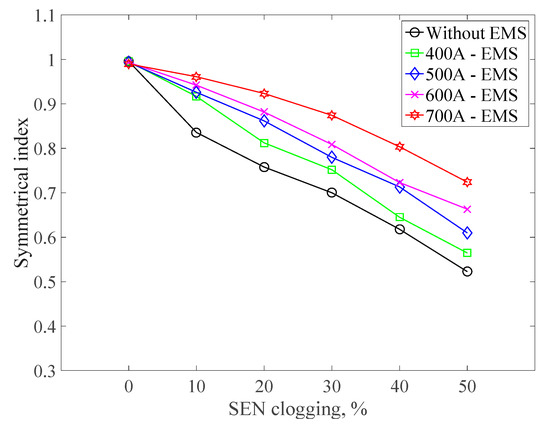
Figure 12.
Symmetrical index for different EMS currents and different clogging rates.
4. Conclusions
A mathematical model coupling the electromagnetic and flow fields was developed to investigate the influence of the SEN clogging rate on the flow field and the influence of EMS on the asymmetric mold flow. The calculated electromagnetic flux density data were compared with the measured results to verify the electromagnetic field model. Slag entrapment index Rc was introduced to quantify the possibility of slag entrapment. Symmetric index S was introduced to quantify the symmetry of the flow field with SEN clogging. The following conclusions were made:
- (1)
- With the increase of distance from the meniscus, the electromagnetic force first increased and then decreased, and the maximum electromagnetic force occurred 0.032 m below the central level of the stirrer.
- (2)
- When the SEN port was clogging, more molten steel tended to escape from the non-clogging side rather than the clogging side, inducing the asymmetric flow pattern in the mold. When EMS was not applied, as the SEN clogging rate increased, the slag entrapment index Rc increased, but the symmetric index S decreased.
- (3)
- EMS can significantly optimize the adverse free-surface flow and improve the symmetry of the flow field. With the increase of the EMS current, the slag entrapment index Rc first decreased and then increased, while the symmetric index S increased.
- (4)
- Synthetically considering the free-surface flow and the symmetry of the flow field, it can be concluded that when the SEN clogging rate is low, EMS can optimize the asymmetric flow in the mold, but when the SEN clogging rate is high (50%), the asymmetric phenomenon cannot be removed completely because the stirring intensity should be controlled below a safe level to avoid slag entrapment.
Author Contributions
B.L. developed the model, analyzed the data, and wrote the paper; H.L. and Z.L. provided suggestions on modelling and to polish the English language of this work; Y.Z. and Z.R. gave suggestions on the structure of this work.
Funding
This work is financially supported by the National Natural Science Foundation of China (Grant No. U1860107).
Conflicts of Interest
The authors declare no conflict of interest.
References
- Zhang, L.; Wang, Y.; Zuo, X. Flow Transport and Inclusion Motion in Steel Continuous-Casting Mold under Submerged Entry Nozzle Clogging Condition. J. Metall. Mater. Trans. B. 2008, 39, 534–550. [Google Scholar] [CrossRef]
- Gutiérrez, E.; Garcia-Hernandez, S.; Barreto, J.D.J. Mathematical Modeling of Inclusions Deposition at the Upper Tundish Nozzle and the Submerged Entry Nozzle. J. Steel Res. Int. 2016, 87, 1406–1416. [Google Scholar] [CrossRef]
- Bai, H.; Thomas, B.G. Effects of clogging, argon injection, and continuous casting conditions on flow and air aspiration in submerged entry nozzles. J. Metall. Mater. Trans. B. 2001, 32, 707–722. [Google Scholar] [CrossRef]
- Bai, H.; Thomas, B.G. Turbulent flow of liquid steel and argon bubbles in slide-gate tundish nozzles: Part, I. model development and validation. J. Metall. Mater. Trans. B. 2001, 32, 253–267. [Google Scholar] [CrossRef]
- Aksel’rod, L.M.; Baranovskii, M.R.; Mel’nikova, G.G. Clogging of graphite-containing submerged nozzles in casting of steel on a continuous casting machine. J. Refractories. 1991, 32, 661–668. [Google Scholar]
- Fix, W.; Jacobi, H.; Wünnenberg, K. Collision-controlled growth of composites in casting nozzles. J. Steel Res. Int. 1993, 64, 71–76. [Google Scholar] [CrossRef]
- Uemura, K.-I.; Takahashi, M.; Koyama, S. Filtration Mechanism of Non-metallic Inclusions in Steel by Ceramic Loop Filter. J. ISIJ Int. 1992, 32, 150–156. [Google Scholar] [CrossRef]
- Taniguchi, S.; Brimacombe, J.K. Application of Pinch Force to the Separation of Inclusion Particles from Liquid Steel. J. ISIJ Int. 1994, 34, 722–731. [Google Scholar] [CrossRef]
- Jin, K.; Vanka, S.P.; Thomas, B.G. Large Eddy Simulations of Electromagnetic Braking Effects on Argon Bubble Transport and Capture in a Steel Continuous Casting Mold. J. Metall. Mater. Trans. B. 2018, 49, 1360–1377. [Google Scholar] [CrossRef]
- Vermeulen, Y.; Coletti, B.; Blanpain, B. Material Evaluation to Prevent Nozzle Clogging during Continuous Casting of Al Killed Steels. J. ISIJ Int. 2002, 42, 1234–1240. [Google Scholar] [CrossRef]
- Vermeulen, Y.; Coletti, B.; Wollants, P.; Blanpain, B.; Haers, F. Clogging in submerged entry nozzles. J. Steel Res. Int. 2000, 71, 391–395. [Google Scholar] [CrossRef]
- Memarpour, A.; Brabie, V.; Jönsson, P. Studies of effect of glass/silicon powder coatings on clogging behaviour of submerged entry nozzles when using REM alloyed stainless steels. J. Ironmak. Steelmak. 2013, 38, 229–239. [Google Scholar] [CrossRef]
- Machado-Lopez, M.M.; Ramos-Banderas, J.A.; Torres-Alonso, E. Multiphase modelling of liquid steel transfer from tundish to curved billet mould by open stream and equipped with SEN. J. Iron Steel Res. Int. 2013, 40, 326–334. [Google Scholar] [CrossRef]
- Sambasivam, R. Clogging resistant submerged entry nozzle design through mathematical modelling. J. Iron Steel Res. Int. 2006, 33, 439–453. [Google Scholar] [CrossRef]
- Cho, S.M.; Kim, S.H.; Chaudhary, R. Effect of nozzle clogging on surface flow and vortex formation in the continuous casting mold. J. Iron Steel Technology. 2012, 9, 85–95. [Google Scholar]
- Srinivas, P.S.; Singh, A.; Korath, J.M. A water-model experimental study of vortex characteristics due to nozzle clogging in slab caster mould. J. Iron Steel Res. Int. 2017, 44, 473–485. [Google Scholar] [CrossRef]
- Qin, X.; Cheng, C.; Li, Y. A Simulation Study on the Flow Behavior of Liquid Steel in Tundish with Annular Argon Blowing in the Upper Nozzle. J. Metals. 2019, 9, 225. [Google Scholar] [CrossRef]
- Li, Y.; Cheng, C.; Yang, M. Behavior Characteristics of Argon Bubbles on Inner Surface of Upper Tundish Nozzle during Argon Blowing Process. J. Metals. 2018, 8, 590. [Google Scholar] [CrossRef]
- Zhang, L.; Aoki, J.; Thomas, B.G. Inclusion removal by bubble flotation in a continuous casting mold. J. Metall. Mater. Trans. B. 2006, 37, 361–379. [Google Scholar] [CrossRef]
- Yang, H.L.; He, P.; Zhai, Y.C. Removal Behavior of Inclusions in Molten Steel by Bubble Wake Flow Based on Water Model Experiment. J. ISIJ. 2014, 54, 578–581. [Google Scholar] [CrossRef][Green Version]
- Launder, B.E.; Spalding, D.B. The numerical computation of turbulent flows. J. Comput. Method. Appl. M. 1974, 3, 269–289. [Google Scholar] [CrossRef]
- Zhang, L.; Yu, J.; Wang, W. The Effect of Electromagnetic Stirring on the Microstructure Evolution of Cu-15%Co Alloy. J. Metals. 2018, 8, 869. [Google Scholar] [CrossRef]
- He, M.; Zhang, Z.; Mao, W. Numerical and Experimental Study on Melt Treatment for Large-Volume 7075 Alloy by a Modified Annular Electromagnetic Stirring. J. Mater. 2019, 12, 820. [Google Scholar] [CrossRef] [PubMed]
- Li, S.; Xiao, H.; Wang, P. Analysis on Electromagnetic Field of Continuous Casting Mold Including a New Integral Method for Calculating Electromagnetic Torque. J. Metals. 2019, 9, 946. [Google Scholar] [CrossRef]
- Lei, S.; Zhang, J.; Zhao, X. Numerical Simulation of Molten Steel Flow and Inclusions Motion Behavior in the Solidification Processes for Continuous Casting Slab. J. ISIJ Int. 2014, 54, 94–102. [Google Scholar] [CrossRef]
- Moffatt, H.K. Electromagnetic stirring. J. Phys. Fluids A: Fluid Dyn. 1991, 3, 1336–1343. [Google Scholar] [CrossRef]
- Zhang, W.; Luo, S.; Chen, Y. Numerical Simulation of Fluid Flow, Heat Transfer, Species Transfer, and Solidification in Billet Continuous Casting Mold with M-EMS. J. Metals. 2019, 9, 66. [Google Scholar] [CrossRef]
- Yin, Y.; Zhang, J.; Lei, S. Numerical Study on the Capture of Large Inclusion in Slab Continuous Casting with the Effect of In-mold Electromagnetic Stirring. J. ISIJ Int. 2017, 57, 2165–2174. [Google Scholar] [CrossRef]
- Cukierski, K.; Thomas, B.G. Flow Control with Local Electromagnetic Braking in Continuous Casting of Steel Slabs. J. Metall. Mater. Trans. B. 2007, 39, 94–107. [Google Scholar] [CrossRef]
- Chaudhary, R.; Lee, G.-G.; Thomas, B.G. Transient Mold Fluid Flow with Well- and Mountain-Bottom Nozzles in Continuous Casting of Steel. J. Metall. Mater. Trans. B. 2008, 39, 870–884. [Google Scholar] [CrossRef]
- Li, B.; Lu, H.B.; Shen, Z. Physical Modeling of Asymmetrical Flow in Slab Continuous Casting Mold due to Submerged Entry Nozzle Clogging with the Effect of Electromagnetic Stirring. J. ISIJ Int. 2019, 59, 2264–2271. [Google Scholar]


© 2019 by the authors. Licensee MDPI, Basel, Switzerland. This article is an open access article distributed under the terms and conditions of the Creative Commons Attribution (CC BY) license (http://creativecommons.org/licenses/by/4.0/).