Abstract
Al-Zn-Mg-Cu alloys are widely used in aircraft applications because of their superior mechanical properties and strength/weight ratios. Commercial Al-Zn-Mg-Cu alloys have been intensively studied over the last few decades. However, well-considered thermodynamic calculations, via the CALPHAD approach, on a variation of alloying elements can guide the fine-tuning of known alloy systems and the development of optimized heat treatments. In this study, a comparison was made of the solidus temperatures of different Al-Zn-Mg-Cu alloys determined from thermodynamic predictions and differential scanning calorimetry (DSC) measurements. A variation of the main alloying elements Zn, Mg, and Cu generated 38 experimentally produced alloys. An experimental determination of the solidus temperature via DSC was carried out according to a user-defined method, because the broad melting interval present in Al-Zn-Mg-Cu alloys does not allow the use of the classical onset method for pure substances. The software algorithms implemented in FactSage®, Pandat™, and MatCalc with corresponding commercially available databases were deployed for thermodynamic predictions. Based on these investigations, the predictive power of the commercially available CALPHAD databases and software packages was critically reviewed.
1. Introduction
Increasing standards and demands for high strength aluminium alloys for aircraft and automotive applications require the continuous improvement of heat treatment procedures and alloy chemistry to optimise critical properties such as strength, toughness and corrosion resistance. Al-Zn-Mg-Cu alloys (7xxx) are age-hardenable and favourable because of their high strength-to-weight ratio [1,2]. Their simplified precipitation sequence is generally known as [3,4]:
where SSSS represents the supersaturated solid solution after solution treatment and quenching. Cluster and GP zones are formed during natural ageing and in early stages of artificial ageing. The metastable phase η′ is commonly responsible for the main hardening process, whereas the equilibrium phase η is characterized by coarse particles and is typical of overaged conditions [5,6].
SSSS–metastable GP-zones (GP I, GP II)–metastable η′–stable η
The determination of critical parameters for heat treatment procedures is often done via differential scanning calorimetry (DSC), which is a powerful technique for studying the thermodynamics and kinetics of phase changes and measures the heat flow rates in dependence on temperature and/or time [3,7]. In industrial Al-Zn-Mg-Cu alloys DSC has been especially useful to study the precipitation sequence and the possible temperature range for solution heat treatments [3,6].
In addition to experimental determination of the evolution of phases most constitutional quantities can also be predicted computationally via the CALPHAD (CALculation of PHAse Diagrams) approach [8]. CALPHAD uses different semi-empirical models to calculate the Gibbs free energy. These models are mostly generated from experimental findings. Excess Gibbs free energy contributions of non-ideal solutions are also included via semi-empirical models (e.g., Redlich-Kister polynomials) [9,10,11,12,13]. However, in many cases multi-component systems are not fully assessed and are only extrapolated from binary, or in special cases higher order, boundary systems. With this approach, the thermochemical properties of alloys can be described sufficiently [14]. However, the absolute accuracy for detailed alloy systems is largely unknown.
This paper illustrates how state-of-the-art thermodynamic predictions using different software packages and the corresponding databases accord with DSC results from experimentally produced Al-Zn-Mg-Cu alloys. It also illustrates a possible method for estimating the solidus temperature of 7xxx alloys, which show a wide solidification interval. Finally, it discusses the usability of thermodynamic predictions in finding optimized compositions and temperature regimes for successful solution heat treatment procedures.
2. Materials and Methods
For this study model alloys were prepared with Al 0.995 (mass fraction) and binary Al-X master alloys (X = Cu, Mn, Fe, Cr, and Ti) and pure Si, Mg, and Zn, respectively, as starting materials using an inductive melting furnace (ITG Induktionsanlagen GmbH, Hirschhorn/Neckar, Germany). To check the chemical composition, optical emission spectrometry (SPECTROMAXx from SPECTRO, Kleve, Germany) was applied during the alloying procedure and to the final products. All 7xxx example alloys are roughly variations of AA 7075 alloys; their chemical compositions are listed in Table 1. The alloy ingots were homogenized in a Nabertherm N60/85 SHA circulating air furnace at 455 °C for 4 h, and 10 h at 465 °C. The additional higher temperature was chosen in case of insufficient effectiveness at the lower temperature. Finally, the alloys were hot compressed to convert the cast structure into a wrought microstructure.

Table 1.
Chemical composition of the alloys measured with emission spectrometry.
DSC measurements were performed on a Netzsch DSC 204 F1 Phoenix (Netzsch Gerätebau GmbH, Selb/Bayern, Germany) at a heating rate of 10 K/min for specimens of 4 mm × 2 mm × 0.5 mm. Samples were put into an Al2O3 pan in the DSC apparatus at room temperature and cooled to −40 °C at highest possible rate and equilibrated for 10 min while employing a nitrogen gas flow of 20 mL·min−1. Thus, levelling of the DSC apparatus occurred at the low starting temperature and not at the interesting region above room temperature. Measurements were performed between −40 °C and 700 °C; baseline correction was performed during experiments which comprised a single DSC run using two empty Al2O3 pans (one as reference, the other for measuring test alloys).
Thermodynamic equilibrium calculations were performed using FactSage® 7 software [15] together with the FACT FTlite light alloy database (2015). Calculations with the MatCalc program were carried out with MC_AL_V2.029 database (2015). Pandat calculations were performed using the PanAl2013 [16] database.
3. Results and Discussion
Figure 1 represents the thermodynamically calculated freezing range of alloy #38 (arbitrarily chosen). Obviously the coincidence of the calculations is rather low. For the solidus temperature the results differ quite strongly, ranging from 510 °C (Pandat™) to 549 °C (MatCalc). At higher temperatures, a nearly identical result is seen for all three thermodynamic programs. The temperatures where the fcc phase vanishes range from 636 °C (FactSage®) to 639 °C (MatCalc). The difference between solidus temperature and full melting of the fcc phase may stem from the small fraction of liquid formed over a large temperature interval near the solidus temperature and a large fraction of liquid formed at higher temperatures over a small temperature interval.
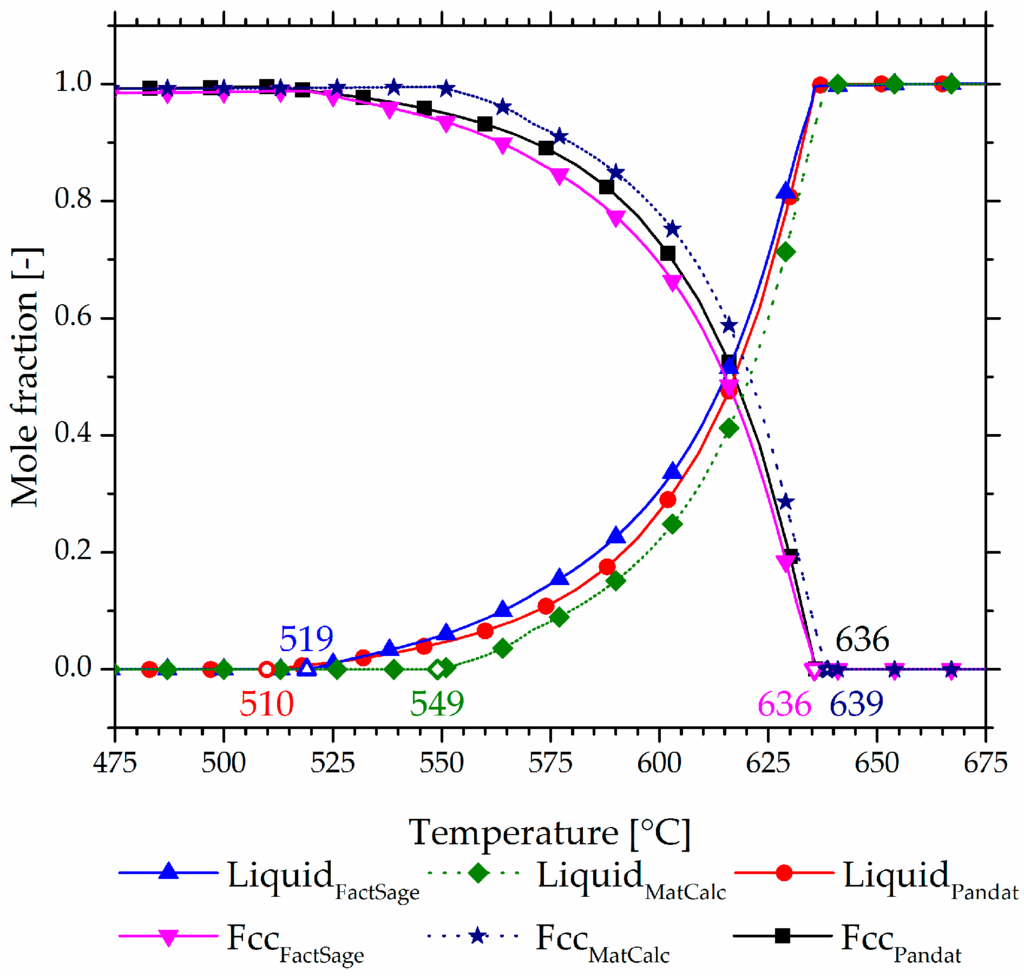
Figure 1.
Thermodynamic calculation of solidus and liquidus temperatures of experimental alloy #38 using FactSage®, MatCalc, and Pandat™.
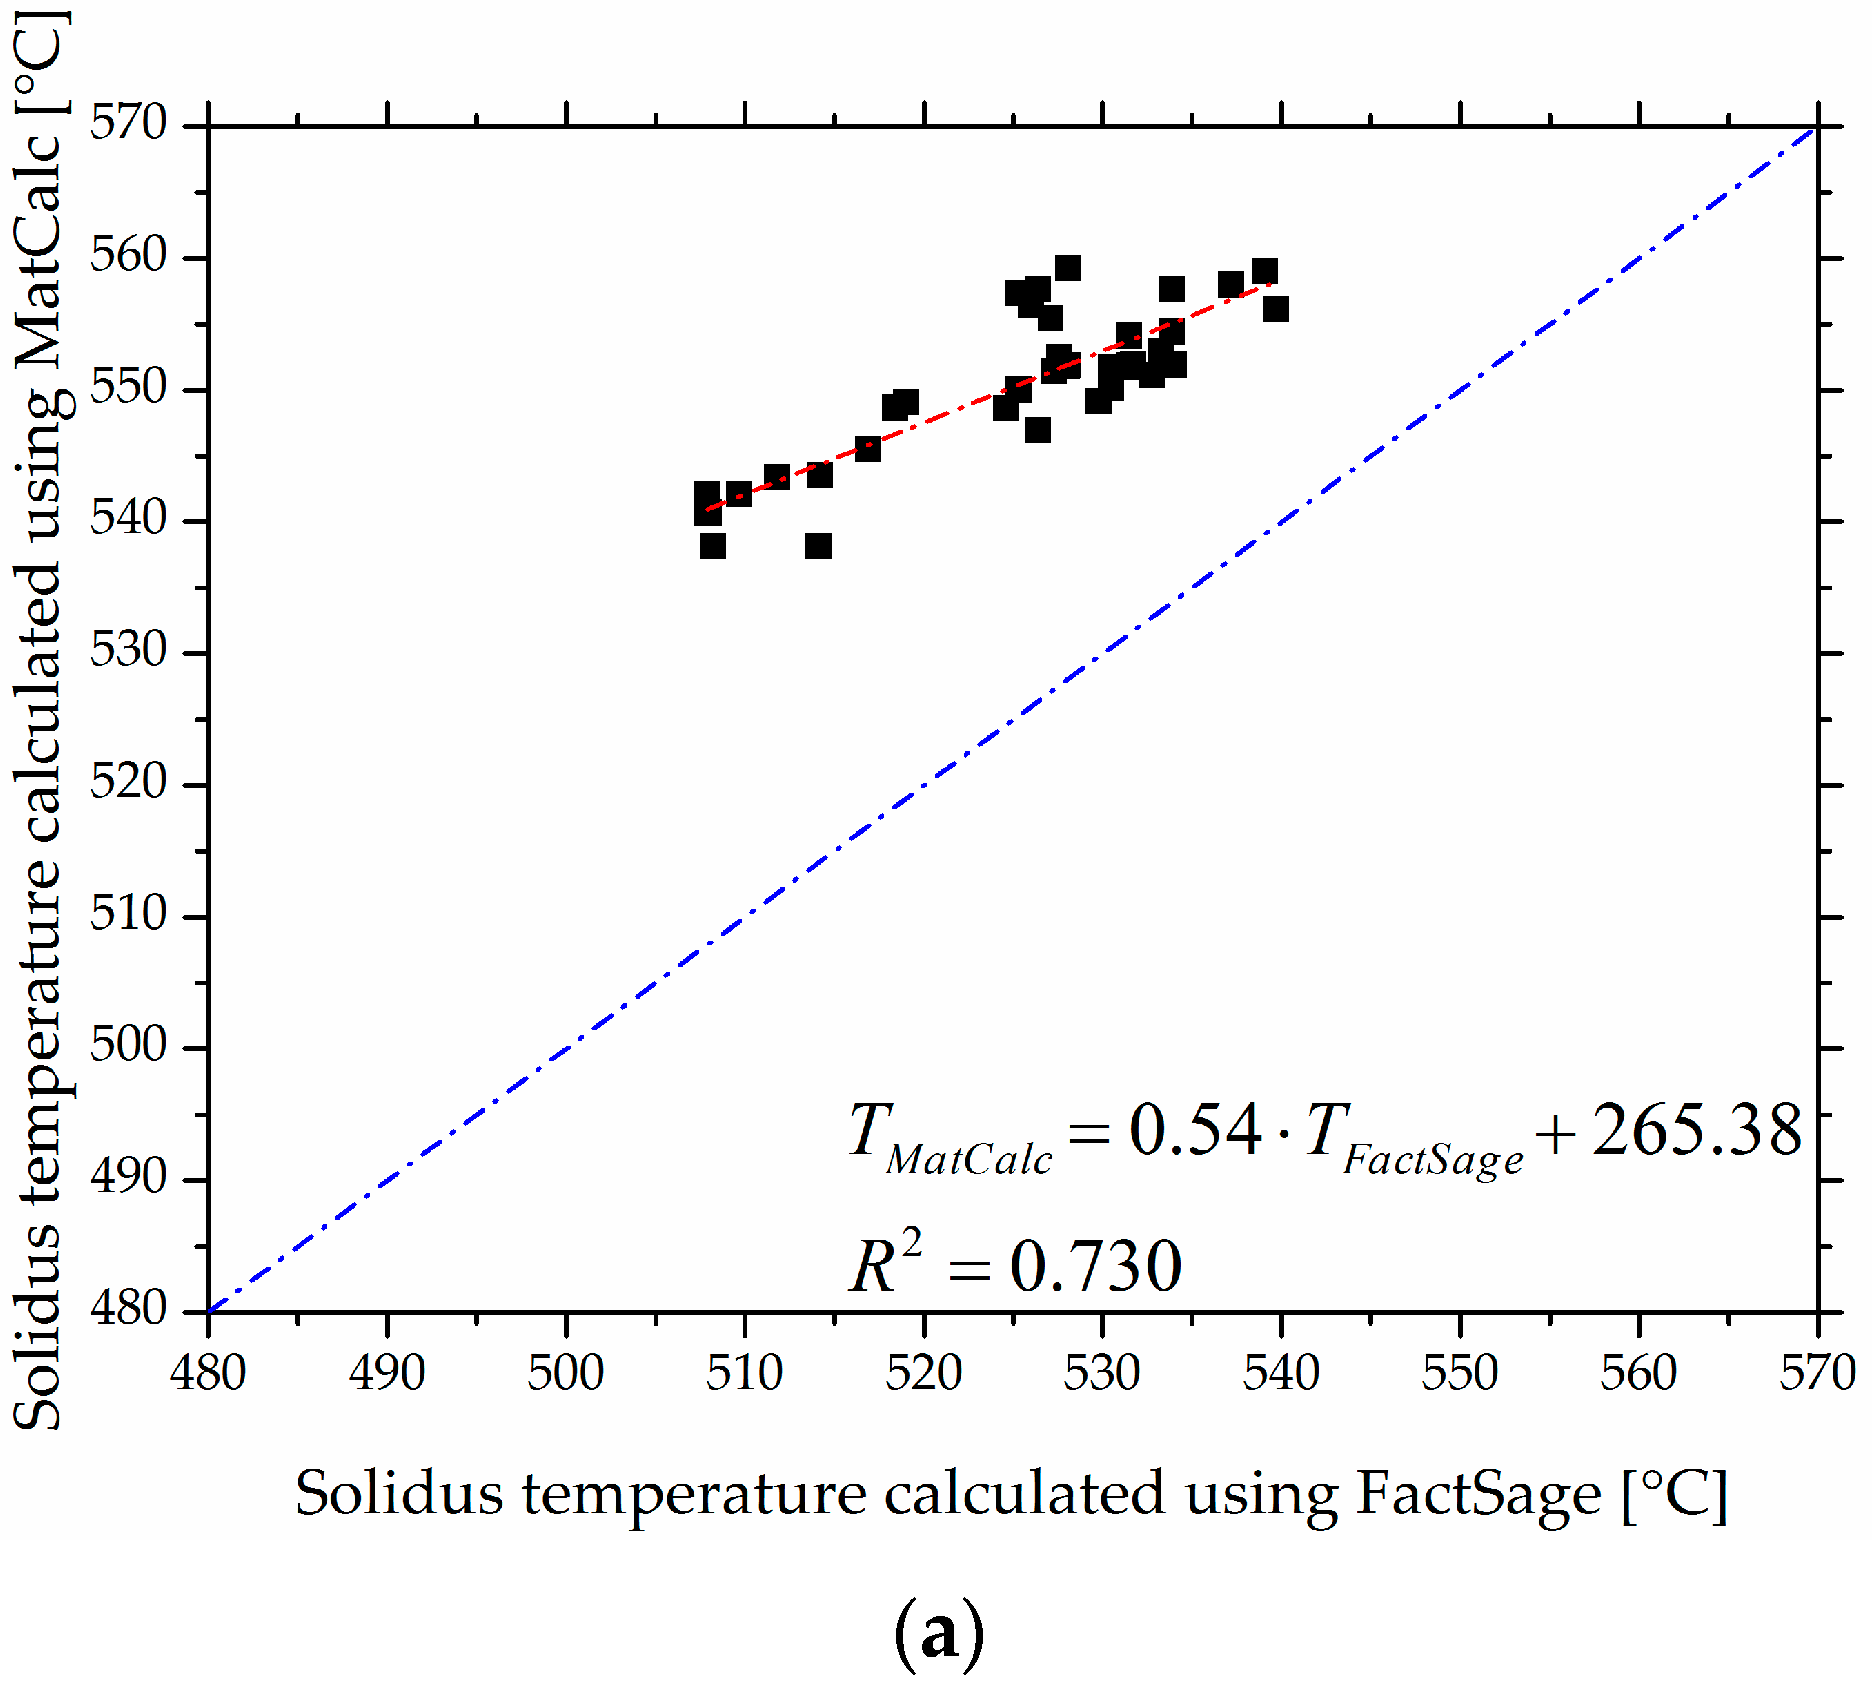
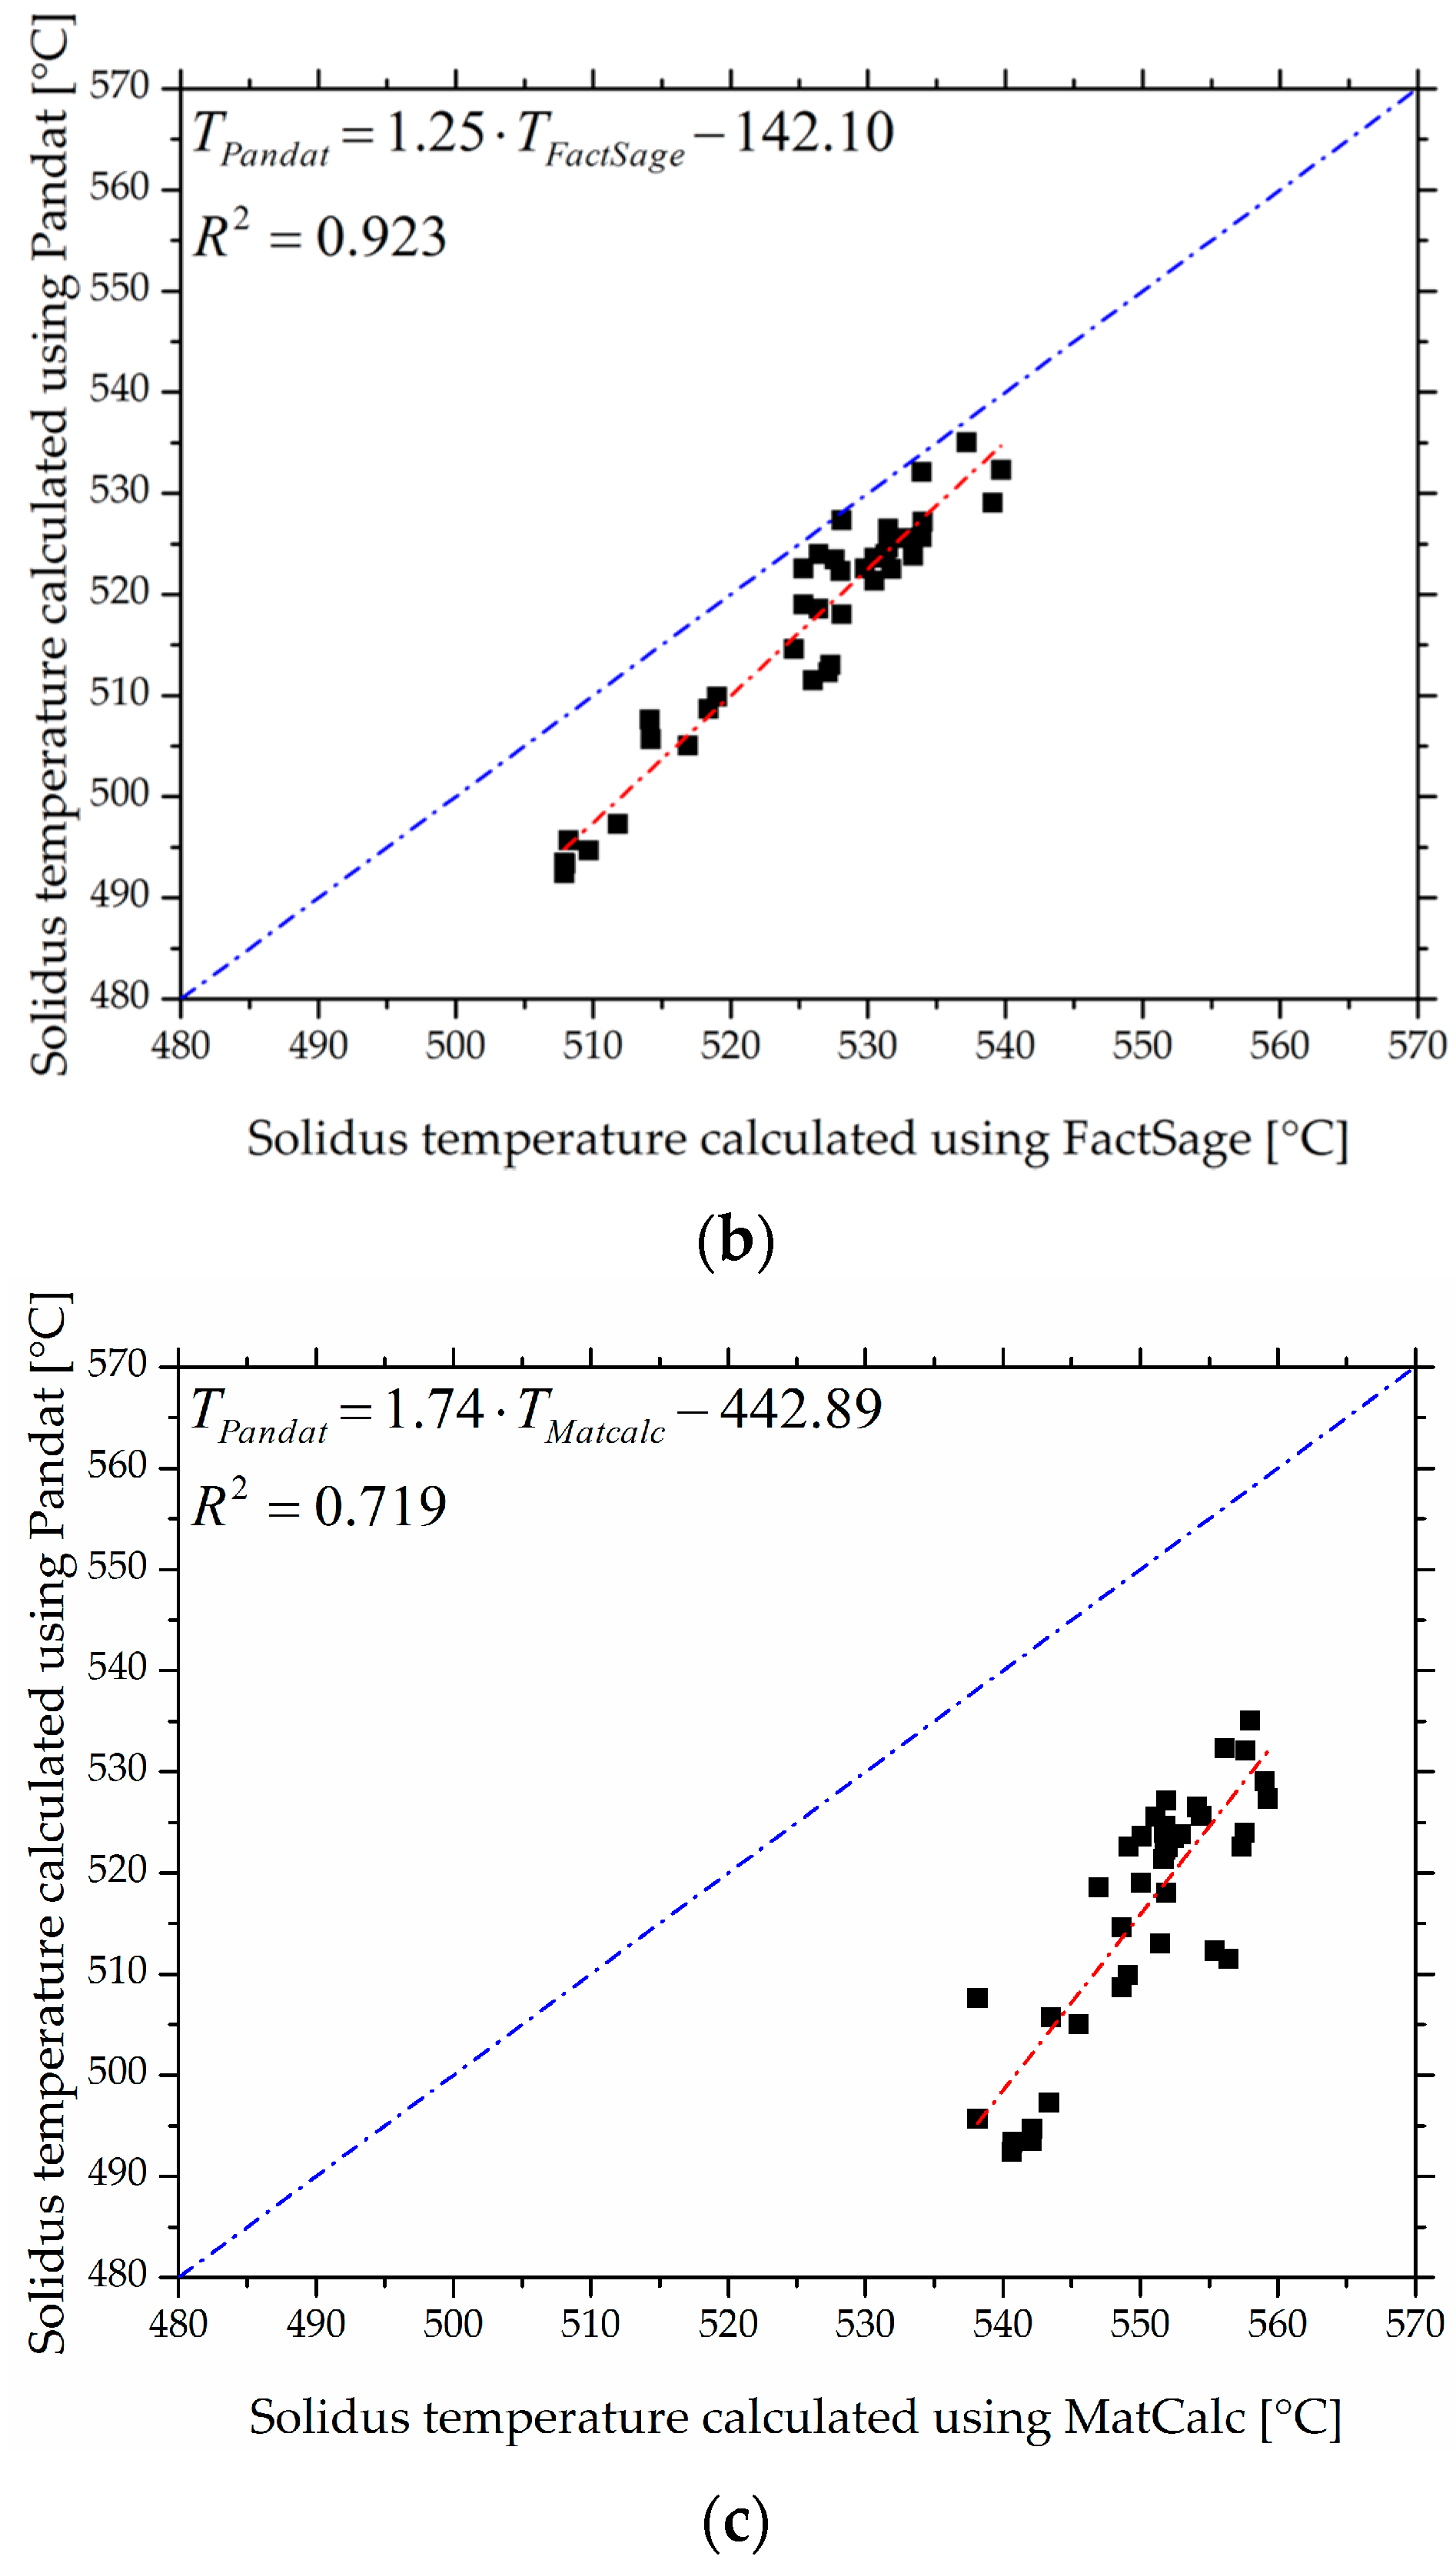
The data are plotted in Figure 2 to compare the CALPHAD results obtained for the solidus temperature. Figure 2a represents a plot of FactSage® vs. MatCalc. The R2-value of 0.730 determined indicates an acceptable correlation between the data of these two tools. The deviation between the programs mentioned is probably caused by different databases. In Figure 2b, the calculated solidus temperatures correlate with 0.923 for Pandat™ vs. FactSage®. This correlation between FactSage® and Pandat™ is excellent by a similar database. In Figure 2c, the results of thermodynamic calculation via MatCalc vs. those via Pandat™ are shown. The correlation R2 is about 0.719 and is slightly lower than that of FactSage® and MatCalc. This value can be expected from the excellent correlation of FactSage® and Pandat™ and the low correlation of FactSage® and MatCalc. From the correlation comparison of all three tools, it may be concluded that FactSage® and Pandat™ show quite similar trends and exhibit only small differences in the absolute solidus temperature. MatCalc calculates a slightly different trend and a higher absolute deviation in the solidus temperature compared with the two other tools.
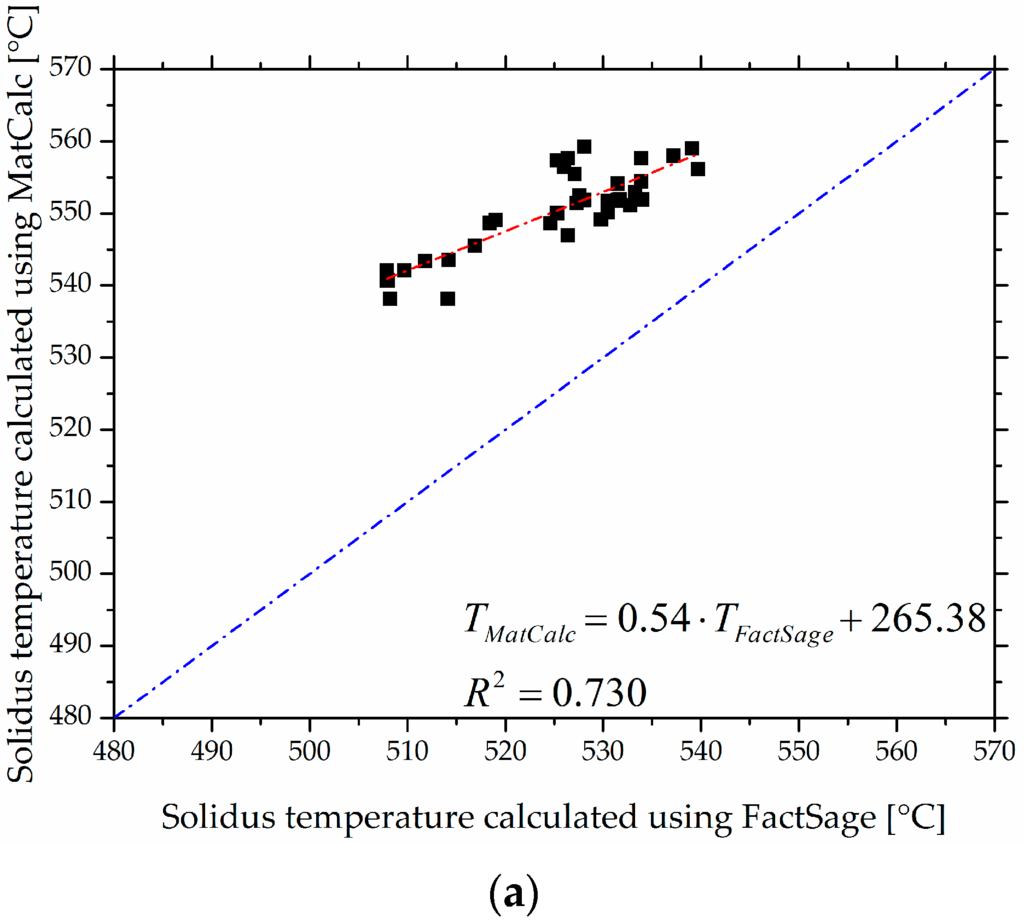
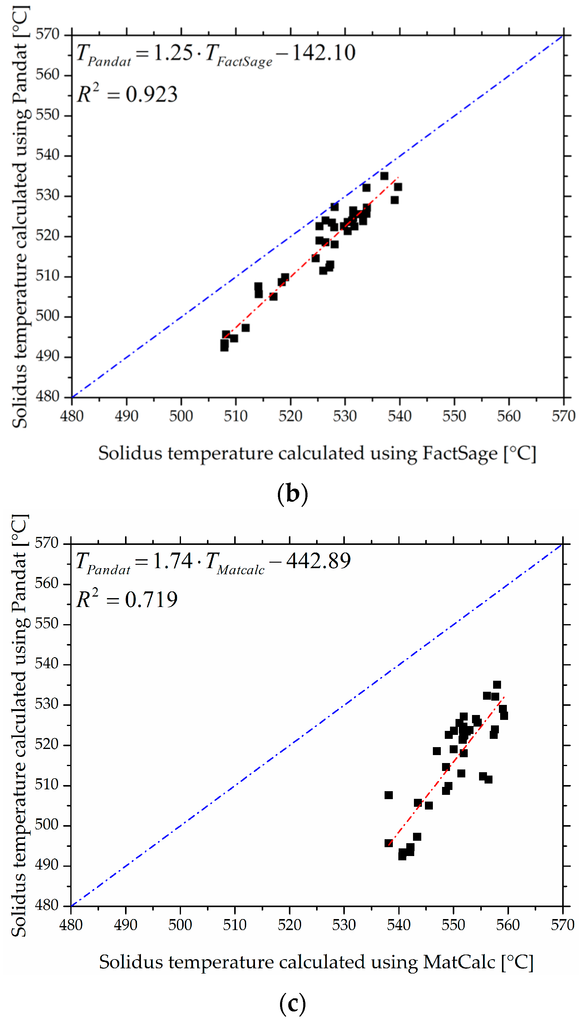
Figure 2.
Comparison of solidus temperatures predicted by CALPHAD programs: (a) FactSage® vs. MatCalc; (b) FactSage® vs. Pandat™; and (c) MatCalc vs. Pandat™.
In addition to simulations, experimental investigations were carried out via DSC. Melting of pure substances at a single temperature generates broad peaks over temperature due to the thermal lag of the DSC device. Consequently, the classical onset method is used to determine the melting point. A symbolic DSC curve is shown in Figure 3. The onset (correct: extrapolated onset) is defined as the beginning of the thermal effect. Within a peak, i.e., during a transition or reaction, the baseline is defined as the curve between the region of a peak, which would have been recorded if all cp changes had occurred but no heat of transition had been released [7]. This means that at the deviation of the base line (inflection point) tangents can be applied along the (imaginary or extrapolated) base line and the occurring peak. The intersection point of the two straight lines can be used as the onset temperature. The area under the curve is typically proportional to the enthalpy of this event [17,18]. This construction is physically useful only on the DSC melting curve of a pure substance, where it can be deployed for graphical determination of the sample temperature during melting. For alloys, the method for determining the onset is not trivial. Unfortunately, there is a broad melting interval in 7xxx alloys and the start of equilibrium melting is only associated with a low fraction of liquid formed (compare with Figure 1). Because the associated peak area in DSC scales with this fraction of liquid, the onset is smeared out. In this case the peak resulting from the real temperature interval of melting where heat is consumed and the thermal lag overlaps. Here, to account for this, we use the first deviation from the baseline (small detail in Figure 3) as a user-defined measure for the solidus temperature. The base line is defined here as the part of the DSC curve that shows no transformations (after the dissolution of precipitates but directly before melting) and is taken as a straight line. This method, however, depends on the viewed scale; we therefore define this for all measurements here as ΔT = C1 = 200 °C and ΔDSC = C2 = 0.07 W/g (see insert to Figure 3).
Figure 3.
Comparison of a user-defined determination of solidus temperatures for alloys with large melting intervals with the classical onset technique for evaluation of the melting point of pure substances based on a DSC curve.
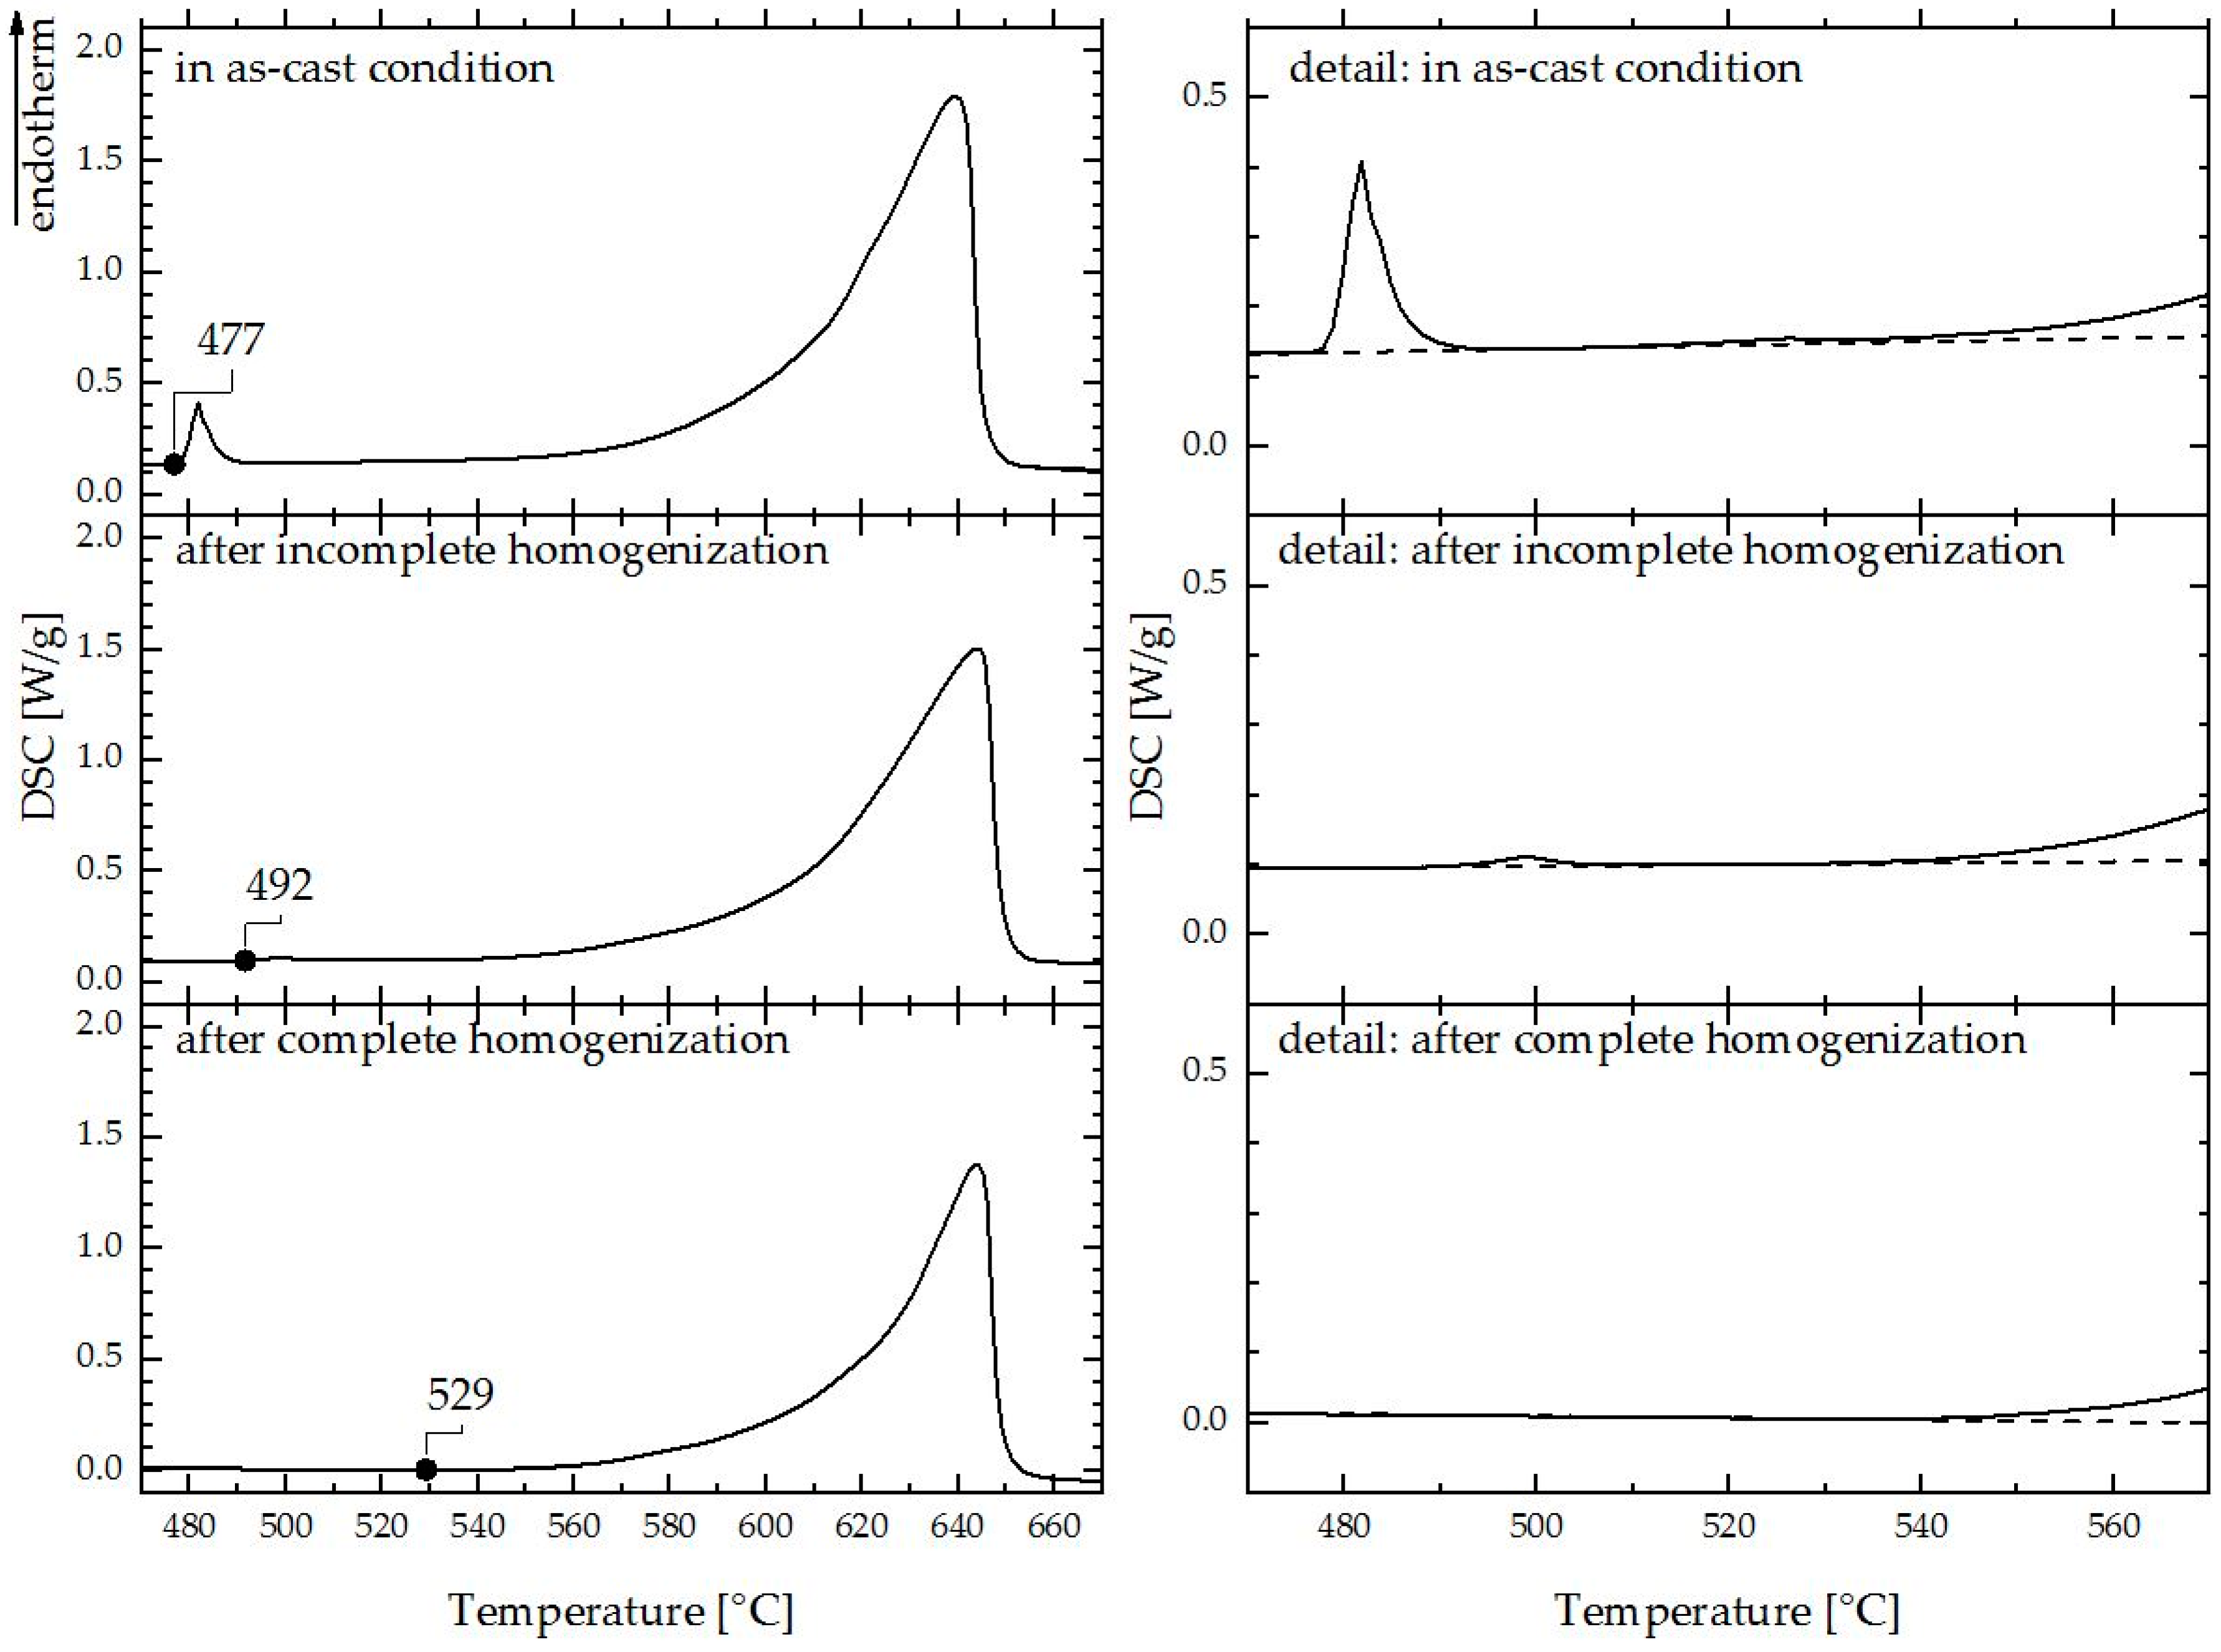
As an example Figure 4 shows the measured curve of the experimental alloy #38 in the interval from 470 °C to 670 °C. The DSC curve exhibits an endothermic peak at 477 °C prior to the main melting peak. The example alloy is in as-cast condition. It may be assumed that the occurrence of the first peak is caused by segregations and by the melting of the T-phase (Al2Mg3Zn3) [6,19,20]. After a first homogenization, the alloy was measured again in the DSC. The first observed melting peak was shifted to higher temperatures (492 °C). The area of the peak was also significantly less than that in the as-cast condition. However, no complete homogenization occurred. The small peak is an indicator of the S-phase (Al2CuMg) [6,19]. After the second homogenization at higher temperature a closer look at the DSC trace also revealed no endothermic peak due to low melting non-equilibrium segregations or undissolved phases. We assume that the alloy reached a near-equilibrium state. Now the large peak may be considered the main melting peak of the experimental alloy #38. It corresponds to the solidus temperature and is determined to be 529 °C via the user-defined method described in Figure 3.
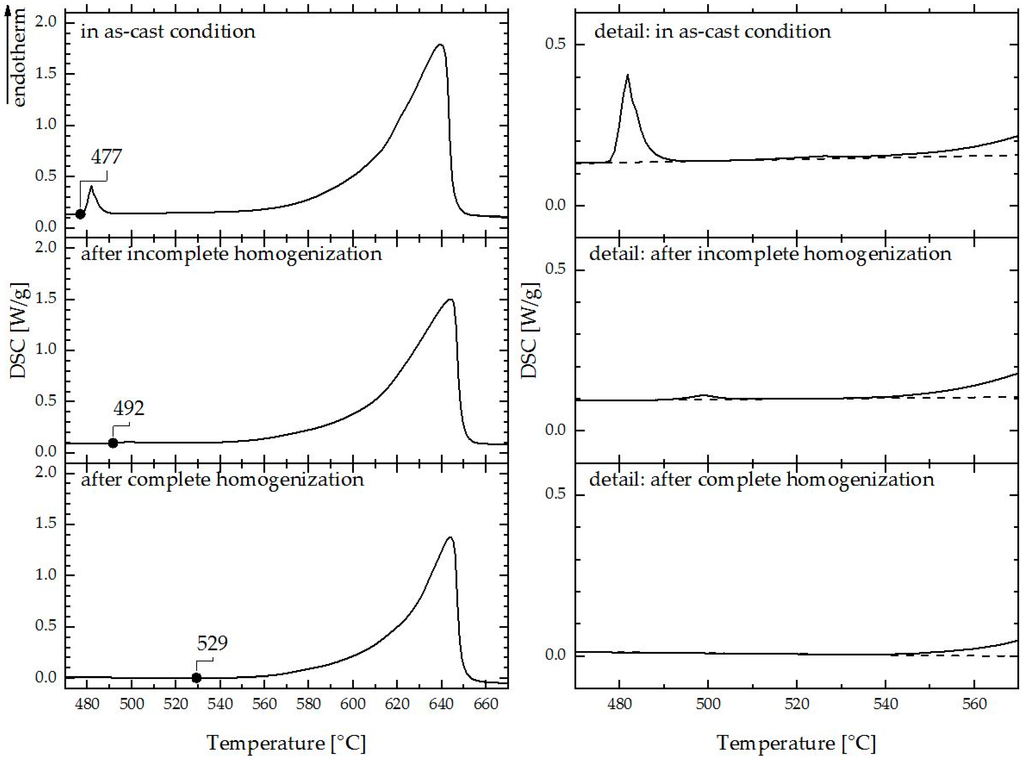
Figure 4.
Change in DSC signal of experimental alloy #38 alloy during heating of three samples in conditions as-cast, incomplete homogenization and complete homogenization at constant heating rate of 10 K/min.
Table 2 summarizes the solidus temperatures of the corresponding alloys and the values calculated. In Table 2 it can be seen that the predicted values agree with the results of the experimental measurements within the scatter of the various software packages (49 °C). However, a result which only deviates 31 °C between experiment and calculation can be judged as acceptable in terms of predictive character. The accuracy of our DSC results can be judged via discussion of the thermal lag of the setup and the standard deviation of the measurements. The thermal lag of the measurements at 10 K/min was quite acceptable, but can result in a systematic error of approximately 4 °C (estimated from an extrapolation of measurements with different heating rates of 5, 10, and 20 K/min to 0 K/min). The standard deviation of our solidus estimation method for repeated DSC measurements was around ±1 °C.
Table 2.
Measured and calculated solidus temperatures.
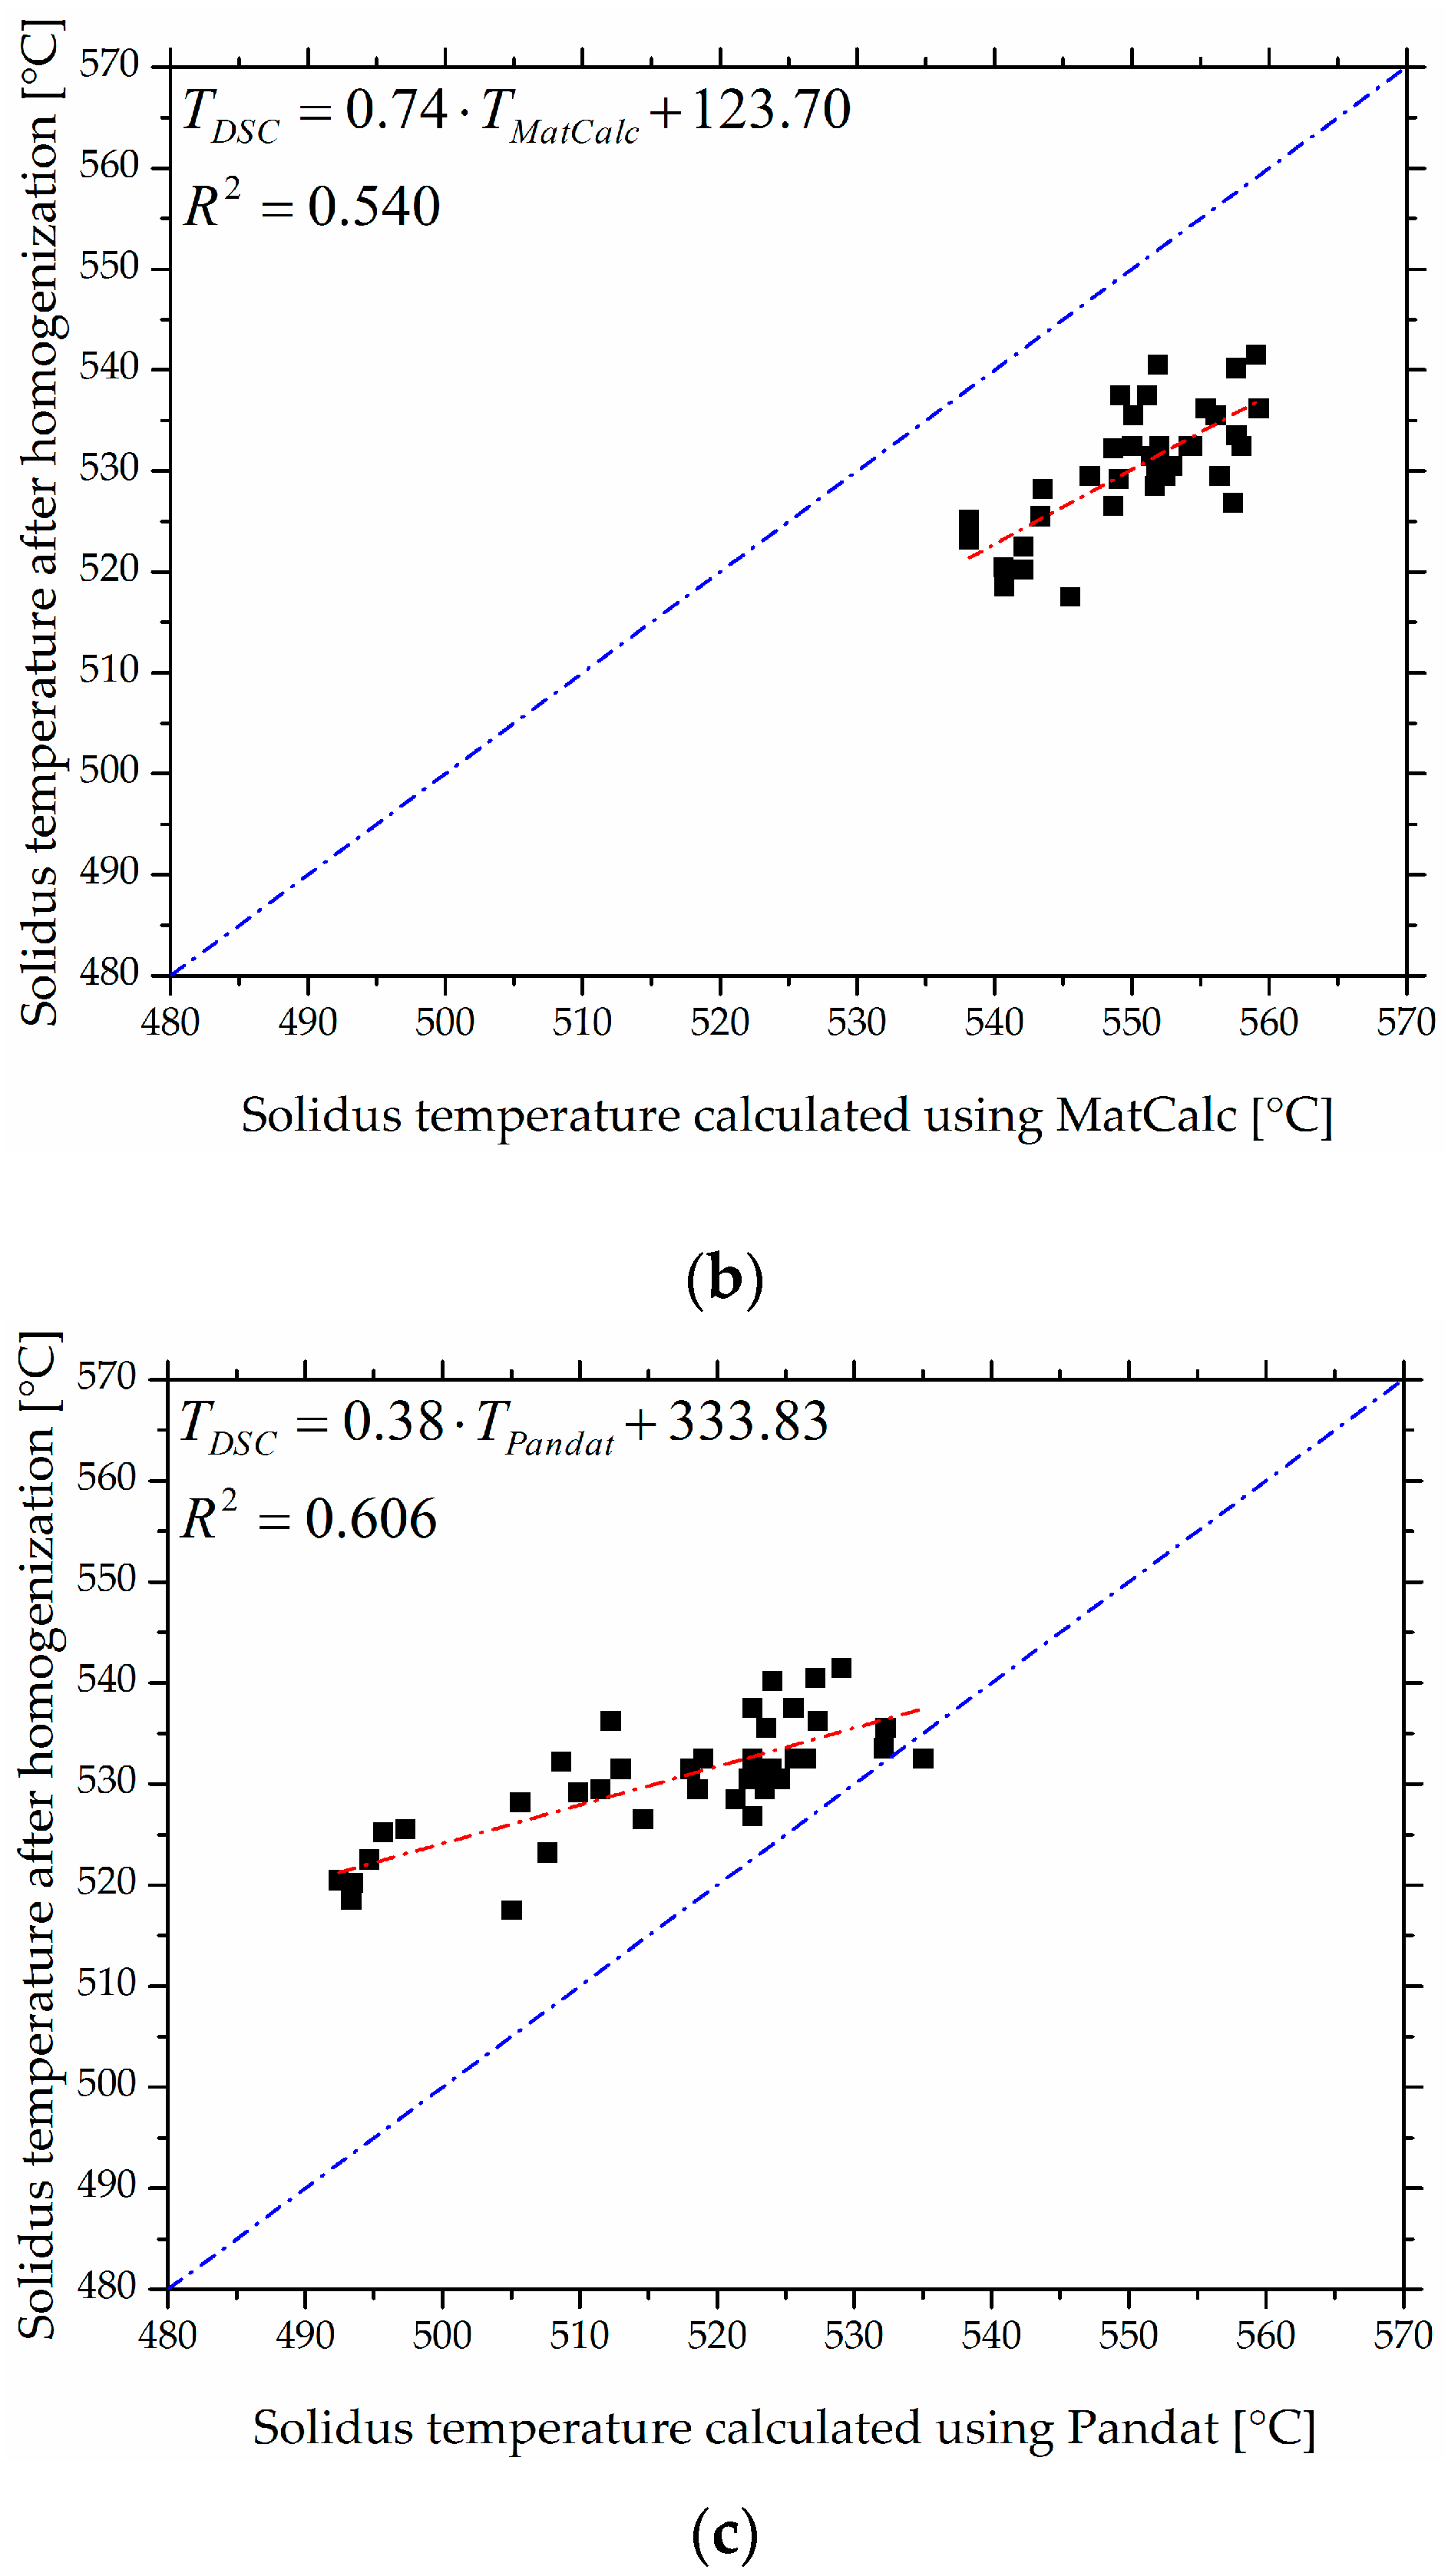
Figure 5 represents a parity plot of the DSC measurements and thermodynamic predictions of the solidus temperatures. In Figure 5a it can be seen that FactSage® matches acceptably with an R2 of 0.625. At temperatures around 530 °C the coincidence is good. However, the slope of the trend line is somewhat off. Pandat™ provides a result close to that of FactSage®, with an R2 of 0.606. The optimum overlap is in the temperature range between 530 °C and 540 °C and the trend is also slightly off. The similarity between Pandat™ and FactSage® is not surprising because these packages have been shown to deliver well-correlated predictions (see Figure 2). MatCalc supplies a slightly lower R2, 0.540, than FactSage® and Pandat™. However, the slope of the trend line fits better. The reason for the discrepancy between the predictions and the calculated values may be due to the limitations of thermodynamic data regarding multicomponent systems, which always includes extrapolation from binary, ternary, or in special cases quaternary optimized systems. Moreover, thermodynamic data themselves are generated from experimental observations and include measurement errors. As a last point, our own measurements via DSC may also include measurement and systematic errors like the thermal lag described above. A further systematic error is possible due to the difficulties of measuring the exact melting temperature described in Figure 3. Nevertheless, thermodynamic calculations can be seen as a useful tool for predicting the solidus temperatures of a certain alloy composition to optimise 7xxx alloys. However, one should be aware of the possible inaccuracy of CALPHAD predictions. For example, a maximum absolute temperature deviation of more than 30 °C between prediction and measurement is too high for the design of new heat treatments, where adjustments are usually within a much narrower temperature range to avoid partial melting. Despite this limitation, fine-tuning of the alloy composition and heat treatment temperatures can be guided via thermodynamic predictions because trends are predicted correctly for all software-packages.
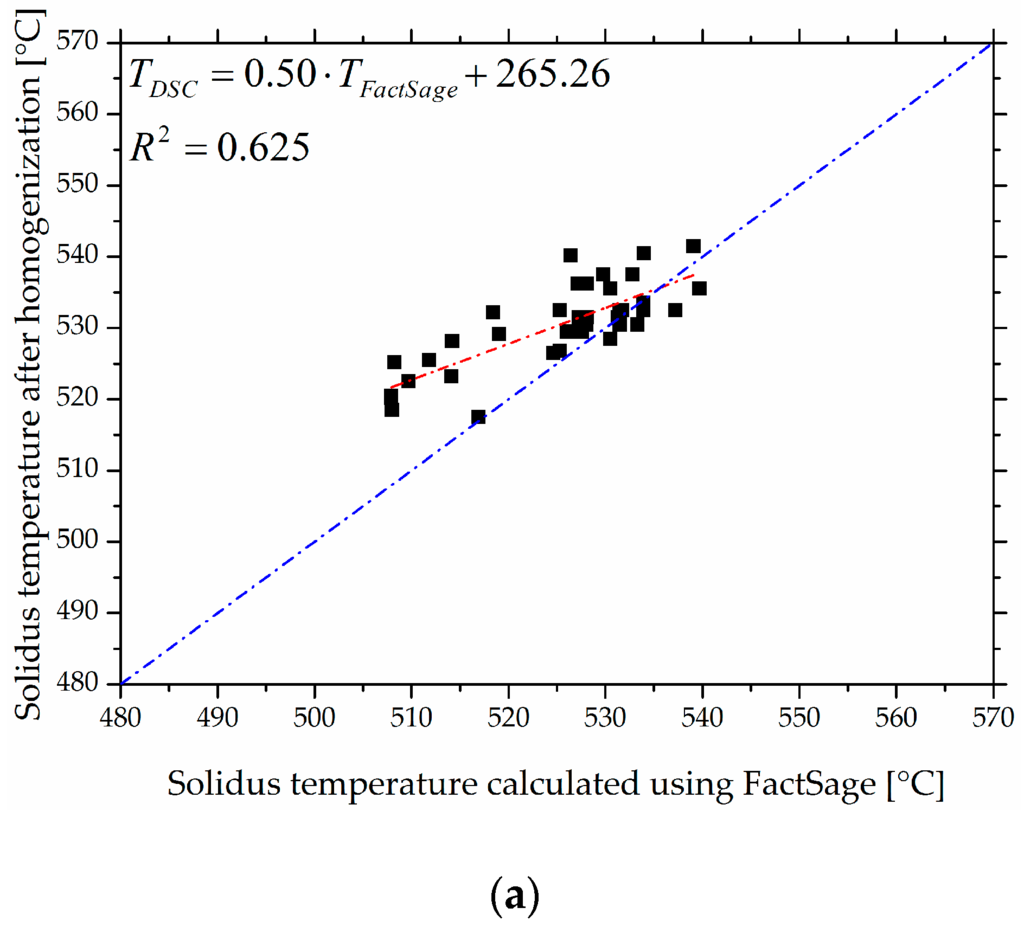
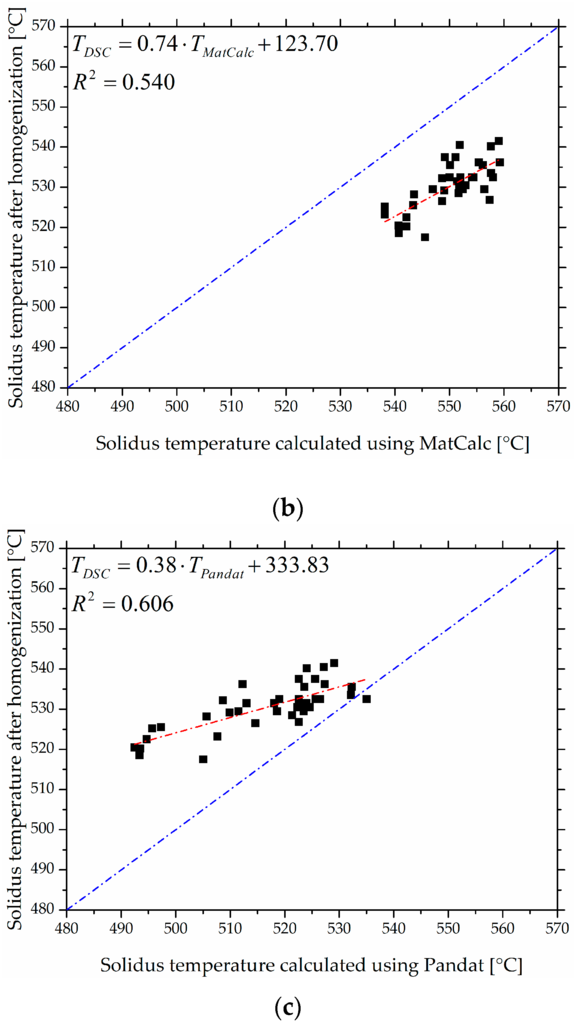
Figure 5.
Representation of DSC measurement results compared with thermodynamically predicted forecasts: (a) FactSage® vs. DSC; (b) MatCalc vs. DSC; and (c) Pandat™ vs. DSC.
4. Conclusions
In this study we compared DSC measurements and thermodynamic predictions for Al-Zn-Mg-Cu alloys from different CALPHAD tools: the software packages FactSage®, Pandat™, and MatCalc and the corresponding databases. We showed that the simulations deliver useful information about solidus temperatures, which is commonly only available through extensive experimental work. Based on an evaluation of the quality of the predictions, we illustrated the extent to which thermodynamic predictions can help to identify optimized alloy compositions, excluding prohibited areas with low melting phases in the temperature field of solution treatment procedures. The main findings of the study are summarized as follows:
- The CALPHAD tools FactSage®, Pandat™ and MatCalc predict correlated solidus temperature values, although within a maximum observed absolute temperature deviation of 49 °C for various Al-Zn-Mg-Cu alloys.
- To compare simulated solidus temperatures to data from DSC measurements, a user-defined method for estimating the solidus temperature for alloys with a broad melting interval was introduced.
- Experimentally determined solidus temperatures agree with the predictions and deviate no more than the predictions of different CALPHAD tools themselves.
Thermodynamic tools based on the CALPHAD approach are very efficient for optimizing alloys and heat treatments, but our results show that it is critical to be aware of the boundaries of prediction accuracy.
Acknowledgments
The authors thank the Austrian Research Promotion Agency (FFG) (Grant No. 850427) and AMAG rolling GmbH for financial support of this work.
Author contributions
G.K.-H.K. and S.P. conceived the study. G.K. and S.S. produced the alloys and performed the DSC tests. G.K.-H.K. and S.S. conducted the DSC measurements. S.P., H.A., P.J.U. and D.P. supervised the work. All authors contributed extensively to the data analysis and discussion. G.K.-H.K., S.S. and S.P. wrote the paper.
Conflicts of interest
The authors declare no conflict of interest.
References
- Dursun, T.; Soutis, C. Recent developments in advanced aircraft aluminium alloys. Mater. Des. 2014, 56, 862–871. [Google Scholar] [CrossRef]
- Heinz, A.; Haszler, A.; Keidel, C.; Moldenhauer, S.; Benedictus, R.; Miller, W.S. Recent development in aluminium alloys for aerospace applications. Mater. Sci. Eng. A 2000, 280, 102–107. [Google Scholar] [CrossRef]
- Lang, P.; Wojcik, T.; Povoden-Karadeniz, E.; Falahati, A.; Kozeschnik, E. Thermo-kinetic prediction of metastable and stable phase precipitation in Al-Zn-Mg series aluminium alloys during non-isothermal DSC analysis. J. Alloy. Compd. 2014, 609, 129–136. [Google Scholar] [CrossRef]
- Deschamps, A.; Livet, F.; Bréchet, Y. Influence of predeformation on ageing in an Al-Zn-Mg alloy—I. Microstructure evolution and mechanical properties. Acta Mater. 1998, 47, 281–292. [Google Scholar] [CrossRef]
- Berg, L.; Gjønnes, J.; Hansen, V.; Li, X.; Knutson-Wedel, M.; Waterloo, G.; Schryvers, D.; Wallenberg, L. GP-zones in Al-Zn-Mg alloys and their role in artificial aging. Acta Mater. 2001, 49, 3443–3451. [Google Scholar] [CrossRef]
- Lim, S.T.; Eun, I.S.; Nam, S.W. Control of Equilibrium Phases (M,T,S) in the Modified Aluminum Alloy 7175 for Thick Forging Applications. Mater. Trans. 2003, 44, 181–187. [Google Scholar] [CrossRef]
- Höhne, G.W.H.; Hemminger, W.F.; Flammersheim, H.-J. Differential Scanning Calorimetry; Springer Berlin Heidelberg: Berlin/Heidelberg, Germany, 2003. [Google Scholar]
- Schmitz, S.M. Phasenseparation und Einfuss von Mikrolegierungselementen in Systemen mit metallischer Glasbildung. Ph.D. Thesis, Technische Universität Dresden, Dresden, Germany, April 2012. [Google Scholar]
- Hillert, M. Partial Gibbs energies from Redlich-Kister polynomials. Thermochim. Acta 1988, 129, 71–75. [Google Scholar] [CrossRef]
- Kattner, U.R. The thermodynamic modeling of multicomponent phase equilibria. JOM 1997, 49, 14–19. [Google Scholar] [CrossRef]
- Das, K.N.; Habibullah, M.; Ghosh, M.; AkberHossain, N. Regression alternative to the redlich-kister equation in the determination of the excess partial molar volumes of the constituents in a binary mixture. Phys. Chem. Liq. 2004, 42, 89–94. [Google Scholar] [CrossRef]
- Dos Santos, I.A.; Klimm, D.; Baldochi, S.L.; Ranieri, I.M. Thermodynamic modeling of the LiF-YF3 phase diagram. J. Cryst. Growth 2012, 360, 172–175. [Google Scholar] [CrossRef]
- Dos Santos, I.A.; Klimm, D.; Baldochi, S.L.; Ranieri, I.M. Experimental evaluation and thermodynamic assessment of the LiF-LuF3 phase diagram. Thermochim. Acta 2013, 552, 137–141. [Google Scholar] [CrossRef]
- Luo, A.A. Material design and development: From classical thermodynamics to CALPHAD and ICME approaches. Calphad 2015, 50, 6–22. [Google Scholar] [CrossRef]
- Bale, C.W.; Chartrand, P.; Degterov, S.A.; Eriksson, G.; Hack, K.; Mahfoud, R.B.; Melançon, J.; Pelton, A.D.; Petersen, S. FactSage thermochemical software and databases. Calphad 2002, 26, 189–228. [Google Scholar] [CrossRef]
- CompuTherm LLC. Software package for calculating phase diagrams and thermodynamic properties of multi-component alloys. Available online: http://www.computherm.com (accessed on 21 May 2016).
- Riesen, R. Wahl der Basislinien. Available online: https://at.mt.com/dam/mt_ext_files/Editorial/Simple/0/basislinien_ta_usercom25ds0106.pdf (accessed on 29 July 2016).
- Hydrate web. DSC. Available online: http://www.hydrateweb.org/dsc (accessed on 9 May 2016).
- Rometsch, P.A.; Zhang, Y.; Knight, S. Heat treatment of 7xxx series aluminium alloys—Some recent developments. Trans. Nonferr. Met. Soc. China 2014, 24, 2003–2017. [Google Scholar] [CrossRef]
- Saunders, N.; Miodownik, A.P. CALPHAD (Calculation of Phase Diagrams). A Comprehensive Guide; Pergamon: Oxford, UK, 1998. [Google Scholar]


© 2016 by the authors; licensee MDPI, Basel, Switzerland. This article is an open access article distributed under the terms and conditions of the Creative Commons Attribution (CC-BY) license (http://creativecommons.org/licenses/by/4.0/).