Abstract
Elastic deformation behaviors of as-cast and annealed eutectic and hypoeutectic Zr–Cu–Al bulk metallic glasses (BMG) were investigated on a basis of different strain-scales, determined by X-ray scattering and the strain gauge. The microscopic strains determined by Direct-space method and Reciprocal-space method were compared with the macroscopic strain measured by the strain gauge, and the difference in the deformation mechanism between eutectic and hypoeutectic Zr–Cu–Al BMGs was investigated by their correlation. The eutectic Zr50Cu40Al10 BMG obtains more homogeneous microstructure by free-volume annihilation after annealing, improving a resistance to deformation but degrading ductility because of a decrease in the volume fraction of weakly-bonded regions with relatively high mobility. On the other hand, the as-cast hypoeutectic Zr60Cu30Al10 BMG originally has homogeneous microstructure but loses its structural and elastic homogeneities because of nanocluster formation after annealing. Such structural changes by annealing might develop unique mechanical properties showing no degradations of ductility and toughness for the structural-relaxed hypoeutectic Zr60Cu30Al10 BMGs.
1. Introduction
Bulk metallic glasses (BMG) exhibit interesting mechanical features such as high strength with high ductility (low Young’s modulus), which is a different trend from typical metallic materials. On the other hand, structural relaxation has been known as a thermal behavior of metallic glasses that changes various mechanical properties with a few percent volume shrinkage by a heat treatment below the glass transition temperature Tg. Especially, structural relaxation-induced embrittlement would be a factor to degrade unique mechanical properties of the metallic glass. Meanwhile, Yokoyama et al. recently found that a hypoeutectic Zr–Cu–Al BMG with a Zr composition of 10% more than the eutectic composition shows no degradations of ductility and toughness after complete structural relaxation [1,2]. Furthermore, the fatigue property on the hypoeutectic BMG is independent of the annealing temperature, while that on a eutectic BMG changes after annealing. In addition, crystal-like ordering and icosahedral-like contrast are partially recognized in the amorphous glassy matrix after annealing in the hypoeutectic BMG, while the annealed eutectic BMG has homogeneous amorphous, glassy structure. Consequently, the microstructural changes after structural relaxation might be a crucial factor to affect the mechanical and physical properties of BMGs after annealing.
The atomic pair distribution function (PDF) obtained by X-ray scattering, which can evaluate a neighbor atomic distance, can quantitatively estimate the local strain of nanostructures with no or less crystal periodicity. The PDF technique has been utilized so far for the deformation analysis of metallic glasses [3,4,5,6]. For instance, it was clarified that the local atomic strain of the metallic glass obtained by the PDF technique is smaller than the macroscopic bulk strain, and various deformation models have been suggested, based on their observations. Therefore, the difference in the deformability between eutectic and hypoeutectic BMGs can be accessed by the PDF technique on a basis of the microscopic deformation behavior in an atomic level. In this study, the microscopic deformation behaviors of the eutectic and hypoeutectic Zr–Cu–Al BMGs are evaluated by the PDF technique with synchrotron high energy X-ray scattering, and a change in the mechanical properties, induced by structural relaxation for their BMGs, was discussed on a basis of the correlation between microscopic and macroscopic deformations.
2. Experimental Procedure
Specimens used in this study were as-cast and annealed eutectic Zr50Cu40Al10 and hypoeutectic Zr60Cu30Al10 BMGs. Conditions of annealing were 697 K for 2 min for the Zr50Cu40Al10 BMG (Tg = 706K) and 661 K for 2 min for the Zr60Cu30Al10 BMG (Tg = 671K). Hereafter, the Zr50Cu40Al10 BMG and the Zr60Cu30Al10 BMG call Z50 and Z60, respectively.
The X-ray scattering experiments were performed using high energy X-rays of 69.8 keV at BL22XU in SPring-8, Hyogo, Japan [7]. Figure 1a shows the schematic layout of the optical system used in this study. The dog-bone shaped specimen with 1.2 mm in thickness (see Figure 1b) was mounted on a load frame and was irradiated by an incident beam with a size of 0.3 mm × 0.3 mm. Diffraction from the specimen was measured by an Imaging Plate (IP) with 400 mm × 400 mm in size. An aluminum plate with 4 mm in thickness was set in front of the IP to reduce the background by fluorescent X-rays. Tensile loadings were applied to the specimen by using the load frame until 500 to 600 MPa with a crosshead speed of 0.1 mm/min, and the diffraction patterns were measured while holding each applied stress at seven different steps. The distances, L from the IP to the specimen were set to be 300 mm and 700 mm, and exposure times were 300 s and 120 s, respectively. Diffraction patterns in the loading and transverse directions were extruded by circumferentially integrating a range of ±5° in the corresponding direction of the two-dimensional scattering image using the WinPIP software [8].
Two novel techniques, suggested by Poulsen et al. [3], were utilized for the strain analysis of amorphous metallic glasses, i.e., Reciprocal-space (Q-space) method (QSM), which can measure the local strain from the peak shift of the first peak of the intensity function I(Q) or the structure function S(Q), and Direct-space method (DSM), which can measure the local strain directly from a change in the atomic distance obtained from the pair distribution function G(r). The diffraction patterns measured at L = 700 mm and 300 mm were provided for QSM and DSM, respectively. The PDF was produced by the PDFgetX3 program [9] with a Q-range of Fourier transform from 1.4 to 17 Å−1.
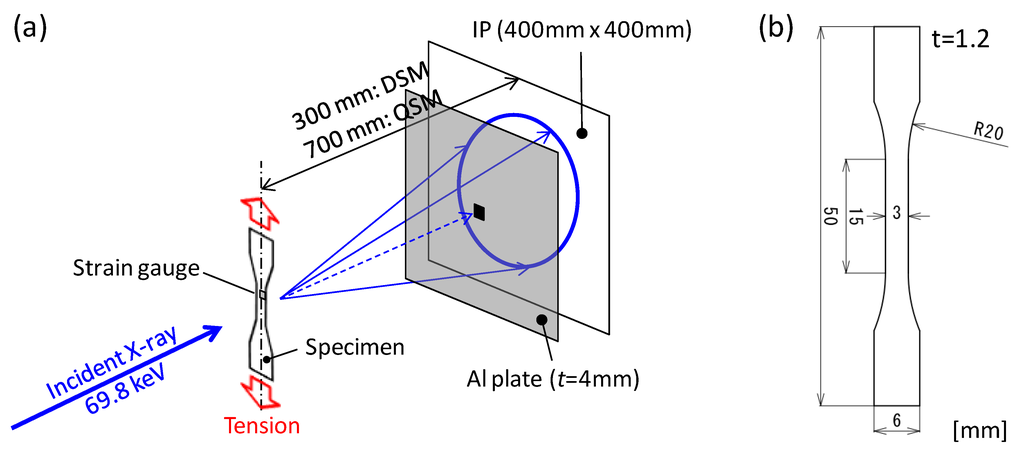
Figure 1.
(a) Schematics of the optical layout and (b) the specimen used in this study.
Figure 1.
(a) Schematics of the optical layout and (b) the specimen used in this study.

3. Results
3.1. PDF and Microstructure
Figure 2 shows I(Q), S(Q) and G(r) for Z50 and Z60. The radius, r in G(r) indicates the distance from an average atom located at the origin. All functions for Z50 in Figure 2a,c,e seems to be unchanged by annealing. It is known that the free-volume of Z50 decreases due to structural relaxation by annealing [10]; however, any changes cannot be observed in their patterns. On the other hand, the first peak in I(Q) and S(Q) for Z60 sharpens after annealing, as shown in Figure 2b,d, suggesting the development of atomic ordering. Furthermore, some small diffraction peaks are recognizable in the annealed Z60. These diffraction peaks can be clearly observed in the difference curve of I(Q) before and after annealing, and the difference also appears in G(r), as shown in Figure 2f. Comparing with the diffraction patterns of Zr2Cu (bct) and ZrCu (fcc), calculated by the Rietveld simulation using RIETAN-FP [11], the diffraction peak positions measured approximately correspond to their both diffraction patterns. Considering the precipitation temperature of ZrCu, more than 988K [12], the crystalline phase precipitated in Z60 is expected to be Zr2Cu since the annealing temperature was less than Tg (697 K). The volume fraction of this crystalline phase is predicted to be a few percent, and, hence, the crystalline phase with such a small volume fraction would not affect the macroscopic deformation behavior.
Figure 3 shows the Transmission Electron Microscope (TEM) images of the annealed Z60. Ambiguous fringe contrast related to nanocrystallization can be seen in the glassy amorphous matrix, as shown in Figure 3a. In addition, many close-range crystal-like orderings could be recognized in Figure 3b, which are typically marked by white circles and shown in the magnified images in Figure 3c,d, although the structure in general remains amorphous. This is a similar feature of the microstructure to the previous works [1,2]. Furthermore, relatively large crystal grains with about a few hundred nanometers were also observed slightly, which may contribute to diffraction peaks shown in Figure 2b.
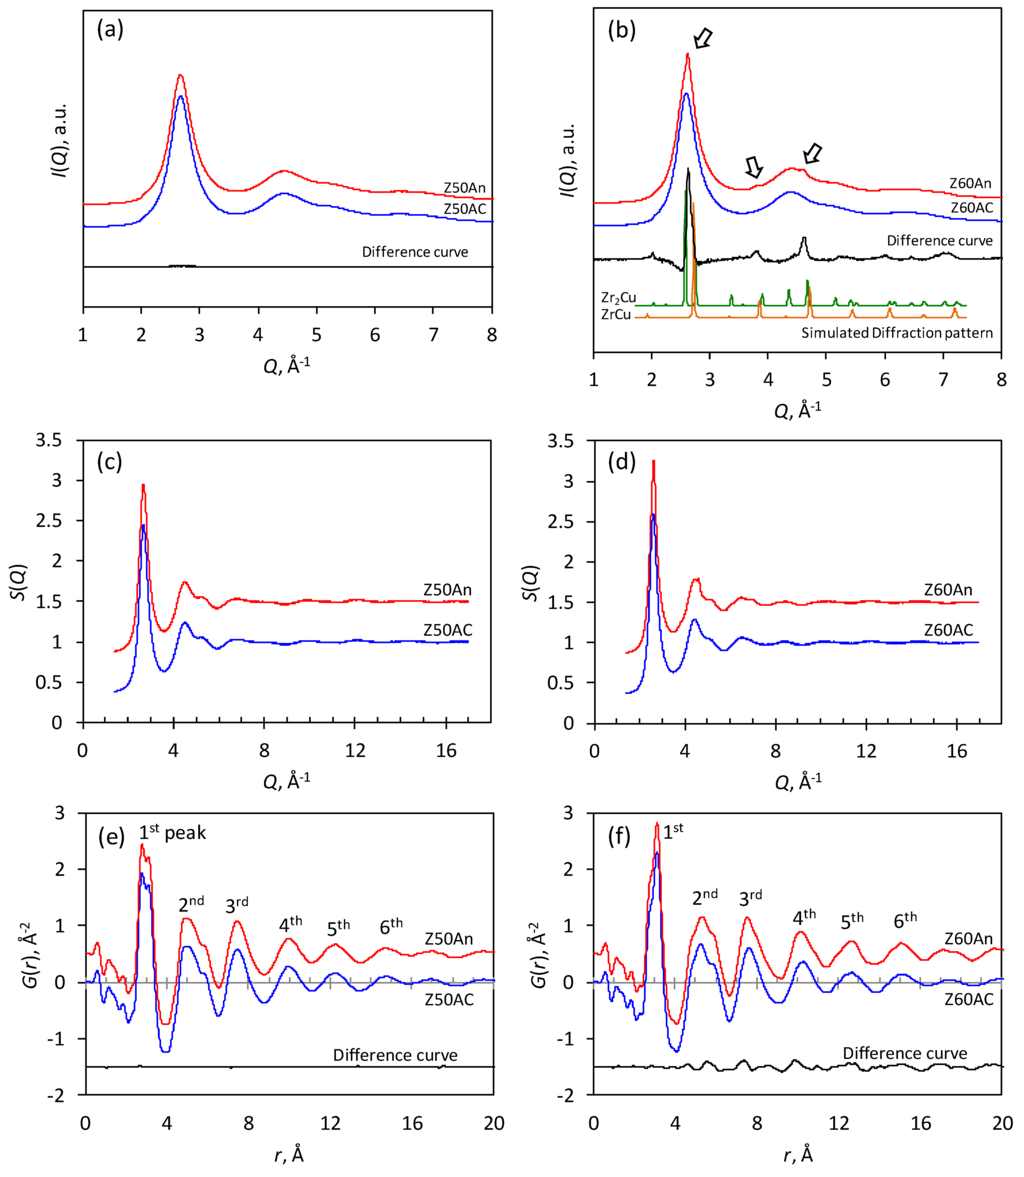
Figure 2.
The intensity functions I(Q) of (a) Z50Cu40Al10 (Z50) and (b) Z60Cu30Al10 (Z60) BMGs before (blue line) and after (red line) annealing and difference curve between them. “AC” and “An” after sample name denotes “as-cast” and “annealed”, respectively. Arrows in (b) indicate the distinct diffraction peaks. For comparison, diffraction peak patterns of ZrCu and Zr2Cu obtained by Rietveld simulation are shown in (b). (c) and (d) show the structure function S(Q) of Z50 and Z60 before (blue line) and after (red line) annealing, respectively. (e) and (f) show the atomic pair distribution functions G(r) before (blue line) and after (red line) annealing and difference curve between them for Z50 and Z60, respectively. In figures (c) to (f), S(Q) and G(r) after annealing are intentionally offset by +0.5 for easy comparison.
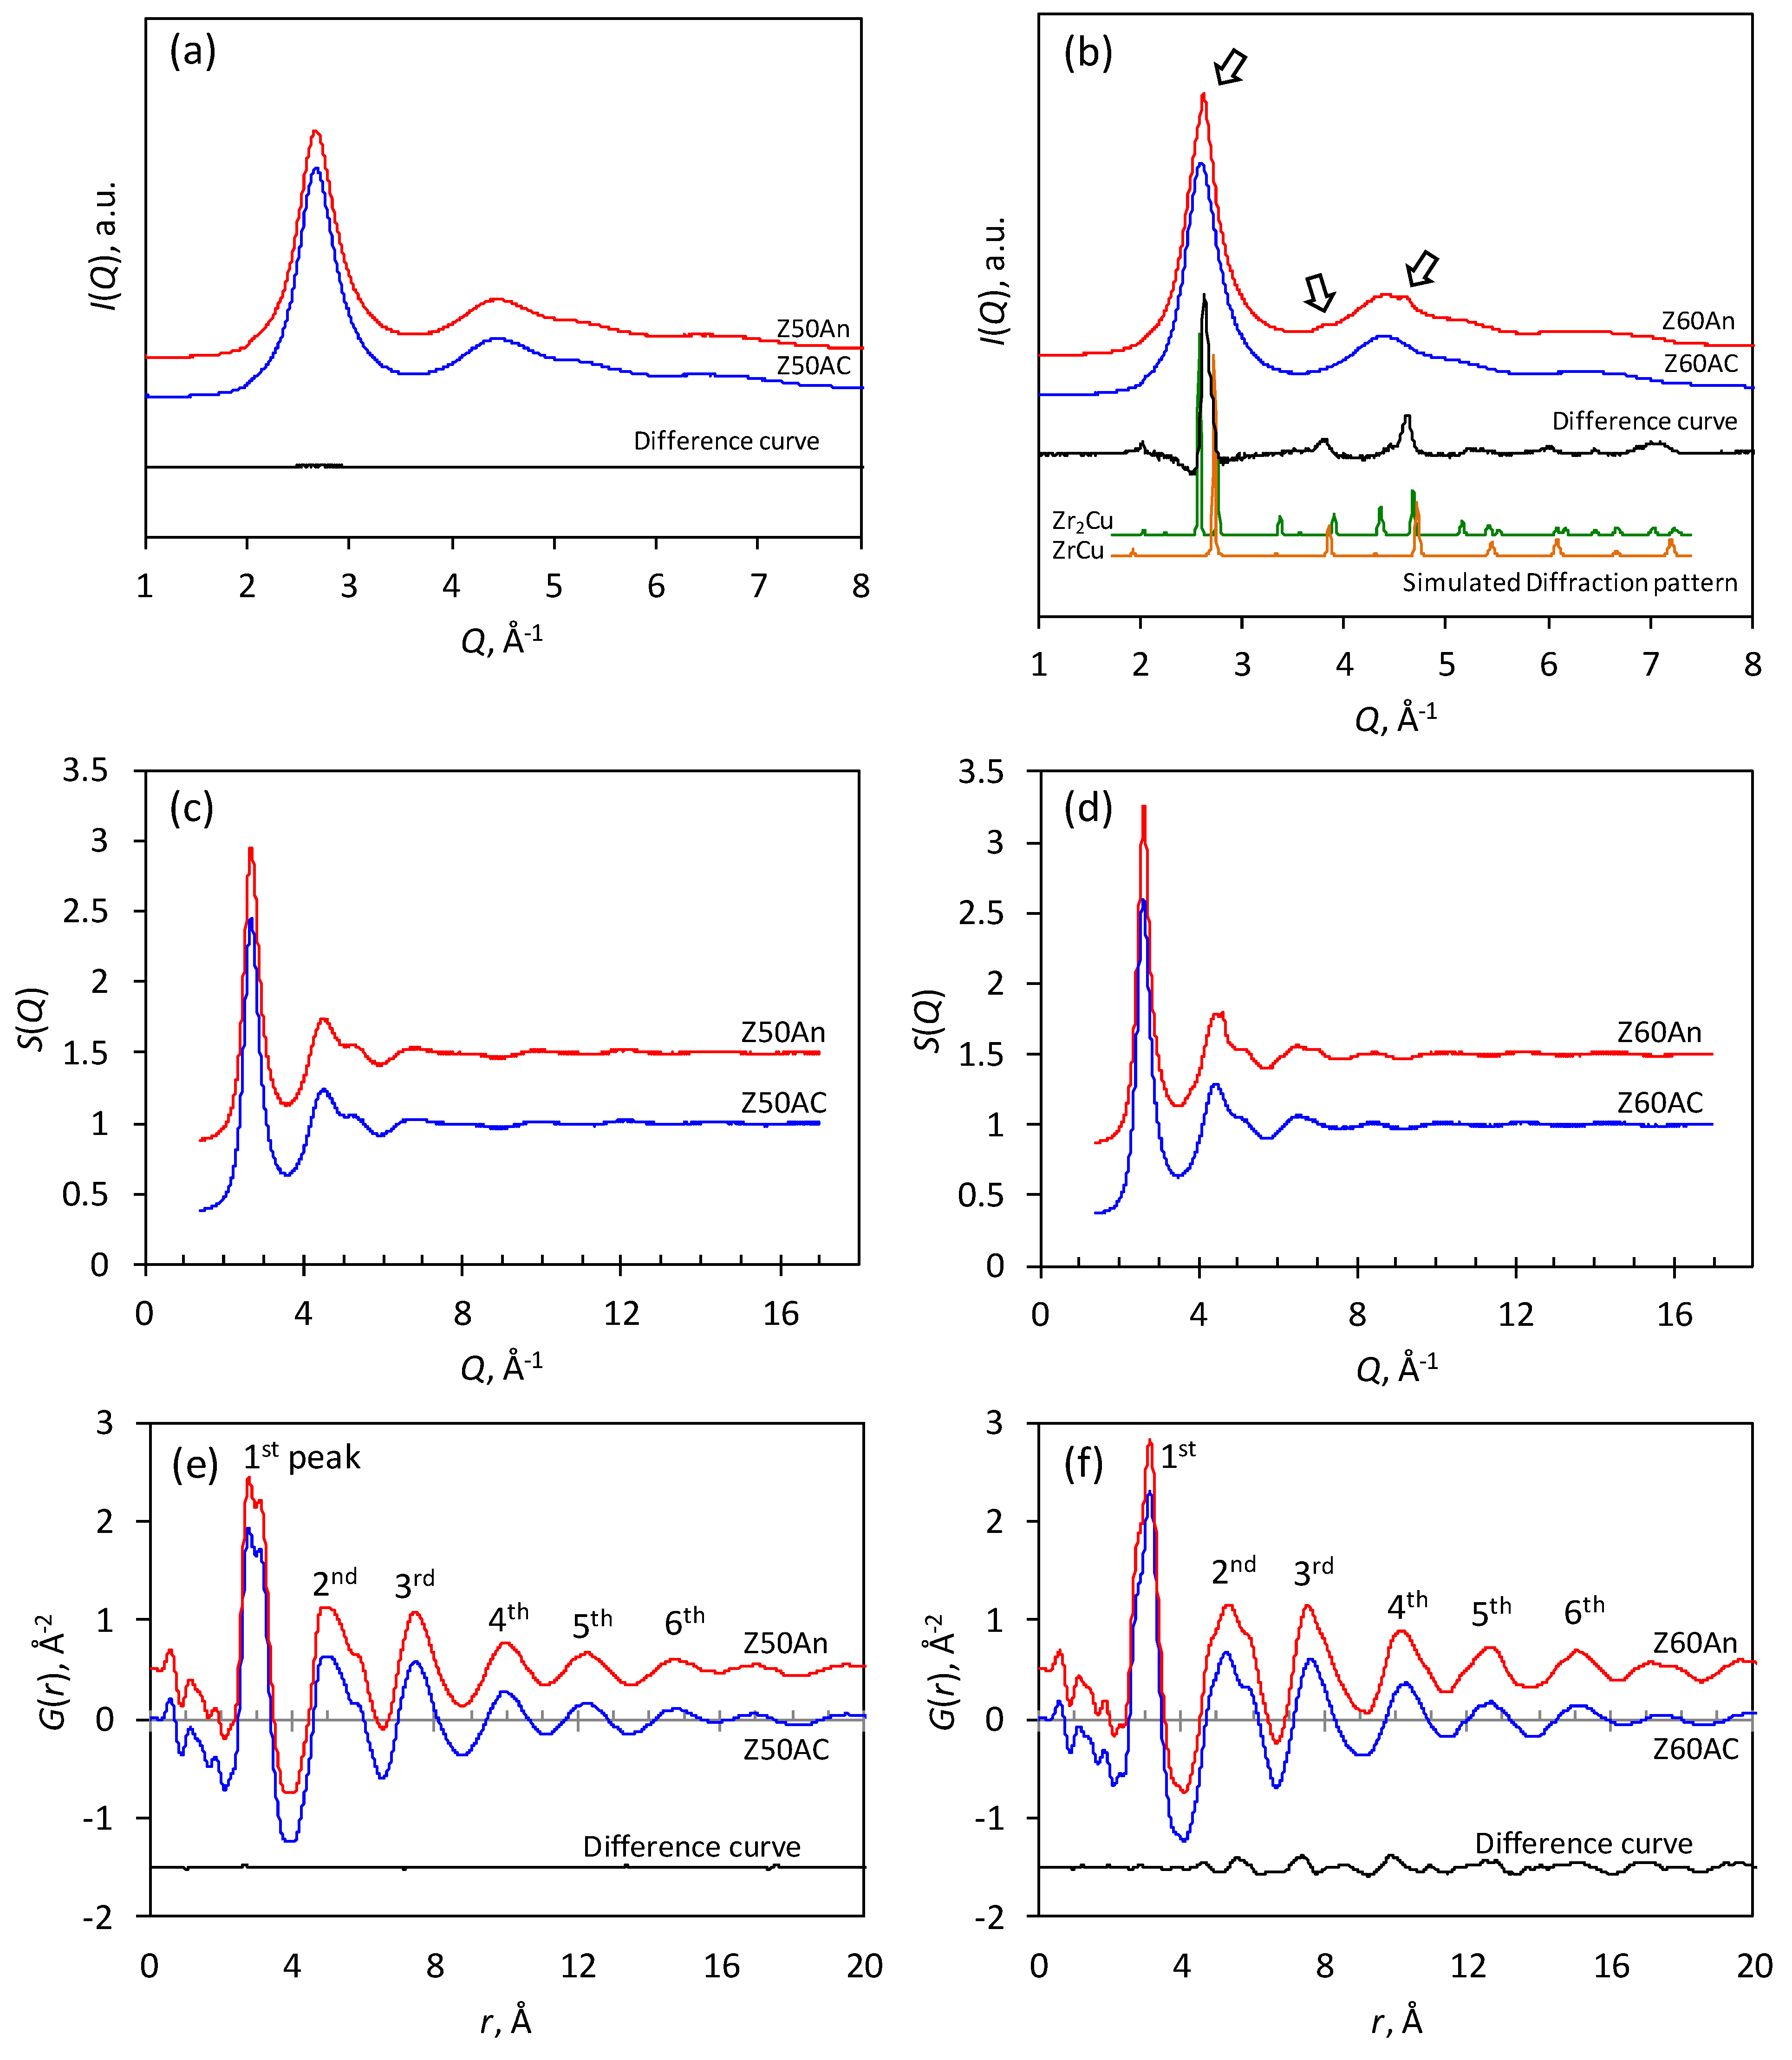
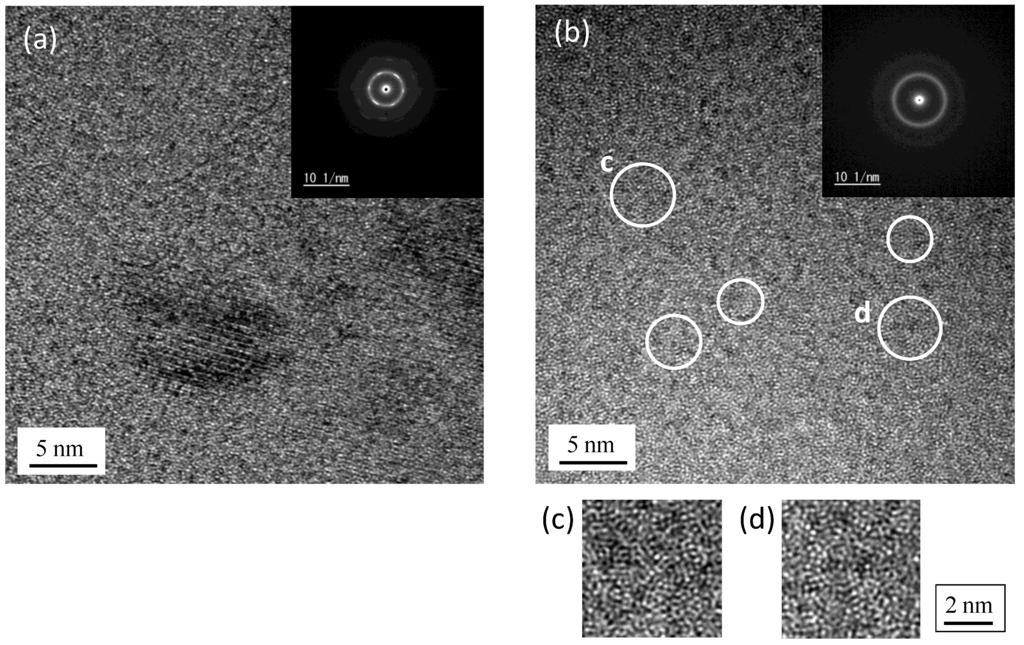
Figure 3.
TEM images of the annealed Z60. Ambiguous fringe contrast related to nanocrystallization can be seen in (a), and random close-range crystal-like orderings could be recognized as typically shown by white circles in (b). Images in the circles, c and d, in (b) are magnified in (c) and (d), respectively. Electron diffraction in the inset of (a) shows the diffraction spots and that in the inset of (b) indicates the halo ring showing amorphous structure.

3.2. Tensile Deformation Behavior
Figure 4 shows a comparison of the strain changes measured by the strain gauge and QSM for Z50 and Z60. The macroscopic Young’s modulus, EM of Z50 measured by the strain gauge is increased from 87 GPa to 96 GPa by annealing, which is a typical trend caused by structural relaxation [2]. The macroscopic Poisson’s ratios, νM before and after annealing are 0.34 and 0.36, respectively. A decrease in the Poisson’s ratio with a few % to 10% is commonly observed after annealing [13,14,15], but cannot be found in this result due to less accuracy. In contrast, EM for Z60 is constant at 86 GPa, regardless of whether annealing was performed. The macroscopic Poisson’s ratios νM shows slightly decreasing from 0.37 to 0.36 by annealing, which is a typical trend caused by structural relaxation.
The microscopic deformations measured by QSM are derived from a shift in the first peak of Q(r), fitted by the Voigt function for an initial state of the applied loading, providing the microscopic Young’s modulus, EQ and Poisson’s ratio, νQ. The Young’s modulus EQ of the as-cast Z50 is 103 GPa that is larger than EM (=87 GPa), and slightly increases to 106 GPa after annealing. The Poisson’s ratio νQ before annealing is 0.32 that is smaller than the macroscopic Poisson’s ratio νM (=0.34), and decreases to 0.29 after annealing. On the other hand, EQ of the as-cast Z60 is 93 GPa that is larger than EM (=86 GPa), and increases to 100 GPa after annealing, which is a different feature from the macroscopic Young’s modulus showing a constant level before and after annealing. The microscopic Poisson’s ratio νQ of the as-cast Z60 is 0.30 that is smaller than νM (=0.37), and slightly decreases to 0.29 after annealing. As described above, the microscopic deformation obtained by QSM exhibits different trends from the macroscopic deformation, which can be also found for the Zr–Al–Ni–Cu BMG reported by Sato et al. [5]. Furthermore, the relation between macroscopic and microscopic elastic moduli for the hypoeutectic metallic glass is different from that for the eutectic metallic glass.
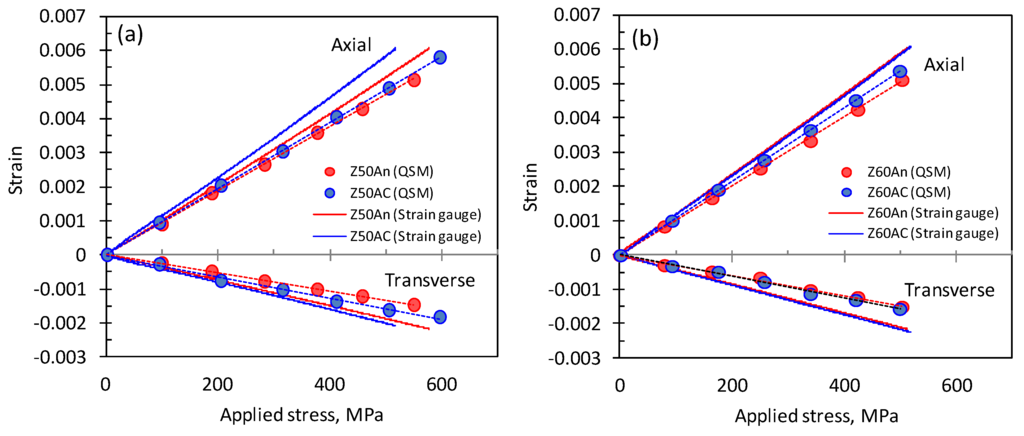
Figure 4.
Stress-strain relations of (a) Z50 and (b) Z60 before (blue) and after (red) annealing, derived from macroscopic strains measured by the strain gauge and from microscopic strains determined by QSM. Average error bars are from ±1.3 to ±2.4 × 10⁻⁴.
Figure 4.
Stress-strain relations of (a) Z50 and (b) Z60 before (blue) and after (red) annealing, derived from macroscopic strains measured by the strain gauge and from microscopic strains determined by QSM. Average error bars are from ±1.3 to ±2.4 × 10⁻⁴.

3.3. Comparison of Young’s Modulus with Different Scales
To understand the microscopic elastic behavior accurately, the microscopic Young’s moduli, ED were assessed by a shift in each peak of G(r), and they are plotted in Figure 5, as a function of r. The comparison of the Young’s moduli and the Poisson’s ratios measured by the strain gauge, QSM and DSM, is presented in Table 1. The Poisson’s ratios were determined from the stress-strain relations in the axial and transverse directions, measured by each method.
Figure 5a shows the microscopic Young’s modulus ED as a function of r for Z50, compared with EQ and EM. The Young’s modulus of the first peak at the lowest value of r is larger than the Young’s moduli determined at larger values of r beyond the second peak. This is a typical trend for the metallic glasses as shown in previous studies [3,4,5]. The local strain at the lowest value of r represents the local structural deformation between first nearest-neighbor atoms, which depends on the inherent stiffness of atomic bonds. In contrast, the strains at larger values of r exhibit the average structural deformation including a redistribution of the free-volume. Here, the Young’s modulus, ED_A derived from the average structural deformation was calculated by averaging values in a flat region of ED, and those before and after annealing were calculated to be 96 GPa and 100 GPa, respectively. These values are approximately 7 GPa smaller than the microscopic Young’s modulus EQ obtained by QSM. The difference between ED_A and EQ can be explained by considering EQ to be increased by an influence of the local structural deformation at the lowest value of r. Moreover, a slight increase in ED_A by annealing would be caused by hardening due to structural relaxation. In contrast, ED_A before annealing is 9 GPa larger than EM (=87 GPa) measured by the strain gauge, whereas EM approaches ED_A after annealing, i.e., ED_A = 100 GPa and EM = 96 GPa.
Figure 5b shows a change in the microscopic Young’s modulus, ED as a function of r for Z60, compared with EQ and EM. The trend of a change in ED is similar to that for Z50 shown in Figure 5a. However, a rise in ED at the lowest value of r is smaller than that for Z50, suggesting the inherent stiffness of atomic bonds for Z60 to be smaller. The Young’s modulus of the average structural deformation ED_A before annealing is larger than the macroscopic Young’s modulus EM, i.e., ED_A = 91 GPa and EM = 86 GPa. Furthermore, EQ is 93 GPa that is slightly larger than ED_A, but the Young’s moduli for all scales tend to be comparable for the as-cast Z60. The Young’s moduli EM and ED_A are almost unchanged by annealing, while EQ is clearly increased. In addition, the annealed Z60 shows a specific trend that the microscopic Young’s modulus ED determined at the second peak of G(r) increases after annealing.
The Poisson’s ratio also shows a characteristic trend that the macroscopic Poisson’s ratio νM is larger than the microscopic Poisson’s ratios νQ and νD, which is independent of the sample condition. Moreover, any drastic changes cannot be observed before and after annealing.
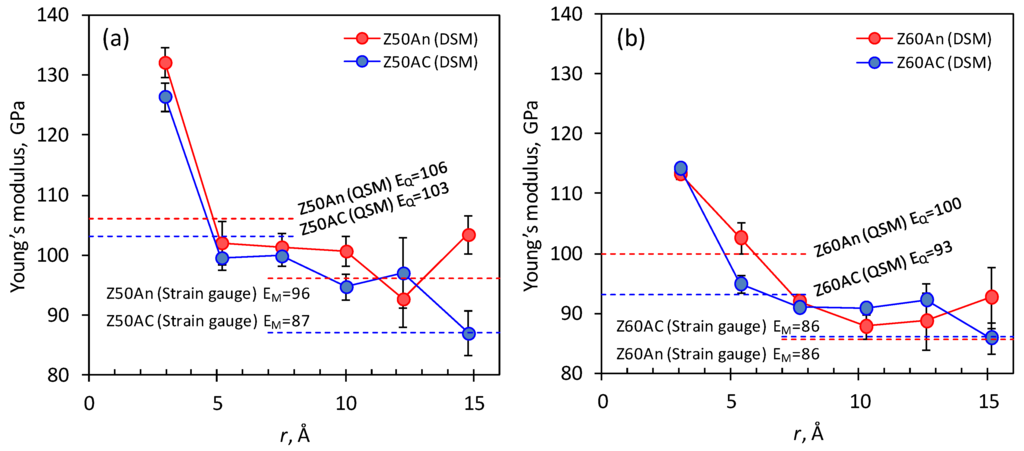
Figure 5.
Microscopic Young’s moduli of (a) Z50 and (b) Z60 before (blue) and after (red) annealing, which are derived from DSM, compared with Young’s moduli evaluated by QSM and the strain gauge.
Figure 5.
Microscopic Young’s moduli of (a) Z50 and (b) Z60 before (blue) and after (red) annealing, which are derived from DSM, compared with Young’s moduli evaluated by QSM and the strain gauge.


Table 1.
Young’s moduli and Poisson’s ratios of Z50 and Z60 evaluated by reciprocal-space (Q-space) method (QSM), direct-space method (DSM) and the strain gauge. “AC” and “An” denote “as-cast” and “annealed”, respectively.
| Elastic Modulus | Z50 | Z60 | ||
|---|---|---|---|---|
| AC | An | AC | An | |
| EQ (QSM), GPa | 103 ± 1 | 106 ± 1 | 93 ± 0 | 100 ± 1 |
| νQ (QSM) | 0.32 | 0.29 | 0.30 | 0.29 |
| ED_A (DSM Average), GPa | 96 ± 5 | 100 ± 4 | 91 ± 3 | 90 ± 2 |
| νD_A (DSM Average) | 0.28 | 0.27 | 0.27 | 0.24 |
| EM (Strain gauge), GPa | 87 ± 0 | 96 ± 0 | 86 ± 0 | 86 ± 0 |
| νM (Strain gauge) | 0.34 | 0.36 | 0.37 | 0.36 |
4. Discussion
4.1. Strain-Scale Observed by Each Technique
First of all, let us classify strain-scales observed by QSM, DSM and strain gauge. The strain-scale determined by QSM indicates an average deformation of nanoscale structures with less crystal periodicity involving crystal-like orderings and a glassy amorphous structure or none at all. On the other hand, the strain scale determined by DSM provides an average microscopic deformation of all composed structures including crystalline phases. In contrast, the strain-scale determined by the strain gauge is a macroscopic deformation of the specimen.
4.2. Deformation Model of Eutectic Z50-BMG
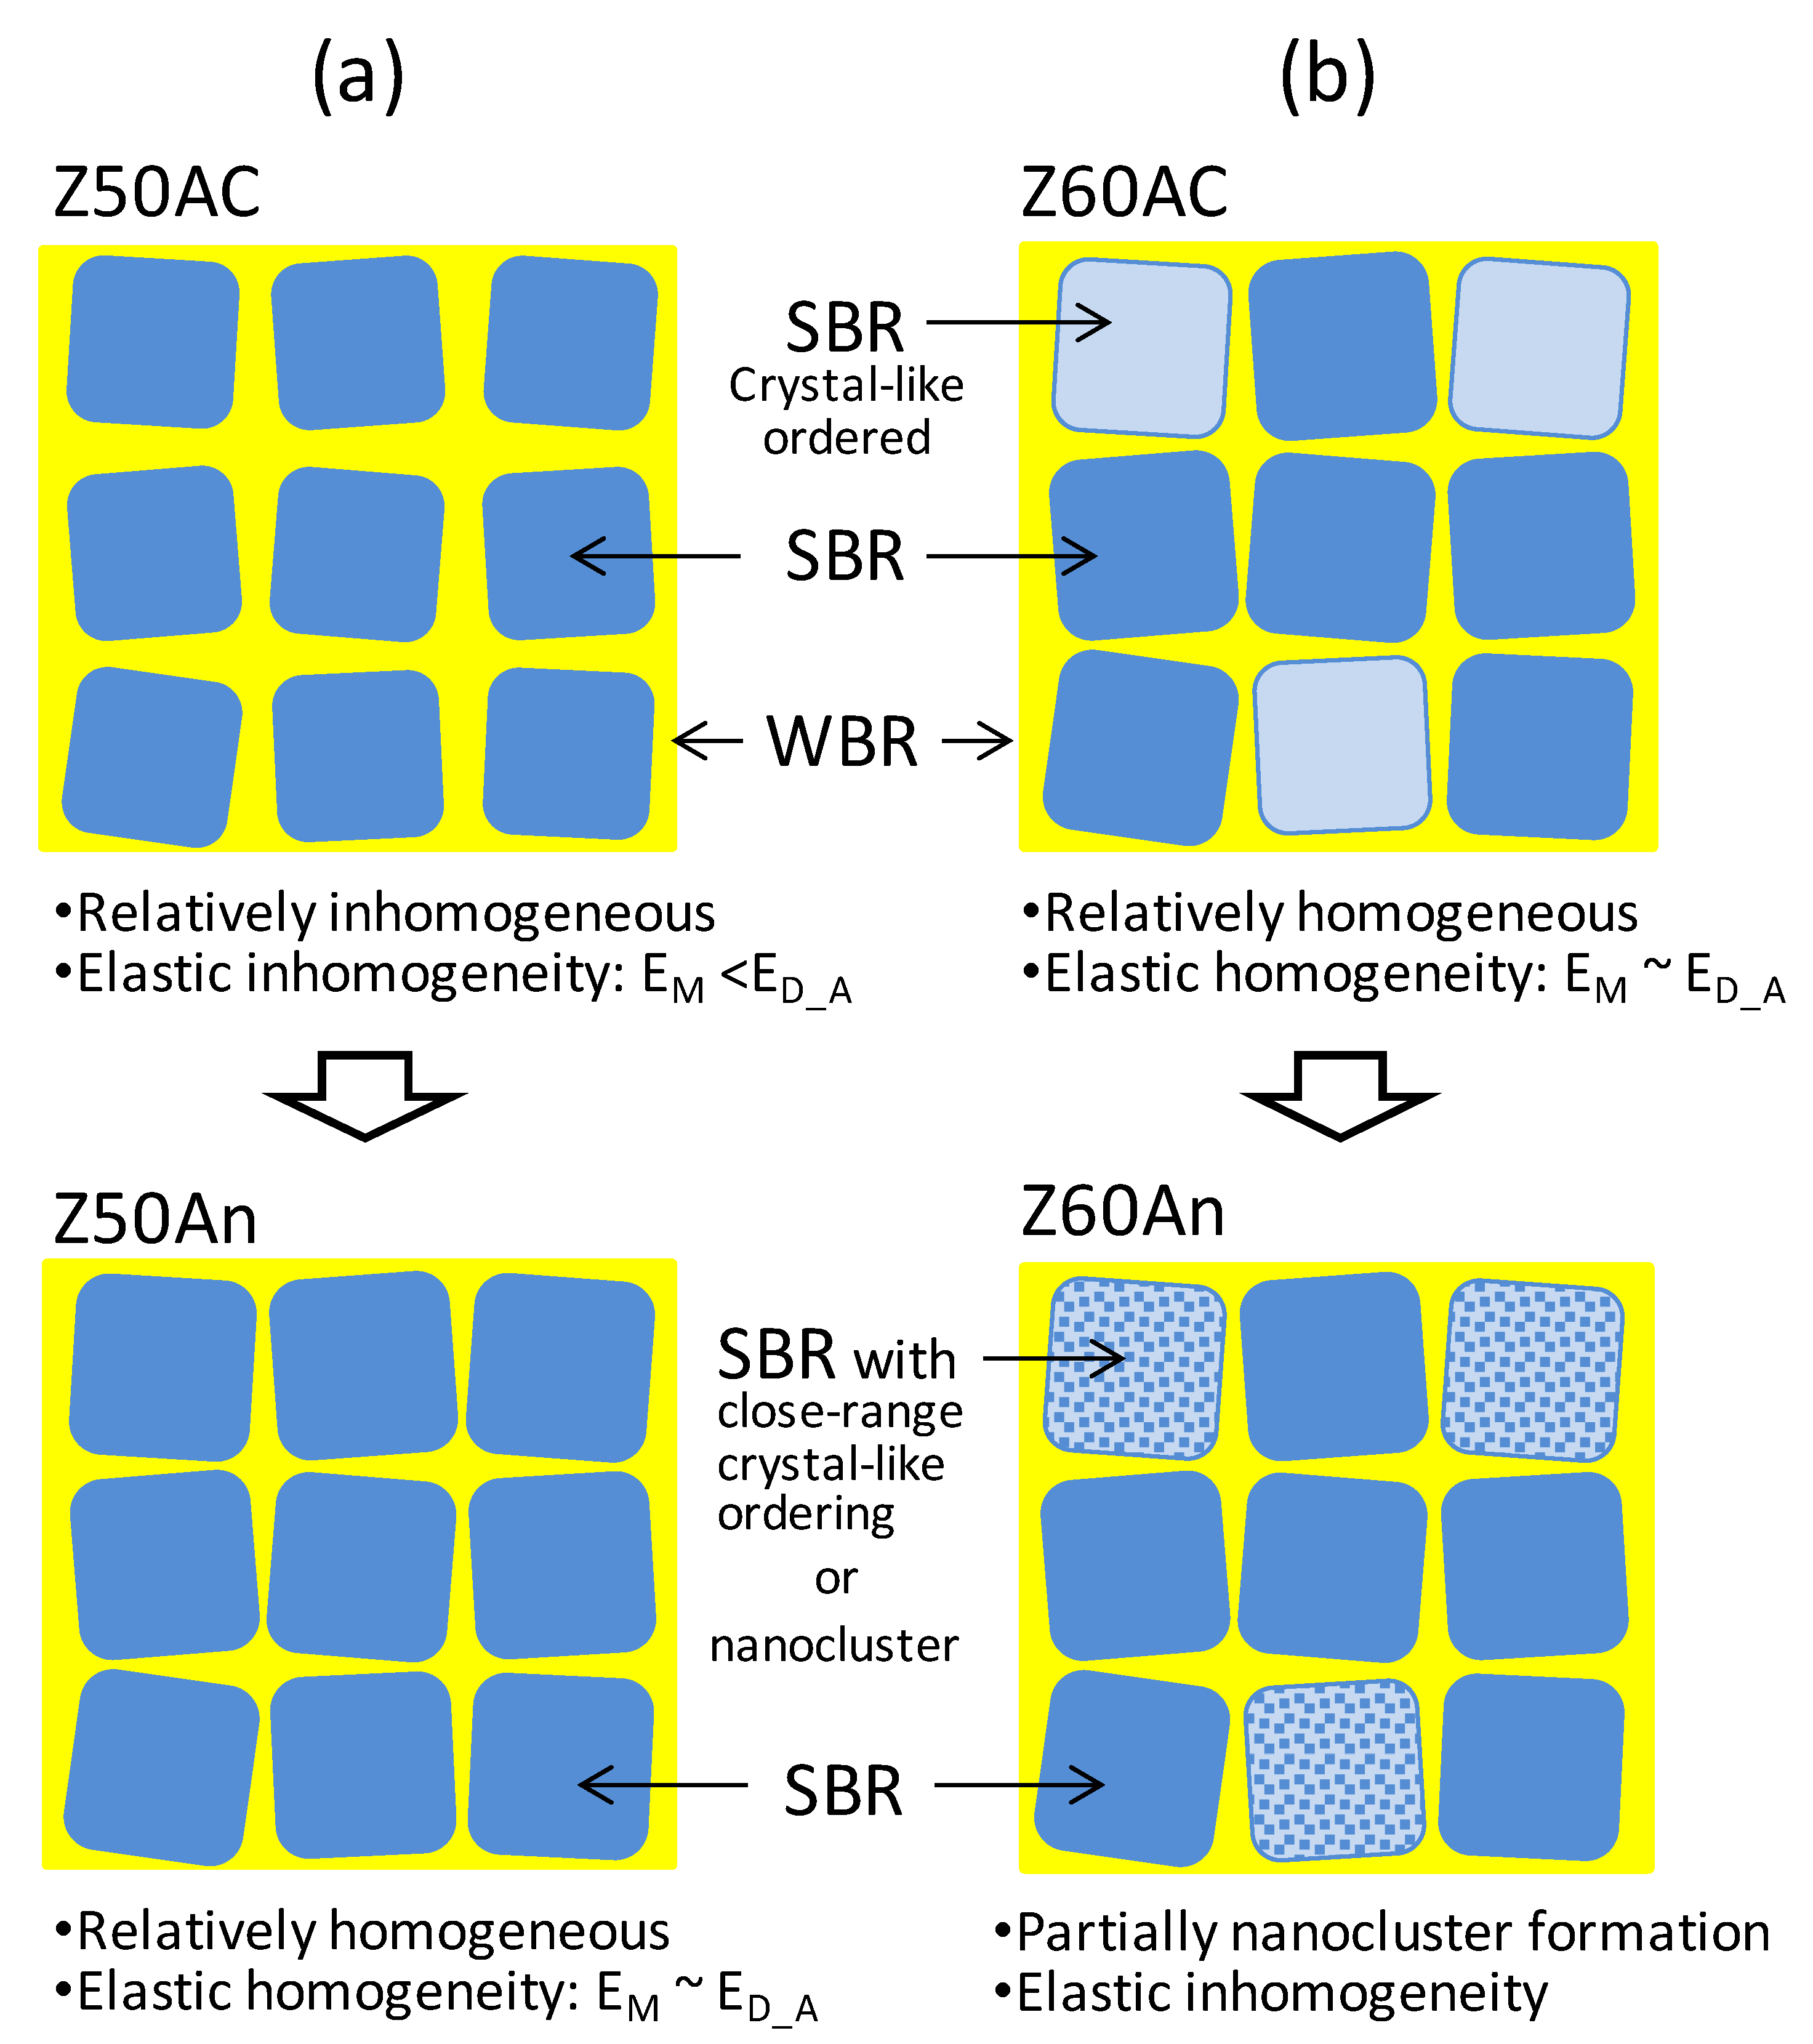
The microstructural model suggested by Ichitsubo et al. [16] provides an idea of the deformation model for the metallic glass. Figure 6a shows the schematic illustration of the simplified microstructural model of Z50 before and after annealing. The microstructure of a metallic glass is known to be a heterogeneous structure composed of strongly-bonded regions (SBRs) with low mobility and high density (low free-volume fraction), surrounded by weakly-bonded regions (WBRs) with high mobility and low density (high free-volume fraction). It is further suggested that an icosahedral atomic configuration generally exists in SBR in Zr-based metallic glasses [17]. Therefore, G(r) in Figure 2e involves the structural information of both regions, i.e., SBR and WBR, weighted by each volume fraction. Since the volume fraction of SBRs for the Zr-based BMG is typically larger than that of WBRs [18], the microscopic strain determined by DSM should be dominated by SBRs. Consequently, ED_A in Table 1 predominantly represents the microscopic Young’s modulus of SBR. On the other hand, the macroscopic deformation measured by the strain gauge must be a total deformation including both WBRs and SBRs. As the elastic constant of WBR is softer than that of SBR, the macroscopic Young’s modulus EM depends on the volume fraction of each region [18]. In particular, EM can approach the microscopic Young’s modulus ED_A as the volume fraction of SBRs increases. In the present study, EM is significantly smaller than ED_A before annealing, suggesting relatively inhomogeneous microstructure with high volume fraction of WBRs. After annealing, in contrast, reduction in the free-volume in WBRs due to structural relaxation increases the volume fraction of SBRs, constructing relatively homogeneous microstructure. Therefore, EM approaches ED_A by annealing since the elastic homogeneity is developed with an increase in the volume fraction of SBRs.
The relation between macroscopic and microscopic Poisson’s ratios can be explained by the same mechanism of the Young’s modulus with different Poisson’s ratios between WBR and SBR. Ichitsubo et al. suggests that the Poisson’s ratio of WBR is higher than that of SBR [18], explaining the present results showing the macroscopic Poisson’s ratio to be larger than the microscopic Poisson’s ratio. However, we cannot see any changes in the Poisson’s ratio by annealing, suggesting that the measurement resolution might be insufficient for observing its changes
The elastic homogeneity inhibits generation of a shear transformation zone, leading to decrease in its toughness or ductility and plasticity. Therefore, degradation of deformability of the eutectic Z50 due to structural relaxation would be originated from homogenization of the glassy nanostructure by reduction in the volume fraction of WBRs.
4.3. Deformation Model of Hypoeutectic Z60-BMG
Figure 6b shows the schematic illustration of the simplified microstructural model of Z60 before and after annealing. Since the crystal-like orderings are partially recognized in the annealed Z60, the as-cast Z60 might originally have some crystal-like ordered SBRs which can be nuclei of nanoclusters after annealing. This is supported by the fact showing the first peaks of I(Q) and S(Q) for the as-cast Z60 in Figure 2b, and d is slightly sharper compared with those for the as-cast Z50. In addition, the as-cast Z60 has relatively homogeneous microstructure with large volume fraction of SBRs since EM is originally close to ED_A.
It is known that the intensity damping of G(r) is correlated to damping of the structural coherence [19]. Accordingly, a discrete G(r) for the crystal-like ordered regions with the size of a few nanometers or less decreases immediately with an increase of r. Therefore, an increase in ED at the second peak of G(r) for the annealed Z60 would be affected by nanocluster formation after annealing. A similar trend appears in EQ to be increased after annealing since EQ could be affected by the change in the Young’s modulus ED at the second peak of G(r). In contrast, the average deformation determined at larger values of r above the third peak of G(r) represents the microscopic Young’s modulus of the average microstructure (ED_A in Table 1), and is almost unchanged by annealing. Therefore, an increase in ED at the second peak of G(r) after annealing suggests that there are locally harder regions such as nanoclusters in relatively softer amorphous glassy matrix. As described above, the annealed Z60 exhibits structural inhomogeneity owing to nanocluster formation, likewise elastic homogeneity would be decreased after complete structural relaxation. However, the result that EM and ED_A are almost unchanged by annealing suggests that the elastic properties of the annealed SBRs are almost unchanged from that of the as-cast SBRs, and that WBRs surrounding nanoclusters would play a role of damper to minimize an influence of nanoclusters on the macroscopic elastic constant. In addition, nanocluster formation in SBRs after annealing might improve deformability of glassy structure by branching and pinning the shear band around the nanoclusters [20]. This would be one reason why the hypoeutectic Z60 inhibits degradation of mechanical properties after complete structural relaxation.
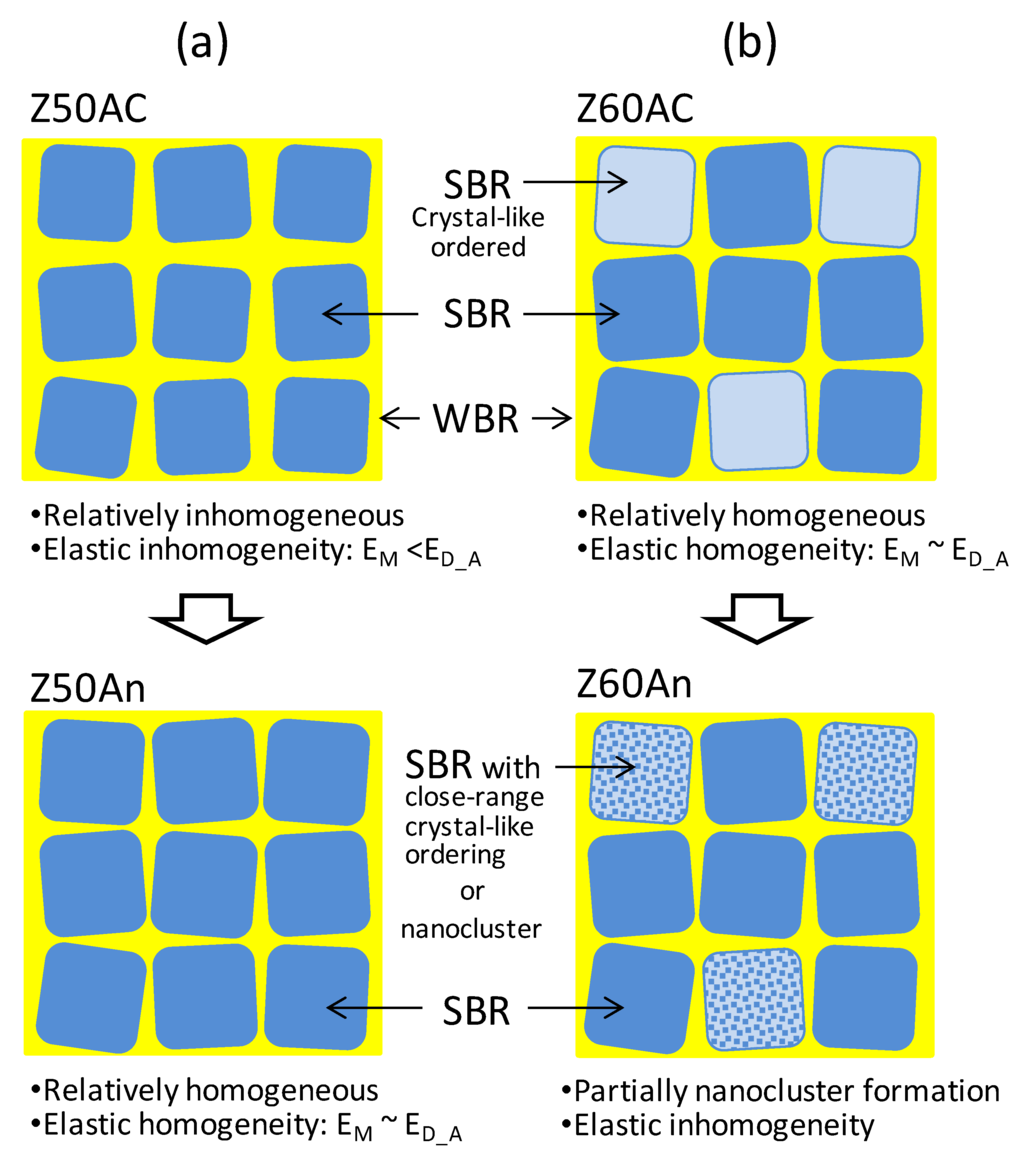
Figure 6.
Schematic illustration of the simplified microstructural models of (a) Z50 and (b) Z60 before and after annealing. The weakly-bonded regions (WBR) shown by the yellow color surround the strongly-bonded regions (SBR) shown by the blue color.
Figure 6.
Schematic illustration of the simplified microstructural models of (a) Z50 and (b) Z60 before and after annealing. The weakly-bonded regions (WBR) shown by the yellow color surround the strongly-bonded regions (SBR) shown by the blue color.
5. Conclusions
In this study, the difference of the elastic deformation behaviors between eutectic Zr50Cu40Al10 and hypoeutectic Zr60Cu30Al10 BMGs was investigated by comparing strains with different scales obtained by the Direct-space method (DSM), Reciprocal-space (Q-space) method (QSM) and the strain gauge method. The eutectic Zr50Cu40Al10 BMG obtains more homogeneous microstructure by free-volume annihilation after annealing, improving resistance to deformation but degrading ductility because of a decrease in the volume fraction of WBRs (weakly-bonded regions) with relatively high mobility. On the other hand, the as-cast hypoeutectic Zr60Cu30Al10 BMG originally has homogeneous nanostructure with high volume fraction of SBRs (strongly-bonded regions) but loses structural and elastic homogeneities because of nanocluster formation partially after annealing. Such structural changes by annealing might develop unique mechanical properties showing no degradations of ductility and toughness for the structural-relaxed hypoeutectic Zr60Cu30Al10 BMGs.
Acknowledgments
This work has been supported by a Grant-in-Aid of the Ministry of Education, Sports, Culture, Science and Technology, Japan, Scientific Research (A) (No. 23246109). The synchrotron radiation experiment was performed at the SPring-8 with the approval of Japan Synchrotron Radiation Research Institute (JASRI) as Proposal No. 2013B3724. The authors wish to acknowledge the experimental assistance of T. Shobu and A. Shiro at Japan Atomic Energy Agency (JAEA), and K. Shimizu at Tokyo City University. The authors would also like to acknowledge N. Igawa at JAEA for his beneficial assistance.
Author Contributions
H.S., M.I, S.S and J.S. conceived and designed the experiments; T.W. and A.M. contributed experimental instruments; H.S., R.Y., S.T. and J.S. performed the experiments and analyzed the data; all authors contributed to the interpretation of the data; H.S. wrote the paper.
Conflicts of Interest
The authors declare no conflict of interest.
References
- Yokoyama, Y.; Yamasaki, T.; Nishijima, M.; Inoue, A. Drastic Increase in the Toughness of Structural Relaxed Hypoeutectic Zr59Cu31Al10 Bulk Glassy Alloy. Mater. Trans. 2007, 48, 1276–1281. [Google Scholar] [CrossRef]
- Yokoyama, Y.; Yamasaki, T.; Liaw, P.K.; Inoue, A. Study of the structural relaxation-induced embrittlement of hypoeutectic Zr–Cu–Al ternary bulk glassy alloys. Acta Mater. 2008, 56, 6097–6108. [Google Scholar] [CrossRef]
- Poulsen, H.F.; Wert, J.A.; Neuefeind, J.; Honkimaki, V.; Daymond, M. Measuring strain distributions in amorphous materials. Nat. Mater. 2005, 4, 33–36. [Google Scholar] [CrossRef]
- Hufnagel, T.C.; Ott, R.T. Structural aspects of elastic deformation of a metallic glass. Phys. Rev. B 2006. [Google Scholar] [CrossRef]
- Sato, S.; Suzuki, H.; Shobu, T.; Imafuku, M.; Tsuchiya, Y.; Wagatsuma, K.; Kato, H.; Setyawan, A.D.; Saida, J. Atomic-scale characterization of elastic deformation of Zr-Based metallic glass under tensile stress. Mater. Trans. 2010, 51, 1381–1385. [Google Scholar] [CrossRef]
- Liss, K.-D.; Qu, D.D.; Yan, K.; Reid, M. Variability of Poisson’s ratio and enhanced ductility in amorphous metal. Adv. Eng. Mater. 2013, 15, 347–351. [Google Scholar] [CrossRef]
- Watanuki, T.; Machida, A.; Ikeda, T.; Ohmura, A.; Kaneko, H.; Aoki, K.; Sato, T.J.; Tsai, A.P. Development of a single-crystal X-ray diffraction system for hydrostatic-pressure and low-temperature structural measurement and its application to the phase study of quasicrystals. Philos. Mag. 2007, 87, 2905–2911. [Google Scholar] [CrossRef]
- Fujihisa, H. Recent progress in the power X-ray diffraction image analysis program PIP. Rev. High Press. Sci. Technol. 2005, 15, 29–35. [Google Scholar] [CrossRef]
- Juhás, P.; Davis, T.; Farrow, C.L.; Billinge, S.J.L. PDFgetX3: A rapid and highly automatable program for processing powder diffraction data into total scattering pair distribution functions. J. Appl. Crystallogr. 2013, 46, 560–566. [Google Scholar] [CrossRef]
- Ishii, A.; Hori, F.; Iwase, A.; Fukumoto, Y; Yokoyama, Y.; Konno, T.J. Relaxation of free volume in Zr50Cu40Al10 bulk metallic glasses studied by positron annihilation measurements. Mater. Trans. 2008, 49, 1975–1978. [Google Scholar] [CrossRef]
- Izumi, F.; Momma, K. Three-dimensional visualization in powder diffraction. Solid State Phenom. 2007, 130, 15–20. [Google Scholar] [CrossRef]
- Zeng, K.J.; Hamalainen, M. A new thermodynamic description of the Cu–Zr system. J. Phase Equilib. 1994, 15, 577–586. [Google Scholar] [CrossRef]
- Louzguine-Luzgin, D.V.; Fukuhara, M.; Inoue, A. Specific volume and elastic properties of glassy, icosahedral quasicrystalline and crystalline phases in Zr–Ni–Cu–Al–Pd alloy. Acta Mater. 2007, 55, 1009–1015. [Google Scholar] [CrossRef]
- Kumar, G.; Rector, D.; Conner, R.D.; Schroers, J. Embrittlement of Zr-based bulk metallic glasses. Acta Mater. 2009, 57, 3572–3583. [Google Scholar] [CrossRef]
- Ngai, K.L.; Wang, L.-M.; Liu, R.; Wang, W.H. Microscopic dynamics perspective on the relationship between Poisson’s ratio and ductility of metallic glass. J. Chem. Phys. 2014. [Google Scholar] [CrossRef]
- Ichitsubo, T.; Matsubara, E.; Yamamoto, T.; Chen, H.S.; Nishiyama, N.; Saida, J.; Anazawa, K. Microstructure of fragile metallic glasses inferred from ultrasound-accelerated crystallization in Pd-based metallic glasses. Phys. Rev. Lett. 2005. [Google Scholar] [CrossRef] [PubMed]
- Matsubara, E.; Ichitsubo, T.; Itoh, K.; Fukunaga, T.; Saida, J.; Nishiyama, N.; Kato, H.; Inoue, A. Heating rate dependence of Tg and Tx in Zr-based BMGs with characteristic structures. J. Alloys Compds. 2009, 483, 8–13. [Google Scholar] [CrossRef]
- Ichitsubo, T.; Kato, H.; Matsubara, E.; Biwa, S.; Hosokawa, S.; Matsuda, K.; Uchiyama, H.; Baron, A.Q.R. Static heterogeneity in metallic glasses and its correlation to physical properties. J. Non-Cryst. Solids 2011, 357, 494–500. [Google Scholar] [CrossRef]
- Kodama, K.; Iikubo, S.; Taguchi, T.; Shamoto, S. Finite size effects of nanoparticles on the atomic pair distribution functions. Acta Crystallogr. 2006, A62, 444–453. [Google Scholar] [CrossRef] [PubMed]
- Saida, J.; Setyawan, A.D.; Kato, H.; Inoue, A. Nanoscale multistep shear band formation by deformation-induced nanocrystallization in Zr–Al–Ni–Pd bulk metallic glass. Appl. Phys. Lett. 2005. [Google Scholar] [CrossRef]
© 2016 by the authors; licensee MDPI, Basel, Switzerland. This article is an open access article distributed under the terms and conditions of the Creative Commons by Attribution (CC-BY) license (http://creativecommons.org/licenses/by/4.0/).