Abstract
This study investigates the influence of vanadium–nitrogen (V-N) microalloying design on the microstructure and mechanical properties of 700 MPa grade ultra-high-strength steel bars. Through the control of the V/N ratio and cooling rate, a yield strength exceeding 700 MPa was achieved in a steel with a pearlite–ferrite matrix. Microstructural characterization via optical microscopy (OM) and scanning electron microscopy (SEM) revealed that a V/N ratio of approximately 1:10 combined with a rolling cooling rate of 1–3 °C/s resulted in the steel bar exhibiting a yield strength of 774.21 MPa and a tensile strength of 971.13 MPa. The primary microstructure of the steel consisted of ferrite and pearlite. The steel featured fine grains and favorable crystallographic orientations, which contributed to its high yield strength and good ductility. Transmission electron microscopy (TEM) analysis indicated that under hot-rolling conditions, vanadium precipitated predominantly as nano-scale V(C,N) particles. These precipitates were distributed in both the pearlite and ferrite phases, thereby enhancing the tensile and yield strength. Furthermore, the steel with an optimal nitrogen content (0.0166 wt.%) and the finest grain structure (average grain size ≈ 2.618 μm) showed the lowest stress corrosion cracking (SCC) susceptibility, characterized by an elongation loss rate (Iδ) of 12.51%, demonstrating excellent SCC resistance.
1. Introduction
The development of construction steel reinforcement has evolved through the stages of technology introduction, technical refinement and innovation. Consequently, the performance of steel products has been progressively improved, with the associated manufacturing technology maturing and stabilizing. Since 2018, China has actively promoted the application of high-strength steel reinforcement, yielding positive preliminary outcomes. The newly revised national standard introduces a new grade of high-strength reinforcement steel with a yield strength of up to 600 MPa [1,2,3,4,5]. This high-strength steel reinforcement offers improved strength and good ductility, which significantly reduces the overall quantity of steel required in building structures. These properties allow it to meet the design and safety requirements of modern multifunctional structures, such as high-rise buildings, large-span constructions, and seismic-resistant frameworks.
During service, the synergistic effect of chloride-induced corrosion, an alkaline environment, and applied stress significantly increases the susceptibility of steel to stress corrosion cracking (SCC). For high-strength steel bars, SCC poses a serious risk, as it can induce premature structural failure and potentially trigger sudden catastrophic events, thereby representing a major constraint on their broader engineering application [6,7,8,9,10]. Consequently, enhancing both the strength and SCC resistance of steel is essential. This goal aligns with the pursuit of green steel production and application within the “dual-carbon” framework and is a pivotal objective in the development of advanced high-strength steels.
Vanadium has a limited effect on delaying recrystallization [11,12] but contributes significantly to precipitation strengthening in high-nitrogen steels [13,14]. Microstructural features such as grain size, phase composition, and grain boundary characteristics play a critical role in governing the stress corrosion path and crack propagation rate. Studies have shown that finely dispersed V(C,N) precipitates can pin grain boundaries, effectively hindering crack propagation and thereby enhancing the strength, ductility, and SCC resistance of the steel [15,16,17]. Furthermore, under normalizing temperatures, vanadium- and nitrogen-rich precipitates may dissolve, with nitrogen in solid solution notably increasing the strength of the steel [18]. As an interstitial solute, nitrogen substantially strengthens steel reinforcement. However, excessive nitrogen content can promote dislocation pile-up, which in turn reduces fracture toughness [19,20,21,22,23]. To date, systematic experimental data and theoretical understanding remain insufficient for achieving the coordinated optimization of high strength, high toughness, and superior corrosion resistance in vanadium–nitrogen microalloyed ultra-high-strength steel bars through precise control of nitrogen content.
This study aims to produce vanadium–nitrogen microalloyed ultra-high-strength steel bars with a target strength of 700 MPa through compositional design and controlled variation in nitrogen content. The relationships between the strength and seismic performance indices of the experimental steel were investigated using electron backscatter diffraction (EBSD) for microstructural analysis, transmission electron microscopy (TEM) for precipitate characterization, and slow-strain-rate tensile (SSRT) testing for SCC evaluation. Correlations between microstructure, strength–toughness balance, and SCC resistance, as well as the behavior of precipitates, were systematically examined. This work is intended to provide design guidance for enhancing both the strength and SCC resistance of construction-grade high-strength steel bars and to establish a theoretical basis for their safe application in aggressive environments.
2. Materials and Methods
2.1. Preparation
Based on the precipitation strengthening theory of V-N microalloying [24], three V-N and V-Fe microalloyed experimental steel bars were designed for this study. The chemical compositions are provided in Table 1. The elemental compositions of the steels were determined using an inductively coupled plasma mass spectrometer (ICP-MS, ELAN9000, LECO, St. Joseph, MI, USA) and an infrared carbon–sulfur analyzer (CS-444, LECO, St. Joseph, MI, USA), following the standard methods of inductively coupled plasma atomic emission spectrometry and high-frequency induction furnace combustion followed by infrared absorption, respectively. For each element in each steel, at least three independent measurements were performed. The values reported in Table 1 represent the averages of these measurements; the relative error of the instrument is typically ≤1%. Given the critical role of nitrogen content in this study, it was specifically determined using an oxygen–nitrogen analyzer (TC-600, LECO, St. Joseph, MI, USA) based on the inert gas fusion–thermal conductivity method, with a detection error within 0.00005%.

Table 1.
Chemical composition of three 700 MPa ultra-high-strength test steel bars (wt.%).
The steels were prepared by melting and casting in a 25 kg medium-frequency induction furnace. The resulting ingots were reheated to 1200 °C and held for 2 h in a furnace. Subsequently, hot rolling was conducted on a Φ750 mm × 550 mm two-high mill. Rolling was initiated at 1150 °C. After six passes of reversible rolling, the material was introduced into a finishing ribbed pass to produce hot-rolled ribbed bars with a nominal diameter of 12 mm. The finishing rolling temperature of the last pass was controlled at 900 °C. The experimental steel was machined into cylindrical specimens of φ4 mm × 10 mm for continuous cooling thermal expansion tests using a DIL805A dilatometer (TA Instruments, New Castle, DE, USA). The specific procedure was as follows: first, heating at a rate of 5 °C/s to 880 °C, holding for 15 min to ensure complete austenitization of the steel, followed by cooling to room temperature at rates of 0.5 °C/s, 1 °C/s, 3 °C/s, 5 °C/s, 10 °C/s, 30 °C/s, and 50 °C/s.
2.2. Characterization
Specimens subjected to different cooling rates were mechanically ground using #400–#2000 grit abrasive paper, polished with 2 µm diamond paste, and etched with 4% nital for 8–12 s. The microstructures were subsequently observed using a ZEISS ULTRA-55 field-emission scanning electron microscope (FE-SEM, Oberkochen, Germany). Furthermore, microstructures were examined with a Leica DMIRM metallographic optical microscope (Wetzlar, Germany). Crystallographic data were collected using an FEI Quanta 650 environmental scanning electron microscope (Hillsboro, OR, USA) equipped with an Oxford Nordlys F+EBSD attachment (Abingdon, UK). The EBSD scans were performed with a step size of 0.15 μm, and the indexing rate exceeded 90%. A minimum confidence index (CI) of 0.1 was applied. For EBSD analysis, a specific surface preparation was followed: specimens were sequentially ground with silicon carbide papers up to 5000 grit. Subsequently, they were electrolytically polished in a solution of 10% perchloric acid, 10% glycerol, and 80% ethanol at 20 V and 1 A for 11–12 s. Three distinct regions were analyzed for each steel sample under identical preparation and scanning conditions. The selected regions were located away from specimen edges. The acquired data were analyzed using AZtecCrystal 2.1.2 software. For grain size statistics, grain boundaries were defined by a misorientation threshold of 15°; boundaries with misorientation angles between 2° and 15° were considered low-angle grain boundaries (LAGBs), while those above 15° were classified as high-angle grain boundaries (HAGBs). Additionally, the microstructure of the prepared samples and the precipitation behavior of vanadium in the steel were observed using a Tecnai G2 F20 S-TWIN transmission electron microscope (Hillsboro, OR, USA) operated at 200 kV. Elemental mapping was conducted using an energy-dispersive spectroscopy (EDS) detector with an energy resolution of 136 eV (Mn-Kα), employing area-scan mode to visualize.
According to the Chinese National Standard [25], specimens were cut along the rolling direction (RD) from the hot-rolled steel bars and machined into standard round cross-sectional tensile specimens. Room-temperature mechanical property tests were conducted on an Instron 5989 tensile testing machine (Norwood, MA, USA) at a constant crosshead speed of 0.75 mm/min. These tensile specimens were then ground, polished, and etched with a 4% nital solution for further analysis.
SSRT test specimens were prepared according to the Chinese National Standard [26]. Stress corrosion tests were conducted on a WDML-30KN material testing machine (LETRY, Xi’an, China). The specimens were stretched at a strain rate of 1 × 10⁻⁶ s−1 both in air and in a simulated solution for near-shore concrete environments (saturated Ca(OH)2 + 1 wt.% NaCl). SCC susceptibility was characterized by the elongation loss rate (Iδ) and the reduction in area loss (), calculated using the following formulas:
where and represent the reduction in area and elongation measured in the corrosive solution, respectively, while and correspond to the reduction in area and elongation measured in air. Each test was repeated at least three times to ensure reproducibility. After the SSRT tests, the fracture surface morphology and the morphology of the fracture side surface were examined using SEM.
3. Results
3.1. Mechanical Properties and Microstructural Analysis
Two tensile tests were performed for each of the three experimental steels; the resulting stress–strain curves are shown in Figure 1, and the corresponding mechanical properties are summarized in Table 2. The yield strengths of Steels 1# (0.0280 wt.% N) and 3# (0.0166 wt.% N) both exceeded 700 MPa, and their tensile strengths were comparable and markedly higher than that of Steel 2# (0.0049 wt.% N). Steel 3# (0.0166 wt.% N) exhibited significantly greater elongation and uniform elongation compared with Steels 1# (0.0280 wt.% N) and 2# (0.0049 wt.% N), indicating its superior ductility. Comparative analysis of the chemical compositions revealed that nitrogen content varied among the three steels. A clear correlation was observed between mechanical properties and nitrogen content: yield strength generally increased with nitrogen content. However, ductility exhibited a non-monotonic relationship, reaching a maximum at an intermediate nitrogen content of approximately 0.0166 wt.% (Steel 3#). Compared to the low-nitrogen Steel 2# (0.0049 wt.%), Steel 3# showed superior ductility. Conversely, further increasing the nitrogen content to 0.0280 wt.% (Steel 1#) resulted in a decrease in ductility despite higher strength. Therefore, adjusting the nitrogen content provides a means to control the seismic performance of steel bars, enabling a combination of high strength and good ductility [27]. Specifically, by controlling the nitrogen content at approximately 0.0166 wt.% and maintaining an optimal V/N ratio of about 1:10, a stable yield strength meeting the 700 MPa requirement can be achieved. Furthermore, the steels satisfy seismic performance criteria, with both the tensile-to-yield-strength ratio and the elongation ratio exceeding 1.25, resulting in well-balanced comprehensive properties and a high safety margin.
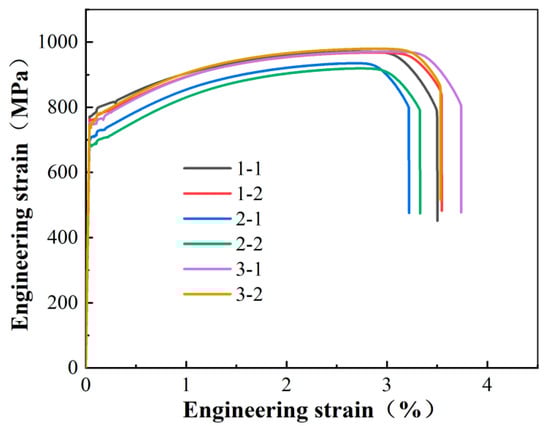
Figure 1.
Stress–strain curve of test steel.
Table 2.
The mechanical properties of 700 MPa ultra-high-strength test steel bars.
After the rolling process, the microstructures of the steel samples were examined using light optical microscopy, as shown in Figure 2a–i. The microstructures of all three steels consisted of ferrite, pearlite and bainite. Although the phase fractions differed, each constituent exhibited distinct grain sizes. Steel 1# (0.0280 wt.% N) possessed the finest grain size, followed by Steel 3# (0.0166 wt.% N), whereas Steel 2# (0.0049 wt.% N) displayed the coarsest grains along with an angular ferrite morphology. In Steel 3# (0.0166 wt.% N), the ferrite and pearlite phases were present in balanced proportions. The ferrite grains were fine, all under 10 μm in size, and the interfaces between ferrite and pearlite were smooth. These microstructural characteristics contributed to the optimal mechanical performance observed in Steel 3# (0.0166 wt.% N).
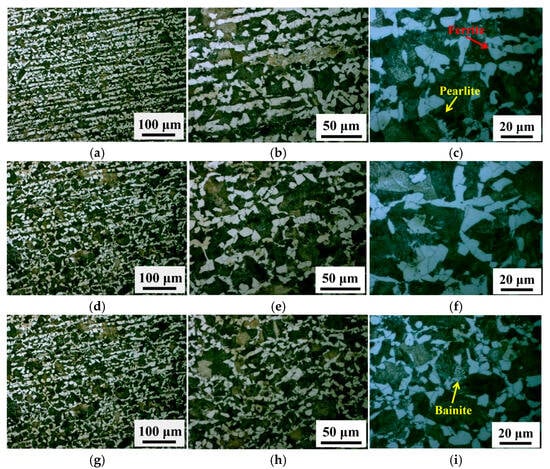
Figure 2.
Optical microscopy of test steel. (a–c) Images of Steel 1# (0.0280 wt.% N), (d–f) Images of Steel 2# (0.0049 wt.% N), (g–i) Images of Steel 3# (0.0166 wt.% N).
3.2. Continuous Cooling Transformation (CCT) Curves
The CCT curve characterizes the phase-transformation behavior of undercooled austenite under continuous cooling, providing a basis for analyzing the microstructure and properties of the transformation products. To establish a suitable rolling process for industrial trial production, the CCT curve can be used to correlate cooling rate with resultant microstructure, thereby guiding process design. In this work, the CCT curve for the 700 MPa ultra-high-strength steel bar (Steel 3#, 0.0166 wt.% N) was determined using a Gleeble thermomechanical simulator (Figure 3).
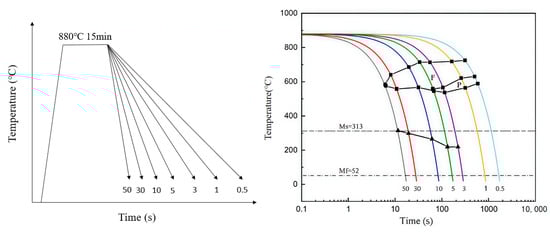
Figure 3.
Continuous transformation cooling curves of test steel (Steel 3#, 0.0166 wt.% N).
The martensite start temperature was identified as 313 °C and the martensite finish temperature as 52 °C. The microstructures obtained at different cooling rates are presented in Figure 4. At cooling rates of 0.5 and 1 °C/s, the microstructure consisted of ferrite and pearlite. Martensite began to form at 3 °C/s. At 3 and 5 °C/s, the structure comprised ferrite, pearlite, and martensite, while at higher rates (10, 30, and 50 °C/s) it consisted of ferrite and martensite. The volume fraction of martensite increased progressively with increasing cooling rate. Conversely, the ferrite grain size decreased from about 6 μm to 1.5 μm as the cooling rate increased. The pearlite interlamellar spacing also decreased with increasing cooling rate: 131 nm at 0.5 °C/s, 127 nm at 1 °C/s, 109 nm at 3 °C/s, and 88 nm at 5 °C/s.
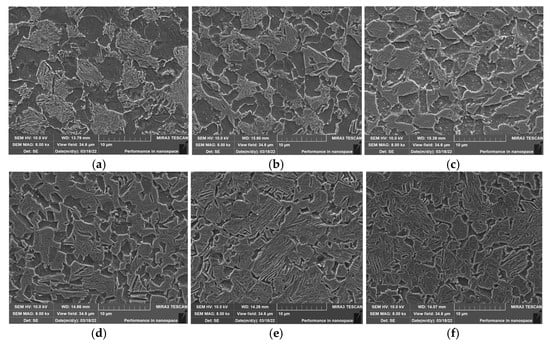
Figure 4.
Microstructure images of Steel 3# (0.0166 wt.% N) at different cooling rates. The cooling rates were (a) 0.5 °C/s, (b) 1 °C/s, (c) 5 °C/s, (d) 10 °C/s, (e) 30 °C/s and (f) 50 °C/s.
Figure 5 quantifies the phase fractions of ferrite, pearlite, and martensite at cooling rates of 0.5, 1, 3, and 5 °C/s. The ferrite volume fraction was consistently higher than that of pearlite across all cooling rates. With increasing cooling rate, the ferrite fraction first increased, peaking at about 75% at 1 °C/s, and then decreased to a minimum of approximately 35% at 5 °C/s. The pearlite fraction decreased continuously with increasing cooling rate, nearly disappearing at 5 °C/s, while the size of pearlite colonies decreased from about 5.5 μm to 2.4 μm. To ensure a combination of high strength and good ductility in the 700 MPa steel bars, the cooling rate during rolling should be controlled within an appropriate range, ideally between 1 and 3 °C/s, to obtain a fine-grained ferrite–pearlite microstructure at room temperature.
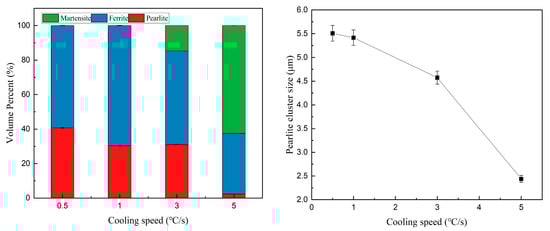
Figure 5.
Percentage of ferrite, pearlite and martensite content and pearlite cluster size in Steel 3# (0.0166 wt.% N) at different cooling rates.
3.3. Electron Backscatter Diffraction Images
Figure 6 presents the band contrast (BC) maps and inverse pole figure (IPF) maps of the test steels, with the scanning directions corresponding to the rolling direction (RD), transverse direction (TD), and normal direction (ND). EBSD analysis of the Kikuchi patterns revealed distinct crystallographic textures among the steels. The <101> orientation was more prevalent in Steels 1# (0.0280 wt.% N) and 2# (0.0049 wt.% N), whereas the <111> orientation was dominant in Steel 3# (0.0166 wt.% N). Grain size and distribution were quantified from the EBSD data using AZtecCrystal software. The average grain sizes for Steels 1# (0.0280 wt.% N), 2# (0.0049 wt.% N), and 3# (0.0166 wt.% N) were 2.800 μm, 3.277 μm, and 2.618 μm, with corresponding standard deviations of 1.005 μm, 1.086 μm, and 0.952 μm, respectively. Steel 3# (0.0166 wt.% N) exhibited the smallest mean grain size and the lowest standard deviation, indicating the finest and most uniform grain structure. In contrast, Steel 2# (0.0049 wt.% N) had the largest mean size and standard deviation, reflecting the coarsest and least uniform grains. Steel 1# (0.0280 wt.% N) displayed intermediate values for both parameters. Grain refinement is a critical mechanism for simultaneously improving strength and ductility. A finer grain structure increases the number of grains per unit volume, which promotes a more homogeneous strain distribution during deformation, mitigates localized strain concentration, and consequently reduces the propensity for crack initiation. This accounts for the superior elongation observed in Steel 3# (0.0166 wt.% N). Previous studies [28,29,30] have similarly reported that a decrease in grain size enhances uniform elongation. Therefore, the combination of fine, uniform grains and a favorable <111> crystallographic orientation in Steel 3# (0.0166 wt.% N) contributes to its higher yield strength and excellent ductility.
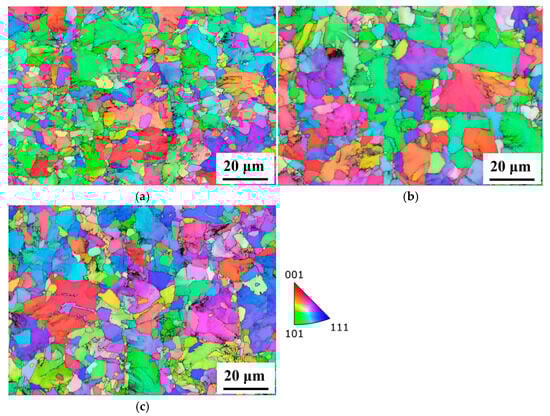
Figure 6.
Contrast diagrams and reverse pole diagrams of test steels. (a) Steel 1# (0.0280 wt.% N), (b) Steel 2# (0.0049 wt.% N), (c) Steel 3# (0.0166 wt.% N).
3.4. Precipitation Behavior of Vanadium in Ultra-High-Strength Steel Bars
Figure 7 shows TEM micrographs of the hot-rolled test steels. The microstructures of Steel 1# (0.0280 wt.% N) are displayed in Figure 7a,b, while Figure 7c presents the microstructures of Steels 2# (0.0049 wt.% N) and Figure 7d shows an annular dark-field (ADF) image of pearlite in the same steel. The microstructures of Steel 3# (0.0166 wt.% N) are shown in Figure 7e,f. The images reveal typical ferrite and pearlite constituents. The pearlite in Steels 1# (0.0280 wt.% N) and 3# (0.0166 wt.% N) exhibits relatively uniform interlamellar spacing, ranging from 125 to 200 nm, with discontinuous cementite lamellae. In contrast, the pearlite lamellae in Steel 2# (0.0049 wt.% N) are noticeably wider spaced, ranging from 150 to 250 nm. Steels 1# (0.0280 wt.% N) and 2# (0.0049 wt.% N) contain comparable vanadium levels (~0.16 wt.%), but differ significantly in nitrogen content: 0.0280 wt.% for Steel 1# (0.0280 wt.% N) versus 0.0049 wt.% for Steel 2%. This higher nitrogen content correlates with markedly improved mechanical properties in the hot-rolled condition. The low-nitrogen Steel 2# (0.0049 wt.% N) achieved yield strengths of 680.91 and 707.83 MPa and tensile strengths of 935.34 and 919.5 MPa. In comparison, the high-nitrogen Steel 1# (0.0280 wt.% N) exhibited higher yield strengths (761.56 and 774.21 MPa) and tensile strengths (971.13 and 968.09 MPa). These results indicate that the strength enhancement in Steel 1# (0.0280 wt.% N) is primarily attributed to grain refinement strengthening, which is specifically manifested by its narrow pearlite interlamellar spacing and smaller ferrite grain size, coupled with the solid-solution strengthening effect resulting from its high nitrogen content [31].
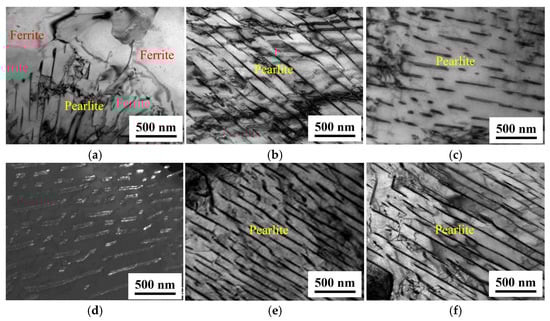
Figure 7.
Microstructures of the test steels under hot-rolling conditions. (a,b) Steel 1# (0.0280 wt.% N), (c,d) Steel 2# (0.0049 wt.% N), (e,f) Steel 3# (0.0166 wt.% N).
Figure 8 presents the morphology of vanadium-rich precipitates in the hot-rolled Steel 3# (0.0166 wt.% N). EDS analysis revealed that these precipitates are enriched in V, C, and N, but depleted in Mn, Fe, Si, P, and S. Based on this, the precipitates were identified as V(C,N), with a size range of approximately 9–42 nm.
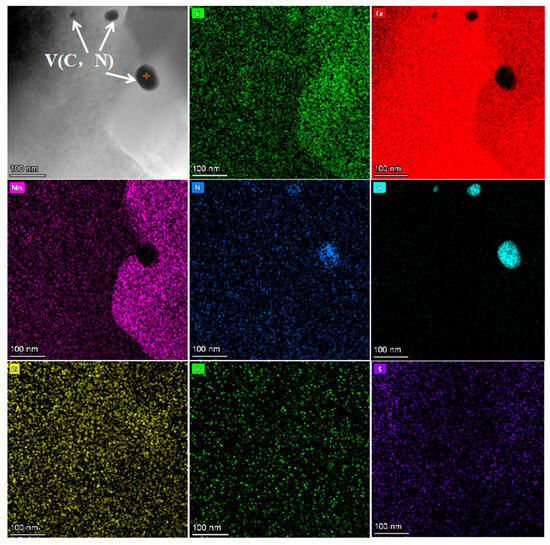
Figure 8.
Vanadium precipitation-phase morphology of test steel (Steel 3#, 0.0166 wt.% N).
It is evident that the effect of improving yield strength is significantly superior to that of tensile strength. The phase analysis results clearly indicate that nitrogen addition in the steel alters the distribution of vanadium between phases, facilitating the transition of vanadium from a solid-solution state to precipitation in the V(C,N) phase. Furthermore, this process increases the percentage of small precipitates with sizes below 49 nm. The increase in the quantity of dispersed V(C,N) precipitates is the main reason for the enhanced strength of vanadium–nitrogen steel. Many high-strength steels employ vanadium–nitrogen alloy for microalloy strengthening [32,33]. The carbon nitride vanadium precipitate can evenly distribute in the microstructure, thereby enhancing the comprehensive mechanical properties of the steel. Increasing the nitrogen content in the steel can optimize the precipitation of vanadium in the steel.
3.5. SSRT Test Results and Analysis
Figure 9a shows the stress–strain curves obtained from the SSRT tests for specimens with different nitrogen contents. The SCC susceptibility of the three specimens is detailed in Figure 9b. When tested in the corrosive environment, all three specimens exhibited a certain degree of reduction in both strength and plasticity. Among them, Steel 2# (0.0049 wt.% N) showed the highest stress corrosion susceptibility, indicating the poorest resistance to stress corrosion cracking. In contrast, Steel 3# (0.0166 wt.% N) demonstrated no significant loss in plasticity or strength, with a stress corrosion susceptibility Iδ of 12.51%, which is below the 15% threshold, reflecting its resistance to SCC. Furthermore, the SCC susceptibility of Steel 3# (0.0166 wt.% N) was significantly lower than that of Steels 1# (0.0280 wt.% N) and 2# (0.0049 wt.% N), indicating that Steel 3# (0.0166 wt.% N) possesses superior SCC resistance compared to Steel 1# (0.0280 wt.% N) and Steel 2# (0.0049 wt.% N). This improvement correlated with Steel 3# (0.0166 wt.% N) having the finest and most uniform grain structure (average grain size 2.618 μm), as grain refinement is generally known to enhance the corrosion resistance of materials. This indicates that microstructural modifications fundamentally govern the differences in mechanical properties and SCC resistance characteristics.
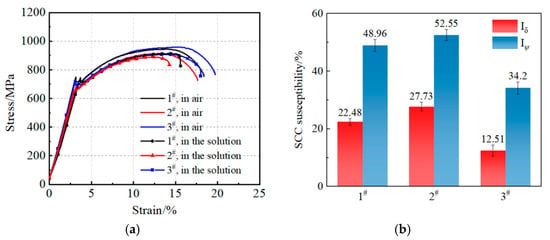
Figure 9.
Results of SSRT tests. (a) Stress–strain curves, (b) SCC susceptibility.
Figure 10 presents the fracture morphologies of the three steel specimens tested in both air and corrosive environments. When tested in air, necking was observable in all three specimens. Steels 3# (0.0166 wt.% N) and 1# (0.0280 wt.% N) exhibited numerous dimples and voids on their fracture surfaces, characteristic of ductile fracture. In contrast, Steel 2# (0.0049 wt.% N) displayed a mixture of river patterns and dimples, indicating a fracture mode combining quasi-cleavage and ductile features. Compared to the specimens tested in air, those tested in the corrosive environment showed a significant reduction in macroscopic necking, demonstrating a decrease in the ductility of steel. In the magnified view of Steel 2# (0.0049 wt.% N), distinct cracks and a reduced number of dimples were observed. The dimple size was further diminished, and the population of ductile features decreased markedly, indicating the highest stress corrosion susceptibility among the tested steels. Figure 11 shows the side-surface morphologies corresponding to the fracture surfaces of the three steel specimens. For specimens fractured in air, only sporadic pits and shallow cracks were observed on the side surfaces. However, specimens tensile-tested in the corrosive environment developed secondary cracks. Among these, Steel 2# (0.0049 wt.% N) exhibited distinct pits under a magnification of 50× (Figure 11e). It is noteworthy that the secondary cracks in Steel 2# (0.0049 wt.% N) were longer and deeper. In contrast, the secondary cracks in Steel 3# (0.0166 wt.% N) were narrower, more curved, and exhibited a more pronounced arc-like shape.
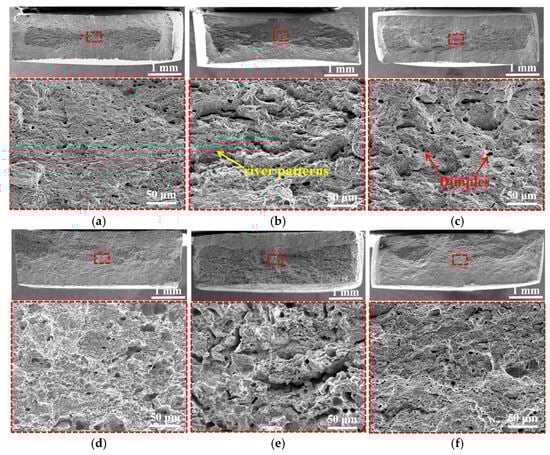
Figure 10.
Fracture fractography of the specimens after SSRT. (a–c) In air, (d–f) in the solution, (a,d) Steel 1# (0.0280 wt.% N), (b,e) Steel 2# (0.0049 wt.% N), and (c,f) Steel 3# (0.0166 wt.% N).
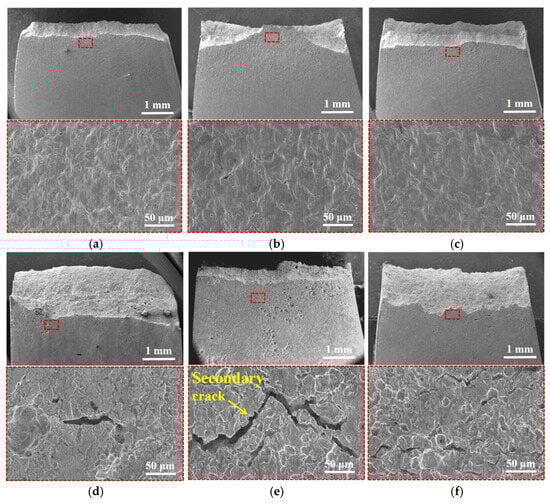
Figure 11.
Secondary cracks of the specimens after SSRT. (a–c) In air, (d–f) in the solution, (a,d) Steel 1# (0.0280 wt.% N), (b,e) Steel 2# (0.0049 wt.% N), and (c,f) Steel 3#(0.0166 wt.% N).
4. Discussion
This study confirms that nitrogen content significantly influences the grain size, phase composition, and precipitation behavior of steel. When the nitrogen content is 0.0166 wt.%, Steel 3# (0.0166 wt.% N) achieved the finest and most uniform grain structure (with an average grain size of approximately 2.618 μm) and a higher proportion of grains with a <111> orientation. Compared to Steel 2# (0.0049 wt.% N), its yield strength increased by about 40 MPa. According to the Hall–Petch relationship [34,35],
where , , and represent the contributions of grain refinement strengthening, the ferrite phase, and the pearlite phase to the yield strength, respectively; is the average grain size of ferrite; is the interlamellar spacing of pearlite; and is the volume fraction of ferrite.
As can be seen from Figure 2 and Figure 7, the addition of N led to a reduction in grain size, a largely unchanged ferrite volume fraction, and a refinement of the pearlite interlamellar spacing. Therefore, according to Equations (3)–(5), under the condition of minimal change in the ferrite volume fraction, the refinement of the pearlite interlamellar spacing and the reduction in ferrite grain size resulted in an increase in the yield strength of Steels 3# (0.0166 wt.% N) and 2# (0.0049 wt.% N). Simultaneously, grain refinement hinders the initiation and propagation of cracks, thereby enhancing the elongation and achieving a favorable balance between strength and plasticity. In contrast, when the nitrogen content is too low (0.0049 wt.%, Steel 2#), grain coarsening and insufficient V(C,N) precipitation lead to lower strength and plasticity. When the nitrogen content is excessively high (0.0280 wt.%, Steel 1#), intensified dislocation pinning by excess solute nitrogen may cause a further increase in strength but a decrease in plasticity and toughness. This indicates that precise control of nitrogen content enables the synergistic optimization of “grain refinement strengthening” and “precipitation strengthening,” which is key to obtaining high-performance steel reinforcement.
Meanwhile, the finest grain structure in Steel 3# (0.0166 wt.% N) provides the highest grain boundary density. Grain boundaries can act as barriers to the diffusion of corrosive media and obstacles to crack propagation, forcing the crack path to become tortuous and consume more energy, thereby significantly retarding the initiation and propagation of SCC cracks. This is directly evidenced by Steel 3# (0.0166 wt.% N)’s lowest elongation loss rate (Iδ = 12.51%) and the morphology of shorter, more curved secondary cracks on the fracture side surface. Secondly, the appropriate nitrogen content promotes a uniform and dispersed distribution of nano-sized V(C,N) precipitates. These precipitates enhance the steel’s SCC resistance by pinning grain boundaries, thereby hindering crack propagation. Finally, extensive research [36,37,38] has shown that grains with a <111> orientation can accumulate significant plastic deformation and rotate along the direction of the principal shear stress, thereby reducing the driving force for crack propagation and enhancing resistance to SCC.
5. Conclusions
In this study, V–N microalloying design combined with controlled rolling and controlled cooling processes was employed to successfully fabricate 700 MPa grade ultra-high-strength steel bars. By adjusting the nitrogen content (0.0049, 0.0166, and 0.0280 wt.%, respectively), the influence of nitrogen on microstructural evolution, mechanical properties, and SCC behavior was systematically investigated, leading to a significant improvement in the comprehensive performance of the steel bars. The main conclusions are as follows:
- When the V/N ratio is approximately 1:10 and the post-rolling cooling rate is controlled within 1–3 °C/s, a microstructure dominated by fine-grained ferrite and pearlite can be obtained, with a yield strength exceeding 700 MPa and optimal overall mechanical properties.
- The high-strength steel bar 3# (0.0166 wt.% N) exhibited the lowest SCC susceptibility (Iδ = 12.51%) in a simulated near-shore concrete corrosion environment. Its fracture surface showed distinct dimple features, and secondary cracks were short and tortuous, demonstrating excellent resistance to SCC.
- The steel with a nitrogen content of 0.0166 wt.% possessed the finest and most uniform grain structure (average grain size ≈ 2.618 μm) and a higher proportion of grains with <111> orientation. Grain refinement not only significantly enhanced the strength and plasticity of the material but also effectively hindered the propagation of stress corrosion cracks by increasing grain boundary density, thereby improving SCC resistance.
- An appropriate nitrogen content (0.0166 wt.%) promoted the uniform and dispersed distribution of nano-sized V(C,N) precipitates. The strengthening effect of these precipitates increased the yield strength and tensile strength by 32.75 to 51.63 MPa. Meanwhile, the fine precipitates correlated with improved SCC resistance by pinning dislocations and grain boundaries. However, excessively high nitrogen content was found to reduce both the plasticity and SCC resistance of the steel.
Author Contributions
Methodology, investigation, data curation, writing—original draft preparation, X.Z. (Xiaomin Zhao); Methodology, investigation, data curation, writing—original draft preparation, Z.W.; Supervision, resources, writing—review and editing, X.W.; Data curation, formal analysis, X.L.; Data curation, formal analysis, X.Z. (Xiaochen Zhang); Project administration, writing—review and editing, X.C.; Conceptualization, supervision, project administration, writing—review and editing, funding acquisition, C.L. All authors have read and agreed to the published version of the manuscript.
Funding
This research was funded by the National Natural Science Foundation of China, grant nos. U21A20113, 52522409 and 52374323.
Data Availability Statement
The original contributions presented in this study are included in the article. Further inquiries can be directed to the corresponding author.
Conflicts of Interest
Authors Xiaomin Zhao, Xuedong Li and Xiaochen Zhang were employed by the company Inner Mongolia Baotou Steel Union Co., Ltd. The remaining authors declare that the research was conducted in the absence of any commercial or financial relationships that could be construed as a potential conflict of interest.
References
- Stepanov, A.; Koldaev, A.; Arutyunyan, N.; Zaitsev, A. Evolution of the Structural State and Properties of 32CrB4 Steel during the Production of High-Strength Fasteners. Metals 2022, 12, 366. [Google Scholar] [CrossRef]
- Zhao, J.; Wang, J.; Li, X.; Shen, F.; Zhao, T. Flexural behavior of steel fiber reinforced concrete beams with HRB600 reinforcement after elevated temperatures: Experimental and analytical investigations. Constr. Build. Mater. 2025, 492, 142858. [Google Scholar] [CrossRef]
- Xiao, Z.; Wei, H.; Wu, T.; Ren, W.; Li, X. Flexural behavior and serviceability of steel fiber-reinforced lightweight aggregate concrete beams reinforced with high-strength steel bars. Constr. Build. Mater. 2024, 437, 136977. [Google Scholar] [CrossRef]
- Chen, W.; Gao, P.; Wang, S.; Zhao, X.; Zhao, Z. Strengthening mechanisms of Nb and V microalloying high strength hot-stamped steel. Mater. Sci. Eng. A 2020, 797, 140115. [Google Scholar] [CrossRef]
- Zhang, S.-J.; Wang, Q.-Y.; Guan, H.; Zou, G.-N.; Wang, G.-W.; Zhang, S.-G.; Song, D. Chloride-induced macro-cell corrosion behavior of a novel alloyed-steel rebar and its inhibition strategy. J. Iron Steel Res. Int. 2025, 32, 2995–3013. [Google Scholar] [CrossRef]
- Hao, L.; Cai, X.; Chen, T.; Zhang, C.; Liu, C.; Cheng, X.; Li, X. Corrosion behavior of 650 MPa high strength low alloy steel in industrial polluted environments containing different concentrations of Cl−. Int. J. Miner. Metall. Mater. 2026, 33, 228–241. [Google Scholar] [CrossRef]
- Wang, H.-k.; Deng, L.; Zhang, Y.; Yu, Y.; Gao, J. A comprehensive review on erosion–corrosion characteristics of steel subjected to tensile stress. J. Iron Steel Res. Int. 2025, 32, 1781–1802. [Google Scholar] [CrossRef]
- He, Z.; Zhao, Y.; Fu, J.; Chen, F.; Chen, G.; Qin, Y. Effect of Alternating Magnetic Field on the Organization and Corrosion Resistance of 2205 Duplex Stainless Steel Narrow-Gap Laser-MIG Hybrid Weld Head. Coatings 2023, 13, 2000. [Google Scholar] [CrossRef]
- Xia, Y.; Zhou, D.; Xia, D.-H.; Gao, Z.; Bai, L.; Hu, W. The relationship between microstructural characteristics and galvanic effect, SCC behavior of friction stir welded joint in as-welded and heat-treated conditions. J. Mater. Sci. Technol. 2025, 223, 186–207. [Google Scholar] [CrossRef]
- Wang, X.; Liang, X.; Tong, S.; Sun, X. Influence of tempering temperature on microstructure and stress corrosion crack (SCC) behavior of a new high strength round-link chain steel. Corros. Sci. 2025, 246, 112770. [Google Scholar] [CrossRef]
- Li, X.; Guo, Z.; Rong, Y.; Wu, H.; Yao, S. Research on 600MPa grade high strength plastic thread steel based on yield platform theory. Acta Metall. Sin. 2014, 50, 439–446. [Google Scholar]
- Wang, Y.; Zhu, G.; Chen, Q.; Ding, H.; Wan, D. A Review on the Plastic Behavior and Improvement of Plasticity in High Strength Ultrafine-grained Metallic Materials. Mater. Rev. 2018, 32, 3414–3422. [Google Scholar]
- Fujita, H.; Miyazaki, S. Lüders deformation in polycrystalline iron. Acta Metall. 1978, 26, 1273–1281. [Google Scholar] [CrossRef]
- Schulson, E.M.; Weihs, T.P.; Viens, D.V.; Baker, I. The effect of grain size on the yield strength of Ni3Al. Acta Metall. 1985, 33, 1587–1591. [Google Scholar] [CrossRef]
- Li, C.; Li, K.; Dong, J.; Ren, J.; Song, Y. The Effect of Aging on Precipitates, Mechanical and Magnetic Properties of Fe-21Cr-15Ni-6Mn-Nb Low Magnetic Stainless Steel. Metals 2021, 11, 819. [Google Scholar]
- Li, Y.; Li, J.; Zhang, D.; Pang, Q. Optimization of Mechanical Properties of High-Manganese Steel for LNG Storage Tanks: A Comprehensive Review of Alloying Element Effects. Metals 2024, 14, 677. [Google Scholar] [CrossRef]
- Zhang, R.; Yuan, Q.; Tang, E.; Mo, J.; Zhang, Z.; Hu, H.; Xu, G. Role of Precipitates on the Grain Coarsening of 20CrMnTi Gear Steel during Pseudo-Carburizing. Metals 2023, 13, 1422. [Google Scholar] [CrossRef]
- Sun, B.M.; Ji, H.Z.; Yang, C.F.; Zhang, Y.Q. Precipitation behavior of vanadium in V-N microalloyed steel. Iron Steel 2001, 36, 44–47. [Google Scholar]
- Chatterjee, S.; Rout, B.K. A Comprehensive Review of Nitrogen Control in the Current and Future Green Steelmaking Operations. Metall. Mater. Trans. B 2025, 56, 6093–6117. [Google Scholar] [CrossRef]
- Liao, J.; Song, J.; Yang, Y. The Effect of N Content on the Microstructure and Wear Resistance of Improved High-Carbon Chromium Bearing Steel. Int. J. Met. 2025, 19, 1961–1973. [Google Scholar] [CrossRef]
- Song, Z.; Lv, J.; Zhao, L.; Feng, H.; He, J.; Wu, X.; Zhang, G.; Feng, Y. Microstructural evolution and transformation-induced toughness effect in 316L austenitic stainless steels with varying nitrogen content under cryogenic impact conditions. J. Mater. Res. Technol. 2026, 40, 1694–1706. [Google Scholar] [CrossRef]
- Habib, K.; Koyama, M.; Tsuchiyama, T.; Noguchi, H. Fatigue crack non-propagation assisted by nitrogen-enhanced dislocation planarity in austenitic stainless steels. Int. J. Fatigue 2017, 104, 158–170. [Google Scholar] [CrossRef]
- Koyama, M.; Habib, K.; Masumura, T.; Tsuchiyama, T.; Noguchi, H. Gaseous hydrogen embrittlement of a Ni-free austenitic stainless steel containing 1 mass% nitrogen: Effects of nitrogen-enhanced dislocation planarity. Int. J. Hydrogen Energy 2020, 45, 10209–10218. [Google Scholar] [CrossRef]
- Gladman, T. Precipitation hardening in metals. Mater. Sci. Technol. 1999, 15, 30–36. [Google Scholar] [CrossRef]
- GB/T 228; Metallic Materials—Tensile Testing. Standards Press of China: Beijing, China, 2021.
- GB/T 15970; Corrosion of Metals and Alloys—Stress Corrosion Testing. Standards Press of China: Beijing, China, 2019.
- Liu, Y.; Wu, H.; Ma, H.; Chen, X.; Huo, X.; Du, L. Role of V and N Addition on the Microstructure and Mechanical Properties of Q690 MPa Medium and Heavy Plates Produced by Thermomechanically Controlled Processing. Steel Res. Int. 2025, 96, 225–237. [Google Scholar] [CrossRef]
- Baker, T.N. Processes, microstructure and properties of vanadium microalloyed steels. Mater. Sci. Technol. 2009, 25, 1083–1107. [Google Scholar] [CrossRef]
- Liu, L.; Li, Y.; Zhang, H.; Cheng, X.; Fan, Q.; Mu, X.; Guo, S. Good strength-plasticity compatibility in graphene nanoplatelets/Ti composites by strengthening the interface bonding via in-situ formed TiB whisker. Ceram. Int. 2021, 47, 4338–4343. [Google Scholar] [CrossRef]
- Zhao, Z.; Wang, K.; Li, M.; Wang, H.; Zhang, X.; Shen, L.; Wang, L.; Zheng, L.; Song, L.; Dong, H. Simultaneous enhancement of strength and plasticity in extruded Mg-4Gd-0.5Zr alloys: Tailoring grain size and precipitated phases via Nd and Y addition. J. Mater. Res. Technol. 2025, 39, 2502–2517. [Google Scholar] [CrossRef]
- Lagneborg, R.; Siwecki, T.; Zając, S.; Hutchinson, B. The Role of Vanadium in Microalloyed Steels. Scand. J. Metall. 1999, 28, 186–241. [Google Scholar]
- Singh, A.P.; Pant, G. Mechanical behaviour of vanadium microalloyed steel under control environment compression. Mater. Today Proc. 2020, 26, 2525–2527. [Google Scholar] [CrossRef]
- Qingchun, L.; Lin, W.; Zhiwang, Z. Vanadium precipitation behavior and aging properties of high strength hot rolled weathering steel. Iron Steel Vanadium Titan. 2019, 40, 144–148+155. [Google Scholar]
- Chen, W.; Cao, J.; Yang, Y.; Shi, Z.; Zhang, W.; Huang, M. Investigation on the Strengthening and Toughening Mechanism of 500 MPa V-Nb Microalloyed Anti-Seismic Rebars. Medžiagotyra 2015, 21, 536–542. [Google Scholar] [CrossRef]
- Jin, Z.-Z.; Zha, M.; Yu, Z.-Y.; Ma, P.-K.; Li, Y.-K.; Liu, J.-M.; Jia, H.-L.; Wang, H.-Y. Exploring the Hall-Petch relation and strengthening mechanism of bimodal-grained Mg–Al–Zn alloys. J. Alloys Compd. 2020, 833, 155004. [Google Scholar] [CrossRef]
- Suikkanen, P.P.; Cayron, C.; DeArdo, A.J.; Karjalainen, L.P. Crystallographic Analysis of Martensite in 0.2C-2.0Mn-1.5Si-0.6Cr Steel using EBSD. J. Mater. Sci. Technol. 2011, 27, 920–930. [Google Scholar] [CrossRef]
- Masoumi, M.; Silva, C.C.; de Abreu, H.F.G. Effect of crystallographic orientations on the hydrogen-induced cracking resistance improvement of API 5L X70 pipeline steel under various thermomechanical processing. Corros. Sci. 2016, 111, 121–131. [Google Scholar] [CrossRef]
- Venegas, V.; Caleyo, F.; Baudin, T.; Espina-Hernández, J.H.; Hallen, J.M. On the role of crystallographic texture in mitigating hydrogen-induced cracking in pipeline steels. Corros. Sci. 2011, 53, 4204–4212. [Google Scholar] [CrossRef]


Disclaimer/Publisher’s Note: The statements, opinions and data contained in all publications are solely those of the individual author(s) and contributor(s) and not of MDPI and/or the editor(s). MDPI and/or the editor(s) disclaim responsibility for any injury to people or property resulting from any ideas, methods, instructions or products referred to in the content. |
© 2026 by the authors. Licensee MDPI, Basel, Switzerland. This article is an open access article distributed under the terms and conditions of the Creative Commons Attribution (CC BY) license.