Article

Optimization of Hot Stamping Parameters for Aluminum Alloy Crash Beams Using Neural Networks and Genetic Algorithms

Key Laboratory of Automobile Materials, Ministry of Education and School of Material Science and Engineering, Jilin University, 5988 Renmin Street, Changchun 130022, China
*
Author to whom correspondence should be addressed.
Metals 2025, 15(9), 1047; https://doi.org/10.3390/met15091047
Submission received: 26 August 2025 / Revised: 17 September 2025 / Accepted: 18 September 2025 / Published: 19 September 2025
(This article belongs to the Special Issue Forming and Processing Technologies of Lightweight Metal Materials)

Abstract

The hot stamping process of aluminum alloys involves multiple parameters, including blank holder force, stamping speed, die temperature, and friction coefficient. Traditional methods often fail to capture the nonlinear interactions among these parameters. This study proposes an optimization framework that integrates BP neural networks with genetic algorithms (GA), while six bio-inspired algorithms—Grey Wolf Optimization (GWO), Sparrow Search Algorithm (SSA), Crested Porcupine Optimizer (CPO), Grey lag Goose Optimization (GOOSE), Dung Beetle Optimizer (DBO), and Parrot Optimizer (PO)—were employed to optimize the network hyperparameters. Comparative results show that all optimized models outperformed the baseline BP model (R2 = 0.702, RMSE = 0.106, MAPE = 20.8%). The PO-BP achieved the best performance, raising R2 by 27.3% and reducing MAPE by 27.1%. Furthermore, combining GA with the PO-BP model yielded optimized process parameters, reducing the maximum thinning rate to 17.0% with only a 1.16% error compared with experiments. Overall, the proposed framework significantly improves prediction accuracy and forming quality, offering an efficient solution for rapid process optimization in intelligent manufacturing of aluminum alloy automotive parts.

Graphical Abstract

1. Introduction

The rapid development of the automotive industry has enhanced mobility and driven economic growth and employment, but it has also exacerbated environmental pollution and energy challenges [1]. To reduce the environmental pollution caused by automobile emissions, automotive manufacturers have invested significant resources in lightweight vehicle research [2,3,4]. Currently, replacing traditional steel with lightweight materials is a key approach to achieving vehicle lightweighting [5]. Aluminum alloys, with advantages such as low density, high specific strength and stiffness, good impact resistance, high corrosion resistance, and recyclability, are considered the most promising material for automotive lightweighting due to their relatively low cost [6,7]. However, aluminum alloys have a lower plastic strain ratio (r-value) compared to steel, leading to poor formability at room temperature, making it difficult to form complex components [8]. To address these forming challenges, extensive research and application of warm and hot forming techniques have been conducted to improve the formability of aluminum alloys [9]. The recently proposed hot stamping process for aluminum alloys effectively enhances the formability and can be used to produce the complex components [10]. The hot stamping process is a highly coupled nonlinear deformation process involving the interaction of stress, temperature, and phase transformation fields. The forming quality is influenced by various process parameters, such as blank holder force, heating temperature, stamping speed, and friction coefficient [11]. Therefore, optimizing these parameters to improve the quality of formed parts has become one of the core issues in current research. Compared to traditional optimization methods, neural networks offer higher accuracy, faster response, greater flexibility, and cost-effectiveness, demonstrating significant advantages in complex and dynamic stamping processes [12]. They also provide strong technical support for the intelligent and efficient development of stamping forming [13].
Quan et al. [14] developed a material model for 7075 aluminum alloy under deformation temperatures of 573–723 K and strain rates of 0.01–1 s−1 using artificial neural networks (ANN), achieving high prediction accuracy. Kedar et al. [15] used neural networks to simulate the stress, strain rate, and temperature-dependent plasticity and fracture responses of 7075 aluminum alloy during hot forming, showing that the model effectively describes the alloy’s deformation behavior. Zheng et al. [16] proposed a rolling force prediction method combining improved particle swarm optimization (PSO) with BP neural networks, developing four models (BP, PSO-BP, LPSO-BP, MPSO-BP) in MATLAB (2019 version) and using production data for experiments. Xiao et al. [17] combined Monte Carlo simulation to study the impact of varying parameters like blank holder force, friction coefficient, stamping speed, and sheet temperature on formability, and optimized them using the NSGA-II multi-objective genetic algorithm, significantly improving aluminum alloys forming quality. Li et al. [18] optimized key process variables, such as blank temperature, stamping speed, and die gap, in hot stamping using BP neural networks and a multi-objective genetic algorithm. While BP neural networks are effective at modeling the complex relationships between process parameters and forming performance, they are prone to local optima and depend heavily on initial weights and thresholds, which can lead to slow convergence and overfitting, limiting their use in complex process optimization [19]. Artificial neural networks (ANN), especially BP neural networks, have been effectively applied to capture nonlinear process–performance relationships in aluminum alloys. For instance, Singh et al. [20] validated an ANN model in the machining of Al7075 alloy using the EDM process, demonstrating reliable predictive performance. Inspired by these studies, the present work employs a BP neural network combined with metaheuristic optimization to model the thinning behavior in hot stamping.
Optimization methods are pivotal in solving complex problems. Common techniques in the literature, such as Genetic Algorithm (GA), Particle Swarm Optimization (PSO), Simulated Annealing (SA), and Ant Colony Optimization (ACO), have demonstrated effectiveness but also exhibit limitations. GA, while powerful in global search, is computationally expensive and prone to local optima; PSO is simple but often suffers from premature convergence in high-dimensional spaces; SA avoids local optima but converges slowly and is sensitive to initial conditions; ACO, although effective in path planning, struggles with high computational complexity and slow convergence in large search spaces. Recently, advanced optimization algorithms like the Shine Cosine algorithm, Sunflower algorithm, and Jaya algorithm have shown improved performance. The Shine Cosine algorithm enhances global search through sinusoidal oscillations, the Sunflower algorithm avoids local optima by mimicking sunflower growth, and Jaya algorithm offers fast convergence through a simple guiding mechanism, excelling in multi-objective optimization. Compared to traditional methods, these advanced algorithms perform better in complex, high-dimensional, and multi-objective problems. Traditional decision-making methods such as Grey Relational Analysis (GRA), TOPSIS, Weighted Principal Component Analysis (WPCA), COPRAS, and MOORA are effective in multi-attribute decision-making but face challenges in accuracy and applicability when addressing non-linear, multi-modal, and complex optimization problems. Thus, the methods used in this study demonstrate superior efficiency and adaptability, yielding more precise results and enhancing the robustness of the findings.
This study uses BP neural networks to establish a nonlinear relationship between blank holder force, heating temperature, forming speed, friction coefficient, and maximum thinning rate. By combining BP neural networks with genetic optimization algorithms, the aim is to optimize hot stamping process parameters to enhance the quality and efficiency of aluminum alloys hot stamping. In order to overcome the problems that traditional BP neural networks are prone to fall into local optimal solutions, improperly set initial weights and slow convergence speed that may occur during the training process, and to improve the prediction accuracy and generalization ability of the model, six optimization algorithms-Grey Wolf Optimization (GWO), Sparrow Search Algorithm (SSA), Crested Porcupine Optimizer (CPO), Greylag Goose Optimization (Goose), Dung Beetle Optimizer (DBO), and Parrot Optimizer (PO)-were applied to optimize the BP network’s hyperparameters, enhancing overall efficiency and accuracy.

2. Finite Element Model of Crash Beam Hot Stamping

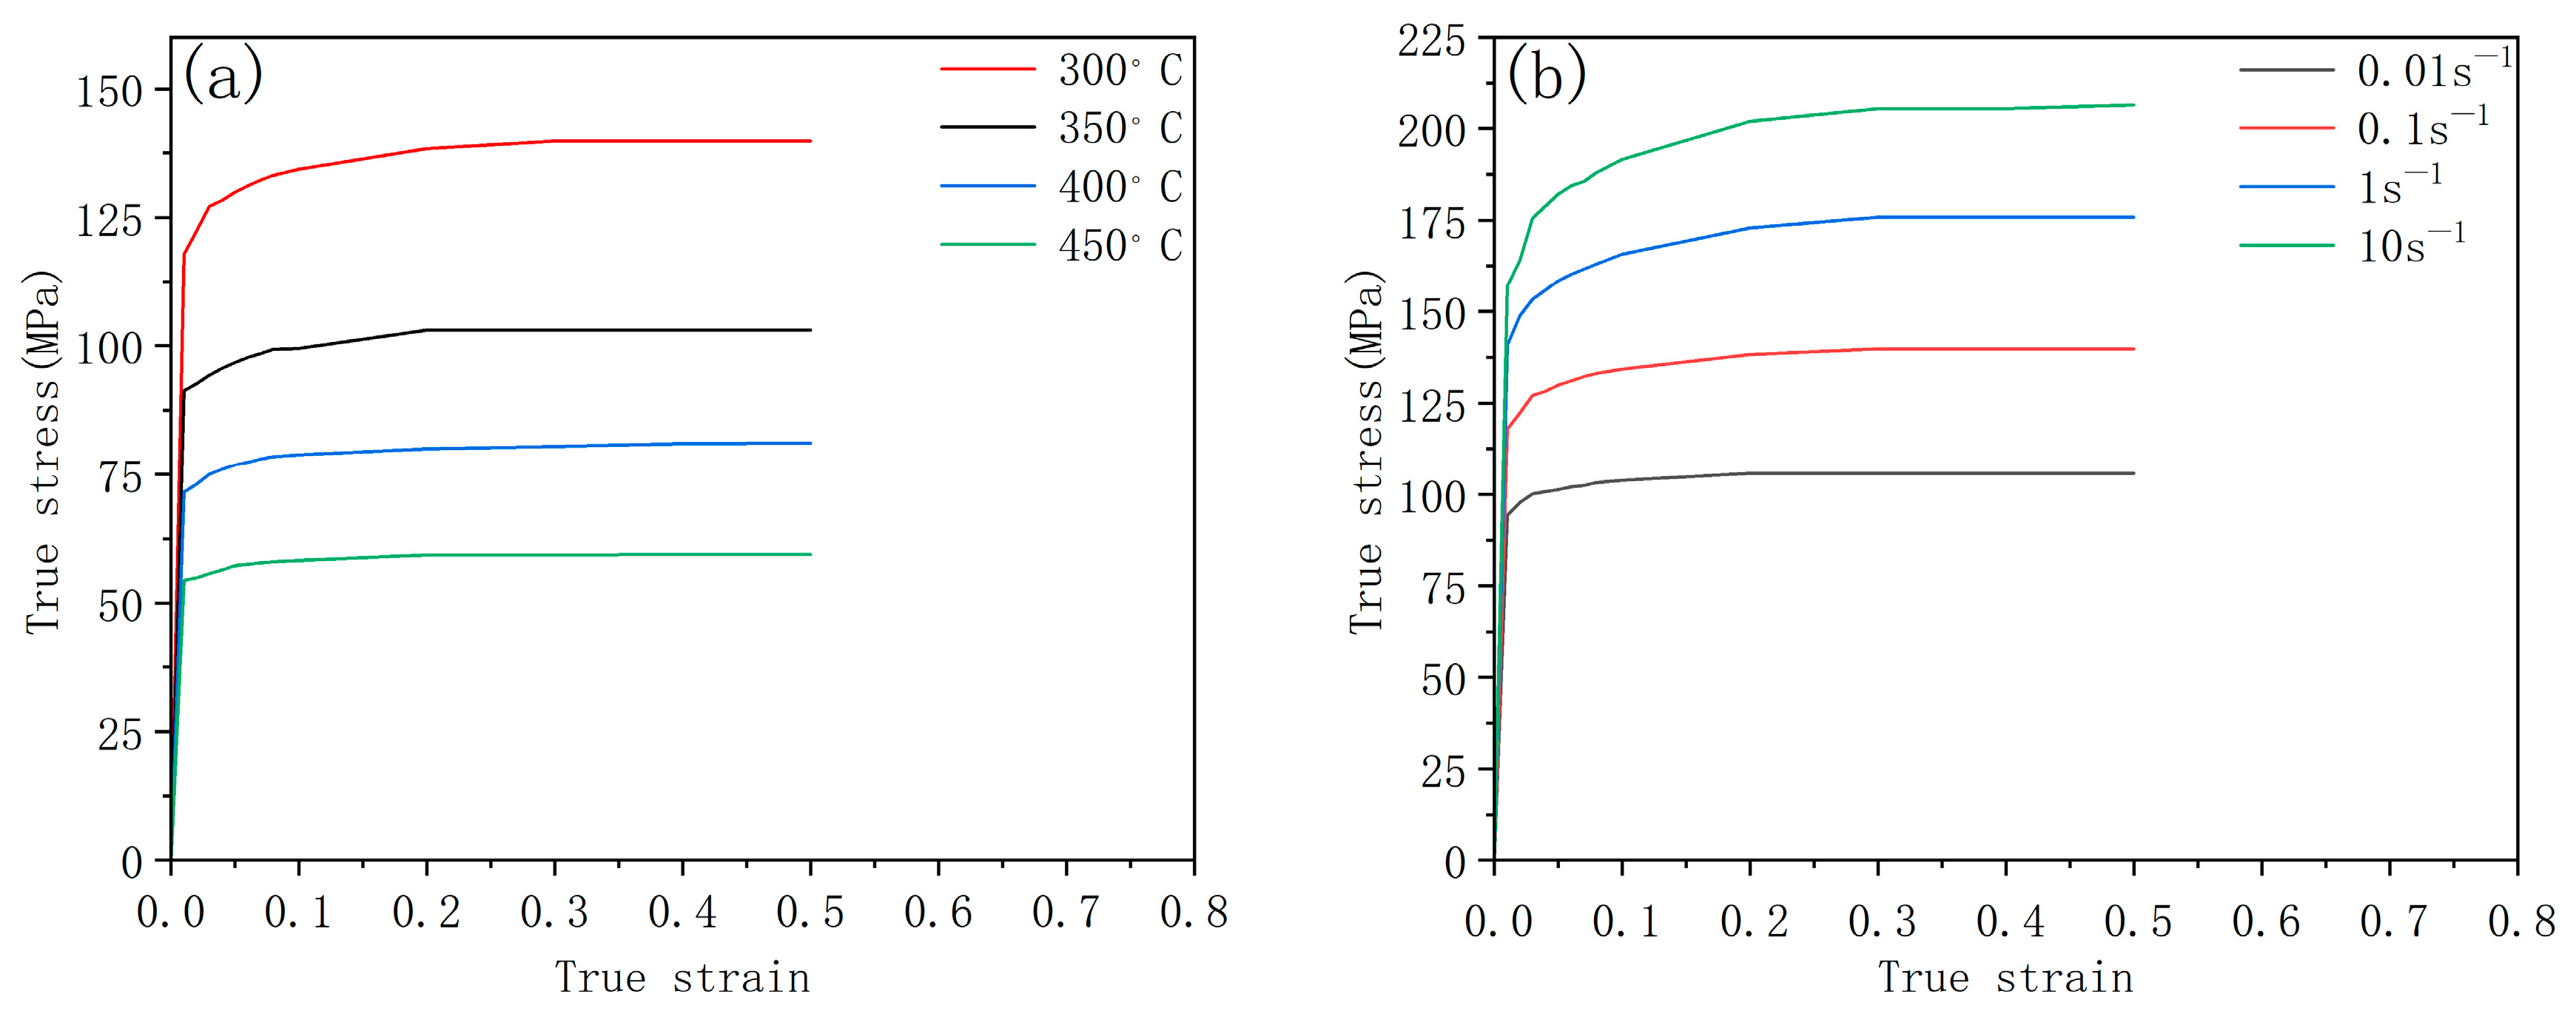
The model of the crash beam is shown in Figure 1. The material is a 7075-T6 aluminum alloy sheet with a thickness of 2 mm, and the chemical composition of the 7075-T6 aluminum alloy, measured in our laboratory using optical emission spectroscopy (OES) (MICHEM Technology LTD., Beijing, China), is listed in Table 1. The true stress–strain curves at different temperatures and strain rates are shown in Figure 2. As temperature increases, the aluminum alloy’s flow stress decreases, plasticity improves, and flowability enhances. However, higher strain rates increase flow stress, limiting deformation capacity.
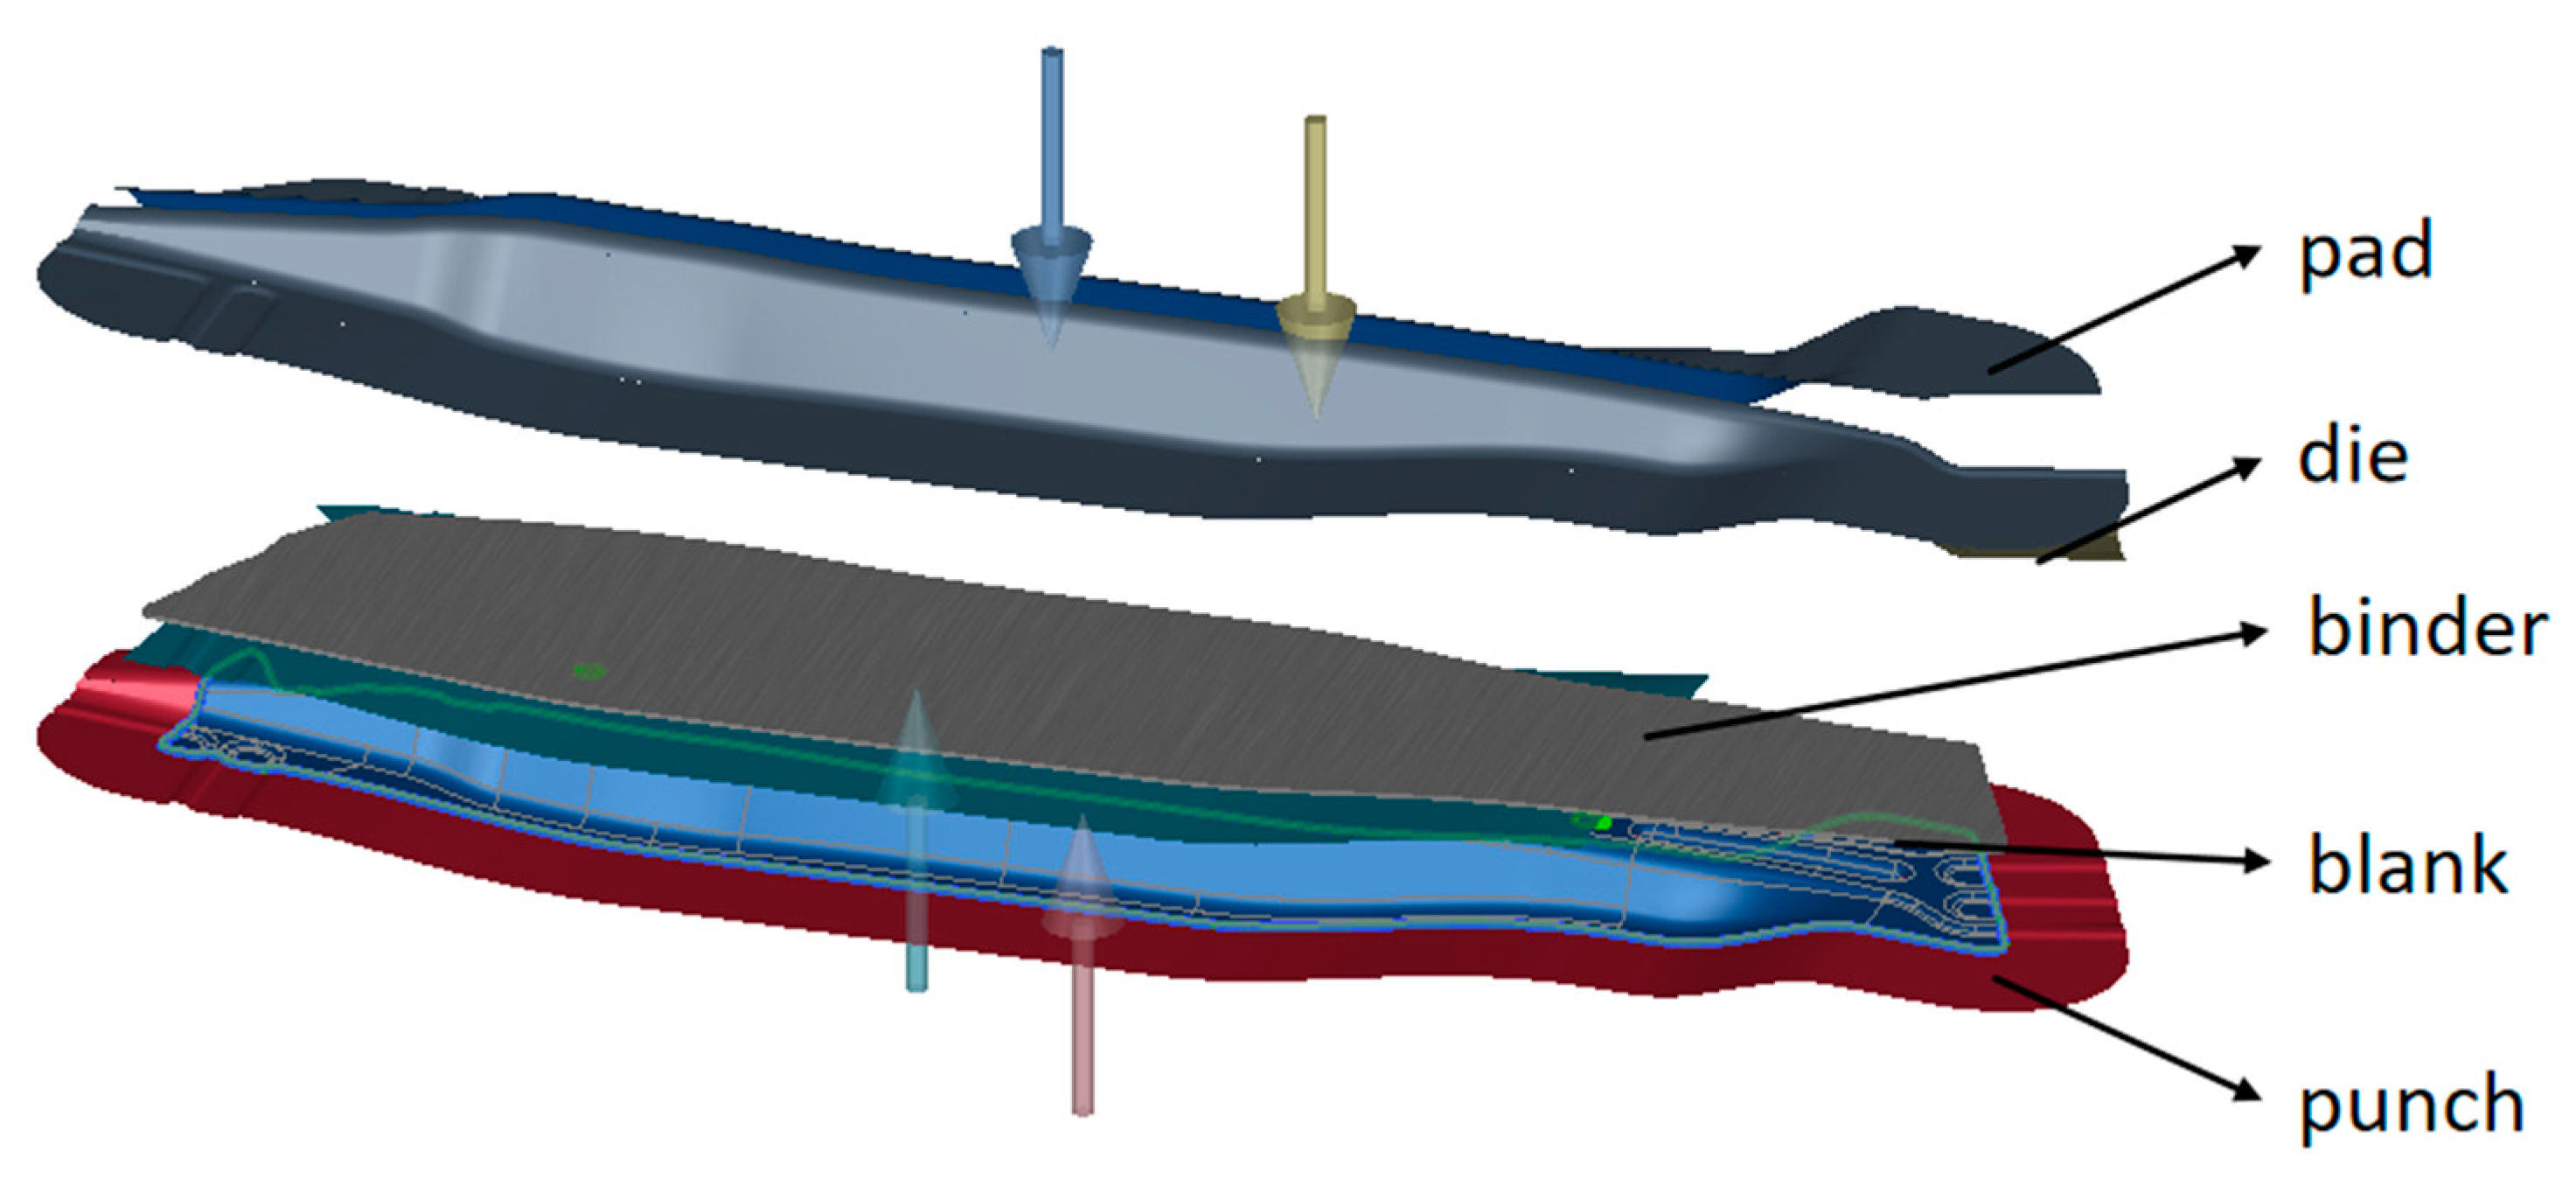
The hot stamping process simulation of the crash beam was performed using AutoForm software (version R8). The blank mesh was shell element, with a maximum element size of 20 mm and a minimum size of 5 mm. The hot stamping tools for the crash beam includes the punch, die, binder, and pad. Because the deformation of the tools during the hot stamping process is negligible compared to that of the blank, the tools were set as rigid bodies [21]. The initial tools setup is shown in Figure 3.

3. Development of BP Neural Network Prediction Model

3.1. Data Acquisition and Preprocessing

Latin Hypercube Sampling (LHS) is a statistical random sampling method for sampling uniformly and efficiently from a multi-dimensional parameter space, ensuring that the range of values of each variable is uniformly covered [22]. It explores the parameter space more efficiently than traditional Monte Carlo methods [23]. The blank holder force, stamping speed, friction coefficient, and sheet temperature were selected as optimization parameters. The maximum thinning rate of the material was selected as an index to reflect the forming quality of the part. Higher blank holder force restricts material flow and increases thinning, while excessively low blank holder force may cause wrinkling and reduce part quality. Therefore, the blank holder force must be carefully adjusted within a reasonable range to effectively control material thinning while avoiding wrinkling. Higher heating temperatures enhance material plasticity, promoting the formability; however, excessive temperatures can reduce strain hardening capacity, increasing the risk of local rupture. Low stamping speeds may lead to greater heat loss, limiting material flow and raising the likelihood of part failure. An increase in the friction coefficient raises frictional resistance, hinders material flow, and negatively impacts forming quality. Based on the analysis and production conditions, the optimized parameter ranges are blank holder force from 0 to 300 kN, heating temperature from 300 °C to 450 °C, stamping speed from 20 mm/s to 500 mm/s, and friction coefficient from 0.1 to 0.4. Forming quality is assessed by maximum thinning rate. When the maximum thinning rate is more than 20%, the material is considered to be ruptured. A total of 100 sample data were generated using LHS. 100 simulations were conducted using each set of process parameters, and the dataset is presented in Table 2. The dataset was split into training sets and testing sets at a ratio of 8:2. Both sets were then normalized to the [0, 1] range to prepare for subsequent model training and prediction.

3.2. Development and Training of BP Prediction Model

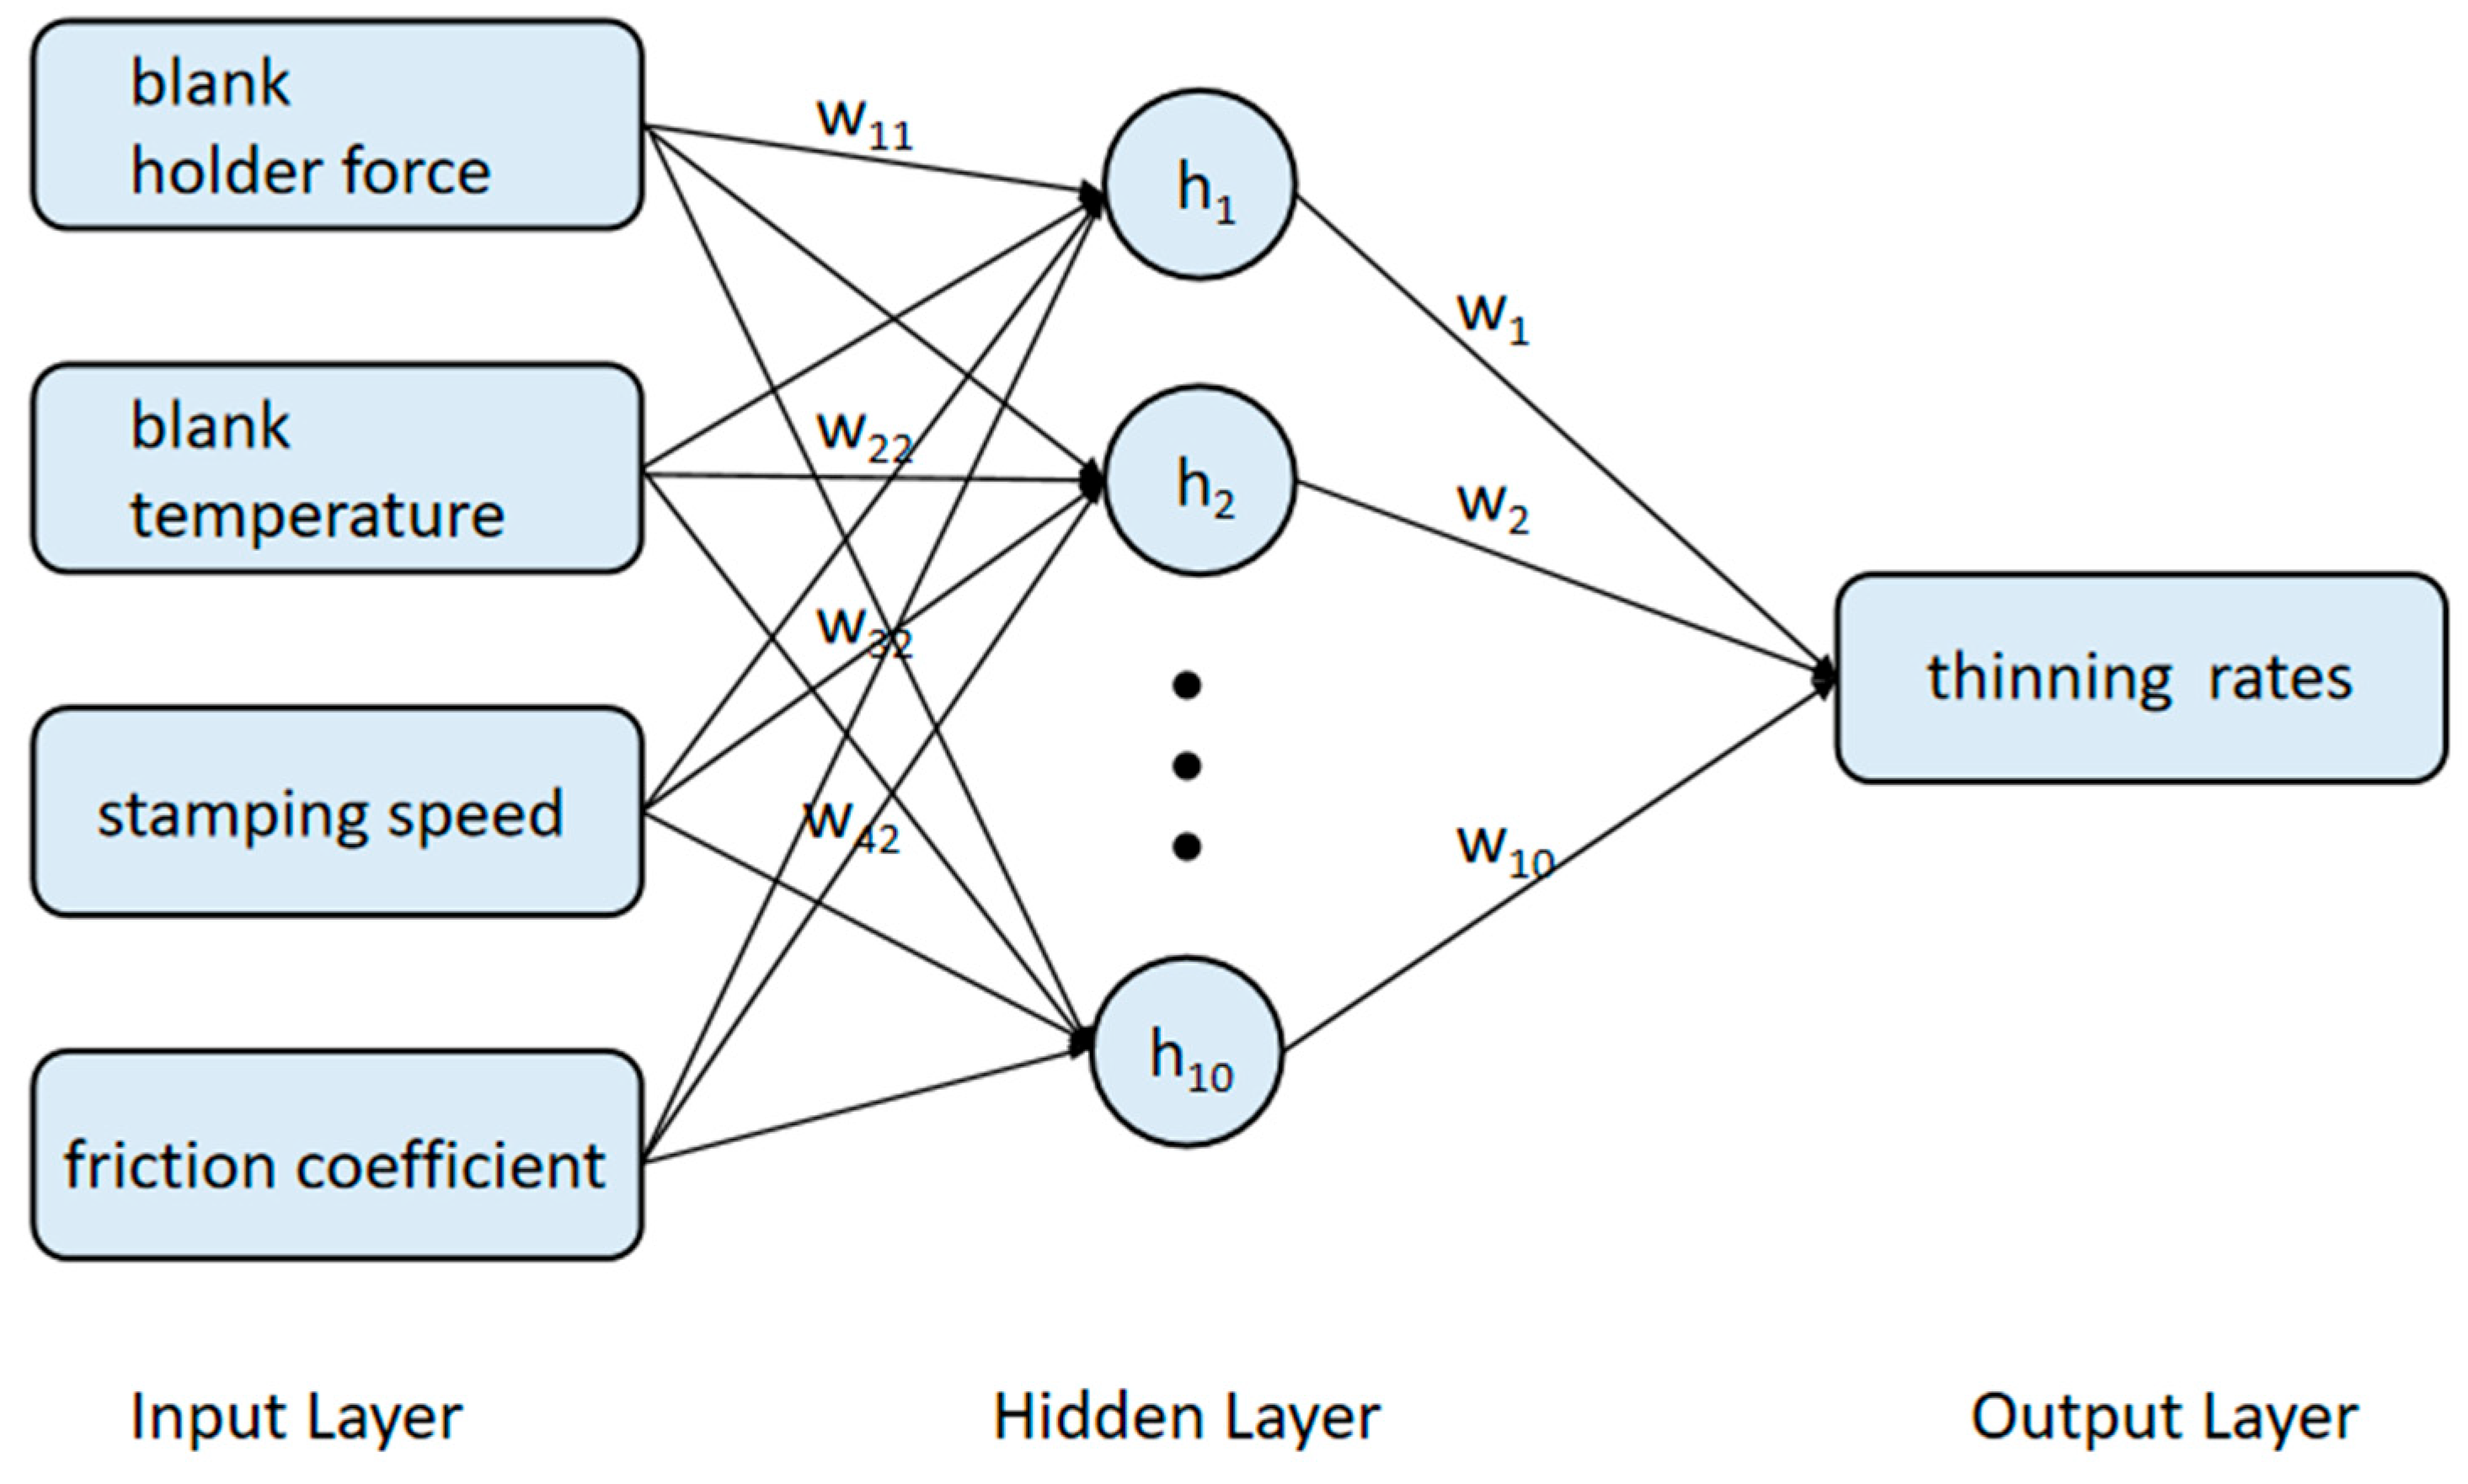
The structure of the BP neural network is shown in Figure 4, consisting of three main layers: input layer, hidden layer, and output layer. The input layer contains four nodes corresponding to the process parameters-blank holder force, heating temperature, stamping speed, and friction coefficient. The output layer has a single node representing the predicted thinning rate. To enhance the model’s representation capability, the hidden layer is set with 10 neurons.
The training process of the BP neural network includes forward propagation, error calculation, and backpropagation. In forward propagation, input data passes through each layer of the network to produce the output. As shown in Equation (1), the input variable X is processed through weighted summation, followed by an activation function, ultimately generating the network output Y.
Y = f W 2 f W 1 X + B 1 + B 2
where X represents the input variables, W 1 and W 2 are the weight matrices, B 1 and B 2 are the biases, f(x) is the activation function, and Y is the output value.
Error calculation is typically performed using Mean Squared Error (MSE) to measure the deviation between predicted and actual values.
M S E = 1 N i = 1 N E i P i 2
where N is the number of samples, E i represents the experimental (true) values, and P i denotes the predicted values.
Backpropagation adjusts the weights and biases of the neural network using gradient descent to minimize the error. As shown in Equation (3), the process involves computing the gradient of the error with respect to the weights and updating the weights using the learning rate to reduce the error:
W new = W old η E W
where η is the learning rate, and E W represents the gradient of the error with respect to the weights. W new represents the updated weight, and W old represents the previous weight before the update.
The training process employed the newff function to construct the neural network model and the train function for training. Key parameters included 50 training epochs, a target error (goal) of 1·e−4, and a learning rate (lr) of 0.01. During training, the backpropagation algorithm was used to adjust the network weights and minimize prediction error.

3.3. Prediction and Evaluation

In this study, the performance of the BP neural network prediction model is evaluated using Mean Squared Error (MSE), Root Mean Squared Error (RMSE), Mean Absolute Error (MAE), Coefficient of Determination (R2), and Mean Absolute Percentage Error (MAPE) to assess the model’s fitting accuracy and generalization capability.
Mean Squared Error (MSE) reflects the average squared deviation between predicted and actual values. A smaller MSE indicates that the predictions are closer to the true values. As shown in Equation (4), MSE is calculated by squaring the difference between each predicted and actual value, then taking the average across all samples:
M S E = 1 N i = 1 N Y true , i Y pred , i 2
Here, N is the number of samples, Y true , i is the actual value, and Y pred , i is the predicted value.
Root Mean Squared Error (RMSE) is the square root of MSE and measures the overall magnitude of prediction error. RMSE is obtained by taking the square root of the MSE, providing an error metric in the same unit as the original data:
R M S E = 1 N i = 1 N Y true , i Y pred , i 2
Mean Absolute Error (MAE) measures the average absolute difference between predicted and actual values, offering a straightforward assessment of prediction accuracy. It is computed as the mean of absolute errors across all samples:
M A E = 1 N i = 1 N Y true , i Y pred , i
The coefficient of determination ( R 2 ) measures the goodness of fit of a model, ranging from 0 to 1. A value closer to 1 indicates stronger explanatory power. The calculation of R 2 is shown below:
R 2 = 1 Y true Y pred 2 Y true Y true ¯ 2
where Y true denotes the mean of the actual values, Y true ¯ denotes the mean of the actual values, and Y pred denotes the predicted values, which are the outputs generated by the model based on input data.
Mean Absolute Percentage Error (MAPE) evaluates the percentage error of predictions relative to actual values, making it suitable for comparing data of different scales. As shown in Equation (8), MAPE is computed by averaging the percentage errors across all samples [24].
M A P E = 1 N i = 1 N Y true , i Y pred , i Y true , i × 100 %
A comprehensive analysis of the above evaluation metrics provides an overall assessment of the BP neural network model’s fitting accuracy, generalization capability, and computational efficiency.
The prediction results of the BP neural network are shown in Table 3. The R 2 value of 0.702 indicates that the model’s explanatory capacity remains limited, suggesting it not fully capture the complex relationships in the data. Although the MAE and MSE are relatively low, the high MAPE indicates significant errors in some predictions, resulting in large relative deviations. Improving the model’s performance can be achieved by optimizing the BP network architecture, adopting more advanced optimization algorithms, adjusting training parameters, and expanding the dataset, all of which can enhance prediction accuracy, generalization, and training efficiency to varying degrees.

4. Model Optimization

4.1. Grey Wolf Optimizer (GWO)

The Grey Wolf Optimizer (GWO) is a bio-inspired metaheuristic algorithm modeled on the social hierarchy and hunting behavior of grey wolves. It is widely used to optimize the initial weights and biases of BP neural networks, enhancing training performance and generalization ability [25]. The grey wolf population is divided into four roles: α, β, δ, and ω. The α wolf represents the current best solution and leads the search process. The β wolf, representing the second-best solution, supports the α wolf in guiding the search when the global optimum is not yet found. The δ wolf holds a good solution and assists in optimization, while the ω wolves, representing inferior solutions, act as followers during hunting. Their role is to explore the broader solution space and provide diverse potential solutions for the population.
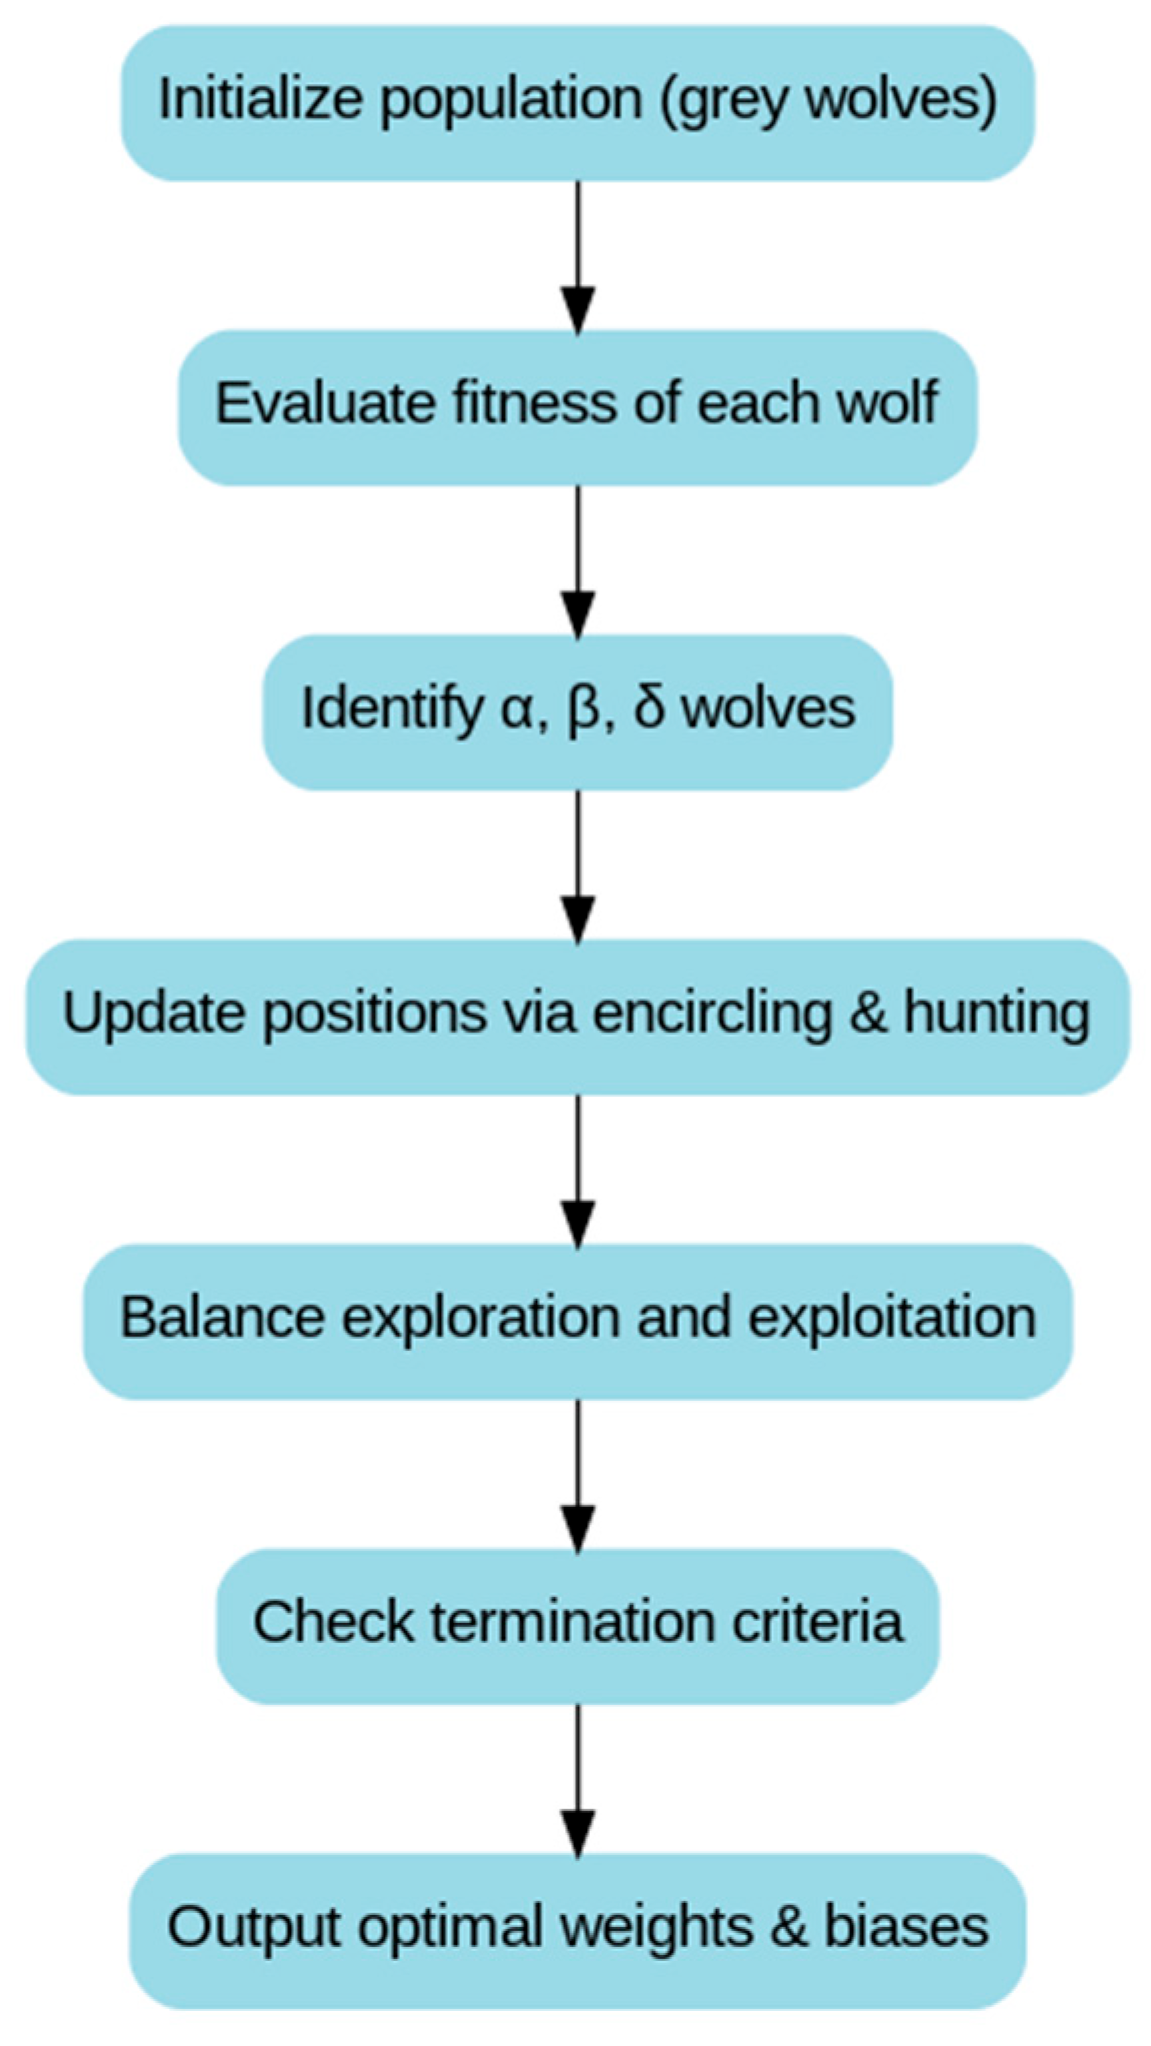
The overall optimization procedure of the GWO algorithm is illustrated in Figure 5 to provide a clearer visualization of its main steps. The population size N is defined, and each grey wolf’s position-corresponding to the weights and biases of the BP neural network—is randomly initialized:
X i = W 1 , B 1 , W 2 , B 2 i , i = 1,2 , , N
Here, W 1 and W 2 are the weight matrices from the input layer to the hidden layer and from the hidden layer to the output layer of the BP neural network, respectively, while B 1 and B 2 are the corresponding biases.
During the hunting process, grey wolves first encircle their prey. This behavior is mathematically described as:
X t + 1 = X * t A D
where X t + 1 is the updated position (solution), X * t represents the current best solution (prey’s position), and A and D are factors that control the balance between global exploration and local exploitation. The distance factor D is calculated as:
D = C X * X
where C is a coefficient that influences the convergence behavior and dynamically adjusts the position of the wolves.
During the roundup, grey wolves not only follow the prey but also continuously adjust their positions based on the best positions of the α, β, and δ wolves, ensuring that the search converges toward the optimal solution. Through iterative updates, the wolf pack gradually narrows the search space and ultimately completes the hunt, i.e., finds the optimal solution to the problem.

4.2. Sparrow Search Algorithm (SSA)

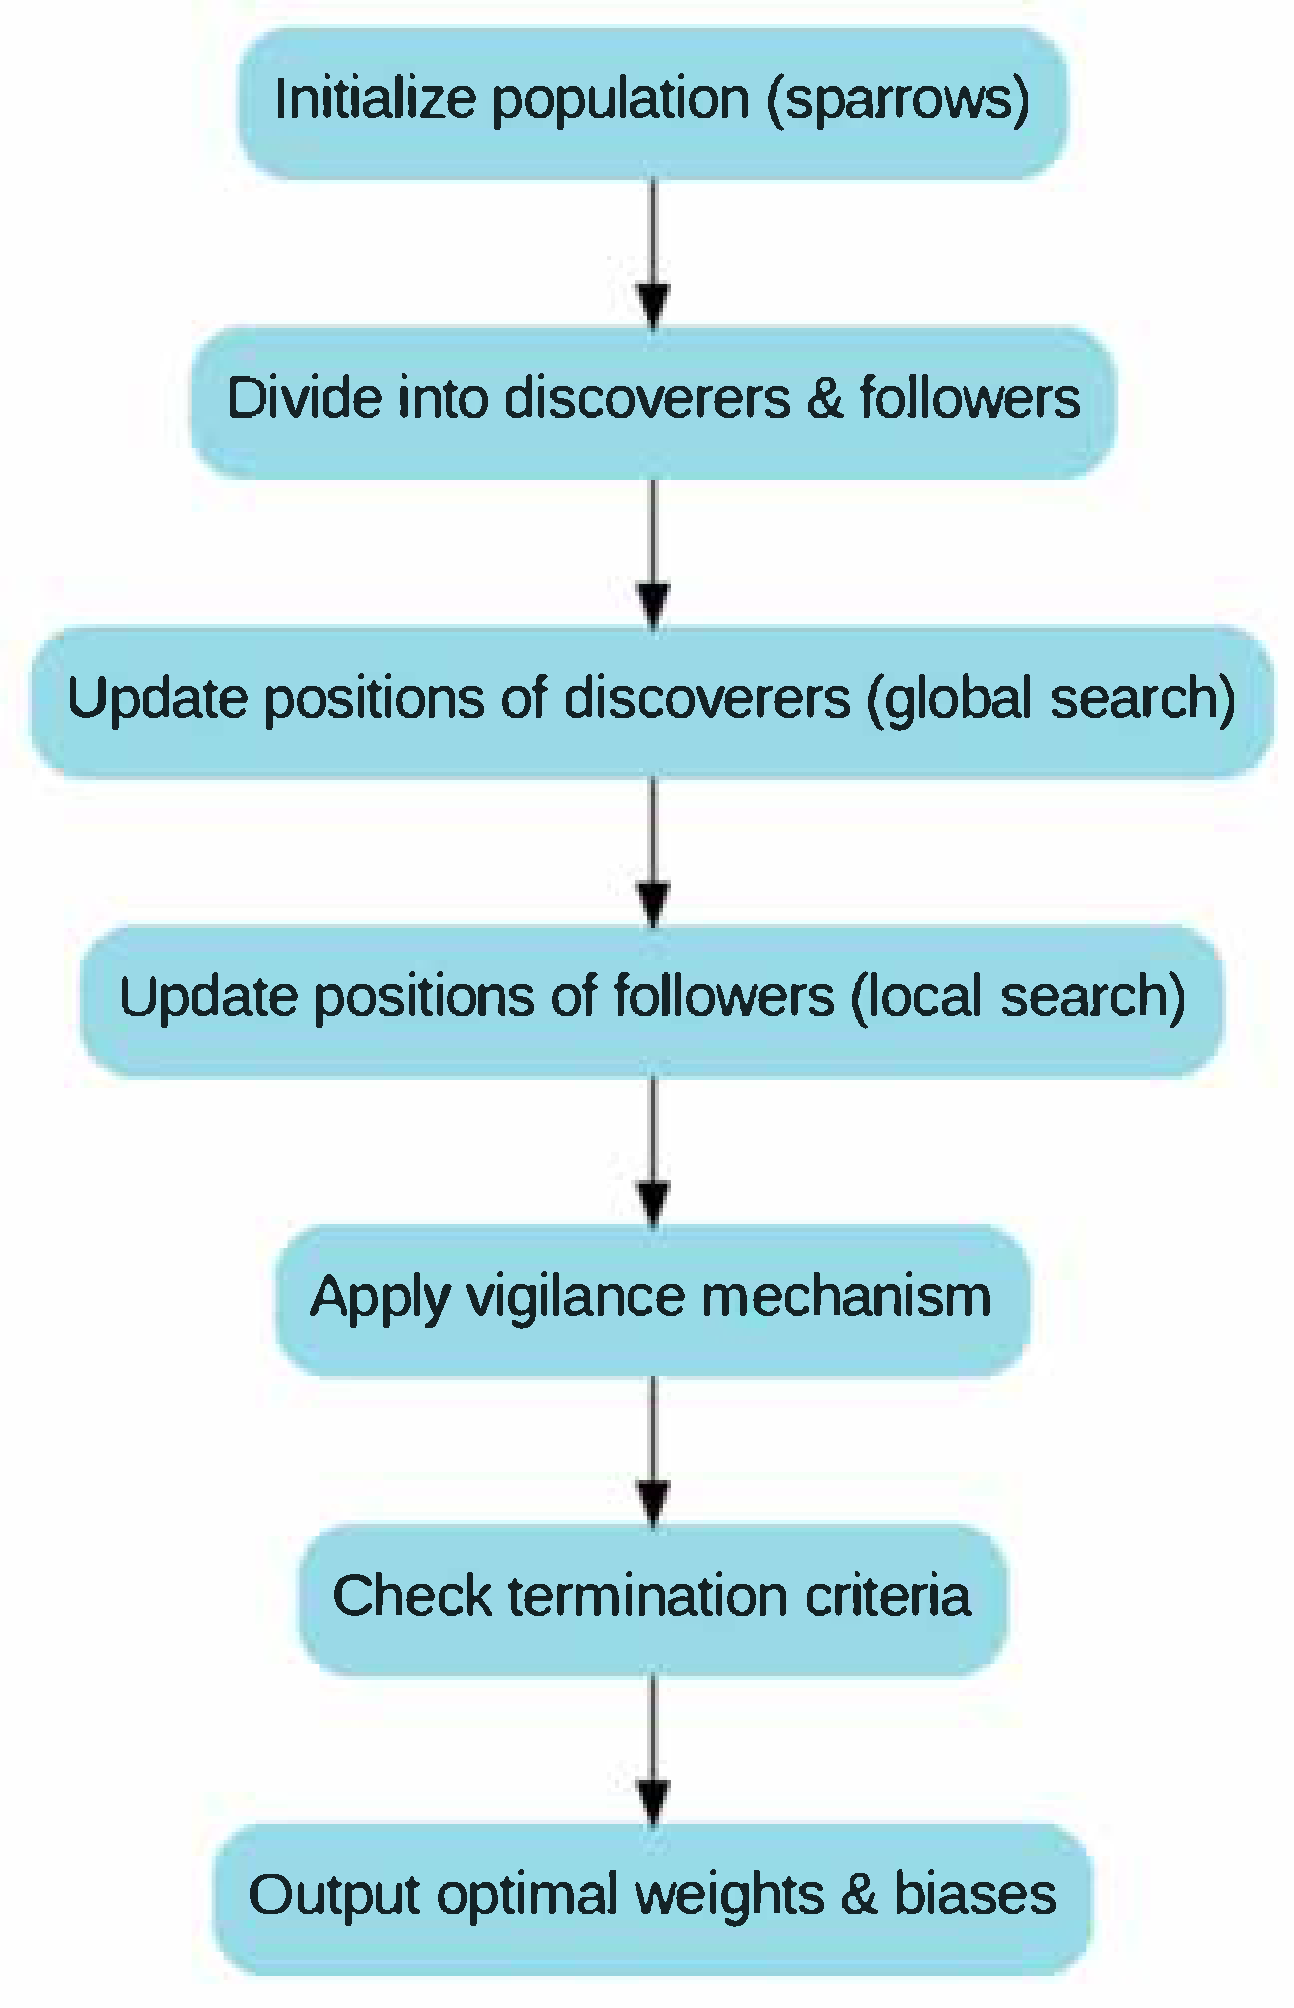
The Sparrow Search Algorithm (SSA) is a swarm intelligence optimization method inspired by the foraging and vigilance behaviors of sparrows [26]. The algorithm simulates the role of leaders and followers within a sparrow population to dynamically balance global exploration and local exploitation in the search for optimal solutions. The population consists of foragers and sentinels-where foragers explore optimal solutions, and sentinels help prevent the swarm from getting trapped in local optima.
The overall optimization process of SSA is illustrated in Figure 6, which provides a clearer representation of its key mechanisms. During the search process, the position update for a forager is given by:
X i t + 1 = X i t e i T + r a n d X best X i t
where X i t is the current solution, X best is the global best solution, T controls the search scope, and rand is a random factor to enhance exploration.
In response to environmental changes, sentinels update their positions to avoid local optima:
X i t + 1 = X i t + F X best X worst
where X worst is the worst solution, and F is a regulation factor. Through iterative updates, the sparrow swarm gradually narrows the search range and ultimately converges to the global optimum.

4.3. Crested Porcupine Optimization (CPO)

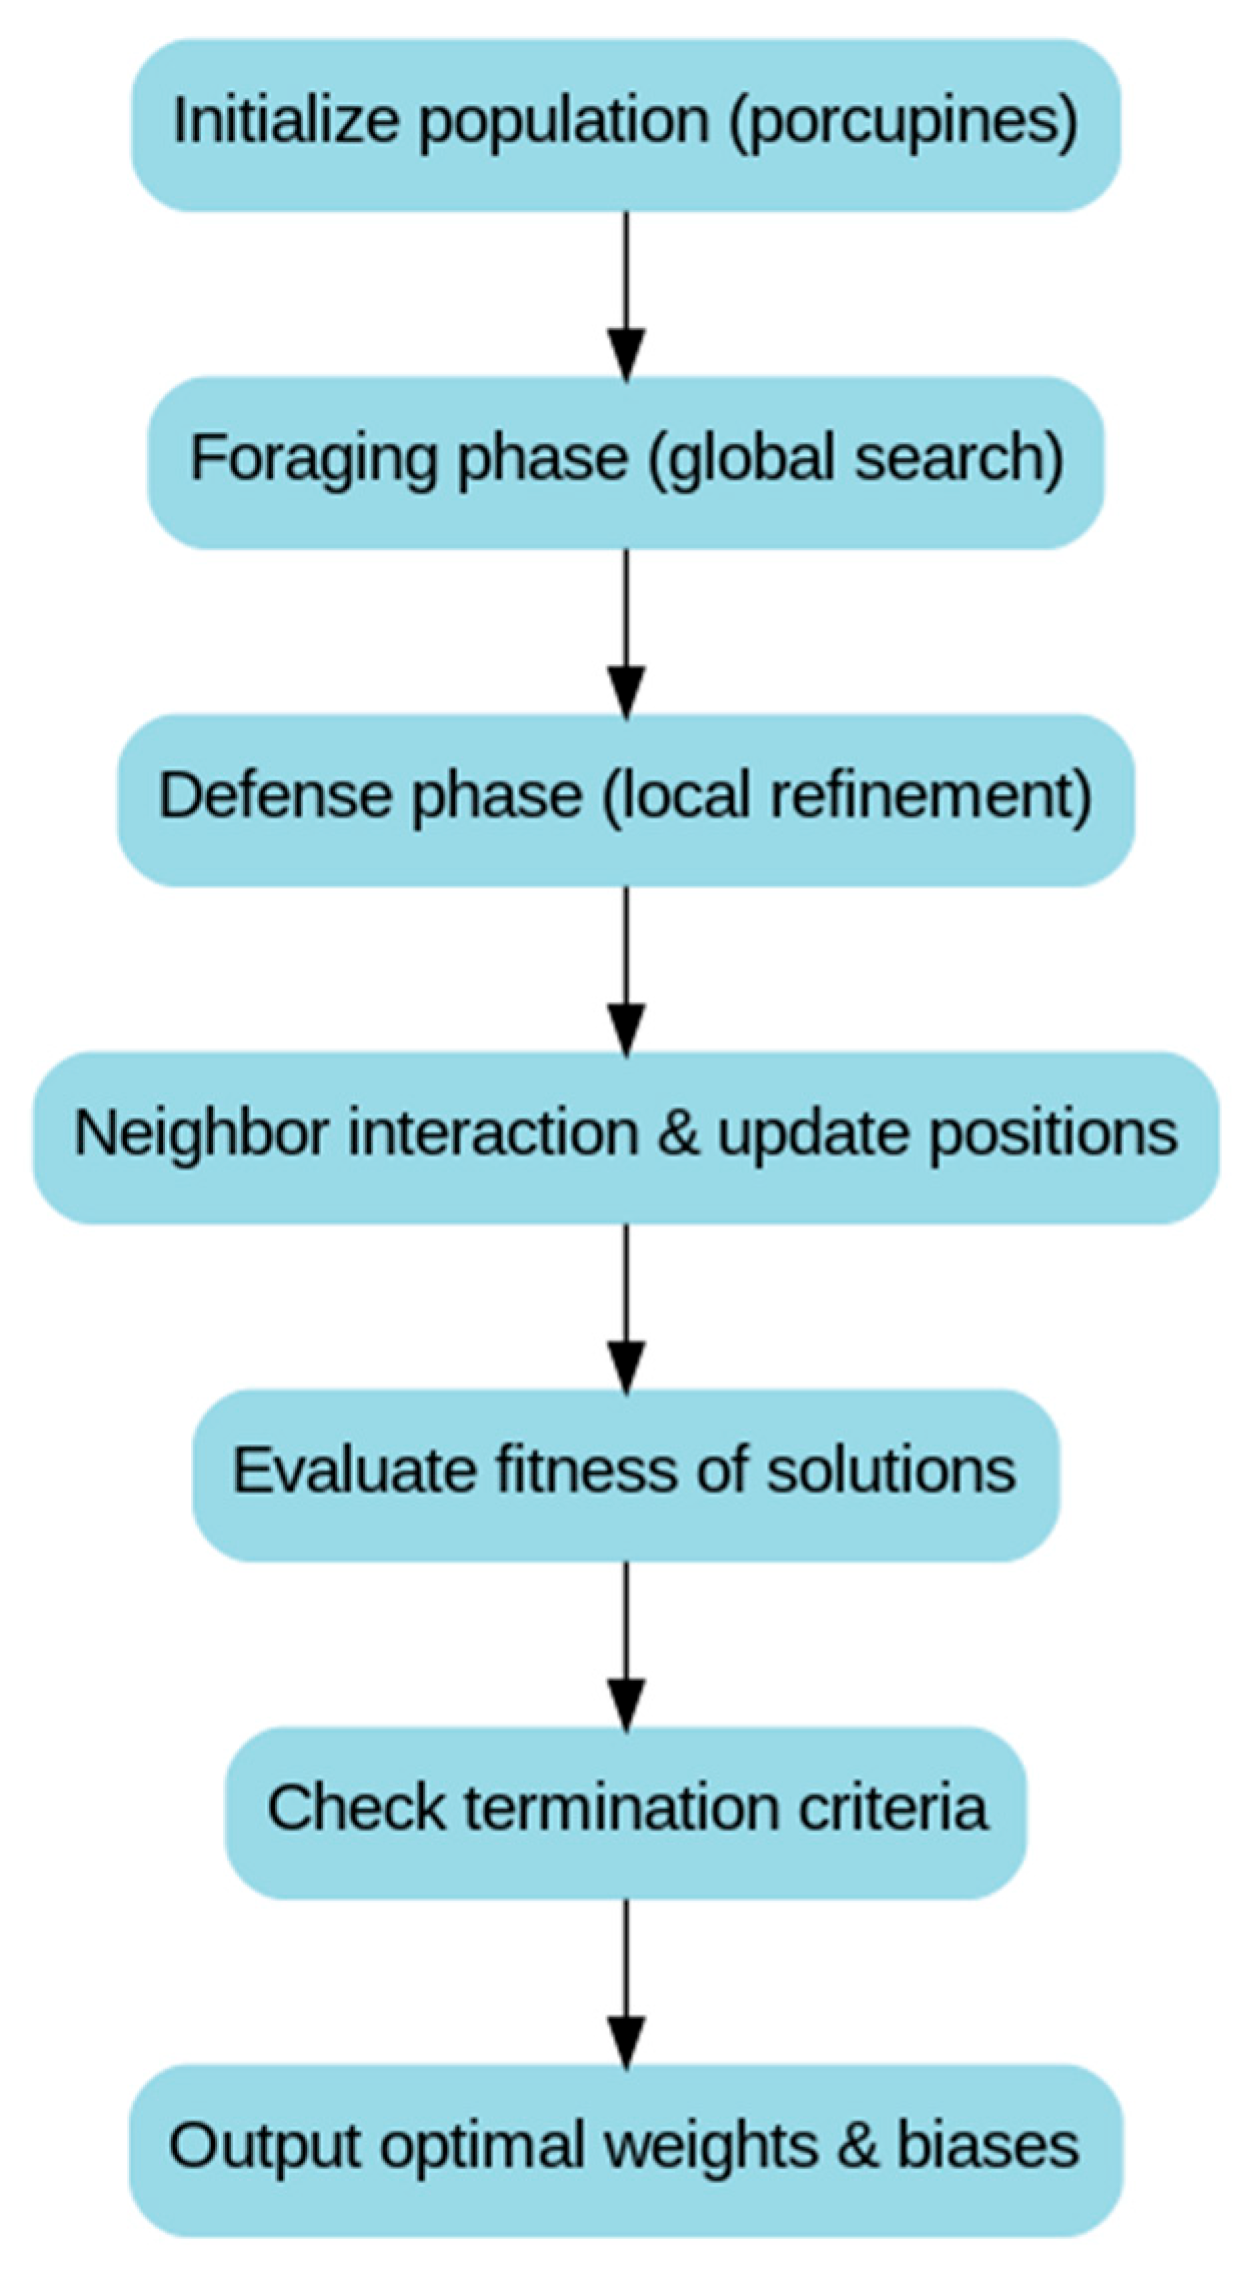
The Crested Porcupine Optimization (CPO) algorithm is a bio-inspired intelligent optimization method that simulates the foraging and territorial defense behaviors of crested porcupines in nature [27]. When searching for food, crested porcupines adopt both cooperative and competitive strategies, while in the face of external threats, they defend themselves using their sharp quills. CPO leverages this dual behavior to balance global exploration and local exploitation, effectively avoiding local optima and accelerating convergence when optimizing the weights and biases of BP neural networks.
A schematic overview of the CPO optimization procedure is presented in Figure 7, which highlights the two main phases and their roles in enhancing the optimization process. The optimization process of CPO consists of two stages: the foraging phase and the defense phase. In the foraging phase, individuals perform global search using a random walk strategy:
X i t + 1 = X i t + r X best X i t
where X best is the best solution in the current population, and r is a dynamic parameter controlling the exploration range. This strategy ensures that the population can explore a wide search space for potential optimal solutions.
In the defense phase, individuals adjust their positions based on neighboring individuals to enhance local exploitation:
X i t + 1 = X i t + β X neighbor X i t
where β controls the influence of neighboring solutions, and X neighbor represents the position of a nearby individual.
By integrating foraging and defense behaviors, CPO maintains population diversity while enabling rapid convergence to the global optimum. In BP neural network optimization, CPO effectively adjusts initial weights and biases, improving both training efficiency and prediction accuracy.

4.4. Goose Optimization Algorithm (GOOSE)

The Goose Optimization Algorithm (GOOSE) is inspired by the coordinated flight behavior of geese during migration [28]. In a migrating flock, the lead goose sets the direction, while the others adjust their relative positions to optimize the flight path. This cooperative mechanism forms the basis of GOOSE, enabling strong global search capabilities and improved solution quality during local exploitation when optimizing the weights of BP neural networks.
To better illustrate this process, the overall optimization procedure of GOOSE is depicted in Figure 8, highlighting its leader–follower mechanism and migration-based position updates. In GOOSE, each individual’s position is updated based on the leader’s position:
X i t + 1 = X i t + α X leader X i t
where X leader represents the current best solution, and α is a step-size factor guiding individuals toward the global optimum.
To prevent premature convergence to local optima, GOOSE introduces a random perturbation term:
X i t + 1 = X i t + γ r a n d
where γ is the perturbation factor and rand is a random number in the range [−1,1].
By mimicking goose migration strategies, GOOSE achieves a more stable and convergent optimization process. In the context of BP neural network training, it effectively reduces training error and enhances the model’s generalization ability.

4.5. Dung Beetle Optimization (DBO)

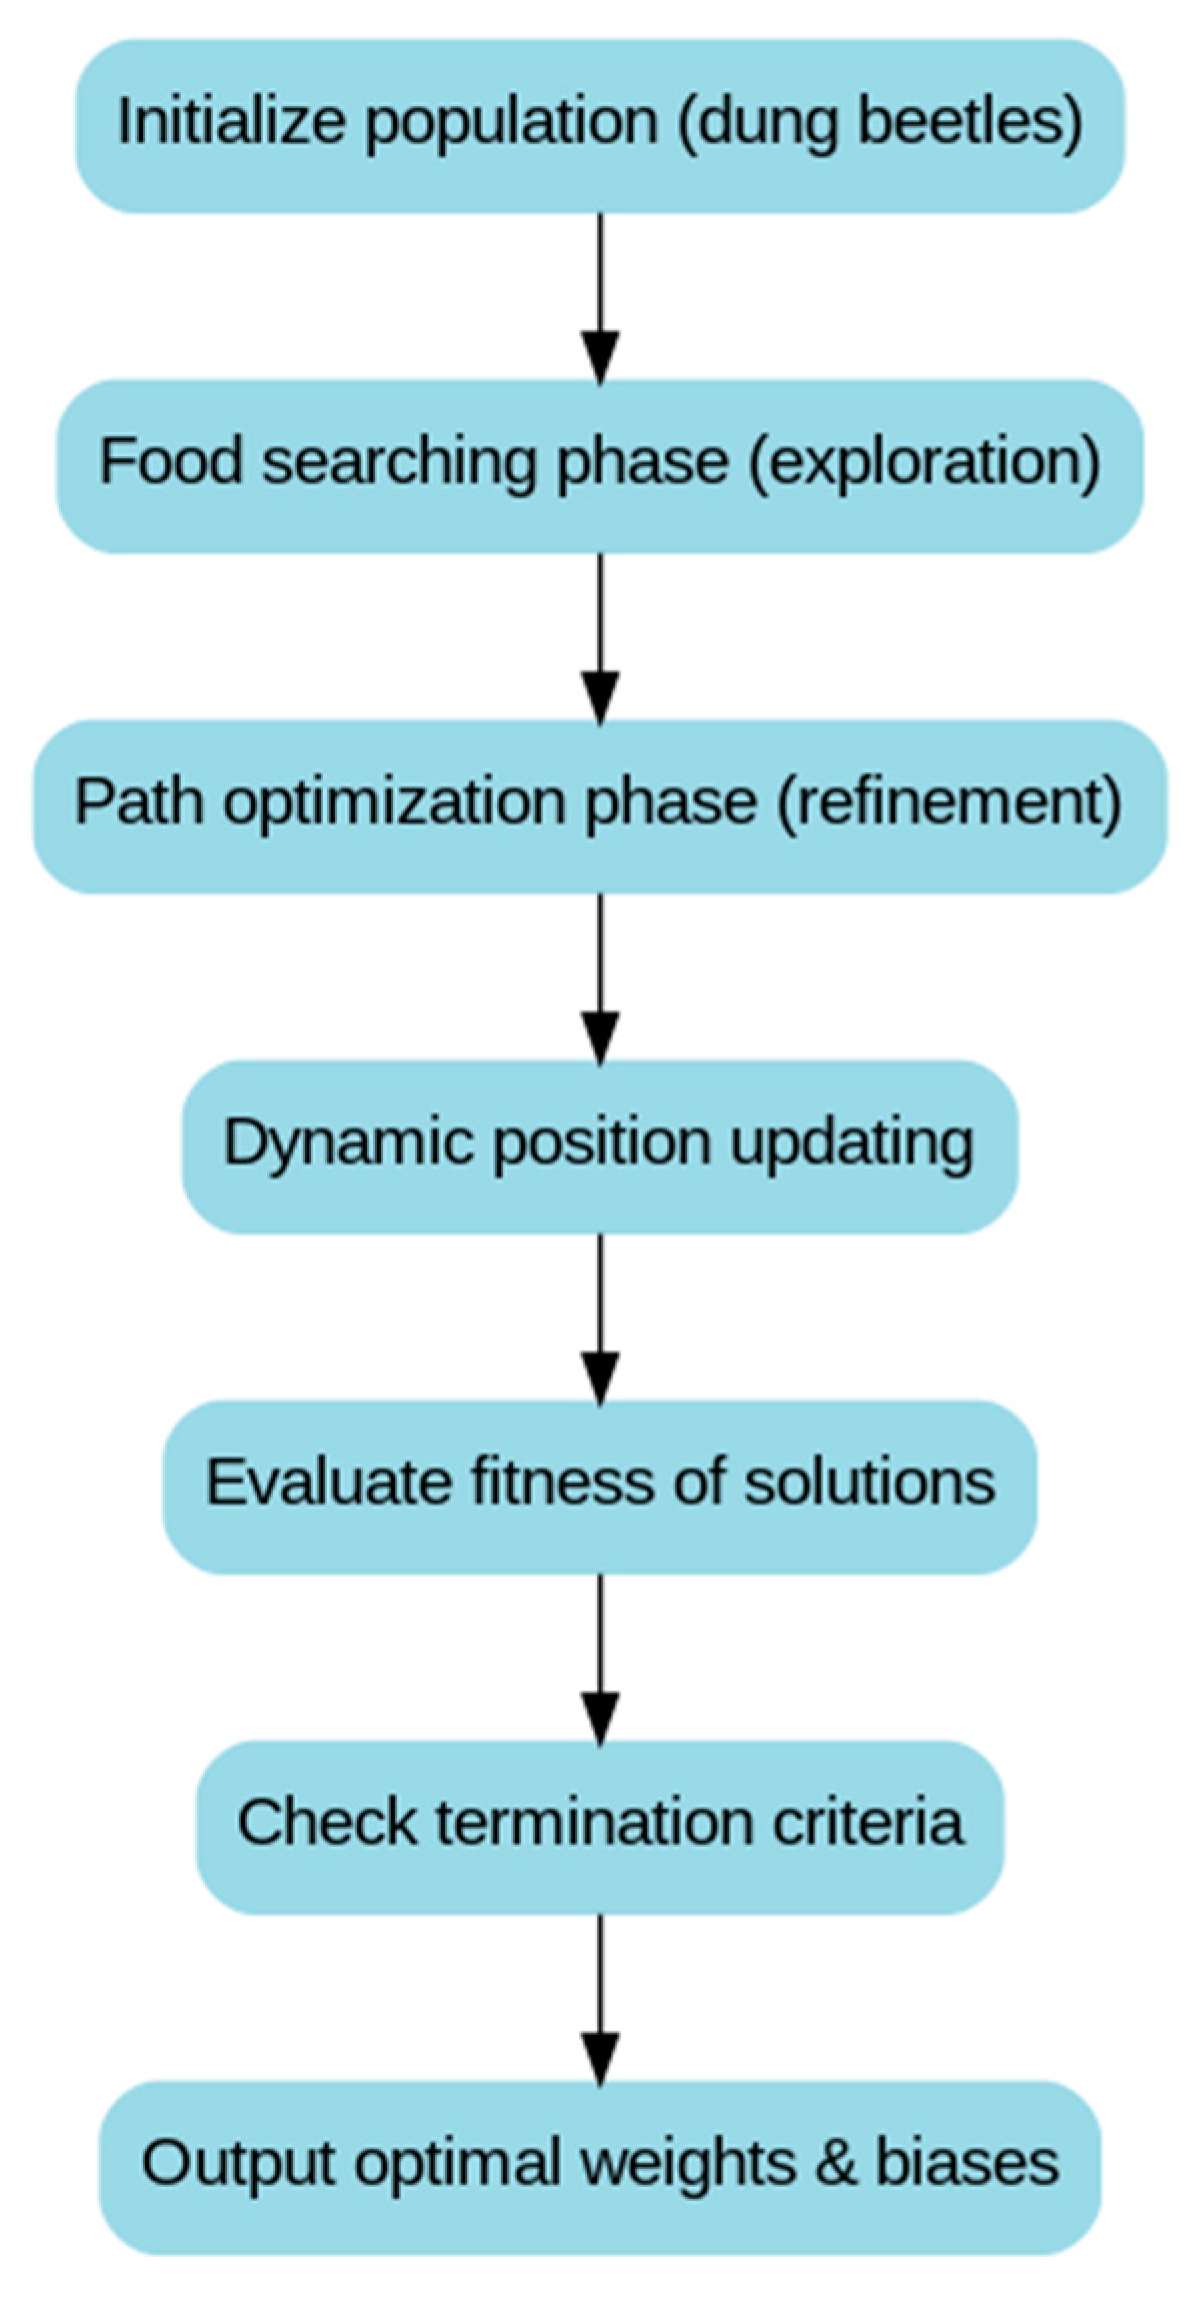
The Dung Beetle Optimization (DBO) algorithm is inspired by the dung beetle’s behavior of rolling dung balls, simulating its continuous path adjustments while foraging and transporting food to adapt to environmental changes [29]. By introducing an environmental adaptation mechanism, DBO improves the training efficiency and prediction performance of BP neural networks.
The complete optimization process of DBO is shown in Figure 9, which schematically presents its main phases and updating strategies. The search process in DBO consists of two main stages: food searching and path optimization. In the food searching stage, individuals explore globally around the current solution:
X i t + 1 = X i t + λ X global X i t
where λ is the search step size, and X global represents the current global best solution.
In the path optimization stage, dung beetles adjust their positions to conduct local search:
X i t + 1 = X i t + δ X neighbor X i t
where δ is the local optimization factor, and X neighbor represents the position of a neighboring individual.
By dynamically adjusting the positions of individuals, DBO enhances the optimization process of BP neural networks, enabling the model to converge more quickly to the optimal solution during training.

4.6. Parrot Optimization (PO)

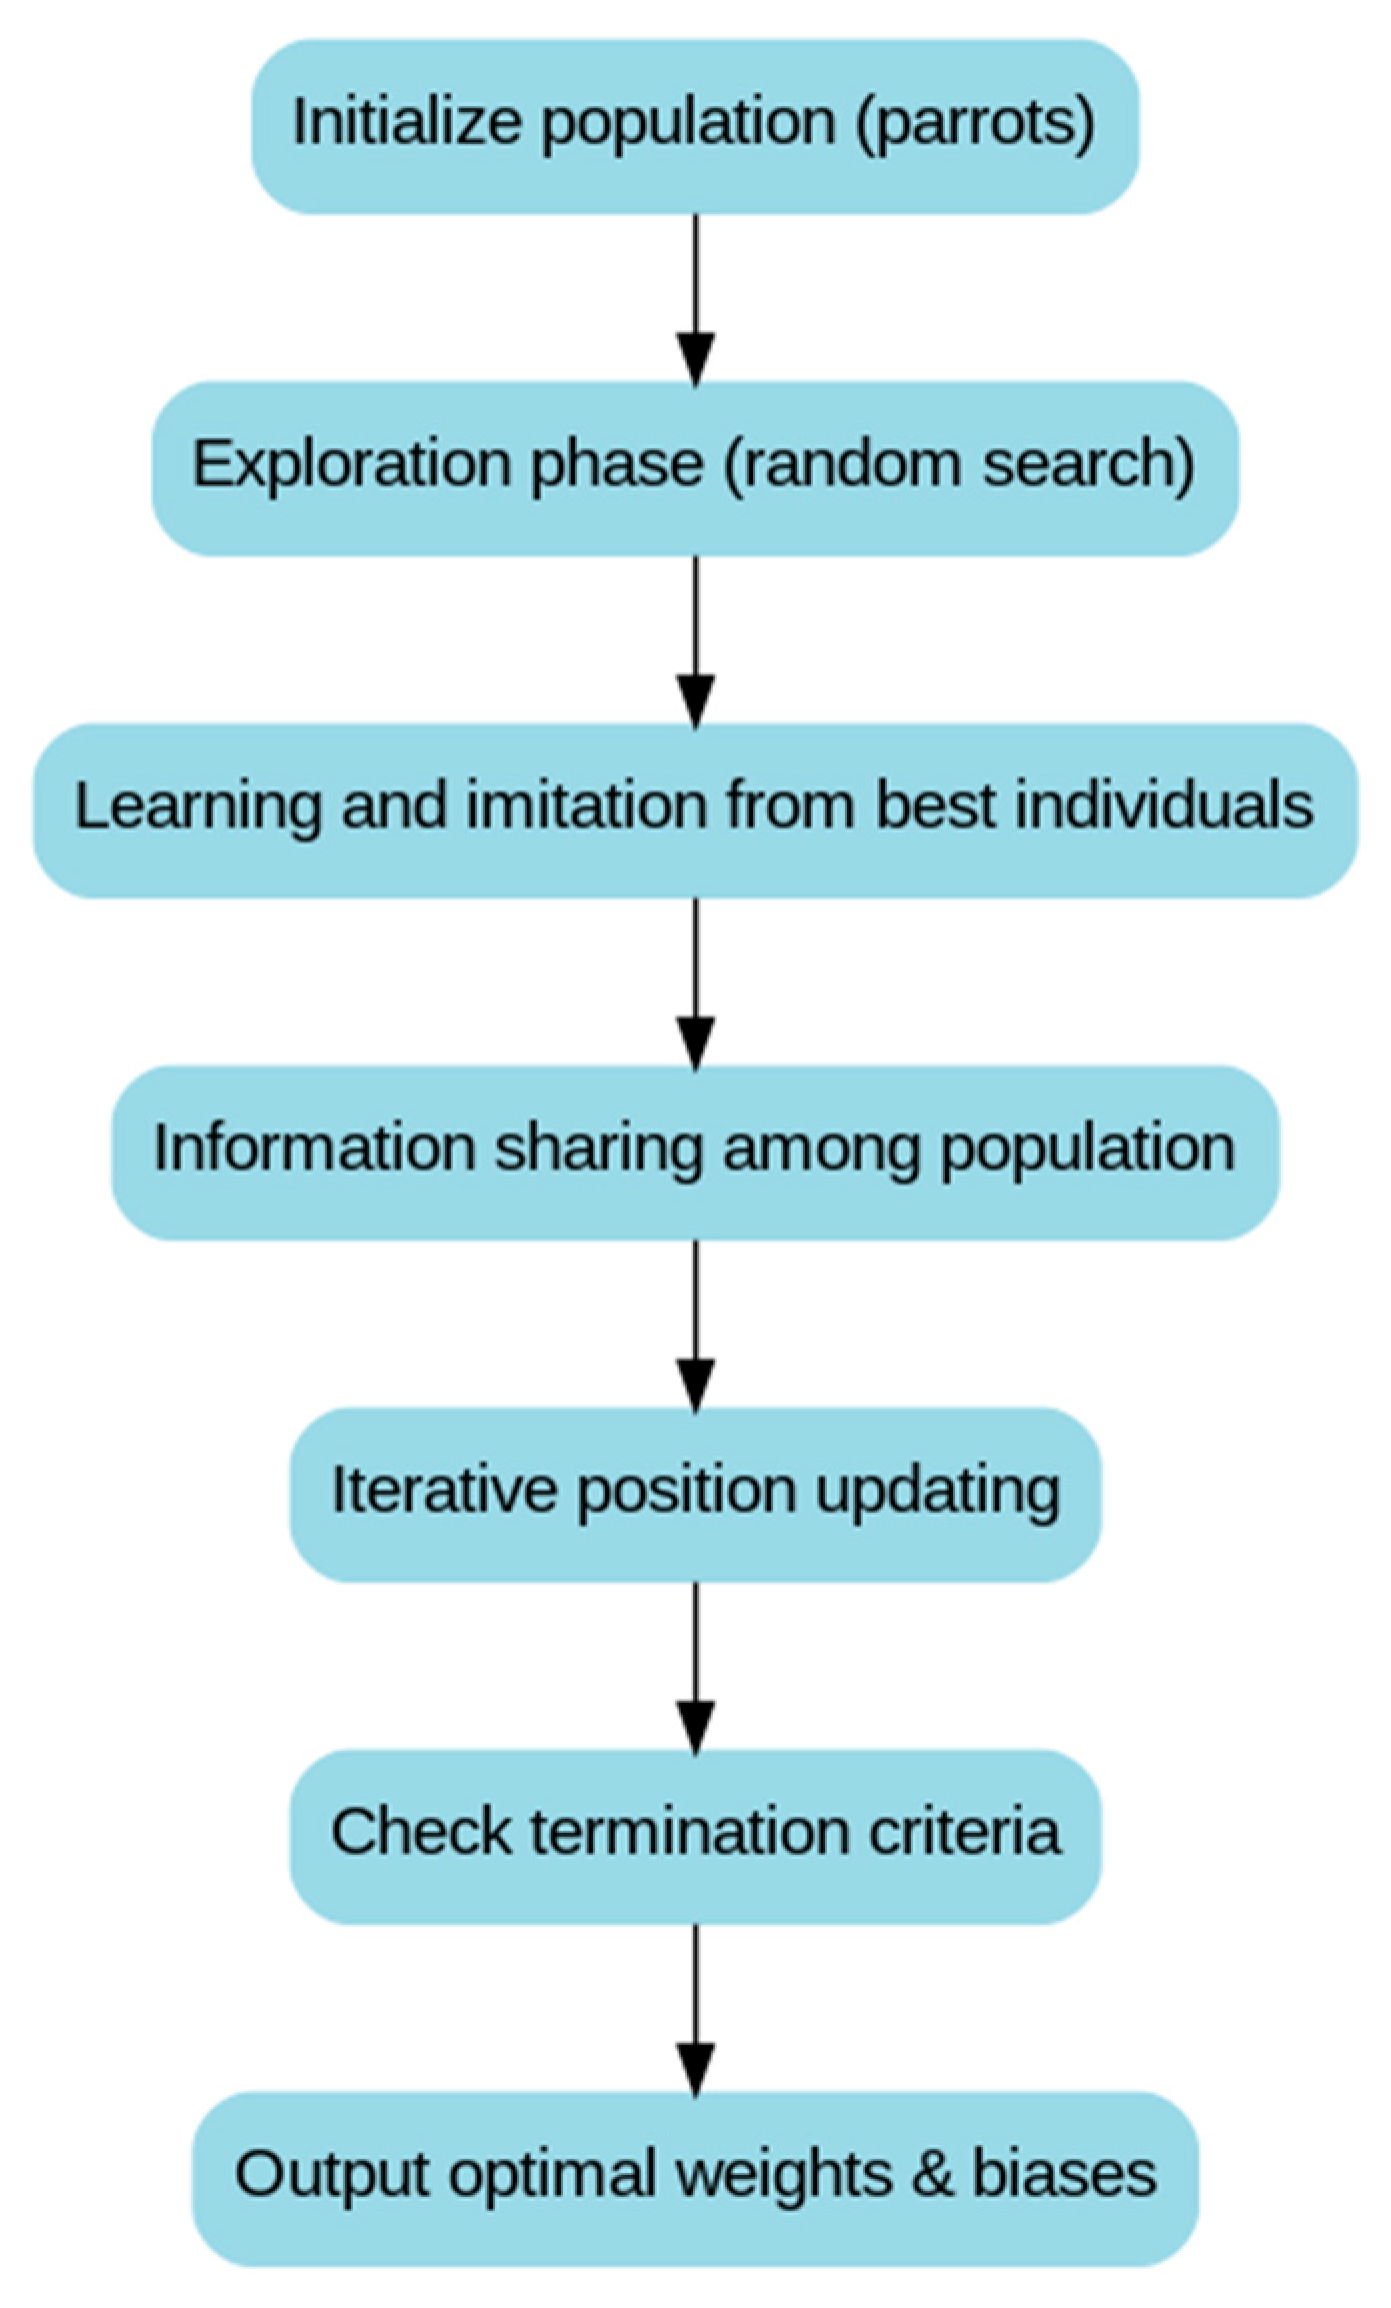
The Parrot Optimization (PO) algorithm is a global optimization method based on swarm intelligence, inspired by the learning and imitation behaviors of parrots [30]. The algorithm achieves optimal solution search through information exchange, imitation, and experience accumulation among the parrot population. Its optimization process includes exploration, learning, imitation, and adjustment, and is suitable for optimizing the weights and biases of BP neural networks to overcome the local optimum convergence problem in traditional BP networks, thereby improving training accuracy and convergence speed.
The detailed optimization framework of PO is illustrated in Figure 10, providing a clear step-by-step representation of its key phases. Parrot individuals update their positions by observing and imitating the best individual:
X i t + 1 = X i t + r 1 × X best t X i t + r 2 × X rand t X i t
where r 1 and r 2 are random numbers (usually between [0, 1]), X best t is the current best solution, and X rand t is a randomly selected individual.
The most experienced parrot (the best individual) shares knowledge with other parrots, guiding the entire population toward the global optimum:
X i t + 1 = X i t + λ X leader t X i t
where λ is the learning rate, and X leader t is the best solution in the current population.
By mimicking and learning, PO makes the optimization process more intelligent, efficiently adjusting the parameters of BP neural networks and improving prediction accuracy.

4.7. The Prediction Results of the Models

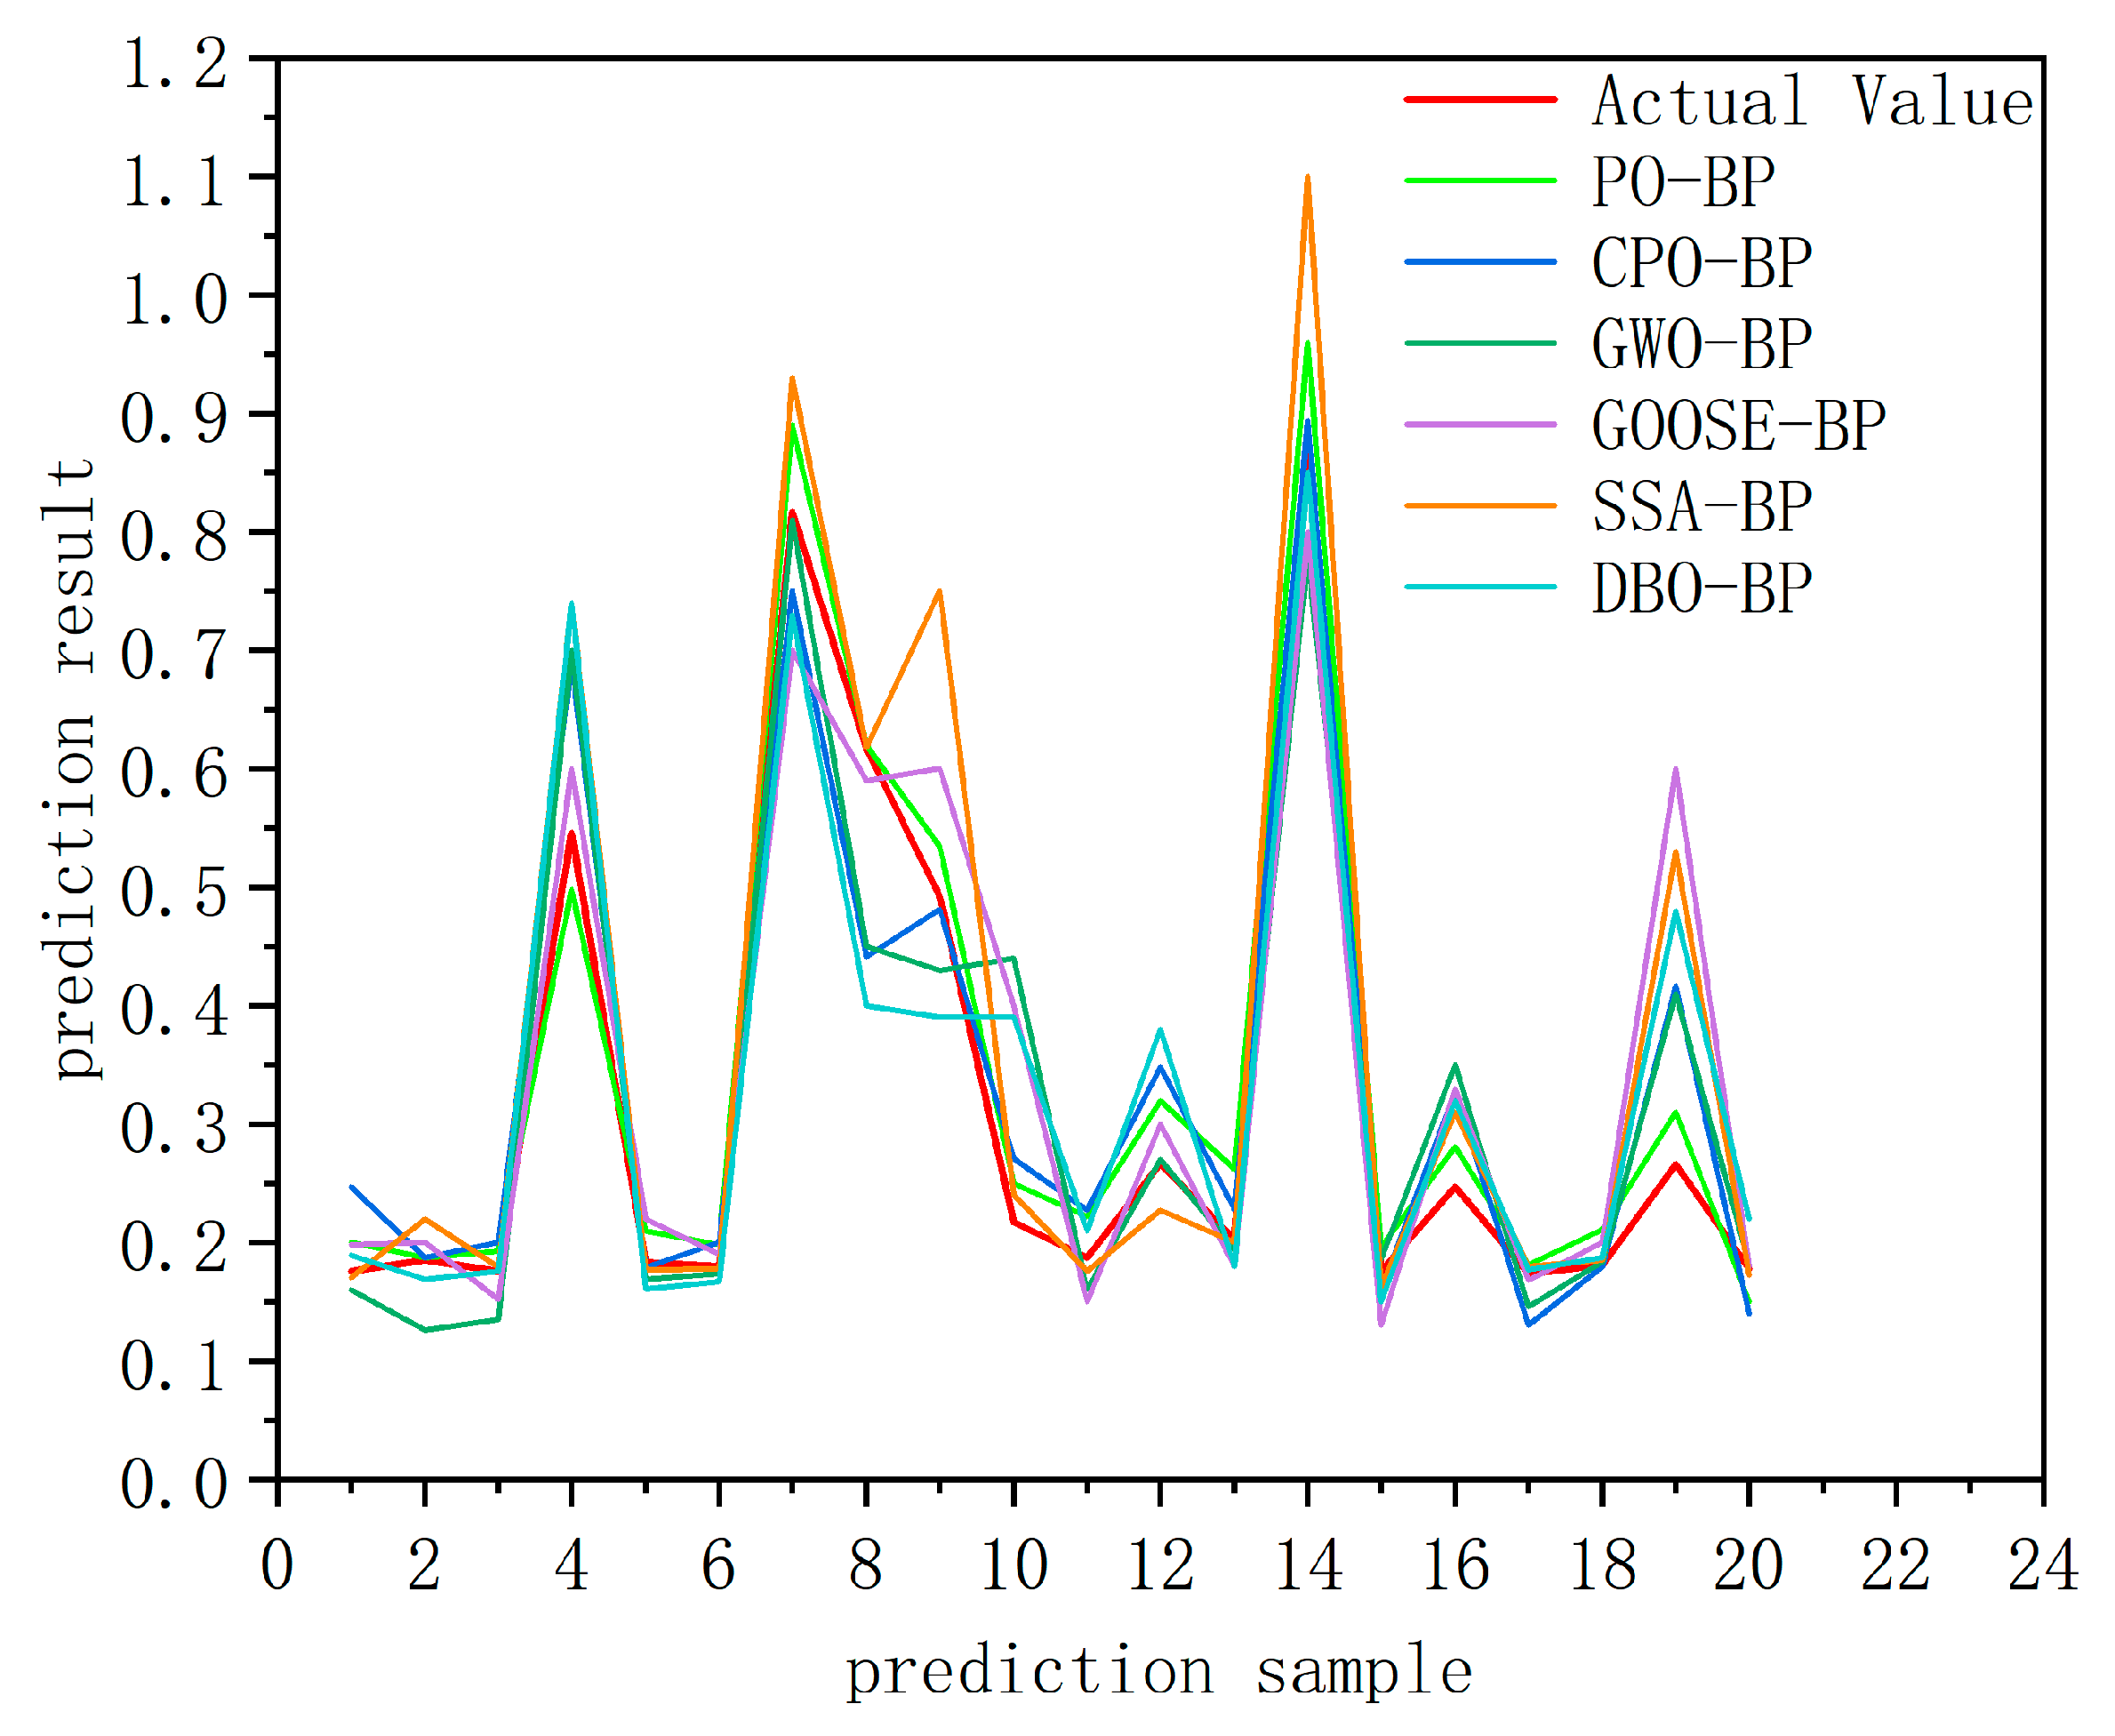
Figure 11 shows a comparison between the predicted and actual values of the BP neural network optimized by six algorithms (CPO-BP, PO-BP, DBO-BP, GOOSE-BP, SSA-BP, GWO-BP). It can be observed that the PO-BP and CPO-BP algorithms yield predictions that are closer to the actual values, with overall stable performance. In contrast, other optimization algorithms such as DBO, GOOSE, and GWO exhibit larger deviations at certain data points, particularly at extreme values, indicating potential local optimum issues when handling specific cases.
Table 4 summarizes the prediction accuracy and run time of different optimization algorithms. Compared with the baseline BP neural network, all six optimization algorithms enhanced the prediction performance, as indicated by higher R2 values and reduced errors. GWO and CPO demonstrated a good balance of global search capability, accuracy, and computational efficiency, with run times of 9.27 s and 12.97 s, respectively. GOOSE showed strong global exploration but weaker local refinement, leading to relatively larger errors, while DBO performed efficiently with a short run time of 10.73 s, though its accuracy was limited in high-dimensional problems. SSA achieved reasonable local optimization but exhibited higher MSE, RMSE, and MAPE values, and also required the longest run time (21.69 s), indicating low overall efficiency.
Among all methods, the PO algorithm achieved the best accuracy, with R2 increasing to 0.894 and error reductions up to 69.0%. Although its run time (16.68 s) was longer than most of the other algorithms, the improvement in predictive performance justifies the computational cost. These results suggest that PO-BP offers the most effective trade-off between accuracy and generalization, while GWO and CPO provide competitive alternatives when both accuracy and time efficiency are considered.

5. Genetic Algorithm of Process Parameters

In the hot stamping process, optimizing process parameters plays a crucial role in improving forming quality, reducing defects, and enhancing material utilization. Due to the nonlinear physical processes involved in hot stamping, traditional experimental methods or empirical rules are often insufficient to quickly find the optimal combination of process parameters. Therefore, this study established a mapping relationship between process parameters and thinning rate using a BP neural network, combined with the PO algorithm, and utilized the Genetic Algorithm (GA) to optimize the stamping process parameters, aiming to minimize the thinning rate and thus improve forming quality.
The BP neural network was used to construct the mapping relationship between input variables (process parameters) and output variables (thinning rate), while the Genetic Algorithm performed an optimization search using this model to find the optimal process parameter combination. The optimization process of the Genetic Algorithm primarily includes six main steps: population initialization, fitness evaluation, selection, crossover, mutation, and termination judgment [31].
In the initial stage of optimization, a population is randomly generated, with each individual representing a different combination of stamping process parameters. The population size is set to 20 to avoid excessive calculations. Process parameters are encoded as real numbers, and each individual can be represented as:
X i = F , T , V , μ
where F is the blank holder force, T is the heating temperature, V is the forming speed, and μ is the friction coefficient.
The fitness function is used to assess the quality of each individual. In this study, the fitness function is based on the BP neural network’s prediction of the thinning rate, and is expressed as:
t e x t F i t n e s s X = BP X
where BP X represents the maximum thinning rate predicted by the BP neural network. The optimization goal is to find the parameter combination that minimizes this value.
Individuals with higher fitness are selected from the current population, with a higher survival probability for better individuals, ensuring that favorable traits are passed on to the next generation. The crossover operation is used to exchange information between parent individuals to generate new offspring. A single-point crossover strategy is employed to allow offspring to inherit the best genes from their parents. The mathematical expression for the crossover operation is:
X new = α X parent 1 + 1 α X parent 2
where the crossover rate α is set to 0.75. A higher crossover probability promotes the combination of good genes, which helps accelerate convergence.
The mutation probability was set to 0.2 to increase population diversity and prevent the algorithm from getting stuck in local optima. A small perturbation was applied to certain genes of some individuals. The mathematical expression for the mutation operation is as follows:
X mut = X orig + δ
where δ is a small random perturbation, typically following a Gaussian distribution.
The iteration stops when the maximum number of iterations (100) is reached or when the fitness value converges over several consecutive iterations.
The optimized process parameters obtained are a heating temperature of 313 °C, a stamping speed of 108 mm/s, a friction coefficient of 0.14, and a blank holder force of 55 kN. The comparison between the predicted and simulation results is shown in Table 5. The simulation using the optimized hot stamping parameters resulted in a maximum thinning rate of 17.2%, with a relative error of only 1.16% compared to the thinning rate predicted by the PO-BP neural network.
To verify the optimization results, hot stamping experiments were conducted on ten crash beam parts using the optimized process parameters. The stamping process was performed with the forming die shown in Figure 12, and the fabricated crash beam parts are presented in Figure 13. The shape and dimensions of all parts fully met the design standards, demonstrating that the optimized process parameters achieved the desired forming quality and validating the effectiveness of the BP neural network optimization model in practical applications.
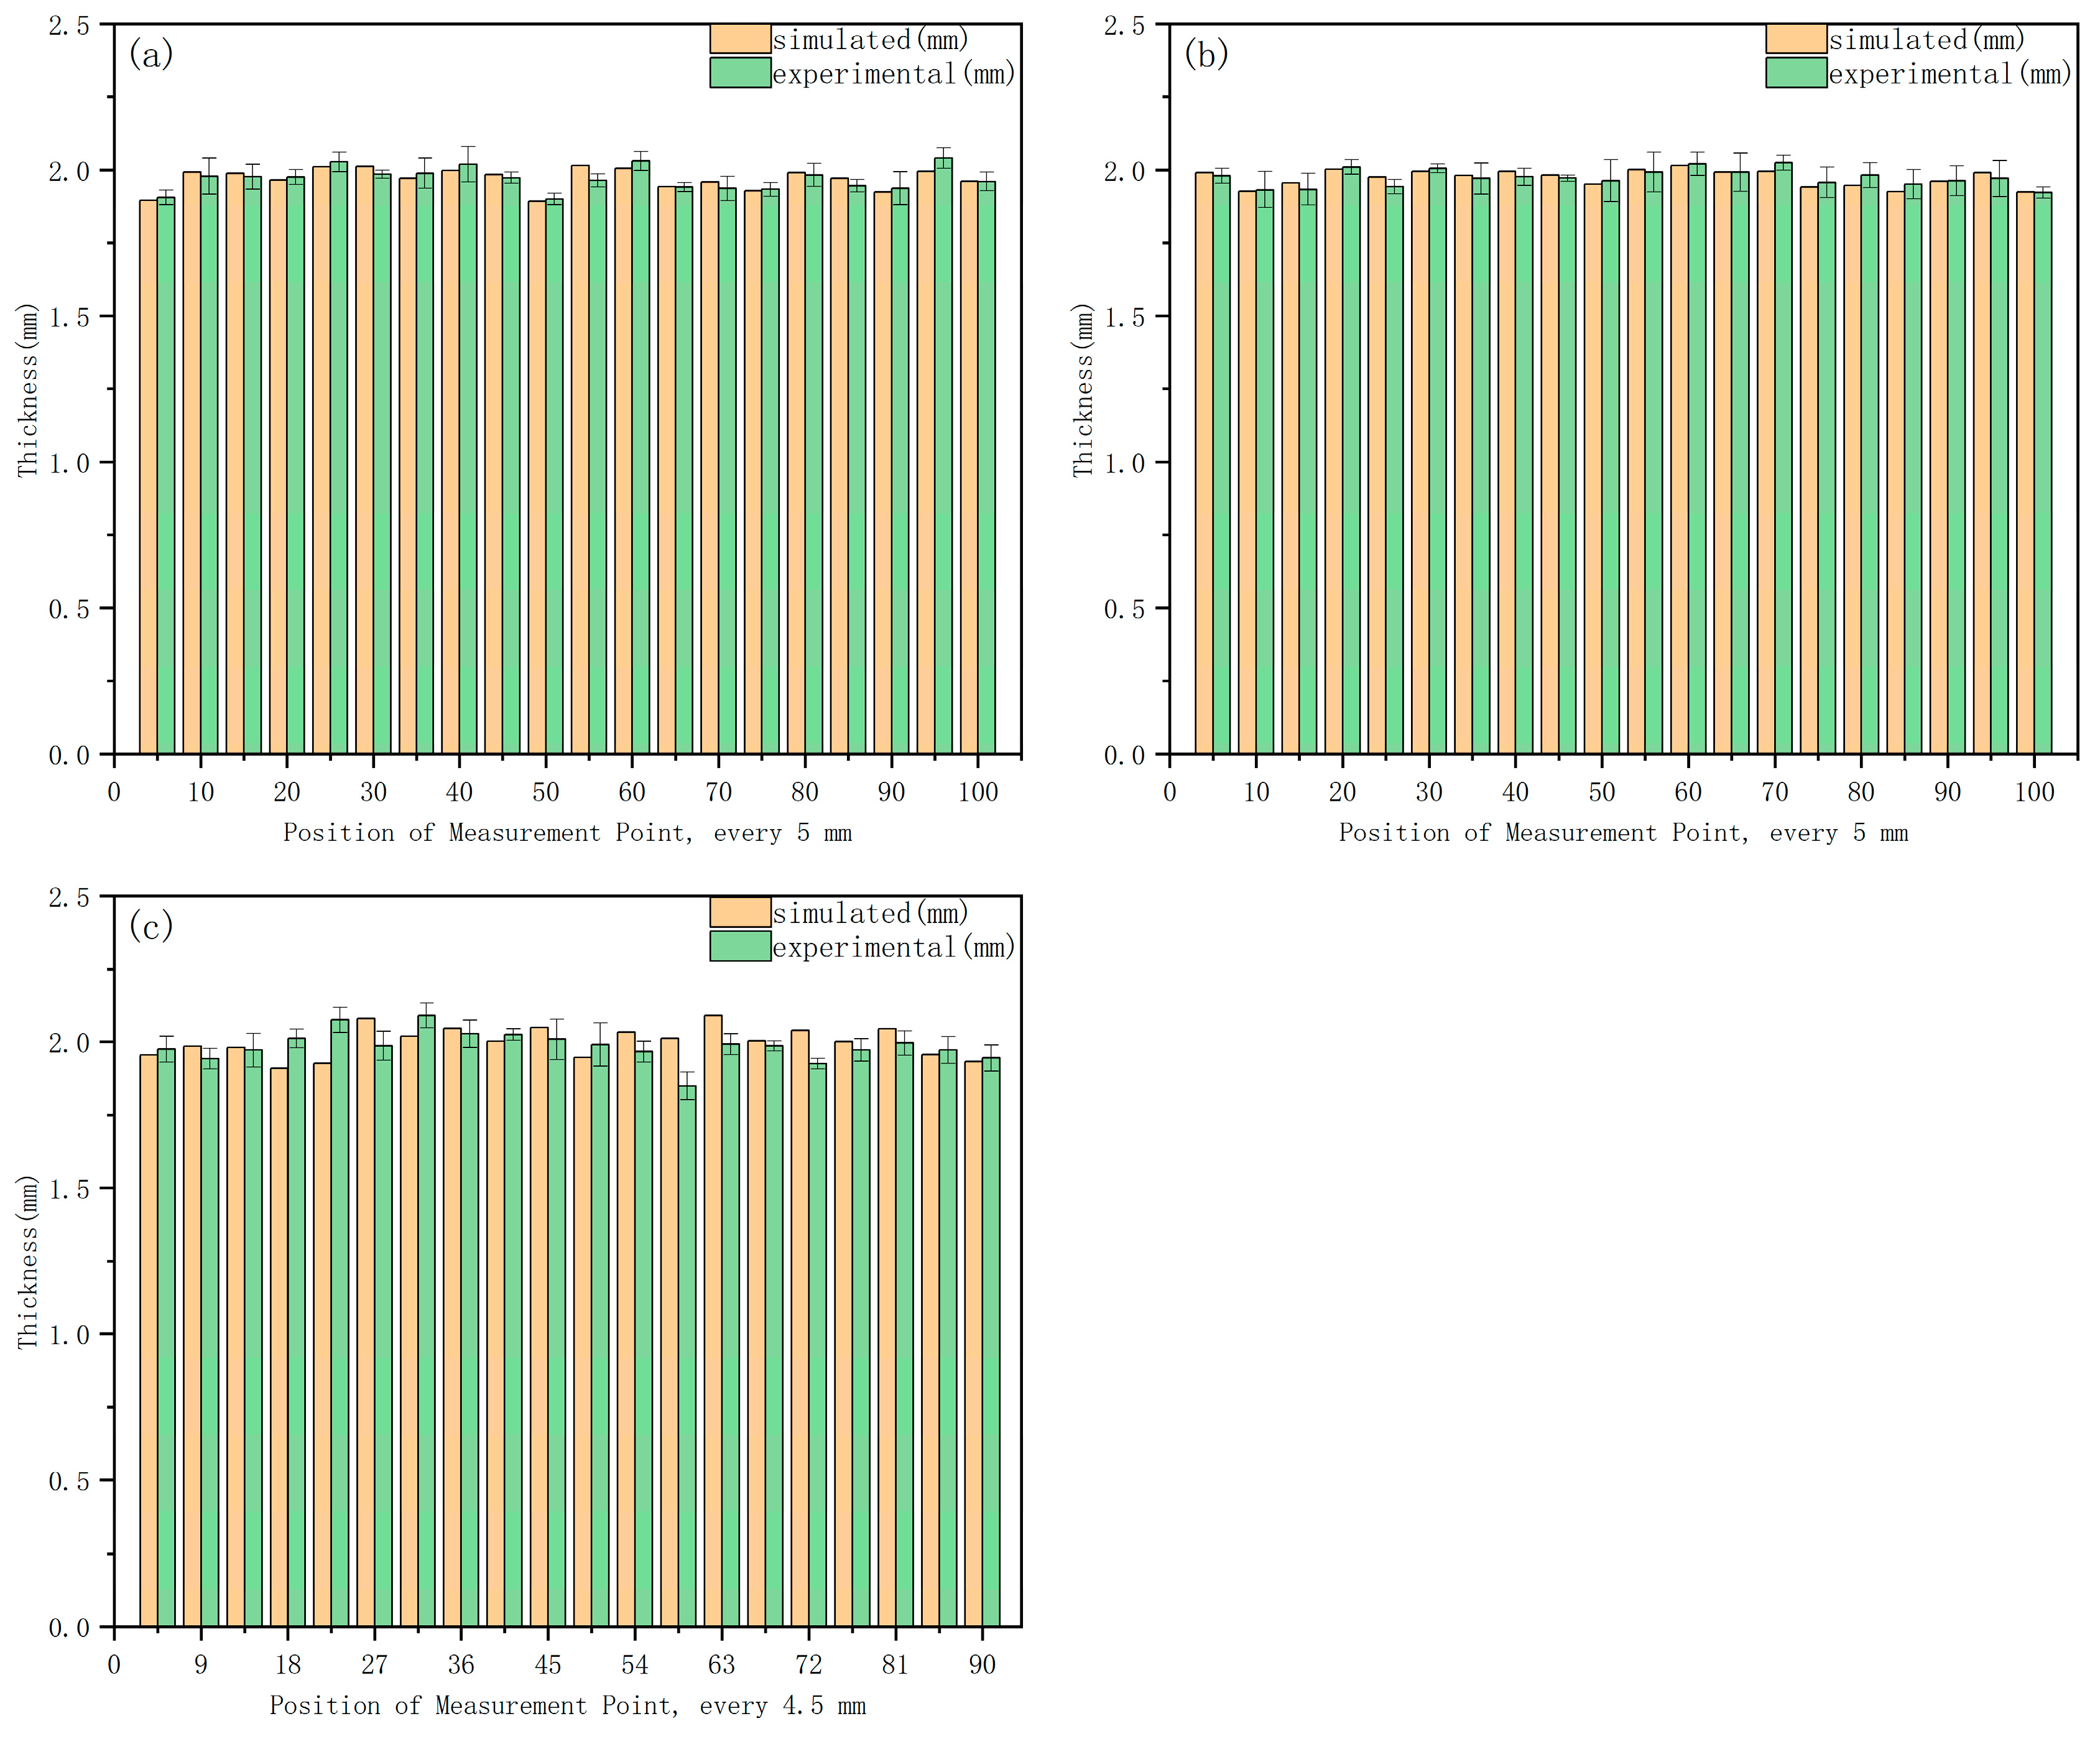
As shown in Table 5, the thinning rates were obtained from the PO-BP neural network and finite element simulation. These are prediction results rather than direct measurements, and therefore further validation is required. To this end, we compared the experimentally measured thickness with the simulation results at three representative cross-sections of the crash beam (a, b, and c), as indicated in Figure 1. At each cross-section, thickness values were measured at 20 positions and compared with the corresponding simulation results, as shown in Figure 14a–c. The results indicate that the experimentally measured thickness closely matches the simulation results, with deviations generally within 5%. In particular, the mean absolute error (MAE) between simulation and measurement is 0.024 for cross-section a, 0.018 for cross-section b, and 0.021 for cross-section c, further demonstrating the reliability of the predictions in Table 5.
In addition, Figure 13 shows that the crash beam manufactured under the optimal process condition matches the target shape and dimensions. Therefore, the consistency among the predicted thinning rates, the validated thickness distribution, and the final geometry collectively confirms the robustness and reliability of the proposed me.

6. Conclusions

This study focused on the hot stamping forming process of 7075 aluminum alloy crash beams and established a prediction model based on BP neural networks to explore the nonlinear relationship between process parameters and thinning rate. The baseline BP model achieved an R2 of 0.702, MAE of 0.0667, MSE of 0.0113, RMSE of 0.106, and MAPE of 20.8%, indicating limited predictive capacity. After introducing six bio-inspired intelligent optimization algorithms, the predictive accuracy was significantly enhanced. Compared with the baseline model, the GWO-BP improved R2 by 16.5%, reduced RMSE by 18.9%, and lowered MAPE by 6.7%, while SSA-BP improved R2 by 11.5% but increased MAPE to 25.3%. The CPO-BP model achieved a 21.8% improvement in R2, with MSE and RMSE reduced by 61.9% and 38.7%, respectively. The GOOSE-BP model improved R2 by 13.4% and decreased RMSE by 33.0%, though its MAPE reduction was marginal at only 0.5%. The DBO-BP model showed a modest 3.4% improvement in R2, with relatively larger errors in MAPE and RMSE. Among all algorithms, the Parrot Optimizer (PO-BP) achieved the best overall performance, raising R2 by 27.3% (0.702 → 0.894), reducing RMSE by 45.3%, lowering MSE by 69.0%, and decreasing MAPE by 27.1%, thereby demonstrating superior fitting and generalization ability.
Furthermore, the integration of the GA with the PO-BP model yielded optimized process parameters of 313 °C, 108 mm·s−1, μ = 0.14, and a blank holder force of 55 KN, which reduced the maximum thinning rate to 17.0%, with only 1.16% error compared with experimental validation (17.2%). These results confirm the accuracy and practical feasibility of the optimization. Overall, combining BP neural networks with intelligent optimization algorithms effectively improved the quality of hot stamping forming, with the GA-assisted PO-BP model proving to be the most reliable and efficient, achieving 27–69% error reduction compared with the baseline BP model. This framework provides a robust and practical solution for the rapid optimization of complex process parameters under smart manufacturing conditions.

Author Contributions

Conceptualization, Z.Z.; methodology, R.Q.; validation, R.Q., Z.Z. and H.J.; formal analysis, R.Q.; investigation, M.R. and T.L.; resources, R.Q.; data curation, H.J.; writing—original draft preparation, R.Q.; writing—review and editing, R.Q.; supervision, Z.Z. All authors have read and agreed to the published version of the manuscript.

Funding

This research received no external funding.

Data Availability Statement

The original contributions presented in this study are included in the article. Further inquiries can be directed to the corresponding author.

Acknowledgments

We would like to thank Huihui Yang of LingYun GNS Technology Co., Ltd. for his support and help in the finite element simulation. We would like to thank the anonymous reviewers for their helpful remarks.

Conflicts of Interest

The authors declare no conflicts of interest.

References

  1. Yang, Z.; Jia, P.; Liu, W.; Yin, H. Car ownership and urban development in Chinese cities: A panel data analysis. J. Transp. Geogr. 2017, 58, 127–134. [Google Scholar] [CrossRef]
  2. Zhang, J.; Ning, Y.L.; Peng, B.D.; Wang, Z.H.; Bi, D.S. Numerical simulation of the stamping forming process of alloy automobile panel. In Proceedings of the 6th International Conference on Physical and Numerical Simulation of Materials Processing (ICPNS), Guilin, China, 16–19 November 2010. [Google Scholar]
  3. Al-Alimi, S.; Yusuf, N.K.; Ghaleb, A.M.; Lajis, M.A.; Shamsudin, S.; Zhou, W.; Altharan, Y.M.; Saif, Y.; Didane, D.H.; Adam, A.; et al. Recycling aluminium for sustainable development: A review of different processing technologies in green manufacturing. Results Eng. 2024, 23, 1–8. [Google Scholar] [CrossRef]
  4. Zhang, W.; Xu, J. Advanced lightweight materials for automobiles: A review. Mater. Des. 2022, 221, 1–15. [Google Scholar] [CrossRef]
  5. Heggemann, T.; Homberg, W.; Sapli, H. Combined curing and forming of fiber metal laminates. In Proceedings of the 23rd International Conference on Material Forming (ESAFORM), Online, 4–8 May 2020. [Google Scholar]
  6. Huang, J.; Huang, B.; Qiao, X.B.; He, M.X.; Xie, L.Q.; Wang, X.S. Application and Challenge of Deformed Aluminum Alloys in Automotive Lightweight. Automob. Technol. Mater. 2022, 15–18. [Google Scholar]
  7. Li, S.S.; Yue, X.; Li, Q.Y.; Peng, H.L.; Dong, B.X.; Liu, T.S.; Yang, H.Y.; Fan, J.; Shu, L.S.; Jiang, Q.C.; et al. Development and applications of aluminum alloys for aerospace industry. J. Mater. Res. Technol. 2023, 27, 944–983. [Google Scholar] [CrossRef]
  8. Liu, Z.S.; Li, Y.D.; Zhao, J.W.; Fu, L.; Li, L.; Yu, K.; Mao, X.; Zhao, P. Study on Aluminum Alloy Materials and Application Technologies for Automotive Lightweighting. Chin. J. Mater. Sci. Prog. 2022, 41, 786–795+807. [Google Scholar]
  9. Liu, Y.; Geng, H.C.; Zhu, B.; Wang, Y.L.; Zhang, Y.S. Research Progress on High-Strength Aluminum Alloy Efficient Hot Stamping Process. Forg. Technol. 2020, 45, 1–12. [Google Scholar]
  10. Behrens, B.A.; Nürnberger, F.; Bonk, C.; Hübner, S.; Behrens, S.; Vogt, H. Influences on the formability and mechanical properties of 7000-aluminum alloys in hot and warm forming. In Proceedings of the 36th IDDRG Conference on Materials Modelling and Testing for Sheet Metal Forming, Munich, Germany, 2–6 July 2017. [Google Scholar]
  11. Li, H.H. Study on the Hot Stamping Deformation Behavior and Microstructure Evolution of 7075 Aluminum Alloy Body Components. Master’s Thesis, Jilin University, Changchun, China, 2020. [Google Scholar]
  12. Caudill, M. Neural networks primer, part I. AI Expert 1987, 2, 46–52. [Google Scholar]
  13. Attar, H.R.; Zhou, H.S.; Foster, A.; Li, N. Rapid feasibility assessment of components to be formed through hot stamping: A deep learning approach. J. Manuf. Process. 2021, 68, 1650–1671. [Google Scholar] [CrossRef]
  14. Quan, G.Z.; Wang, T.; Li, Y.L.; Zhan, Z.Y.; Xia, Y.F. Artificial Neural Network Modeling to Evaluate the Dynamic Flow Stress of 7050 Aluminum Alloy. J. Mater. Eng. Perform. 2016, 25, 553–564. [Google Scholar] [CrossRef]
  15. Pandya, K.S.; Roth, C.C.; Mohr, D. Strain Rate and Temperature Dependent Fracture of Aluminum Alloy 7075: Experiments and Neural Network Modeling. Int. J. Plast. 2020, 135, 1–15. [Google Scholar] [CrossRef]
  16. Zheng, G.; Ge, L.H.; Shi, Y.Q.; Li, Y.; Yang, Z. Dynamic Rolling Force Prediction of Reversible Cold Rolling Mill Based on BP Neural Network with Improved PSO. In Proceedings of the Chinese Automation Congress (CAC), Xi’an, China, 30 November–2 December 2018. [Google Scholar]
  17. Xiao, W.; Wang, B.; Zhou, J.; Ma, W.; Yang, L. Optimization of aluminium sheet hot stamping process using a multi-objective stochastic approach. Eng. Optim. 2016, 48, 2173–2189. [Google Scholar] [CrossRef]
  18. Huanhuan, L.; Zhili, H.; Lin, H.; Yizhe, C. Optimization of Hot Forming-Quenching Integrated Process Parameters for Complex Aluminum Alloy Automotive Components. Rare Met. Mater. Eng. 2019, 48, 1029–1035. [Google Scholar]
  19. Fan, Y.T.; Yang, W.Y. A backpropagation learning algorithm with graph regularization for feedforward neural networks. Inf. Sci. 2022, 607, 263–277. [Google Scholar] [CrossRef]
  20. Singh, A.K.; Singhal, D.; Kumar, R. Machining of aluminum 7075 alloy using EDM process: An ANN validation. Mater. Today: Proc. 2020, 26, 2839–2844. [Google Scholar] [CrossRef]
  21. Liu, X.F.; Hu, Y.H.; Huang, W.J. Research on Simulation Technology for Auto Panel in Drawing Forming Based on Autoform. In Proceedings of the International Conference on Advanced Engineering Materials and Technology (AEMT2011), Sanya, China, 29–31 July 2011. [Google Scholar]
  22. Garg, V.V.; Stogner, R.H. Hierarchical Latin Hypercube Sampling. J. Am. Stat. Assoc. 2017, 112, 673–682. [Google Scholar] [CrossRef]
  23. Olsson, A.; Sandberg, G.; Dahlblom, O. On Latin hypercube sampling for structural reliability analysis. Struct. Saf. 2003, 25, 47–68. [Google Scholar] [CrossRef]
  24. Ramanuj Kumar, A.K.S.; Mishra, P.C.; Das, R.K. Comparative study on machinability improvement in hard turning using coated and uncoated carbide inserts: Part II modeling, multi-response optimization, tool life, and economic aspects. Adv. Manuf. 2018, 6, 155–175. [Google Scholar] [CrossRef]
  25. Singh, S.; Bansal, J.C. Mutation-Driven Grey Wolf Optimizer with Modified Search Mechanism. Expert Syst. Appl. 2022, 194, 1–10. [Google Scholar] [CrossRef]
  26. Xue, J.K.; Shen, B. A survey on sparrow search algorithms and their applications. Int. J. Syst. Sci. 2024, 55, 814–832. [Google Scholar] [CrossRef]
  27. Zang, J.J.; Cao, B.Y.; Hong, Y.M. Research on the Fiber-to-the-Room Network Traffic Prediction Method Based on Crested Porcupine Optimizer Optimization. Appl. Sci. 2024, 14, 4840. [Google Scholar] [CrossRef]
  28. El-Kenawy, E.S.M.; Khodadadi, N.; Mirjalili, S.; Abdelhamid, A.A.; Eid, M.M.; Ibrahim, A. Greylag Goose Optimization: Nature-Inspired Optimization Algorithm. Expert Syst. Appl. 2024, 238, 1–15. [Google Scholar] [CrossRef]
  29. Xu, D.M.; Li, Z.; Wang, W.C. An Ensemble Model for Monthly Runoff Prediction Using Least Squares Support Vector Machine Based on Variational Modal Decomposition with Dung Beetle Optimization Algorithm and Error Correction Strategy. J. Hydrol. 2024, 629, 1–10. [Google Scholar] [CrossRef]
  30. Saad, M.R.; Emam, M.M.; Houssein, E.H. An Efficient Multi-Objective Parrot Optimizer for Global and Engineering Optimization Problems. Sci. Rep. 2025, 15, 1–10. [Google Scholar] [CrossRef] [PubMed]
  31. Li, F.C.; Zhang, T.Y. Study on Genetic Algorithm Based on Schema Mutation and Its Performance Analysis. In Proceedings of the 2nd International Symposium on Electronic Commerce and Security, Nanchang, China, 22–24 May 2009. [Google Scholar]
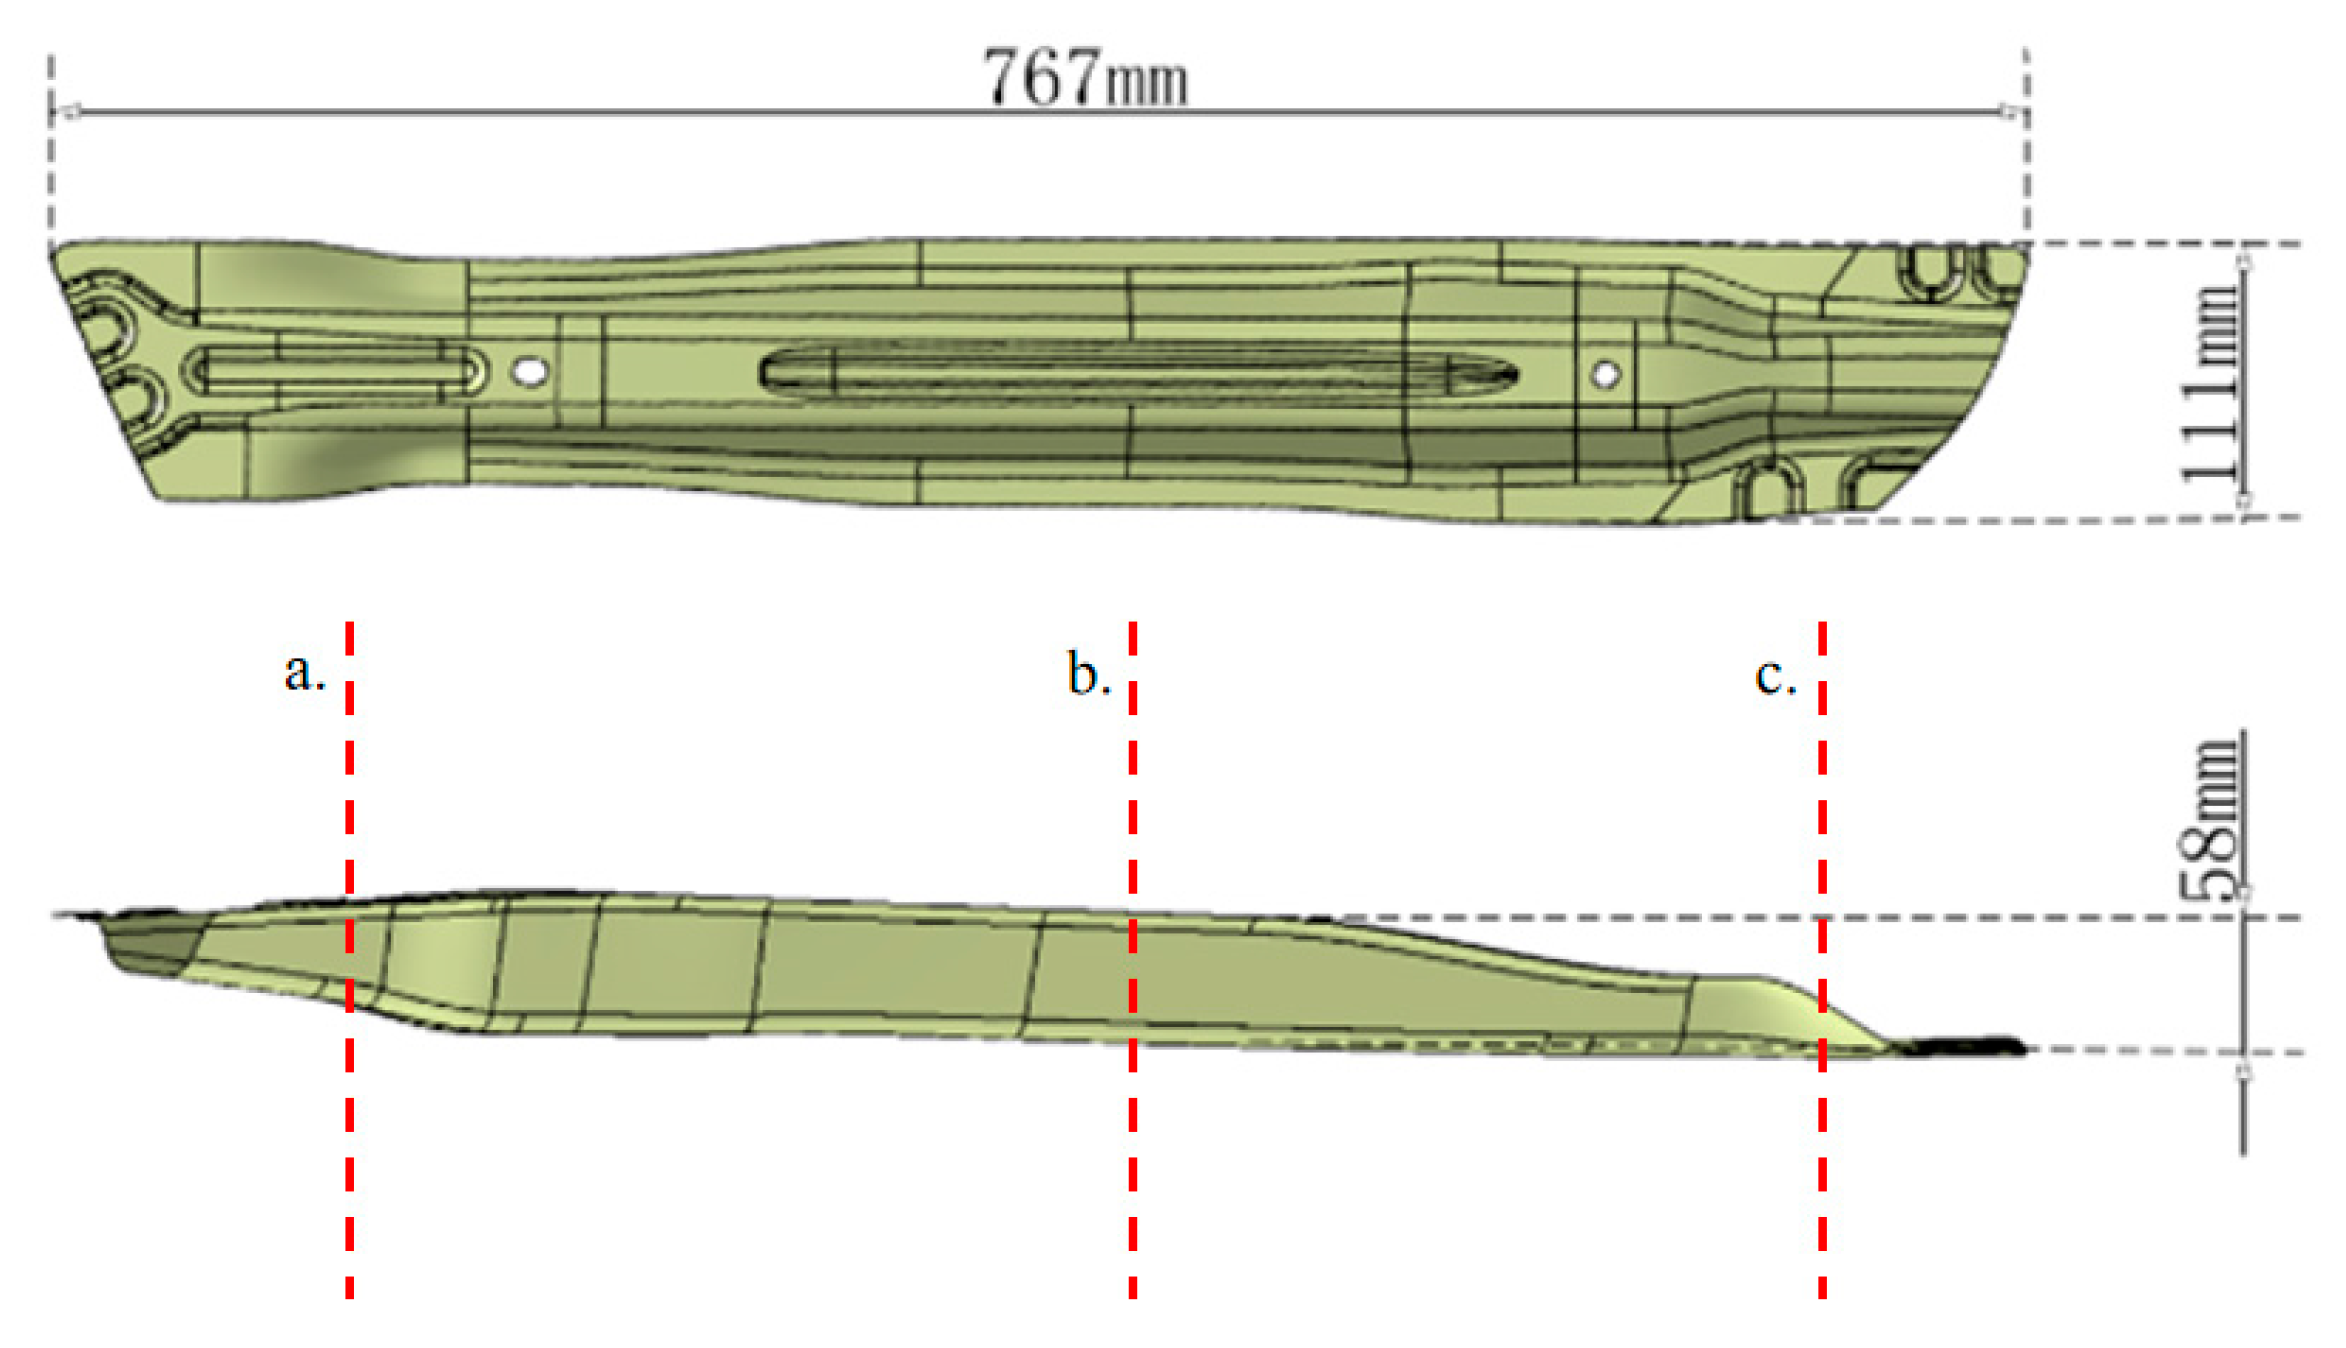
Figure 1. Geometry of Crash Beam.
Metals 15 01047 g001
Figure 2. True Stress–Strain Curves of 7075-T6 Aluminum Alloy (a) under a range of temperatures from 300 °C to 450 °C at a strain rate of 0.1/s (b) under a range of strain rates at a constant temperature of 300 °C.
Metals 15 01047 g002
Figure 3. Finite Element Model of Crash Beam Hot Stamping.
Metals 15 01047 g003
Figure 4. BP neural network architecture.
Metals 15 01047 g004
Figure 5. Flow chart of the Grey Wolf Optimizer (GWO) for BP neural network parameter optimization.
Metals 15 01047 g005
Figure 6. Flow chart of the Sparrow Search Algorithm (SSA) for BP neural network parameter optimization.
Metals 15 01047 g006
Figure 7. Flow chart of the Crested Porcupine Optimizer (CPO) for BP neural network parameter optimization.
Metals 15 01047 g007
Figure 8. Flow chart of the Goose Optimization Algorithm (GOOSE) for BP neural network parameter optimization.
Metals 15 01047 g008
Figure 9. Flow chart of the Dung Beetle Optimization (DBO) for BP neural network parameter optimization.
Metals 15 01047 g009
Figure 10. Flow chart of the Parrot Optimizer (PO) for BP neural network parameter optimization.
Metals 15 01047 g010
Figure 11. Comparison between actual and predicted values of the normalized maximum thinning rate.
Metals 15 01047 g011
Figure 12. Hot stamping die.
Metals 15 01047 g012
Figure 13. Crash beam produced by the optimal process parameters.
Metals 15 01047 g013
Figure 14. Comparison of Simulated and Measured Thickness. (a) Section A of the part. (b) Section B of the part. (c) Section C of the part.
Metals 15 01047 g014
Table 1. Chemical composition of 7075 aluminum alloy (wt.%).
SiFeCuMnMgCrZnAl
≤0.4≤0.51.2–2.0≤0.32.1–2.90.18–0.285.1–6.1Bal
Table 2. Process parameter samples and simulation results.
No.Temperature
(°C)
Stamping Speed (mm·s−1)Blank Holder Force (KN)Friction CoefficientThinning Rate (%)
1371 384 2330.36 0.443
2363 230 198 0.32 0.286
3355 101 242 0.38 0.790
4322 108 43 0.36 0.176
533474 27 0.14 0.181
6415 246 221 0.27 0.291
7300 299870.21 0.174
8326218 259 0.21 0.210
9356 632280.12 0.172
1033834 248 0.30 0.379
......
100377 380 103 0.14 0.178
Table 3. BP Model prediction results.
MAEMSERMSEPMAPER2
0.06670.01130.1060.2080.702
Table 4. Evaluation of different optimization models.
BpGWOSSACPOGOOSEDBOPO
MAE0.06670.05430.07690.05320.05550.07770.0434
MSE0.01130.00740.01210.00430.00510.01390.0035
RMSEP0.1060.0860.1100.0650.0710.1180.058
MAPE0.2080.1940.2530.2210.2180.2530.152
R20.7020.8180.7830.8550.7960.7260.894
run time/s7.399.2721.6912.9711.6710.7316.68
Table 5. Comparison of predicted thinning rate and simulation results.
PO-BP Results (%)Simulation Results (%) Error Value (%)Error Rate (%)
17.017.20.21.16
Disclaimer/Publisher’s Note: The statements, opinions and data contained in all publications are solely those of the individual author(s) and contributor(s) and not of MDPI and/or the editor(s). MDPI and/or the editor(s) disclaim responsibility for any injury to people or property resulting from any ideas, methods, instructions or products referred to in the content.