Article

Multiscale Modeling and Analysis of Hydrogen-Enhanced Decohesion Across Block Boundaries in Low-Carbon Lath Martensite

by
Ivaylo H. Katzarov
1,2
1
Institute of Metal Science, Equipment and Technologies, Bulgarian Academy of Sciences, 67 Shipchenski Prohod St., 1754 Sofia, Bulgaria
2
National Center for Mechatronics and Clean Technologies, 8 Kliment Ohridski Blvd., Building 8, 1756 Sofia, Bulgaria
Metals 2025, 15(6), 660; https://doi.org/10.3390/met15060660
Submission received: 12 May 2025 / Revised: 9 June 2025 / Accepted: 11 June 2025 / Published: 13 June 2025
(This article belongs to the Special Issue Hydrogen Embrittlement of Metals: Behaviors and Mechanisms)

Abstract

:
Low-carbon lath martensite is highly susceptible to hydrogen embrittlement due to the presence of a high density of lath/block boundaries. In this study, I employ a continuum decohesion model to investigate the effects of varying hydrogen concentrations and tensile loads on the cohesive strength of low- and high-angle block boundaries. The thermodynamic properties of the cohesive zone are described using excess variables, which establish a link between atomistic energy calculations and the continuum model for gradual decohesion at a grain boundary. The aim of this study is to develop an in-depth understanding of how hydrogen affects the cohesive strength of block boundaries in a lath martensitic structure by integrating continuum and atomistic computational modeling and to apply the resulting insights to investigate the effects of varying hydrogen concentrations and tensile loads on interface decohesion. I incorporate hydrogen mobility and segregation at low- and high-angle twist boundaries in body-centered cubic (bcc) Fe to quantify the hydrogen-induced effects on progressive decohesion under tensile stress. A constant hydrogen flux through the free surfaces of a bicrystal containing a block boundary is imposed to simulate realistic boundary conditions. The results of the simulations show that, in the presence of hydrogen flux, separation across the block boundaries occurs at a tensile load significantly lower than the critical stress required for rupture in a hydrogen-free lath martensitic structure.

Graphical Abstract

1. Introduction

Lath martensite, known for its excellent plasticity and toughness, is one of the primary strength-contributing microstructural components in martensitic steels. It is widely used in the development of high-strength steels and is considered a promising candidate for next-generation advanced high-strength steels. However, it is well established that high-strength steels are susceptible to hydrogen embrittlement (HE) [1,2,3]. The presence of hydrogen significantly deteriorates the mechanical properties of lath martensitic steels, leading to reduced ductility and strength. Therefore, future generations of advanced high-strength steels must combine superior mechanical performance with increased resistance to HE.
Despite extensive research, there is still considerable debate in the literature concerning the mechanisms responsible for hydrogen-induced degradation. Several theories have been proposed, with two of the most widely discussed being the hydrogen-enhanced decohesion (HEDE) and the hydrogen-enhanced localized plasticity (HELP) mechanisms.
The HELP mechanism [4,5,6] suggests that hydrogen embrittlement arises from increased dislocation mobility and a reduction in the elastic interactions between dislocations and obstacles [7,8]. These effects promote the localization of plastic deformation, which is believed to facilitate crack initiation at lower stress levels compared to hydrogen-free conditions.
In contrast, the HEDE mechanism attributes hydrogen embrittlement to a reduction in atomic bond strength caused by hydrogen segregation at grain boundaries (GBs) and phase interfaces [9,10]. This segregation weakens the cohesive strength of the GBs, making them more susceptible to fracture. When the applied stress surpasses this reduced cohesive strength, cracks can initiate and propagate along these boundaries. Unlike HELP, there has been little direct experimental evidence supporting the mechanism of HEDE. Observing this process experimentally is challenging due to the high diffusivity of hydrogen and the rapid nature of the failure process. Therefore, atomistic studies are the preferred method for advancing our understanding of HEDE [11,12].
Fractographic analyses of lath martensite reveal that, in the absence of hydrogen, fracture surfaces typically display transgranular cracks resulting from the plastic coalescence of microvoids [13,14]. Experimental observations indicate that lath martensite is particularly susceptible to hydrogen embrittlement (HE), primarily due to the high density of lath/block boundaries [15,16]. A lath martensite grain consists of packets, which are subdivided into blocks and sub-blocks composed of parallel martensite laths with a (110) habit plane. The block boundaries within these structures can be either low-angle or high-angle twist boundaries [17,18]. The introduction of hydrogen promotes the formation of intergranular “flat” cracks along prior austenite grain boundaries, as well as “quasi-cleavage” cracks along the lath/block boundaries [14]. It has been proposed that multiple HE mechanisms may operate concurrently [19]. Both types of cracking are preceded by increased dislocation activity, consistent with the hydrogen-enhanced localized plasticity (HELP) mechanism. “Quasi-cleavage” fracture is assumed to occur when the cohesive strength of the block boundaries is sufficiently reduced by hydrogen trapped at prior austenite or lath/block boundaries [20,21,22,23,24]. The localization of hydrogen at these interfaces is believed to drive hydrogen-enhanced decohesion (HEDE), thereby contributing to the embrittlement of lath martensitic steels [25]. Lack of understanding of the mechanisms of HE impedes the development of new steels that are resistant to the deterioration of mechanical properties caused by hydrogen. A higher level of understanding of H-induced degradation mechanisms will be key to the success of the next generation of lath martensitic steels. The harmful effects of hydrogen motivate the present study, which aims to achieve a higher level of understanding of the role of the HEDE mechanism in reducing the cohesive strength at the block boundaries in lath martensitic structure. Unlike HELP, which is based on experimental results, HEDE is supported by theoretical studies. First-principles calculations in [26,27,28] show a reduction in the cohesive strength of a bcc Fe with hydrogen segregation in the Σ 3 ( 111 ) GB. Those studies have not investigated the effect of mobile hydrogen. Without considering H migration from the bulk to the cohesive zone, the initial hydrogen interfacial concentration is relatively low, and the effect on the cohesive strength of GB is small.
To quantitatively assess the impact of hydrogen on the cohesive strength of grain boundaries (GBs) at varying bulk hydrogen concentrations, it is essential to consider both the mobility and segregation of hydrogen within the cohesive zone. First-principles studies [29,30] have shown that mobile hydrogen significantly contributes to the decohesion of Fe. When hydrogen atoms are capable of migrating from the bulk to grain boundaries and become trapped at segregation sites, this mobility leads to an increased hydrogen concentration at the interface, thereby reducing the cohesive strength. Two limiting cases for the role of impurity diffusion in decohesion have been examined in [31,32]: (i) slow decohesion, where impurity diffusion to the interface is much faster than the rate of separation; and (ii) fast separation, where diffusion is too slow for impurities to reach the interface during decohesion, effectively isolating the interface from the bulk. A more general case where the rates of separation and diffusion are comparable has been studied by Mishin et al. [33]. In their framework, impurity exchange at the bulk–interface boundary is modeled as being proportional to the difference in chemical potentials between the bulk and the cohesive zone. Their analysis assumes that the interface is in mechanical and thermal equilibrium with the surroundings but not in equilibrium with respect to hydrogen exchange—consistent with conditions of local thermodynamic equilibrium.
An extension of this model has been proposed in [34], where the process of uniform transgranular separation under tensile stress along a (111) plane in bcc Fe is examined under conditions where local thermodynamic equilibrium between the interface and the environment is disrupted. In the absence of external loading, the cohesive zone remains in an equilibrium state, and the interfacial hydrogen concentration is relatively low. However, upon the application of tensile stress, the separation process initiates, leading to a disruption of this equilibrium and triggering hydrogen exchange between the interface and its environment. The resulting increase in hydrogen concentration within the cohesive zone alters the mechanical response of the material, leading to a reduction in the cohesive strength of the separating atomic planes. This modeling approach can also be applied to the study of intergranular fracture.
In the present paper, I apply the model proposed in [34] to investigate the process of uniform intergranular separation under tensile stress along two twist boundaries in bcc Fe, corresponding to the lowest- and highest-angle block boundaries in the lath martensitic structure. The paper is organized as follows. For completeness, Section 2 presents the continuum decohesion model originally introduced by Rice [31] and Rice and Hirth [35] and subsequently extended in [33,34]. In Section 3, the connection between atomistic simulations and the continuum model for low- and high-angle martensitic block boundaries, which are treated as the cohesive zone, is established. I then examine the process of gradual decohesion under tensile loading and a fixed hydrogen flux through the free surfaces of a bicrystal containing a block boundary. Section 4 presents the results and discussion, and our conclusions are summarized in Section 5.

2. Materials and Methods

2.1. Continuum Decohesion Model

I consider uniform separation of a bicrystal along a twist boundary parallel to the (110) plane in bcc Fe, subjected to a tensile stress applied normal to the interface. The region between the adjacent atomic planes forming the twist boundary defines the cohesive zone, which is the region where decohesion is expected to occur. Upon application of tensile stress, the two elastically strained bulk crystals separate by a displacement δ . Hydrogen charging of the bicrystal is modeled by imposing a constant hydrogen flux through the free surfaces parallel to the grain boundary. The hydrogen distribution at the interface and within both crystals is assumed to be laterally uniform. Following the approach in [33], I assume that the interface is in a state of local thermodynamic equilibrium. Furthermore, it is assumed that the interface has sufficient time to reach a new equilibrium state after each act of hydrogen exchange with the bulk. As postulated in [33], the driving force of hydrogen exchange between the interface and the bulk is governed by the difference in chemical potentials of hydrogen at the cohesive zone–bulk interface, μ b * , and within the cohesive zone, μ . Statistical mechanics calculations in [34] support the assumption that hydrogen–hydrogen interactions can be neglected, allowing the use of an ideal solution model for the hydrogen chemical potentials.
For the chemical potential in the bulk, μ b , we may write:
μ b = μ 0 + k B T l n θ b 1 θ b
where μ 0 is its standard value [36], and θ b is the fraction of the occupied H trap sites in the bulk. Here, k B is the Boltzmann constant, and T is the temperature. Following [33], the hydrogen exchange rate between the bulk and the cohesive zone is described by the equation:
N θ t = 1 τ k B T ( μ b * μ ) ;
where μ b * = μ b ( θ b * ) ; θ b * = θ b x   =   ± l 2 . Here, N is the number of available hydrogen sites per unit area in the cohesive zone, θ is the occupancy of those sites, τ is a characteristic relaxation time for the exchange process, and l is the width of the cohesive zone. The choice of the relaxation time τ does not influence the cohesive strength, defined as the maximum stress reached during the decohesion process. However, it significantly affects the time to rupture as it governs the rate of hydrogen exchange between the bulk and the cohesive zone. When a tensile stress σ is applied, the two halves of the crystal separate by a displacement δ . Initially, in the equilibrium state, δ = 0 . The evolution of δ is governed by the applied stress and the hydrogen concentration within the cohesive zone. The relationship between the stress and separation displacement is described by the traction–separation curve, from which δ can be determined.
σ = σ ( θ , δ )
Since the chemical potential in the cohesive zone
μ = μ θ , δ
is a function of the hydrogen occupancy θ and the separation δ along the interface, a change in separation leads to a corresponding change in the chemical potential at the GB. If the right side of Equation (2) exceeds the maximum total H flux across the interface between the cohesion zone and the bulk, the hydrogen balance in the cohesion zone can be alternatively expressed as [33]
N θ t = ( J J + )
where
J ± = 2 D N b θ b x   x = ± l 2
represents the maximum hydrogen fluxes on either side of the grain boundary. N and N b denote the number of trap sites per unit volume available for hydrogen occupation in the cohesive zone and the bulk, respectively. Fick’s law governs the bulk hydrogen diffusion on either side of the cohesive zone:
c b t = D 2 c b x 2
Here, c b denotes the hydrogen concentration in the bulk. This equation completes the mathematical formulation of the problem. The numerical procedure used to solve the coupled Equations (1)–(7) for various external loads and hydrogen concentrations in the bulk is detailed in [34].

2.2. Cohesive Zone Model

As a tensile stress is applied, the two elastically strained bulk crystals separate by a displacement δ . To study the separation of a bicrystal into two halves across the interface, it is necessary to establish a link between the continuum model and the interatomic forces governing grain boundary cohesion. This link is provided by the cohesive zone model. A rigorous connection between continuum–scale decohesion models and atomistic calculations is achieved through the use of thermodynamic excess variables that are specifically associated with the cohesive zone [37]. The cohesive zone corresponding to a twist boundary in Fe is characterized by its excess energy e and excess separation δ . In order to formulate a cohesive zone model based on excess variables, the relationship between excess energy and excess separation must be determined.

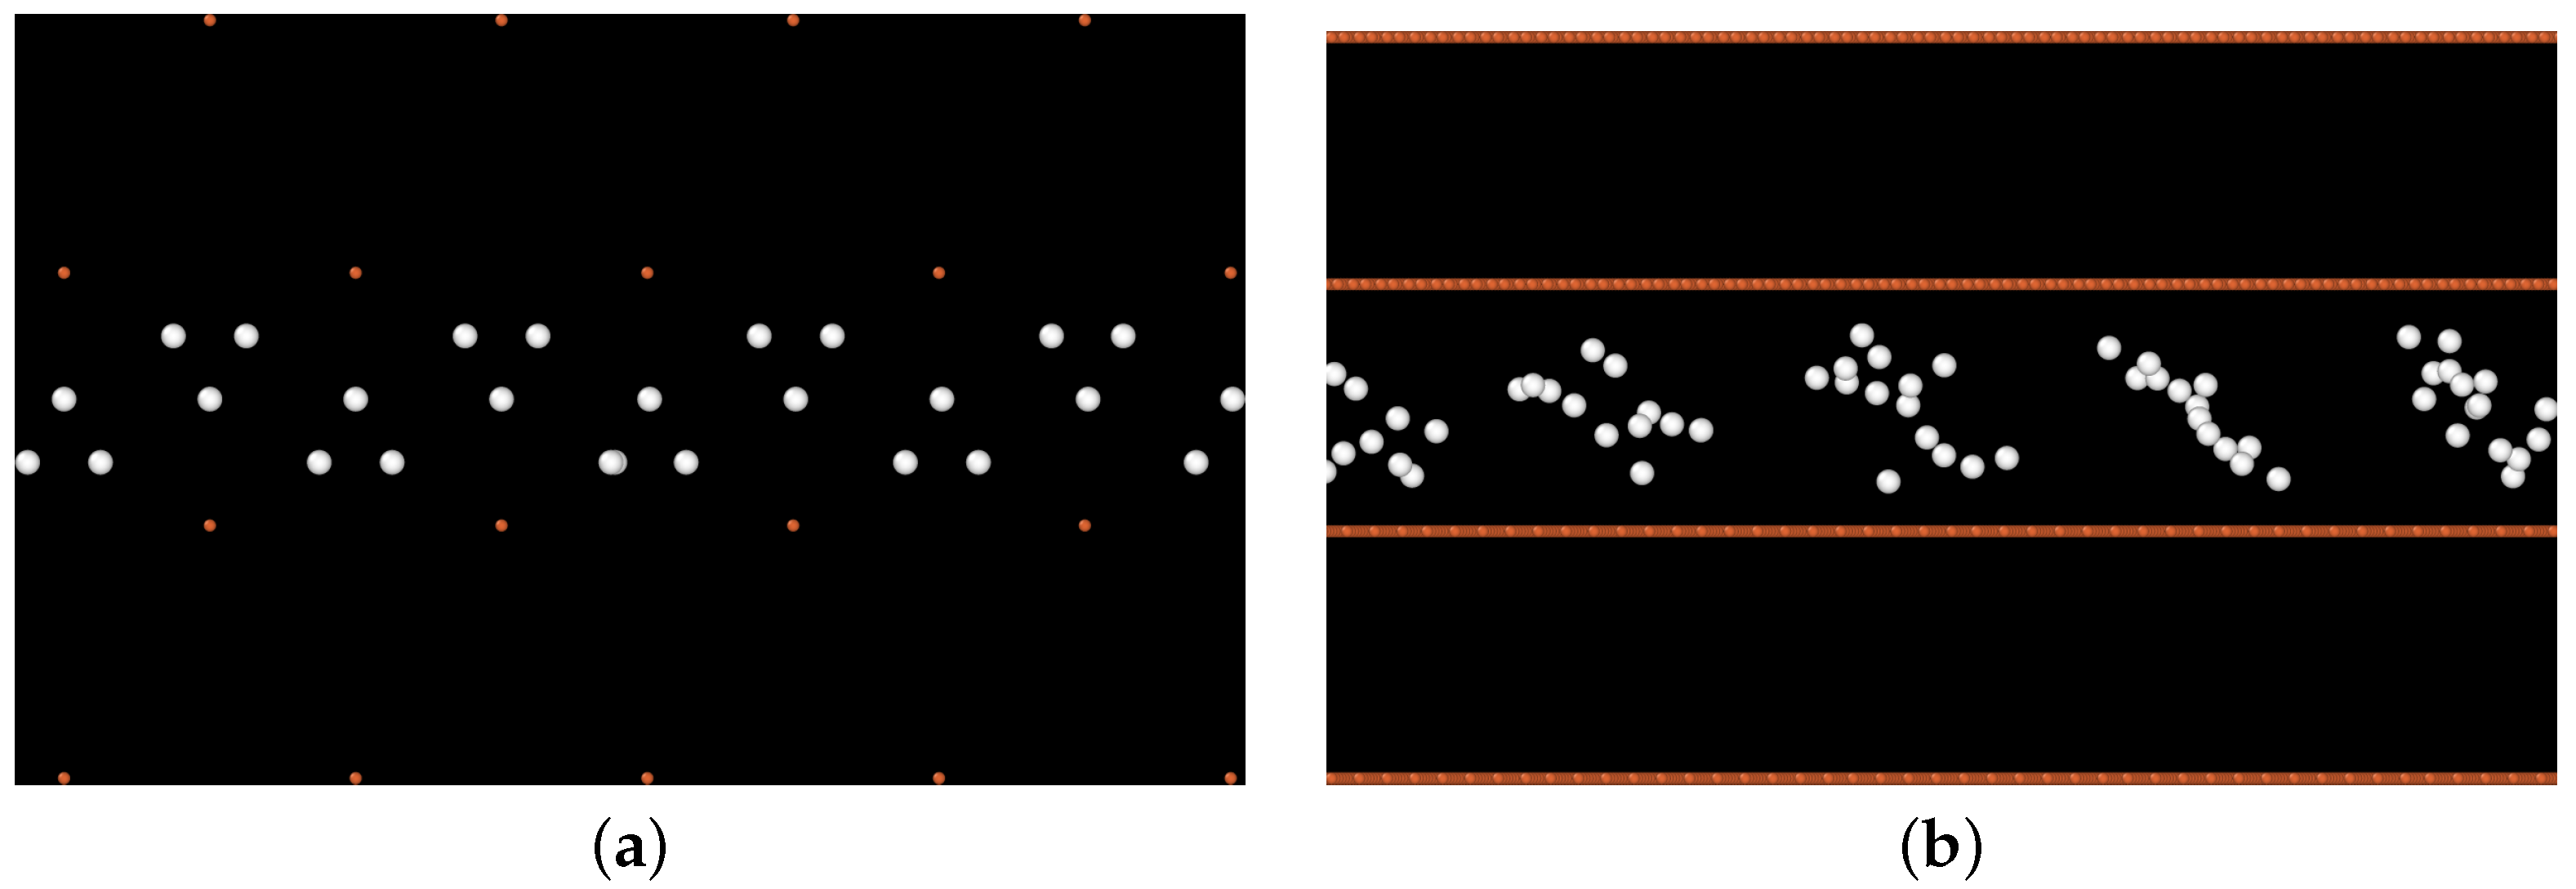
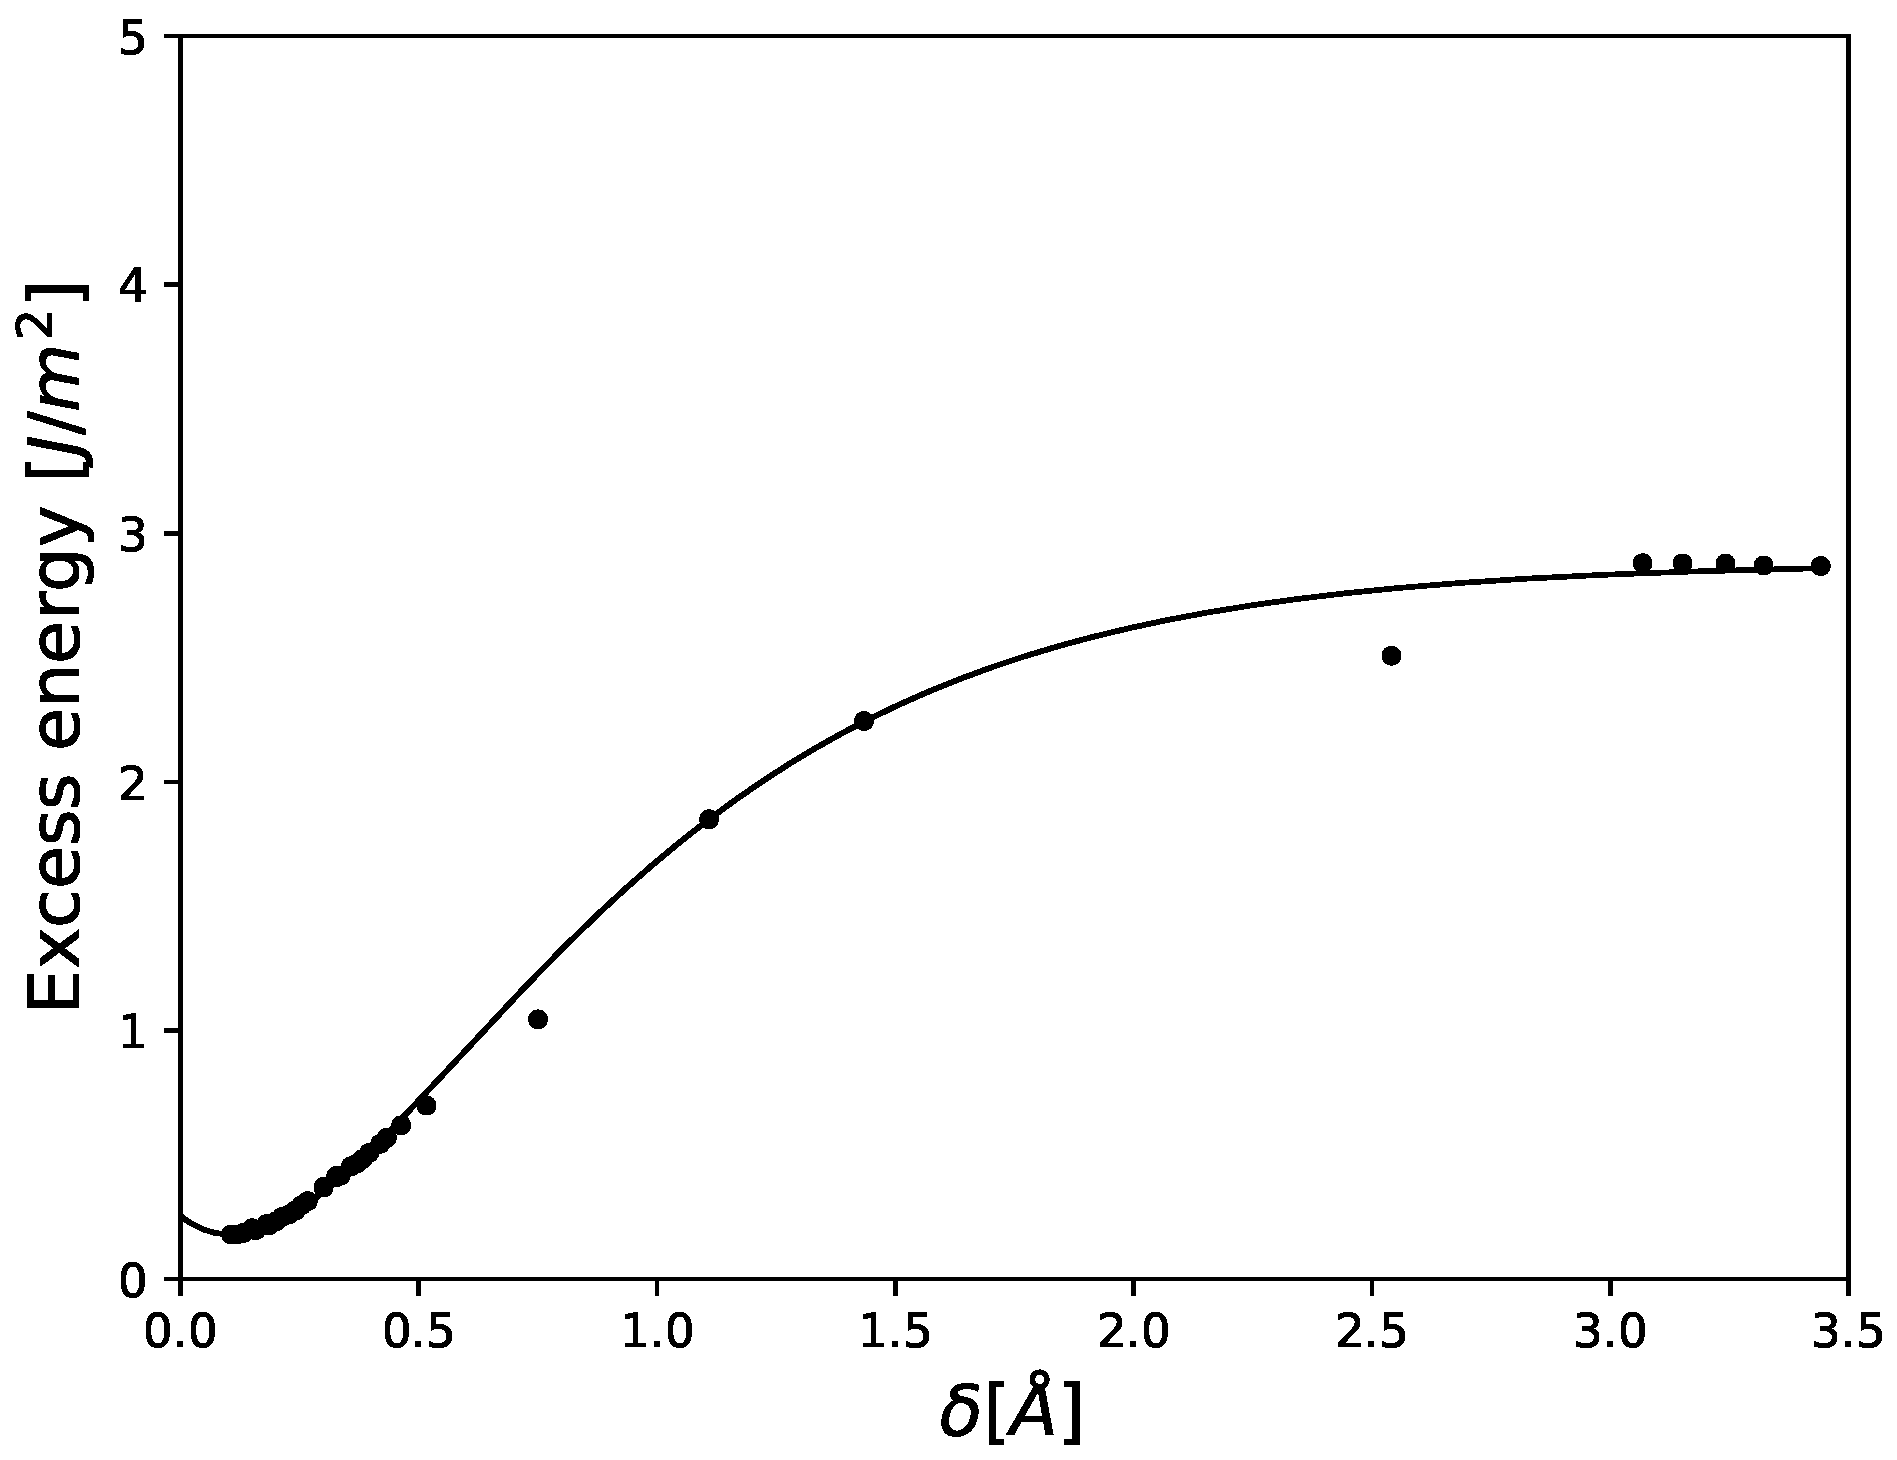
2.2.1. Cohesive Zone Model in a Pure Fe Bicrystal

In order to determine the excess variables for decohesion along a twist boundary in Fe, I construct simulation boxes containing twist GBs. Two twist angles are considered: 10.53 and 60.01 , corresponding to the lowest- and highest-angle block boundaries in the lath-martensitic structure of Fe. The supercells are created by rotating two half-grains of a perfect bcc crystal in opposite directions around the [ 011 ] direction by φ / 2 , where φ is the twist angle. The crystal is set in a Cartesian coordinate system with the following orientations; X-axis aligned with the [ 2 1 ¯ 1 ] direction, Y-axis aligned with the [ 011 ] direction, and Z-axis aligned with the [ 1 ¯ 1 ¯ 1 ] direction. The twist angle
φ = 2 a r c t a n n 2 2 m
where m and n are the integers defines coincidence site lattice (CSL) [38]. This formula ensures that periodic boundary conditions can be applied along the X- and Z-axes of the simulation box, creating a consistent and repeatable boundary. The CSL parameter, Σ , can be calculated as
Σ = 2 m 2 + n 2
where even value Σ has to be replaced by its largest odd sub-multiple. Table 1 presents the parameter Σ and integers m and n, generating the CSL for 10.53 and 60.01 twist interfaces, identified in [17,18] as the block boundaries with the lowest and highest misorientation angles, respectively.
The supercells with twist angles of 10.53 and 60.01 consist of 30 (011) planes perpendicular to the direction of elongation, and they contain 198,424 and 892,878 Fe atoms, respectively.
To determine the excess variables, it is necessary to perform a large number of atomistic calculations in a wide array of configurations by relaxing the simulation systems through energy minimization. Density functional theory is generally too costly for the relaxation of supercells comprising hundreds of thousands of atoms. To perform massive parallel calculations, I use the MEAM–type ternary Fe–C–H interatomic potential developed by Zhou et al. [39], which has been implemented in the MD code LAMMPS [40]. This potential has been shown to reasonably describe hydrogen effects on deformation characteristics and mechanisms for various microstructural variations of Fe–C steels, including martensite [39]. For this particular supercell, the excess energy per unit area is defined as
e ( σ ) = E ( σ ) ( n p 1 ) E e ( σ ) A
where E ( σ ) is the energy of the supercell at stress σ , E e ( σ ) is the elastic energy per plane of a homogeneously elongated crystal at the same stress, and A is the area of the cohesive zone [37]. Similarly, the excess width of the cohesive zone is given by
l ( σ ) = L ( σ ) ( n 1 ) L e ( σ ) A
where L ( σ ) is the length of the supercell at stress σ , and L e ( σ ) is the length between adjacent (011) planes in a homogeneously elongated bicrystal at the same stress. The separation can be determined from the expression
δ ( σ ) = l ( σ ) d 0
where d 0 is the equilibrium width of the cohesive zone.
In this work, I determine e ( σ ) by calculating E ( σ ) and E e ( σ ) atomistically at different separations δ = δ ( σ ) . To work with an analytic expression for the excess energy as a function of the separation, I fit the universal binding curve [41]
e ( δ ) = e 0 2 γ 1 + δ λ e x p δ λ
to atomistic calculations of excess energy for different values of the separation. The stress σ ( δ ) is the derivative of Equation (15) with respect to the separation δ .

2.2.2. Cohesive Zone Model in the Presence of Hydrogen

To model the effect of hydrogen atoms on the excess energy characterizing the cohesive zone, we need to identify both the number and binding energies of H trap sites within the grain boundaries. In bcc Fe, H atoms energetically prefer interstitial tetrahedral sites, and the number of H trap sites per unit volume in the bulk, N b , can be calculated. Hydrogen binding sites in the cohesive zone are determined by placing a single hydrogen atom in all potential trapping locations. The energetically favorable segregation sites are then identified through energy minimization of the supercell. The H binding energies are calculated using the same periodic supercells employed for the calculation of excess energies in uncharged Fe bicrystals. The segregation and the effect of various carbon concentrations on the cohesive strength of block boundaries have not been studied in this work.
To verify the adopted approach for determining hydrogen segregation sites and to validate the MEAM potential used to describe interatomic interactions, I applied the procedure to identify hydrogen trap sites between two adjacent (011) atomic layers in ideal bcc Fe. In agreement with previous studies, our calculations confirm that hydrogen atoms energetically prefer interstitial tetrahedral sites in bcc Fe (Figure 1a).
However, the grain boundary areas in the periodic bicrystals are extensive, containing tens of thousands of potential hydrogen binding sites. Identifying all hydrogen trap sites in the 10.53 and 60.01 twist GBs via energy minimization is computationally prohibitive, even when using the MEAM potential. To address this, we leverage the fact that the atomistic structures of twist GBs in Fe corresponding to misorientation angles of 10.53 and 60.01 consist of repeating structural units [42]. To determine the number of hydrogen trap sites per unit volume in the GBs and their binding energies, I identify hydrogen binding sites within a single repeating unit. The hydrogen binding sites identified at the 10.53 twist boundary are shown in Figure 1b. Our atomistic simulations reveal that the number of hydrogen segregation sites per unit volume, N, in the 10.53 and 60.01 GBs increases by approximately 59% compared to the number of trap sites in the bulk, N b . As the cohesive zone widens under applied tensile stress, both N and N b become dependent on the separation between adjacent atomic layers. To simplify the modeling, I assume that the number of hydrogen trap sites remains constant and that these sites evolve one-to-one from their original positions between atomic layers.
To determine the effect of hydrogen segregated in the twist boundaries on their cohesive strength, I calculate the corresponding excess energy characterizing the cohesive zone at different hydrogen concentrations and separations δ . The excess energy in the presence of hydrogen atoms segregated at the twist boundaries is given by
e H ( θ , σ ) = E H ( n , σ ) + E ( H 2 ) / 2 + n E d e s ( n p 1 ) E e ( σ ) A
where E H ( n , δ ) is the total energy of the most stable configuration with n hydrogen atoms in the cohesive zone at stress σ [43,44]. The total energy of a hydrogen molecule is E ( H 2 ) = 4.75 eV, and the dissolution energy determined using the MEAM interatomic potential is E d e s = 0.275 eV [34,44]. For an arbitrary fixed hydrogen occupancy θ at the twist boundaries, we model the excess energy of the cohesive zone using the universal binding curve:
e ( θ , δ ) = e 0 2 γ ( θ ) 1 + δ λ ( θ ) e x p δ λ ( θ ) .
This formulation allows us to work with an analytic expression for the excess energy as a function of both hydrogen concentration and separation δ = δ ( θ , σ ) (see Figure 2).
The parameters γ ( θ ) and λ ( θ ) as functions of hydrogen concentration are determined by fitting the universal binding curve to the atomistic data. The stress σ ( θ , δ ) is obtained as the derivative of the energy e ( θ , δ ) with respect to the separation δ :
σ ( δ ) = e ( θ , δ ) δ θ , T .
The weak interaction between hydrogen atoms in the Fe–H system justifies the use of the ideal solution model to calculate the chemical potential in the cohesive zone [34]:
μ ( θ , δ ) = e ( θ , δ ) θ δ + k B T ln θ 1 θ
To determine the standard value of the chemical potential in the bulk, μ 0 , we consider an ideal bcc Fe lattice in which a fraction θ of the interstitial tetrahedral sites is occupied by hydrogen. The space between two adjacent (110) atomic layers is treated as a cohesive zone. The standard chemical potential μ 0 is then obtained from the condition of local thermodynamic equilibrium at the interface between the cohesive zone and the bulk:
μ ( θ ) = e b ( θ ) θ δ = 0 + k B T ln θ 1 θ = μ 0 + k B T ln θ 1 θ
where the right-hand side of this equation represents the chemical potential in the bulk, and e b ( θ ) is the energy of the cohesive zone at separation δ = 0 . Assuming that e b ( θ ) depends linearly on θ at low separations, Equation (18) leads to the following expression for the standard value of the chemical potential in the bulk:
μ 0 = e b ( θ ) θ δ = 0

3. Results

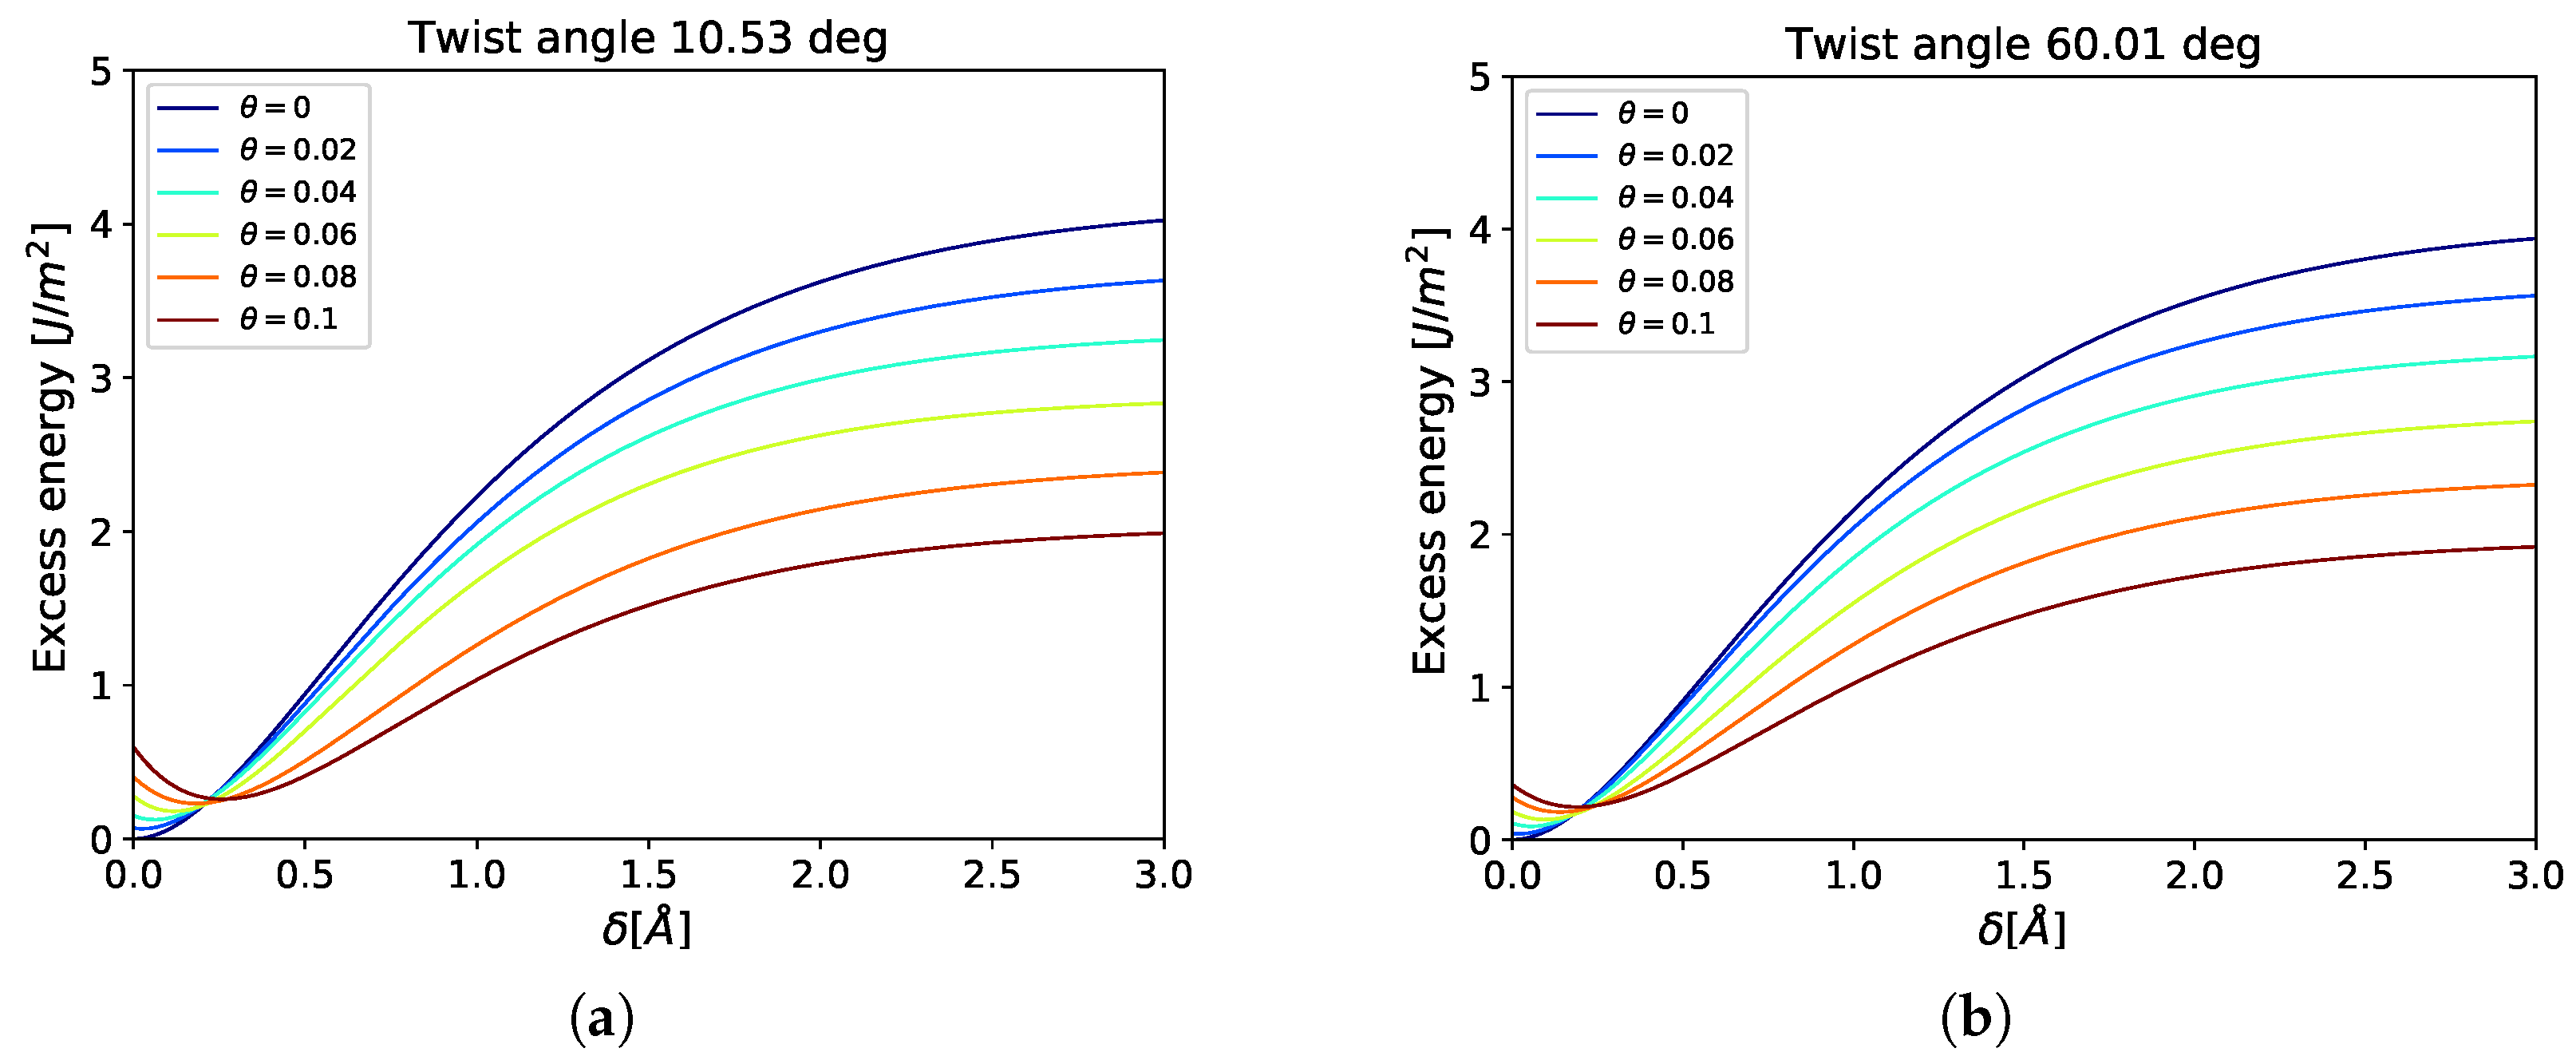
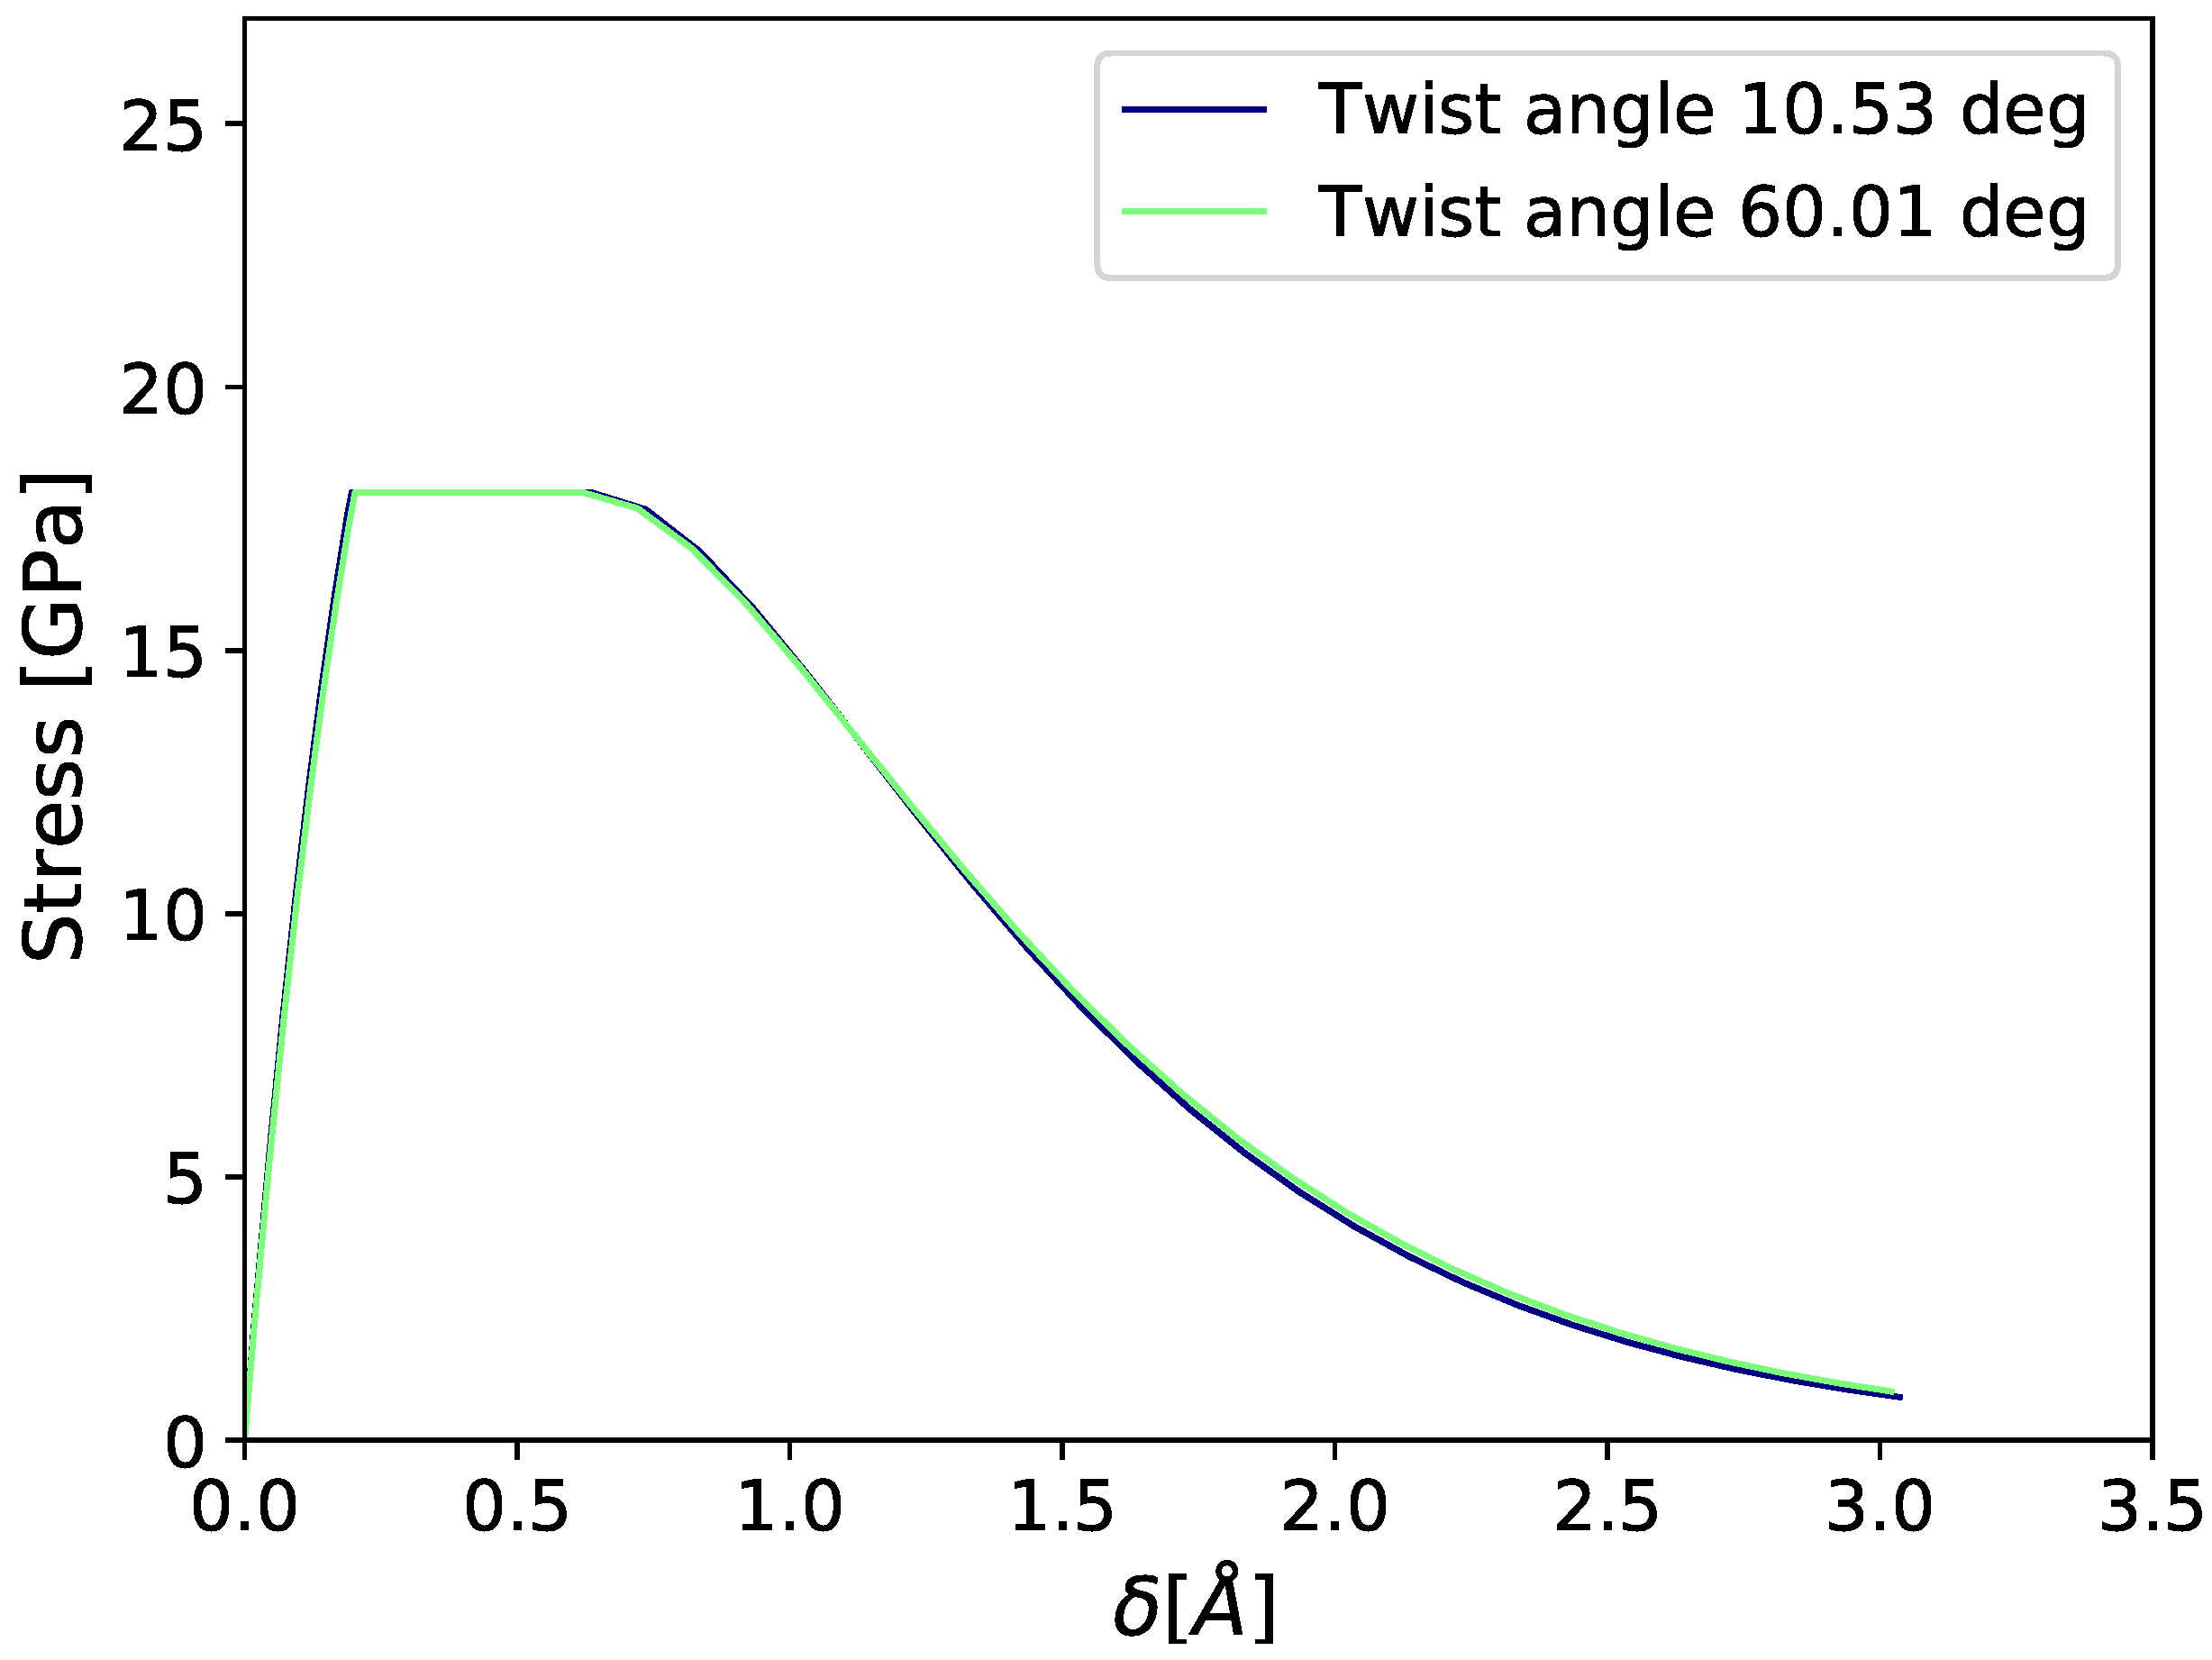
3.1. Cohesive Strength at Fixed Values of Hydrogen Occupancy

Within the present cohesive zone model, hydrogen atoms can occupy the energetically preferred interstitial sites at the twist boundaries. I calculate the excess energy for fixed hydrogen concentrations as a function of separation by minimizing the total energy of the supercells, with hydrogen atoms confined to the region of the twist boundaries. For each combination of randomly placed hydrogen atoms and separation values, the configuration with the lowest total energy is identified (Figure 3).
I approximate the atomistically calculated energy for a fixed hydrogen concentration between separating planes using the universal binding curve. Once the binding curve (15) is fitted, as shown in Figure 2, we obtain energy–versus–separation curves for fixed hydrogen occupancies at the decohering twist boundaries, as illustrated in Figure 4.
The corresponding family of traction curves, calculated at fixed values of hydrogen occupancy θ in the cohesive zone, is shown in Figure 5. The maximum of each traction curve is identified as the cohesive strength of the twist boundary at a fixed θ in the cohesive zone. The present results indicate that the cohesive strengths of both low- and high-angle twist boundaries in bcc Fe are similar, with a decrease of almost 50% in the presence of dissolved hydrogen occupying 10% of the trap sites in the grain boundaries.

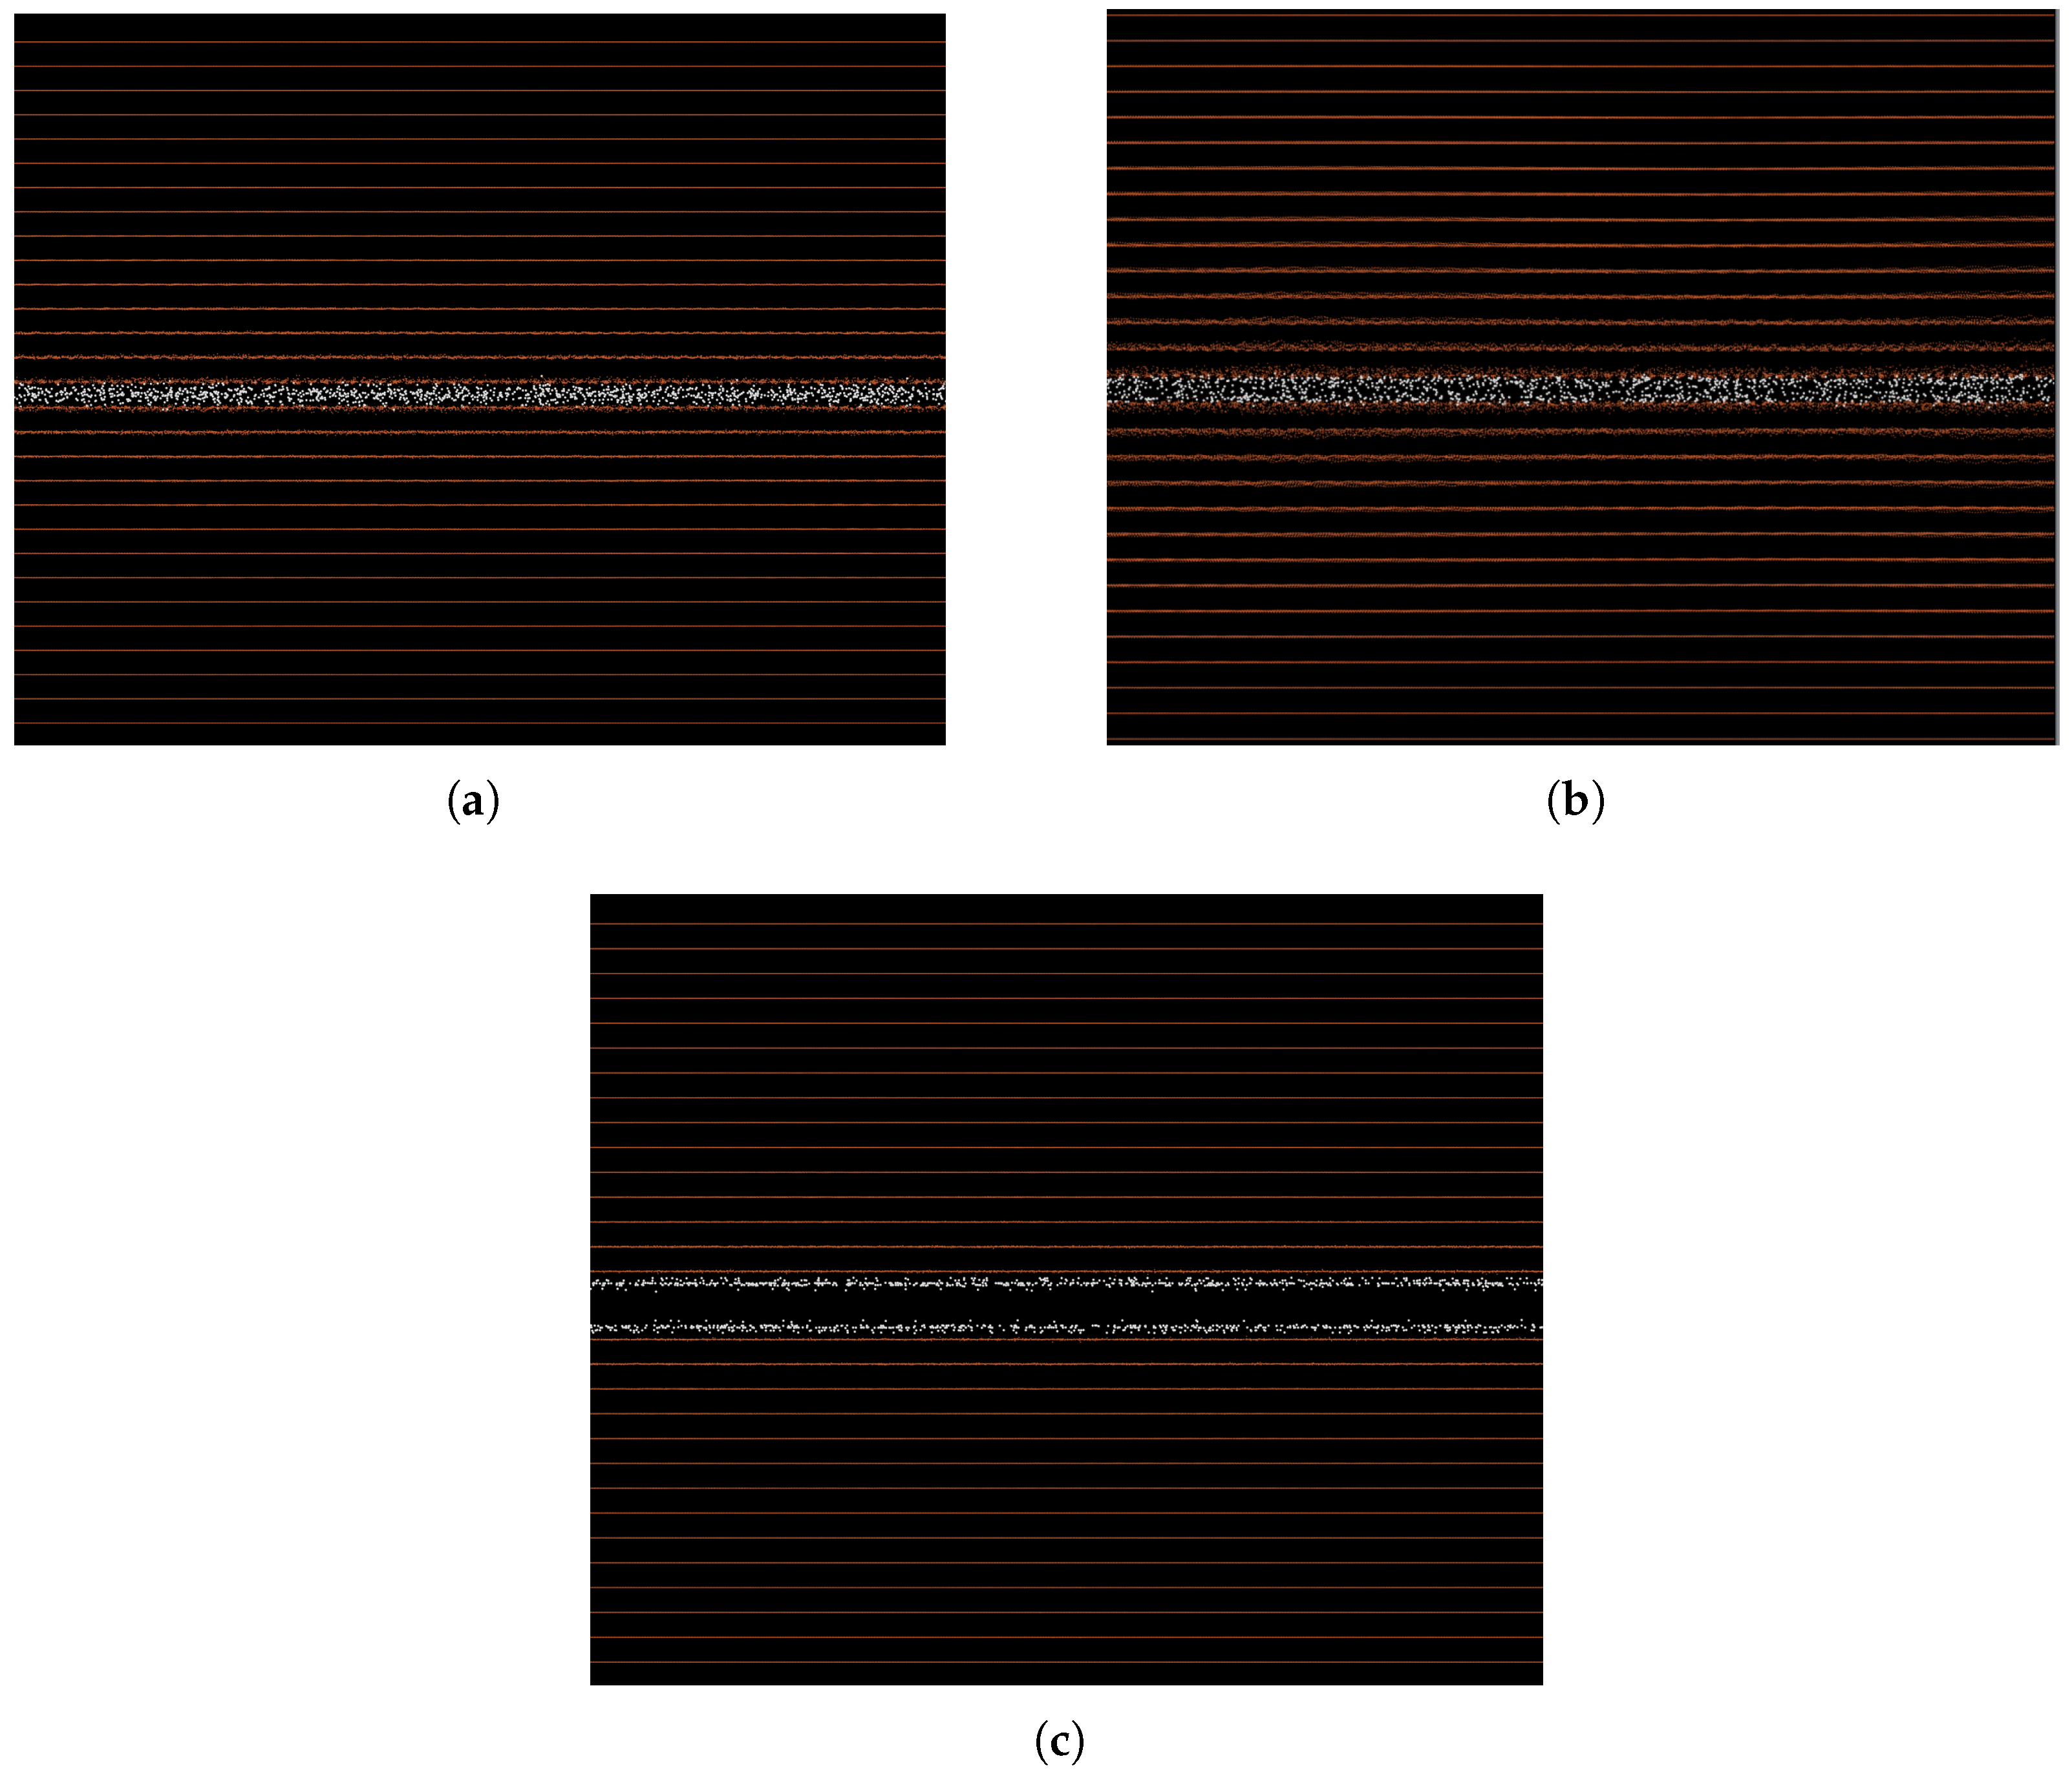
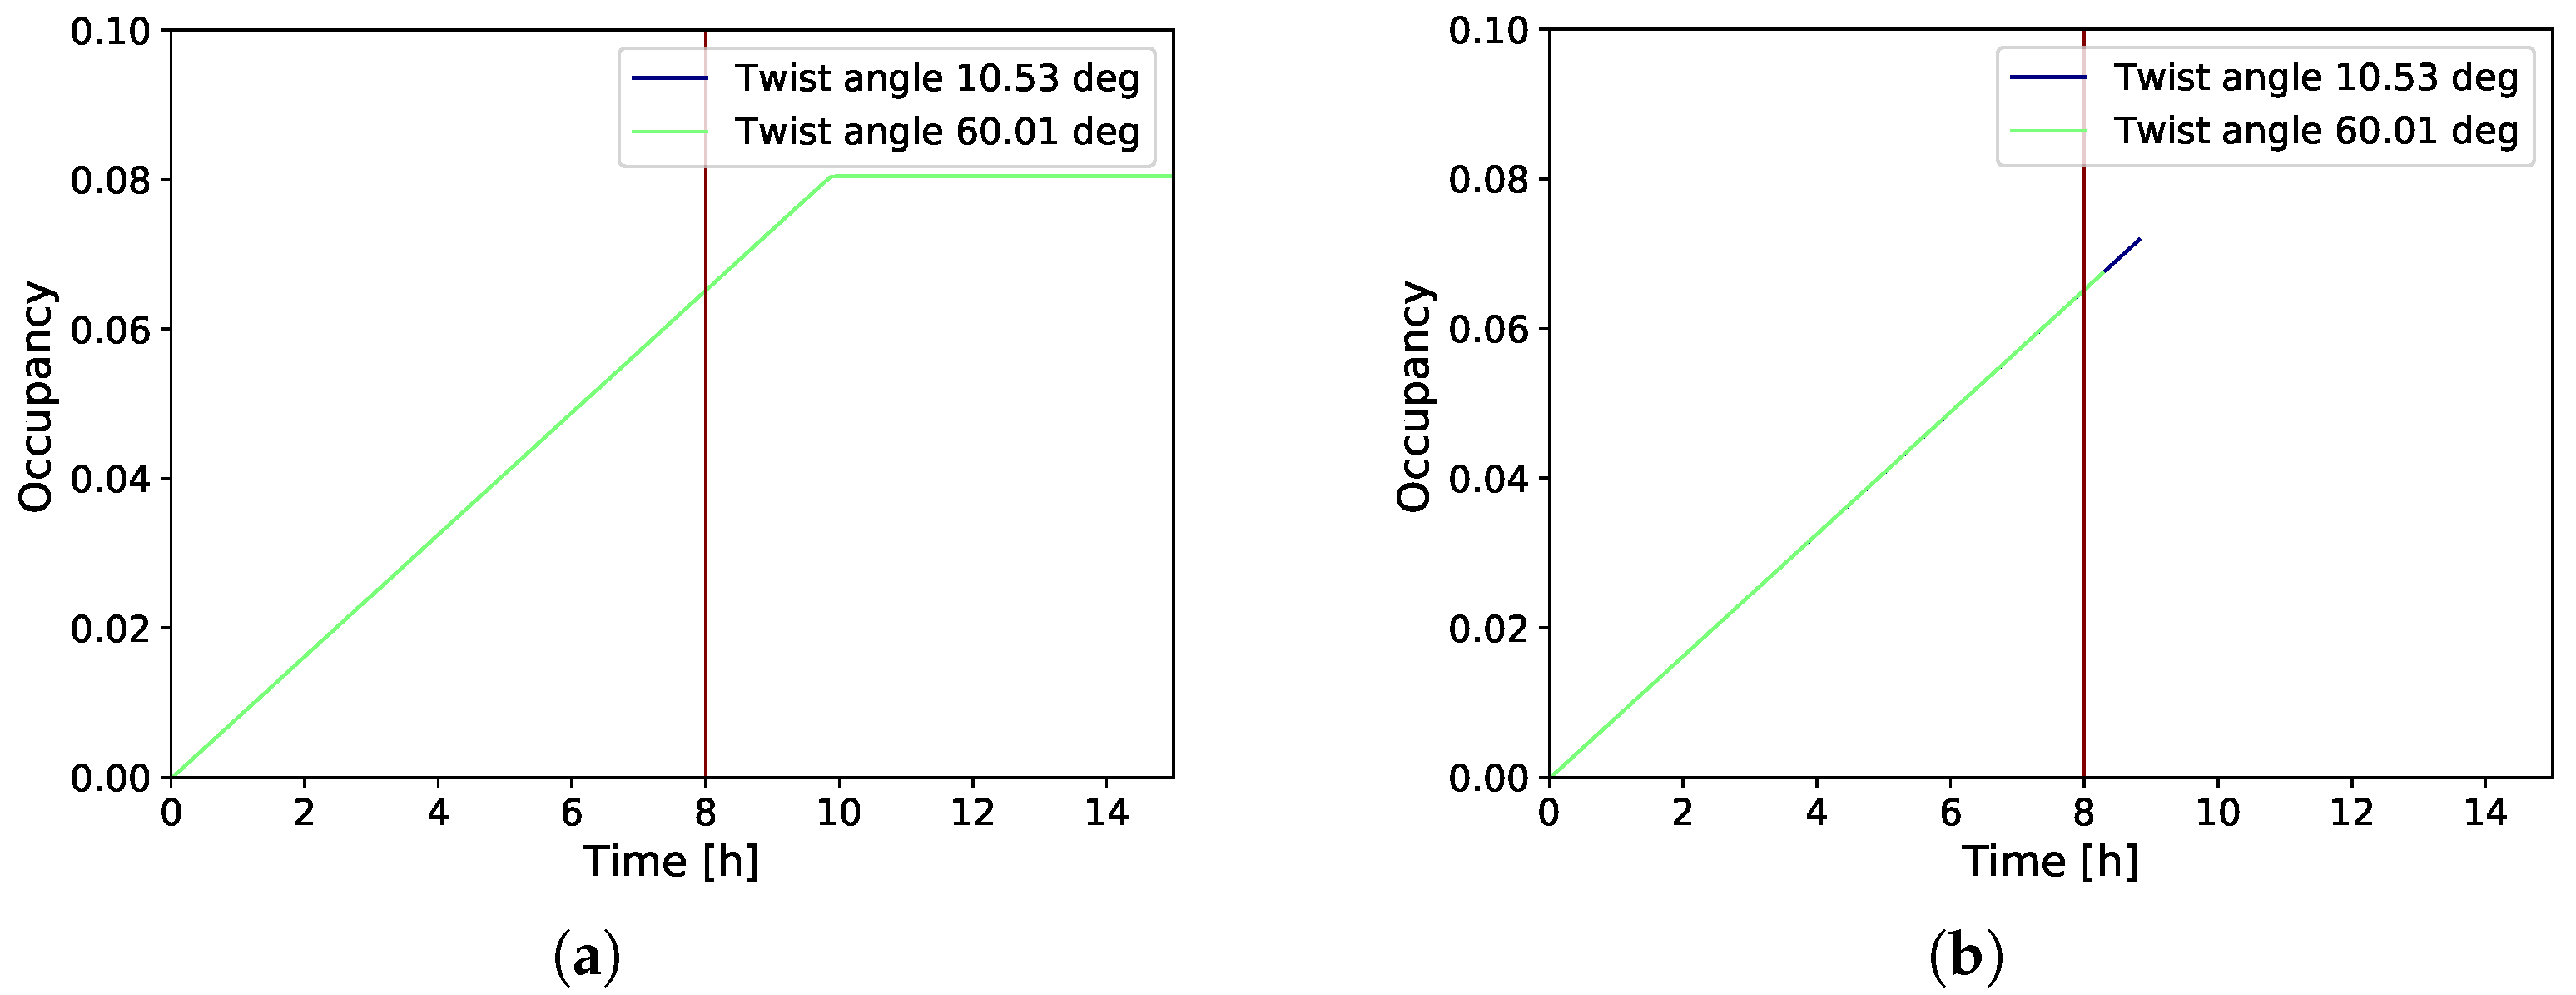
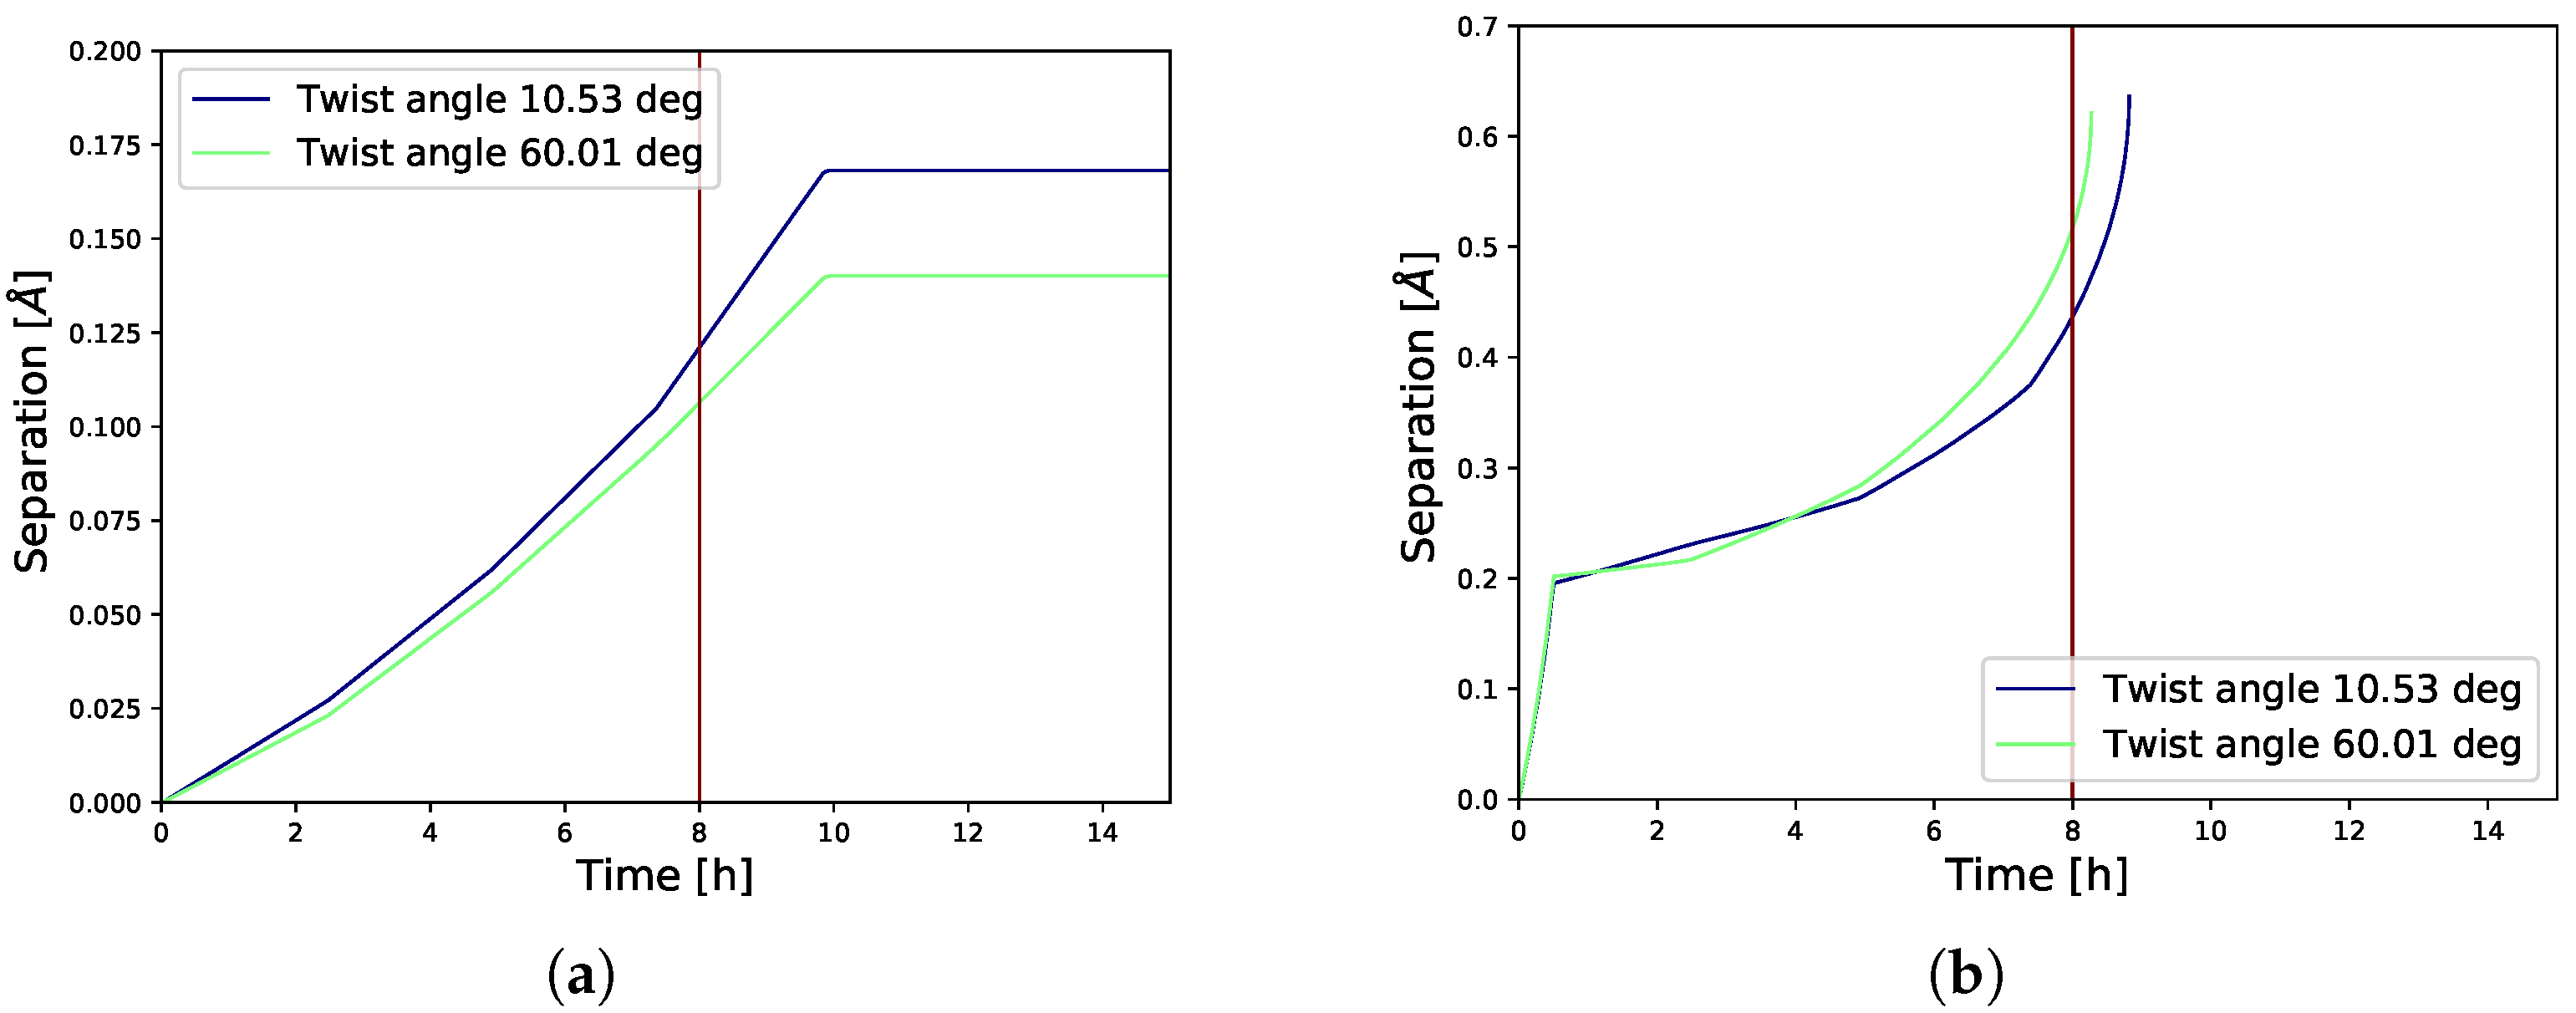
3.2. Gradual Decohesion Under Tensile Loading and a Fixed Hydrogen Flux

Once we have obtained an analytical expression for the energy as a function of separation and hydrogen concentrations, we calculate the chemical potential in the cohesive zone using the ideal solution model (Equation (17)). By solving the system of Equations (1)–(7) with parameters defined by the atomistic calculations, we can determine the solutions for the decohesion process across twist boundaries in Fe, corresponding to the lowest and highest misorientation angle block boundaries in the lath–martensitic structure. At the start, I consider an equilibrium bicrystal containing a twist boundary, which I begin charging with hydrogen by setting a constant hydrogen flux J ± s = 10 5 m / s through the free surfaces parallel to the GB. The width of the bicrystal is 10 2 m , and periodic boundary conditions are applied in the directions parallel to the cohesive zone. The lateral distribution of hydrogen at the interface and in both crystals is assumed to be uniform. A hydrogen diffusion coefficient of D = 8.89 · 10 9 m 2 / s at T = 300 K is used in this study [45]. After a certain period of time, before the H occupancy in the cohesive zone reaches 10%, I stop charging the bulk with hydrogen. Initially, no tensile stress is applied at the free boundaries of the simulation block.
I choose three values for the relaxation time τ , namely, 10 5 , 1, and 10 s, and a time step, Δ t = 10 2 s.

4. Discussion

The results of the calculations show that even at zero applied stress, the chemical potential in the bulk is higher than the chemical potential in the cohesive zone, which induces a driving force leading to hydrogen segregation at the twist boundary. In agreement with this result, the accumulation of hydrogen on “quasi-cleavage” fracture surfaces has been reported in [46], where hydrogen is visualized using the hydrogen microprint technique [47]. In the present simulations, I consider only relatively low hydrogen occupancies in the cohesive zone, not exceeding 10%. We stop charging the bicrystal with hydrogen when the hydrogen occupancy at the twist boundaries reaches 8%. For these occupancies and all three values of the relaxation time constant τ , the right side of Equation (2) exceeds the maximum total hydrogen flux across the interface between the cohesive zone and the bulk. Therefore, the hydrogen segregation in the cohesive zone is controlled by the maximum flow of hydrogen through the interface between the two regions, which in turn depends on hydrogen charging and diffusion in the bulk. The flux of hydrogen into the cohesive zone results in an increase in hydrogen occupancy (Figure 6a) and a reduction in cohesive strength (Figure 7a), which in turn leads to an increase in the separation δ of the cohesive zone (Figure 8a).
There is no difference in the increase in H occupancy at the low- and high-angle twist boundaries. There is no significant difference in the cohesive strengths of 10.53 and 60.01 GBs, with that of 60.01 being slightly smaller. The present calculations show that H atoms segregated at 60.01 GB exert a lower pressure on adjacent atomic layers leading to lower separation δ along the high-angle GB. The width of the cohesive zone continues to increase even after we stop charging the bicrystal with hydrogen due to diffusion and segregation in the GB of the H atoms accumulated in the bulk. The increase in the cohesive zone width continues until the system reaches an equilibrium state of separation and hydrogen occupancy θ , (Figure 8a).
Simulations under the same conditions, but with an applied tensile load, show that the segregation of hydrogen at the GB leads to complete separation of the bicrystal along the interface at a tensile stress significantly lower than the cohesive strength of the GB in a pure Fe bicrystal. At the beginning of the simulations, the applied tensile load is increased at a constant rate of 10 MPa/s, starting from zero, until it reaches a constant value of 18 GPa. During this relatively short period (0.5 h), H occupancy at the GB does not increase significantly (Figure 6b), and the increase in separation is primarily due to the increase in the applied stress (Figure 8b). This is illustrated in Figure 9, where the system’s stress is shown as a function of separation. In [34,37], a Van der Waals phase transition—from a dilute to a saturated cohesive zone—was identified while studying the effect of hydrogen on decohesion between adjacent atomic planes in pure iron and aluminum. A similar phenomenon is observed in the traction curves shown in Figure 9. Initially, as the cohesive zone width increases from zero, the traction response follows the traction curve corresponding to a fixed, near-zero hydrogen occupancy. At a critical point, an abrupt, first-order transition to a hydrogen occupancy of θ 0.07 takes place. This transition is marked by a plateau in the traction curve beginning at δ 0.2 Å. Beyond this point, the traction follows a constant stress–separation curve. Once the applied tensile stress reaches a constant value (Figure 9), the subsequent increase in separation (Figure 8b) is driven by the increase in H occupancy at the GB (Figure 6b). The applied tensile stress results in a higher separation at the 60.01 GB (Figure 8b). When the cohesive strength of the GB drops below the magnitude of the applied stress, at a separation of about 0.6 Å, both crystals completely separate. This is evident from the reduction in stress (Figure 9) as the separation δ increases above 0.6 Å. The cohesive strength of the 60.01 GB is slightly lower than that of the 10.53 GB, leading to earlier separation at the higher-angle GB (Figure 7b).
Since the computational costs for a study of intergranular decohesion are significantly higher due to the requirement for very large supercells to accommodate a block boundary, I have made several approximations. We have focused on uniaxial decohesion and neglected possible shear stresses and hydrogen diffusion along the cohesive zone. In this paper, only the effect of decohesion caused by mobile hydrogen migrating from the bulk to the cohesive zone has been considered. I do not study other possible hydrogen transport modes [45]. Also, plasticity and decohesion phenomena have not been studied simultaneously. Some dislocation activity may accompany and affect decohesion. Increased dislocation density due to higher hydrogen concentrations hardens the matrix and raises the local stresses at decohesion sites. There is experimental evidence that fracture occurs along the block boundaries when slip systems intersect the interfaces, whose cohesive strength has been reduced by hydrogen [20]. Atomistic simulations of the interaction between block boundaries and the dominant mobile dislocations in Fe will be the subject of a separate study. The effect of dislocations intersecting block boundaries on their cohesive strength will be addressed in future work.

5. Conclusions

In this paper, I employ the continuum decohesion model first introduced by Rice [31] and Rice and Hirth [35], and extended in [33,34], to study the effect of different hydrogen concentrations and tensile loads on the cohesive strength of block boundaries in lath martensitic structures. The thermodynamic properties of the cohesive zone are characterized by excess variables, which provide a connection between atomistic energy calculations and the continuum model describing the gradual decohesion of a block boundary. I incorporate hydrogen mobility and segregation in the cohesive region to quantify the hydrogen effect on decohesion. The traction curves, calculated at fixed hydrogen occupancy in the cohesive zone, show that the cohesive strengths of the twist boundaries in bcc Fe, corresponding to block boundaries in lath martensite, decrease by nearly half in the presence of dissolved hydrogen occupying 10% of the trap sites in the GBs.
After setting a constant H flux through the free surfaces of a bicrystal containing a block boundary, our calculations show that the chemical potential in the bulk is higher than that in the cohesive zone. This creates a driving force that results in a hydrogen flux into the cohesive zone. Consequently, hydrogen segregates at the block boundary, leading to a reduction in its cohesive strength. This, in turn, causes an increase in the width δ of the cohesive zone.
Simulations under the same conditions, but with an applied tensile load, show that the increase in H occupancy at the GB leads to complete separation of the bicrystal when the cohesive strength of the block boundary drops below the magnitude of the applied stress. In the presence of hydrogen flux, separation across the block boundary occurs at a tensile load significantly lower than the critical stress required for rupture in a hydrogen-free lath martensitic structure. In this paper, we do not study the effect of carbon and dislocation activity on decohesion. The new insight gained from this study contributes to ongoing efforts to develop alloys resistant to hydrogen-induced degradation.

Funding

This research is financially supported by the Bulgarian National Science Fund, Project KP–06–N67/9 “Mechanism of Hydrogen Embrittlement in Lath Martensite Steel: Model Simulations and Experimental Study”.

Data Availability Statement

The original contributions presented in this study are included in the article. Further inquiries can be directed to the corresponding author.

Acknowledgments

The work on the publication was performed using equipment funded by project BG16RFPR002-1.014-0006 “National Center for Mechatronics and Clean Technologies”.

Conflicts of Interest

The author declares no conflicts of interest.

References

  1. Lynch, S. Hydrogen embrittlement phenomena and mechanisms. Corros. Rev. 2012, 30, 105–123. [Google Scholar] [CrossRef]
  2. Chen, Y.S.; Huang, C.; Liu, P.-Y.; Yen, H.-W.; Niu, R.; Burr, P.; Moore, K.L.; Martínez-Pañeda, E.; Atrens, A.; Cairney, J.M. Hydrogen trapping and embrittlement in metals—A review. Int. J. Hydrogen Energy 2025, 136, 789–821. [Google Scholar] [CrossRef]
  3. Chang, Z.; Ruan, X.; Chen, Z.; Zhang, Y.; Li, L.; Lan, L. Comparative evaluation on hydrogen damage behavior of two martensitic high strength press hardening steels. Int. J. Hydrogen Energy 2024, 61, 1060–1070. [Google Scholar] [CrossRef]
  4. Birnbaum, H.K.; Sofronis, P. Hydrogen-enhanced localized plasticity—A mechanism for hydrogen-related fracture. Mater. Sci. Eng. A 1994, 176, 191–202. [Google Scholar] [CrossRef]
  5. Robertson, I.M. The effect of hydrogen on dislocation dynamics. Eng. Fract. Mech. 2001, 68, 671–692. [Google Scholar] [CrossRef]
  6. Ferreira, P.J.; Robertson, I.M.; Birnbaum, H.K. Hydrogen effects on the interaction between dislocations. Acta Mater. 1998, 46, 1749–1757. [Google Scholar] [CrossRef]
  7. Somerday, B.; Sofronis, P.; Jones, R. Effects of hydrogen on materials. In Proceedings of the 2008 International Hydrogen Conference, Jackson Lake Lodge, Grand Teton National Park, WY, USA, 7–10 September 2008. [Google Scholar]
  8. Abou Ali Modad, O.; Shehadeh, M.A. Modeling dislocation interactions with grain boundaries in lath martensitic steels. J. Mater. Sci. 2024, 59, 4829–4851. [Google Scholar] [CrossRef]
  9. Troiano, A.R. The Role of Hydrogen and Other Interstitials in the Mechanical Behavior of Metals. Trans. Am. Soc. Met. 1960, 52, 54–80. [Google Scholar] [CrossRef]
  10. Oriani, R.A.; Josephic, P.H. Equilibrium aspects of hydrogen-induced cracking of steels. Acta Metall. Mater. 1974, 22, 1065–1074. [Google Scholar] [CrossRef]
  11. Azócar Guzmán, A.; Janisch, R. Effects of mechanical stress, chemical potential, and coverage on hydrogen solubility during hydrogen-enhanced decohesion of ferritic steel grain boundaries: A first-principles study. Phys. Rev. Mater. 2024, 8, 073601. [Google Scholar] [CrossRef]
  12. Matsubara, K.; Takagi, S.; Meng, F.-S.; Ogata, S.; Ishikawa, N. Atomic-scale modelling of boundaries characterized lath martensite microstructure for hydrogen-induced crack initiation: A machine learning interatomic potentials study. In Proceedings of the 7th International Symposium on Steel Science, Kyoto, Japan, 11–14 November 2024; The Iron and Steel Institute of Japan: Tokyo, Japan, 2024. [Google Scholar]
  13. Beachem, C.D. Orientation of cleavage facets in tempered martensite (quasi-cleavage) by single surface trace analysis. Metall. Trans. 1973, 4, 1999–2000. [Google Scholar] [CrossRef]
  14. Boris, Y.; Yana, M.; Kateryna, V.; Vanya, D.; Krasimir, K.; Julieta, K.; Rumyana, L.; Ivaylo, K. Effect of Hydrogen Content on the Microstructure, Mechanical Properties, and Fracture Mechanism of Low-Carbon Lath Martensite Steel. Metals 2024, 14, 1340. [Google Scholar] [CrossRef]
  15. Cho, L.; Bradle, P.E.; Lauria, D.S.; Martin, M.L.; Connolly, M.J.; Benzing, J.T.; Seo, E.J.; Findley, K.O.; Speer, J.G.; Slifka, A.J. Characteristics and mechanisms of hydrogen-induced quasi-cleavage fracture of lath martensitic steel. Acta Mater. 2021, 206, 116635. [Google Scholar] [CrossRef]
  16. Yan, C.; Zhang, S.; Zhou, L.; Tian, Z.; Shen, M.; Liu, X. Effect of Quenching Temperature on Microstructure and Hydrogen-Induced Cracking Susceptibility in S355 Steel. Materials 2025, 18, 1161. [Google Scholar] [CrossRef]
  17. Morito, S.; Tanaka, H.; Konishi, R.; Furuhara, T.; Maki, T. The morphology and crystallography of lath martensite in Fe-C alloys. Acta Mater. 2003, 51, 1789–1799. [Google Scholar] [CrossRef]
  18. Kitahara, H.; Ueji, R.; Tsuji, N.; Minamino, Y. Crystallographic features of lath martensite in low-carbon steel. Acta Mater. 2006, 54, 1279–1288. [Google Scholar] [CrossRef]
  19. Djukic, M.B.; Bakic, G.M.; Zeravcic, V.S.; Sedmak, A.; Rajicic, B. The synergistic action and interplay of hydrogen embrittlement mechanisms in steels and iron: Localized plasticity and decohesion. Eng. Fract. Mech. 2019, 216, 106528. [Google Scholar] [CrossRef]
  20. Nagao, A.; Smith, C.D.; Dadfarnia, M.; Sofronis, P.; Robertson, I.M. The role of hydrogen in hydrogen embrittlement fracture of lath martensitic steel. Acta Mater. 2012, 60, 5182–5189. [Google Scholar] [CrossRef]
  21. Kim, Y.H.; Morris, J.W. The nature of quasicleavage fracture in tempered 5.5Ni steel after hydrogen charging. Metall. Trans. A 1983, 14, 1883–1888. [Google Scholar] [CrossRef]
  22. Shibata, A.; Murata, T.; Takahashi, H.; Matsuoka, T.; Tsuji, N. Characterization of hydrogen-related fracture behavior in as-quenched low-carbon martensitic steel and tempered medium-carbon martensitic. Metall. Mater. Trans. A 2015, 46, 5685–5696. [Google Scholar] [CrossRef]
  23. Choo, W.; Lee, J.Y. Thermal analysis of trapped hydrogen in pure iron. Metall. Trans. A 1982, 13, 135–140. [Google Scholar] [CrossRef]
  24. Wei, F.-G.; Tsuzaki, K. Response of hydrogen trapping capability to microstructural change in tempered Fe–0.2C martensite. Scr. Mater. 2005, 52, 467–472. [Google Scholar] [CrossRef]
  25. Nagumo, M. Fundamentals of Hydrogen Embrittlement; Springer: New York, NY, USA, 2016. [Google Scholar]
  26. Zhong, L.; Wu, R.; Freeman, A.J.; Olson, G.B. Charge transfer mechanism of hydrogen-induced intergranular embrittlement of iron. Phys. Rev. B 2000, 62, 13938–13941. [Google Scholar] [CrossRef]
  27. Geng, W.-T.; Freeman, A.J.; Olson, G.B.; Tateyama, Y.; Ohno, T. Hydrogen-Promoted Grain Boundary Embrittlement and Vacancy Activity in Metals: Insights from Ab Initio Total Energy Calculatons. Mater. Trans. 2005, 46, 756–760. [Google Scholar] [CrossRef]
  28. Tian, Z.X.; Yan, W.; Hao, J.X.; Xiao, W. Effect of alloying additions on the hydrogen-induced grain boundary embrittlement in iron. J. Phys. Condens. Matt. 2011, 23, 015501. [Google Scholar] [CrossRef]
  29. Yamaguchi, M. First-Principles Calculations of Hydrogen Trapping Energy on Incoherent Interfaces of Aluminum Alloys. Metall. Mater. Trans. A 2011, 42, 319–329. [Google Scholar] [CrossRef]
  30. Yamaguchi, M.; Ebihara, K.-I.; Itakura, M.; Kadoyoshi, T.; Suzudo, T.; Kaburaki, H. First-Principles Study on the Grain Boundary Embrittlement of Metals by Solute Segregation: Part II. Metal (Fe, Al, Cu)-Hydrogen (H) Systems. Metall. Mater. Trans. A 2011, 42, 330–339. [Google Scholar] [CrossRef]
  31. Rice, J.R. Hydrogen and Interfacial Cohesion. In Effect of Hydrogen on Behaviour of Materials; Thompson, A.M., Bernstein, I.M., Eds.; TMS-AIME: New York, NY, USA, 1976; pp. 455–466. [Google Scholar]
  32. Rice, J.R.; Wang, J.-S. Embrittlement of interfaces by solute segregation. Mater. Sci. Eng. A 1989, 107, 23–40. [Google Scholar] [CrossRef]
  33. Mishin, Y.; Sofronis, P.; Bassani, J.L. Thermodynamic and kinetic aspects of interfacial decohesion. Acta Mat. 2002, 50, 3609–3622. [Google Scholar] [CrossRef]
  34. Katzarov, I.H.; Paxton, A.T. Hydrogen embrittlement II. Analysis of hydrogen-enhanced decohesion across (111) planesin α-Fe. Phys. Rev. Mater. 2017, 1, 33603. [Google Scholar] [CrossRef]
  35. Hirth, J.P.; Rice, J.R. On the thermodynamics of adsorption at interfaces as it influences decohesion. Metall. Trans. A 1980, 11, 1501–1511. [Google Scholar] [CrossRef]
  36. Guggenheim, E.A. Thermodynamics: An Advanced Treatment for Chemists and Physicists, 4th ed.; Elsevier Science: Amsterdam, The Netherlands, 1993. [Google Scholar]
  37. Van der Ven, A.; Ceder, G. The thermodynamics of decohesion. Acta Mater. 2004, 52, 1223–1235. [Google Scholar] [CrossRef]
  38. Warrington, D. The coincidence site lattice (CSL) and grain boundary (DSC) dislocations for the hexagonal lattice. J. Phys. Colloq. 1975, 36, 87–95. [Google Scholar] [CrossRef]
  39. Zhou, X.; Foster, M.; Ronevich, J.; San Marchi, C. Review and construction of interatomic potentials for molecular dynamics studies of hydrogen embrittlement in Fe–C based steels. J. Comput. Chem. 2020, 41, 1299–1309. [Google Scholar] [CrossRef] [PubMed]
  40. Thompson, A.P.; Aktulga, H.M.; Berger, R.; Bolintineanu, D.S.; Brown, W.M.; Crozier, P.S.; In ‘t Veld, P.J.; Kohlmeyer, A.; Moore, S.G.; Nguyen, T.D.; et al. LAMMPS—A flexible simulation tool for particle-based materials modeling at the atomic, meso, and continuum scales. Comput. Phys. Commun. 2022, 271, 108171. [Google Scholar] [CrossRef]
  41. Rose, J.H.; Ferrante, J.; Smith, J.R. Universal Binding Energy Relations in Metallic Adhesion. Phys. Rev. Lett. 1981, 47, 675. [Google Scholar] [CrossRef]
  42. Katzarov, I.; Ilieva, N.; Yanachkov, B. A molecular dynamics study of dislocation-interface boundary interactions in lath martensite. AIP Conf. Proc. 2022, 2522, 110007. [Google Scholar]
  43. Ramasubramaniam, A.; Itakura, M.; Carter, E.A. Interatomic potentials for hydrogen in α-iron based on density functional theory. Phys. Rev. B 2009, 79, 174101. [Google Scholar] [CrossRef]
  44. Paxton, A.T.; Elsässer, C. Electronic structure and total energy of interstitial hydrogen in iron: Tight-binding models. Phys. Rev. B 2010, 82, 235125. [Google Scholar] [CrossRef]
  45. Bombac, D.; Katzarov, I.H.; Pashov, D.L.; Paxton, A.T. Theoretical evaluation of the role of crystal defects on local equilibrium and effective diffusivity of hydrogen in iron. Mater. Sci. Technol. 2017, 33, 1505–1514. [Google Scholar] [CrossRef]
  46. Nagao, A.; Kuramoto, S.; Ichitani, K.; Kanno, M. Visualization of hydrogen transport in high strength steels affected by stress fields and hydrogen trapping. Scr. Mater. 2001, 45, 1227–1232. [Google Scholar] [CrossRef]
  47. Nagao, A.; Smith, C.D.; Dadfarnia, M.; Sofronis, P.; Robertson, I.M. Interpretation of hydrogen-induced fracture surface morphologies for lath martensitic steel. Procedia Mater. Sci. 2014, 3, 1700–1705. [Google Scholar] [CrossRef]
Figure 1. An atomic scale view of hydrogen binding sites: (a) between two adjacent (011) atomic layers in bcc Fe; (b) at 10.53 twist boundary. Red and white spheres represent iron and hydrogen atoms, respectively.
Metals 15 00660 g001
Figure 2. Excess energy per unit area of 10.53 twist GB as a function of separation δ . The data points, calculated using the MEAM potential, are fitted to the universal binding curve (15). The hydrogen occupancy in the cohesive zone is 0.06. The zero of energy corresponds to the energy of the pure Fe supercell.
Metals 15 00660 g002
Figure 3. Atomic scale view of relaxed supercells for fixed hydrogen occupancy of 0.1 for the 10.53 twist GB. The initial separations of the cohesive zone are: (a) 0 Å; (b) 2.5 Å; (c) 3.4 Å.
Metals 15 00660 g003
Figure 4. Excess energy per unit area of the cohesive zone as a function of the separation between decohering planes forming twist boundaries with a misorientation angle: (a) 10.53 ; (b) 60.01 .
Metals 15 00660 g004
Figure 5. A family of traction curves: stress σ as a function of separation δ corresponding to a particular value of the H occupancy in the trap sites of a twist boundary with a misorientation angle: (a) 10.53 ; (b) 60.01 .
Metals 15 00660 g005
Figure 6. The evolution of the H occupancy in the trap sites of twist boundaries with misorientation angles 10.53 and 60.01 , resulting from charging the bicrystals with hydrogen; (a) without applied tensile stress and (b) applied tensile load of 18 GPa. The vertical line indicates the moment at which the hydrogen flux through the free boundaries of the bicrystals is terminated.
Metals 15 00660 g006
Figure 7. The evolution of the cohesive strength of twist boundaries with misorientation angles 10.53 and 60.01 , resulting from charging the bicrystals with hydrogen; (a) without applied tensile stress, and (b) with an applied tensile load of 18 GPa.
Metals 15 00660 g007
Figure 8. The evolution of the separation of twist boundaries with a misorientation angles 10.53 and 60.01 , resulting from charging the bicrystals with hydrogen; (a) without applied tensile stress and (b) with an applied tensile load of 18 GPa.
Metals 15 00660 g008
Figure 9. The traction curves of twist boundaries with misorientation angles 10.53 and 60.01 under an applied tensile load of 18 GPa and fixed hydrogen flux through the free boundaries of the bicrystals.
Metals 15 00660 g009
Table 1. The parameter Σ and integers m and n generating the twist GBs with CSL orientation relationships.
Twist Angle φ mn Σ
10.53236547
60.0130494201
Disclaimer/Publisher’s Note: The statements, opinions and data contained in all publications are solely those of the individual author(s) and contributor(s) and not of MDPI and/or the editor(s). MDPI and/or the editor(s) disclaim responsibility for any injury to people or property resulting from any ideas, methods, instructions or products referred to in the content.

