
Effect of Electrolyte Temperature on Plasma Electrolytic Oxidation of Pure Aluminum

Abstract

1. Introduction
2. Experimental Methods
2.1. Preparation of Specimens
2.2. Characterization
3. Results
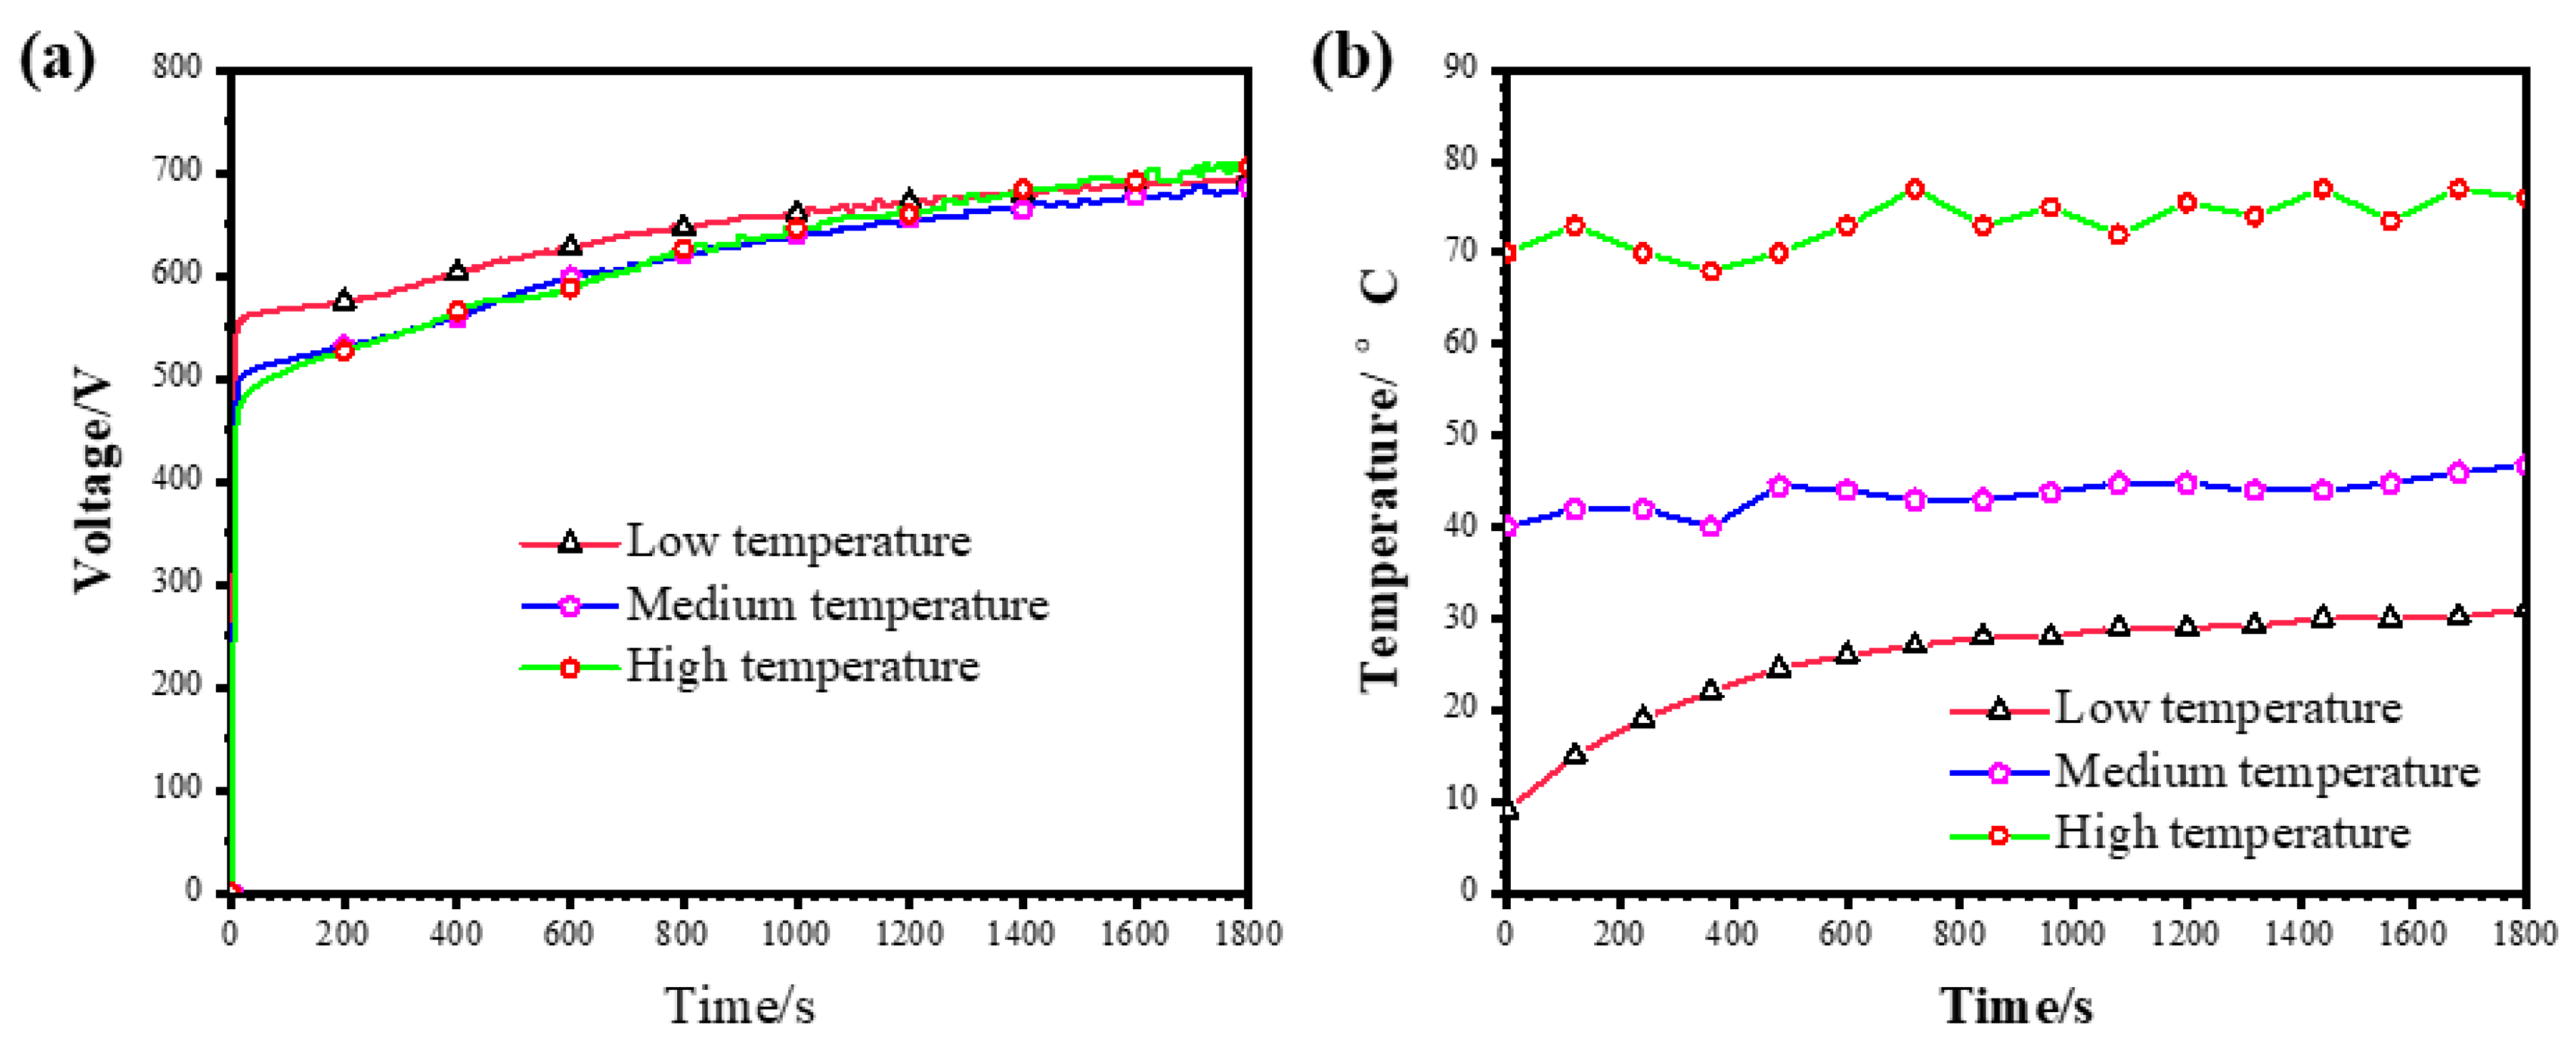
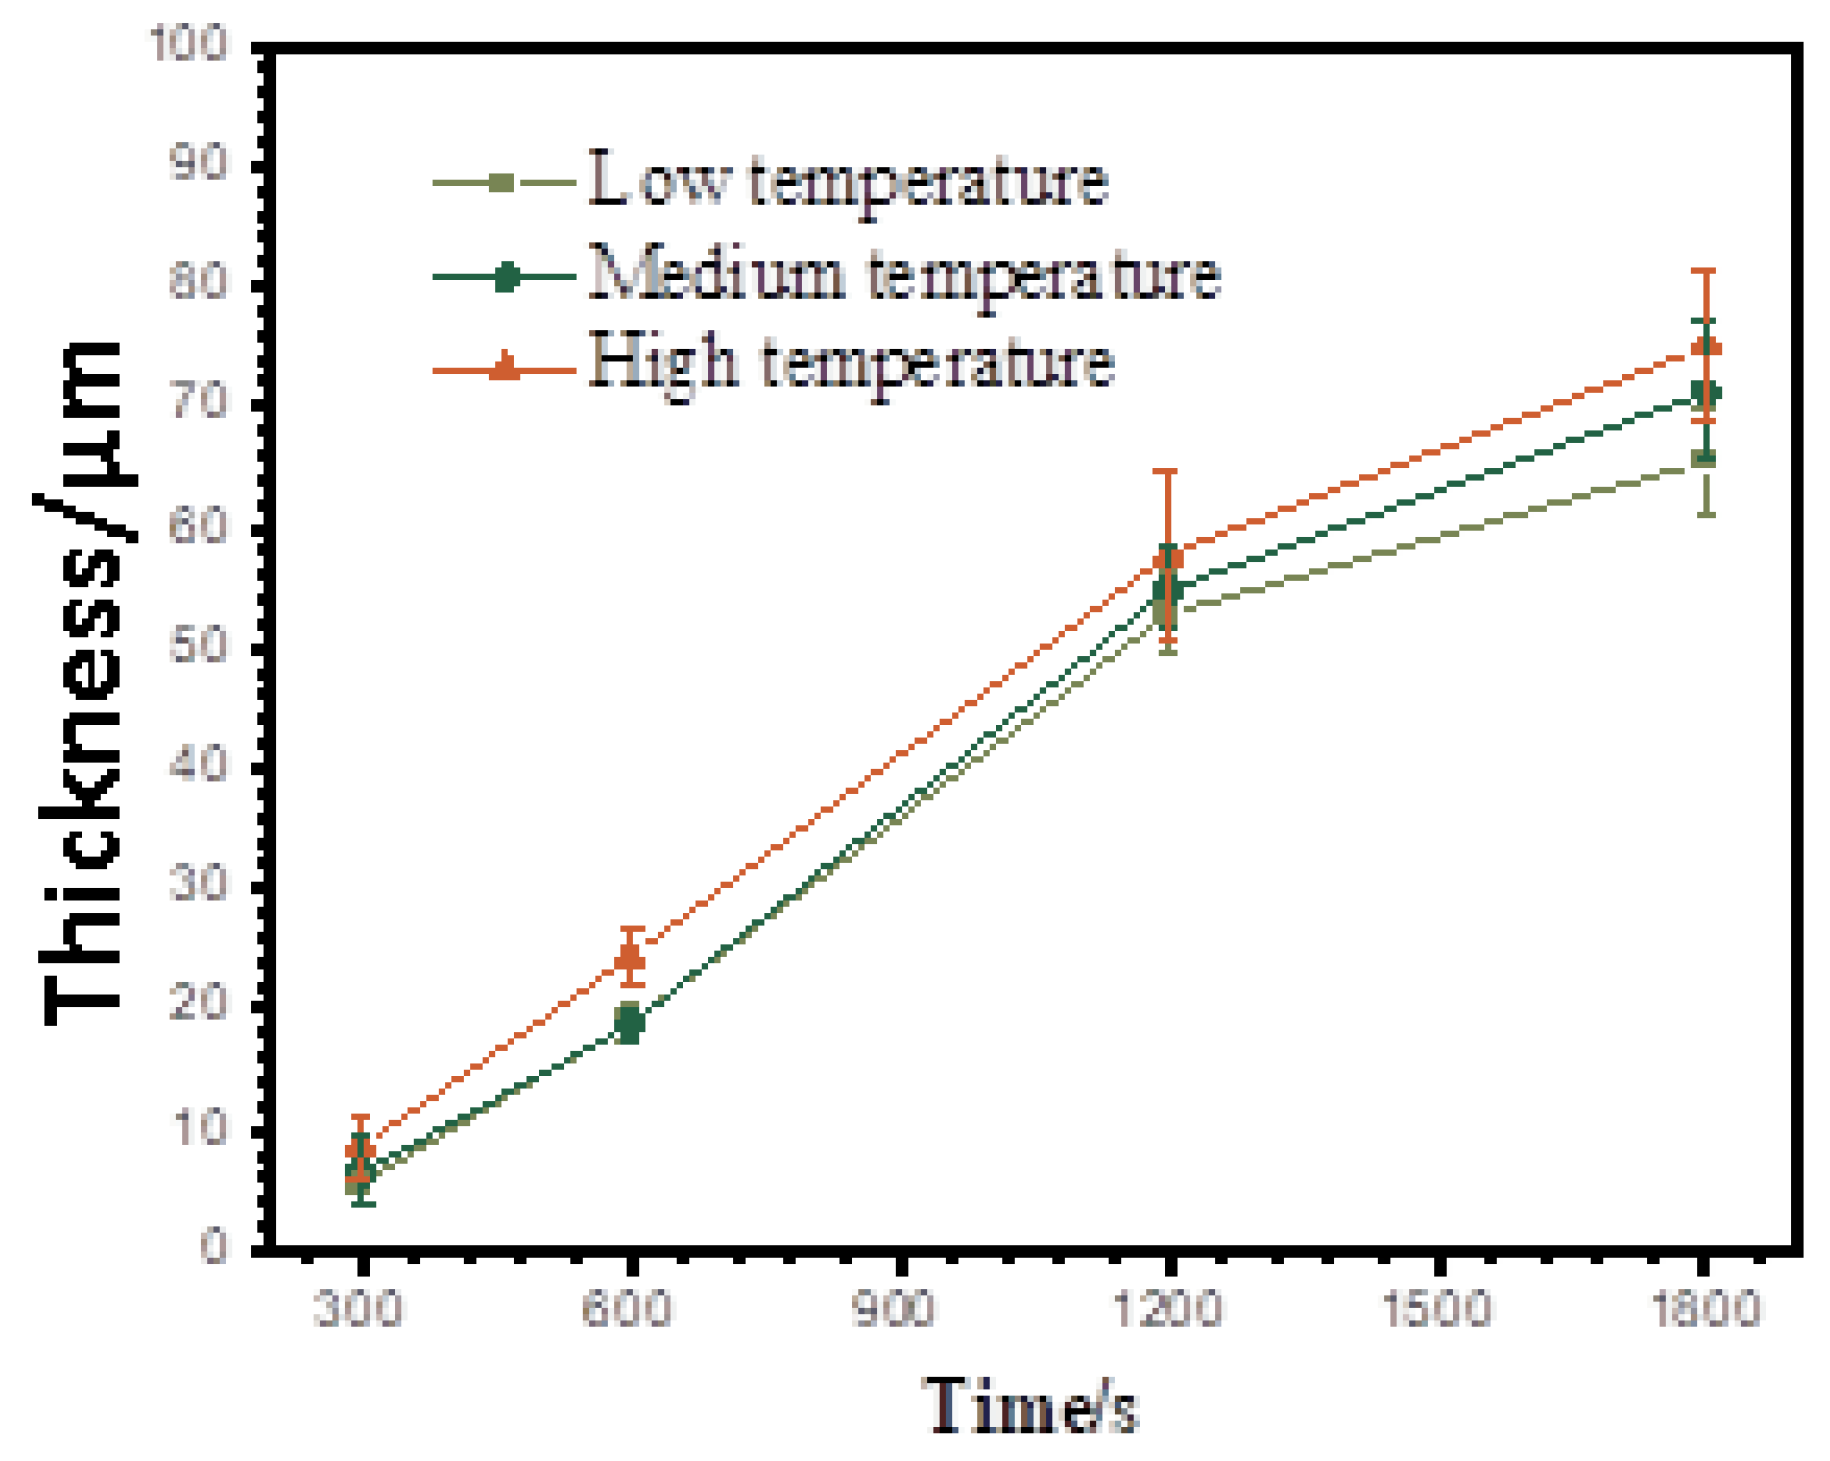
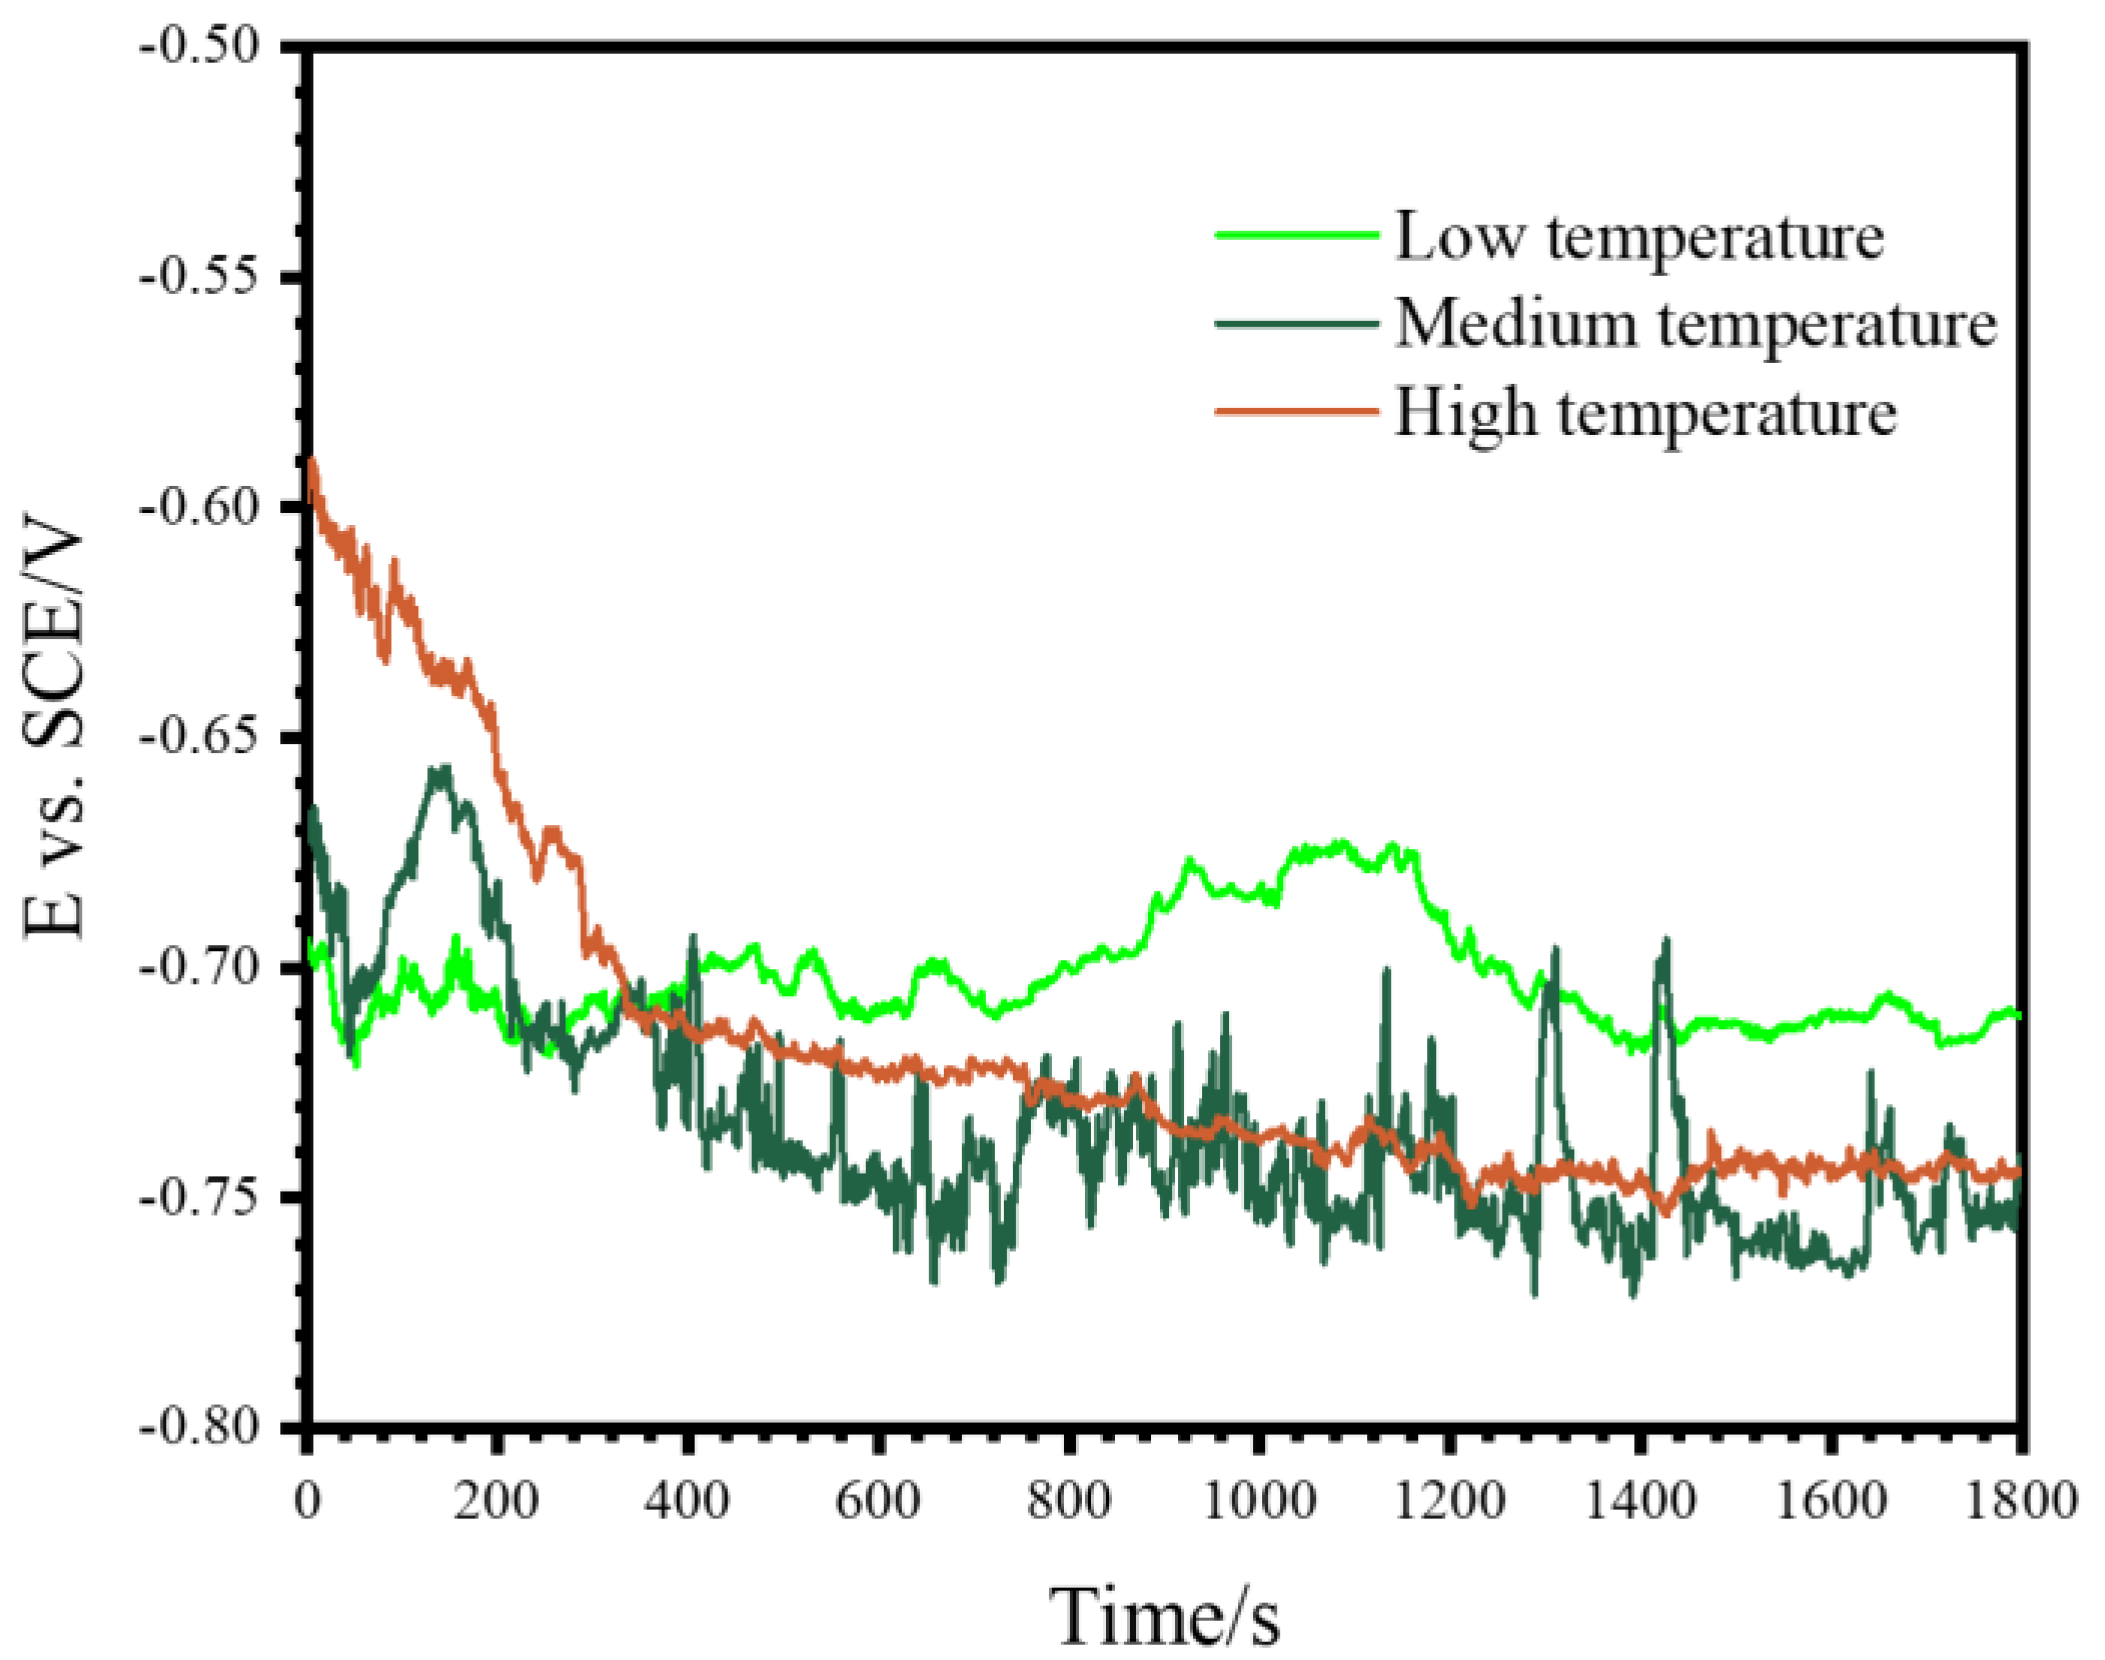
3.1. V-t Responses and Growth Kinetics
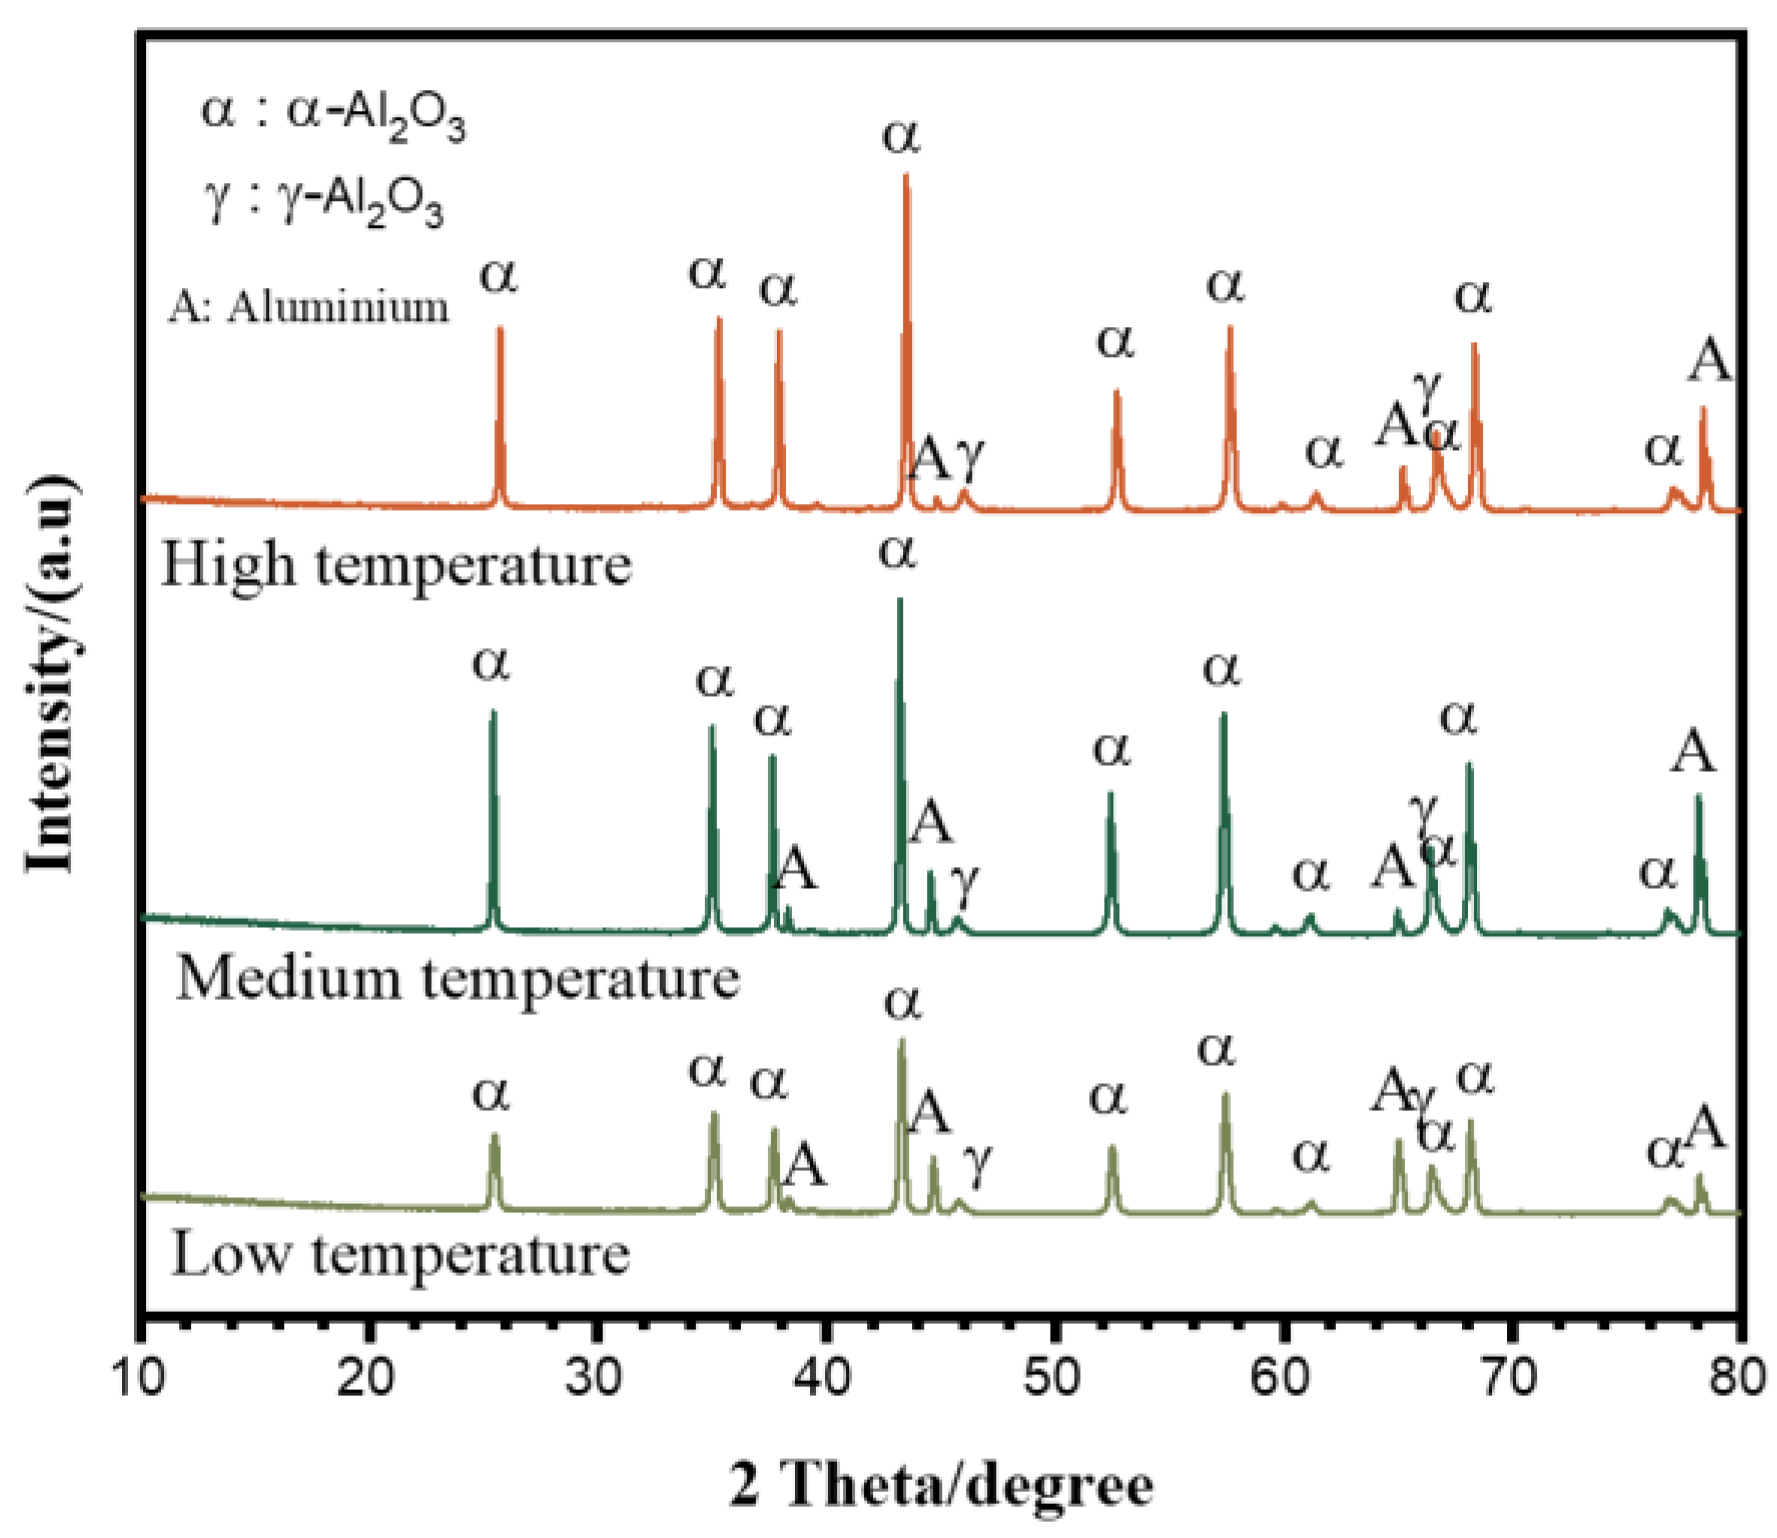
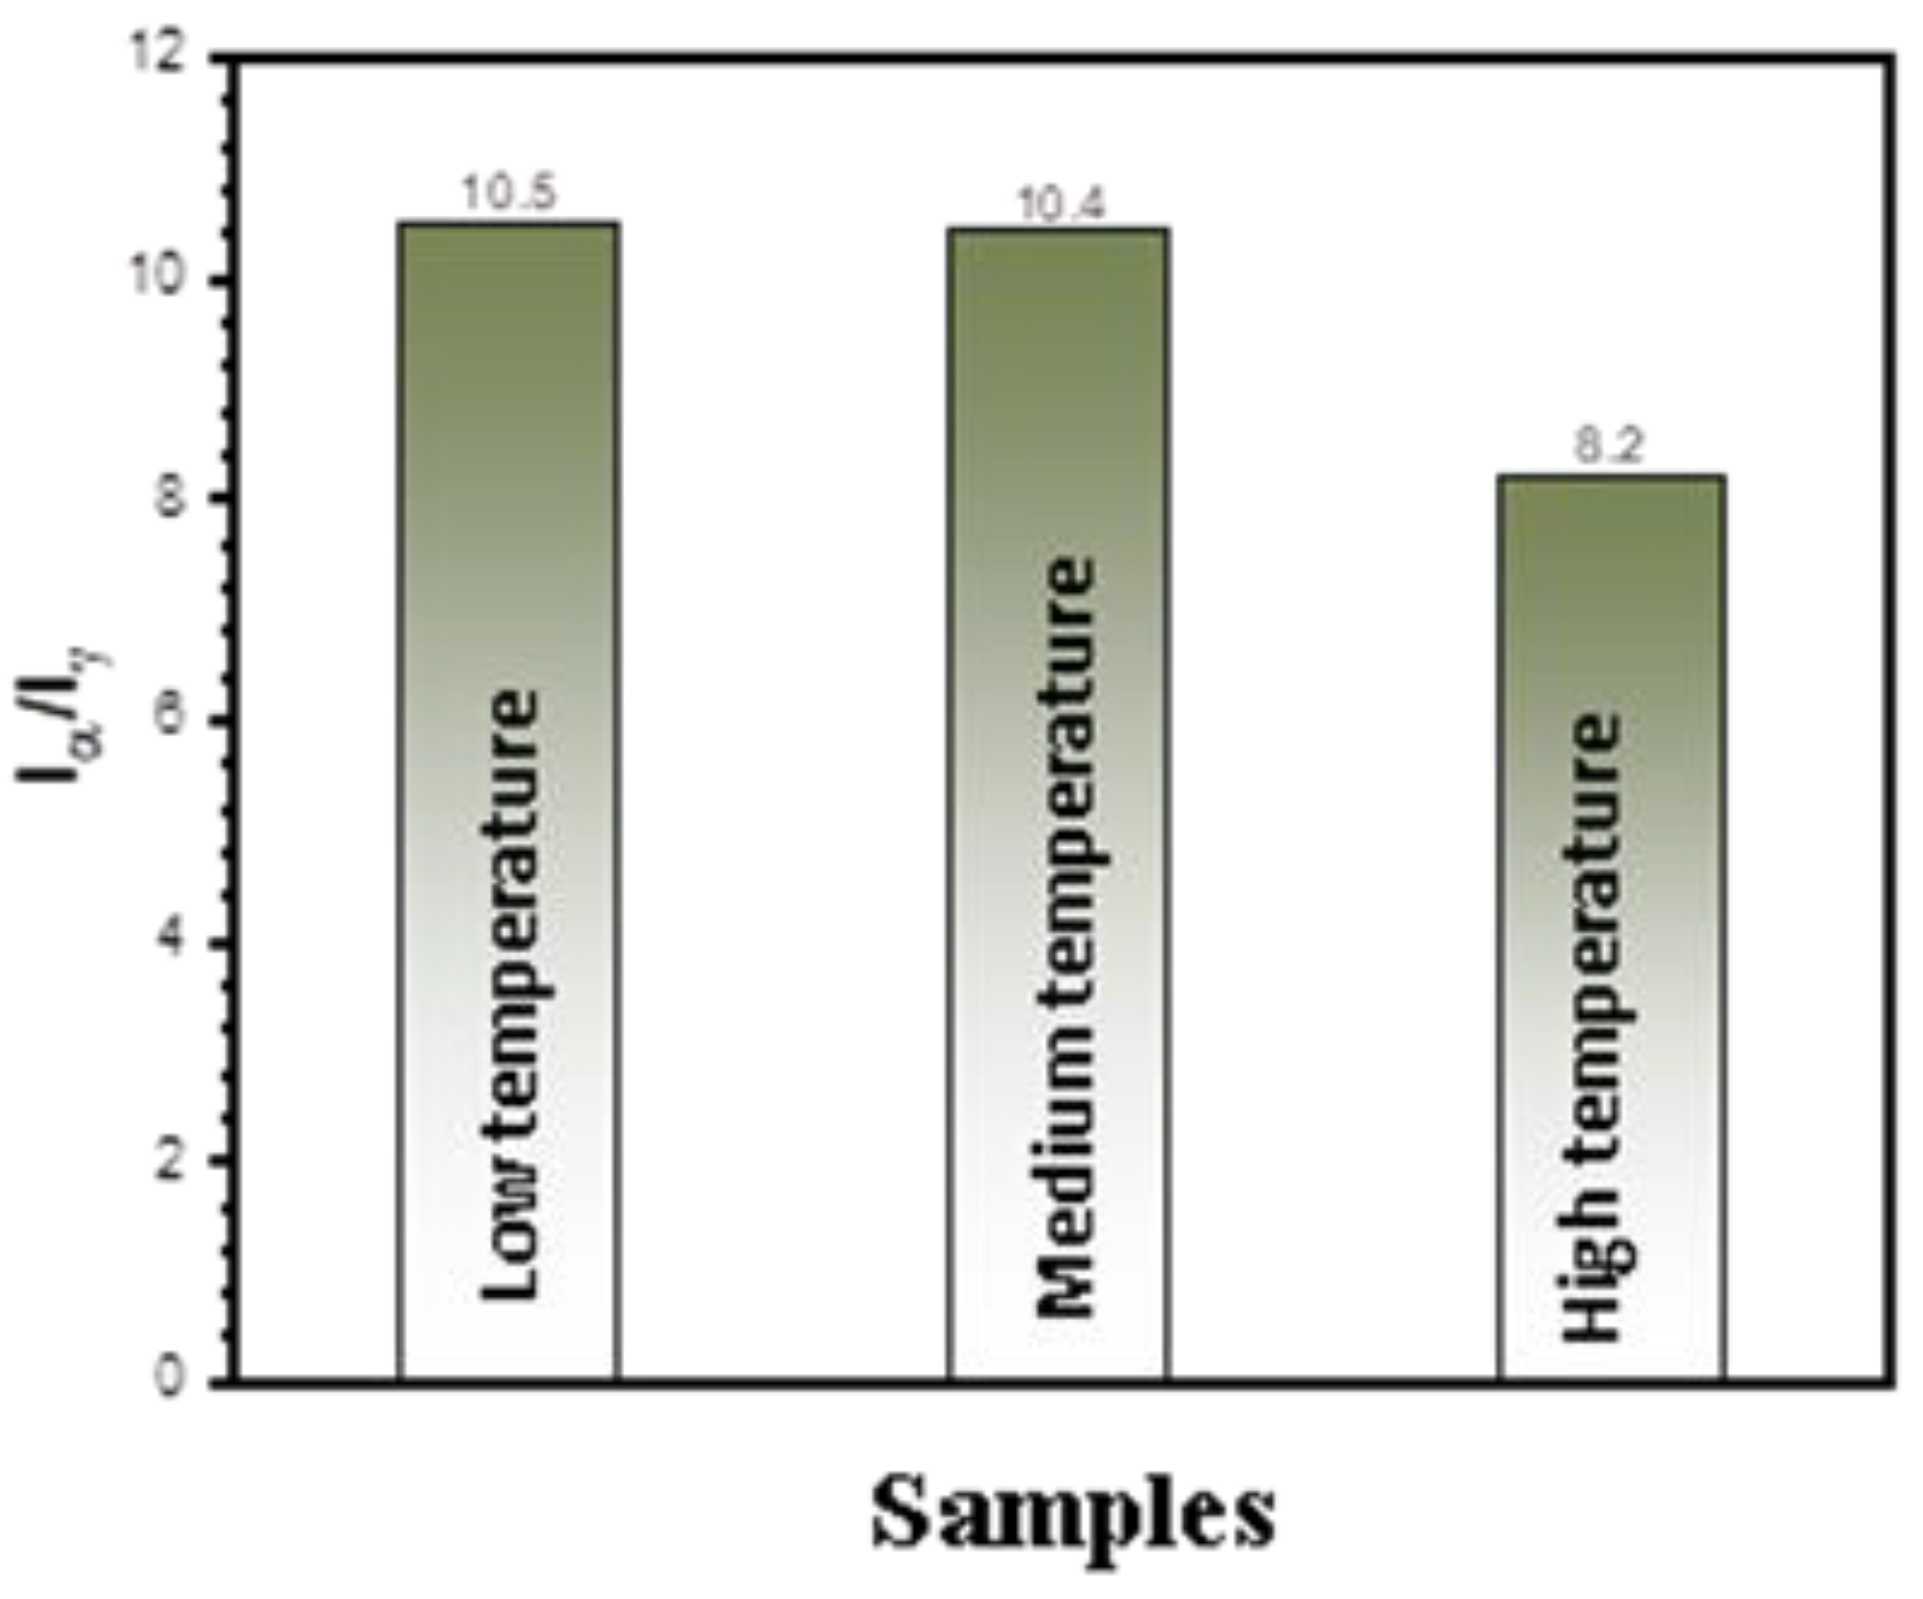
3.2. Phase Structure
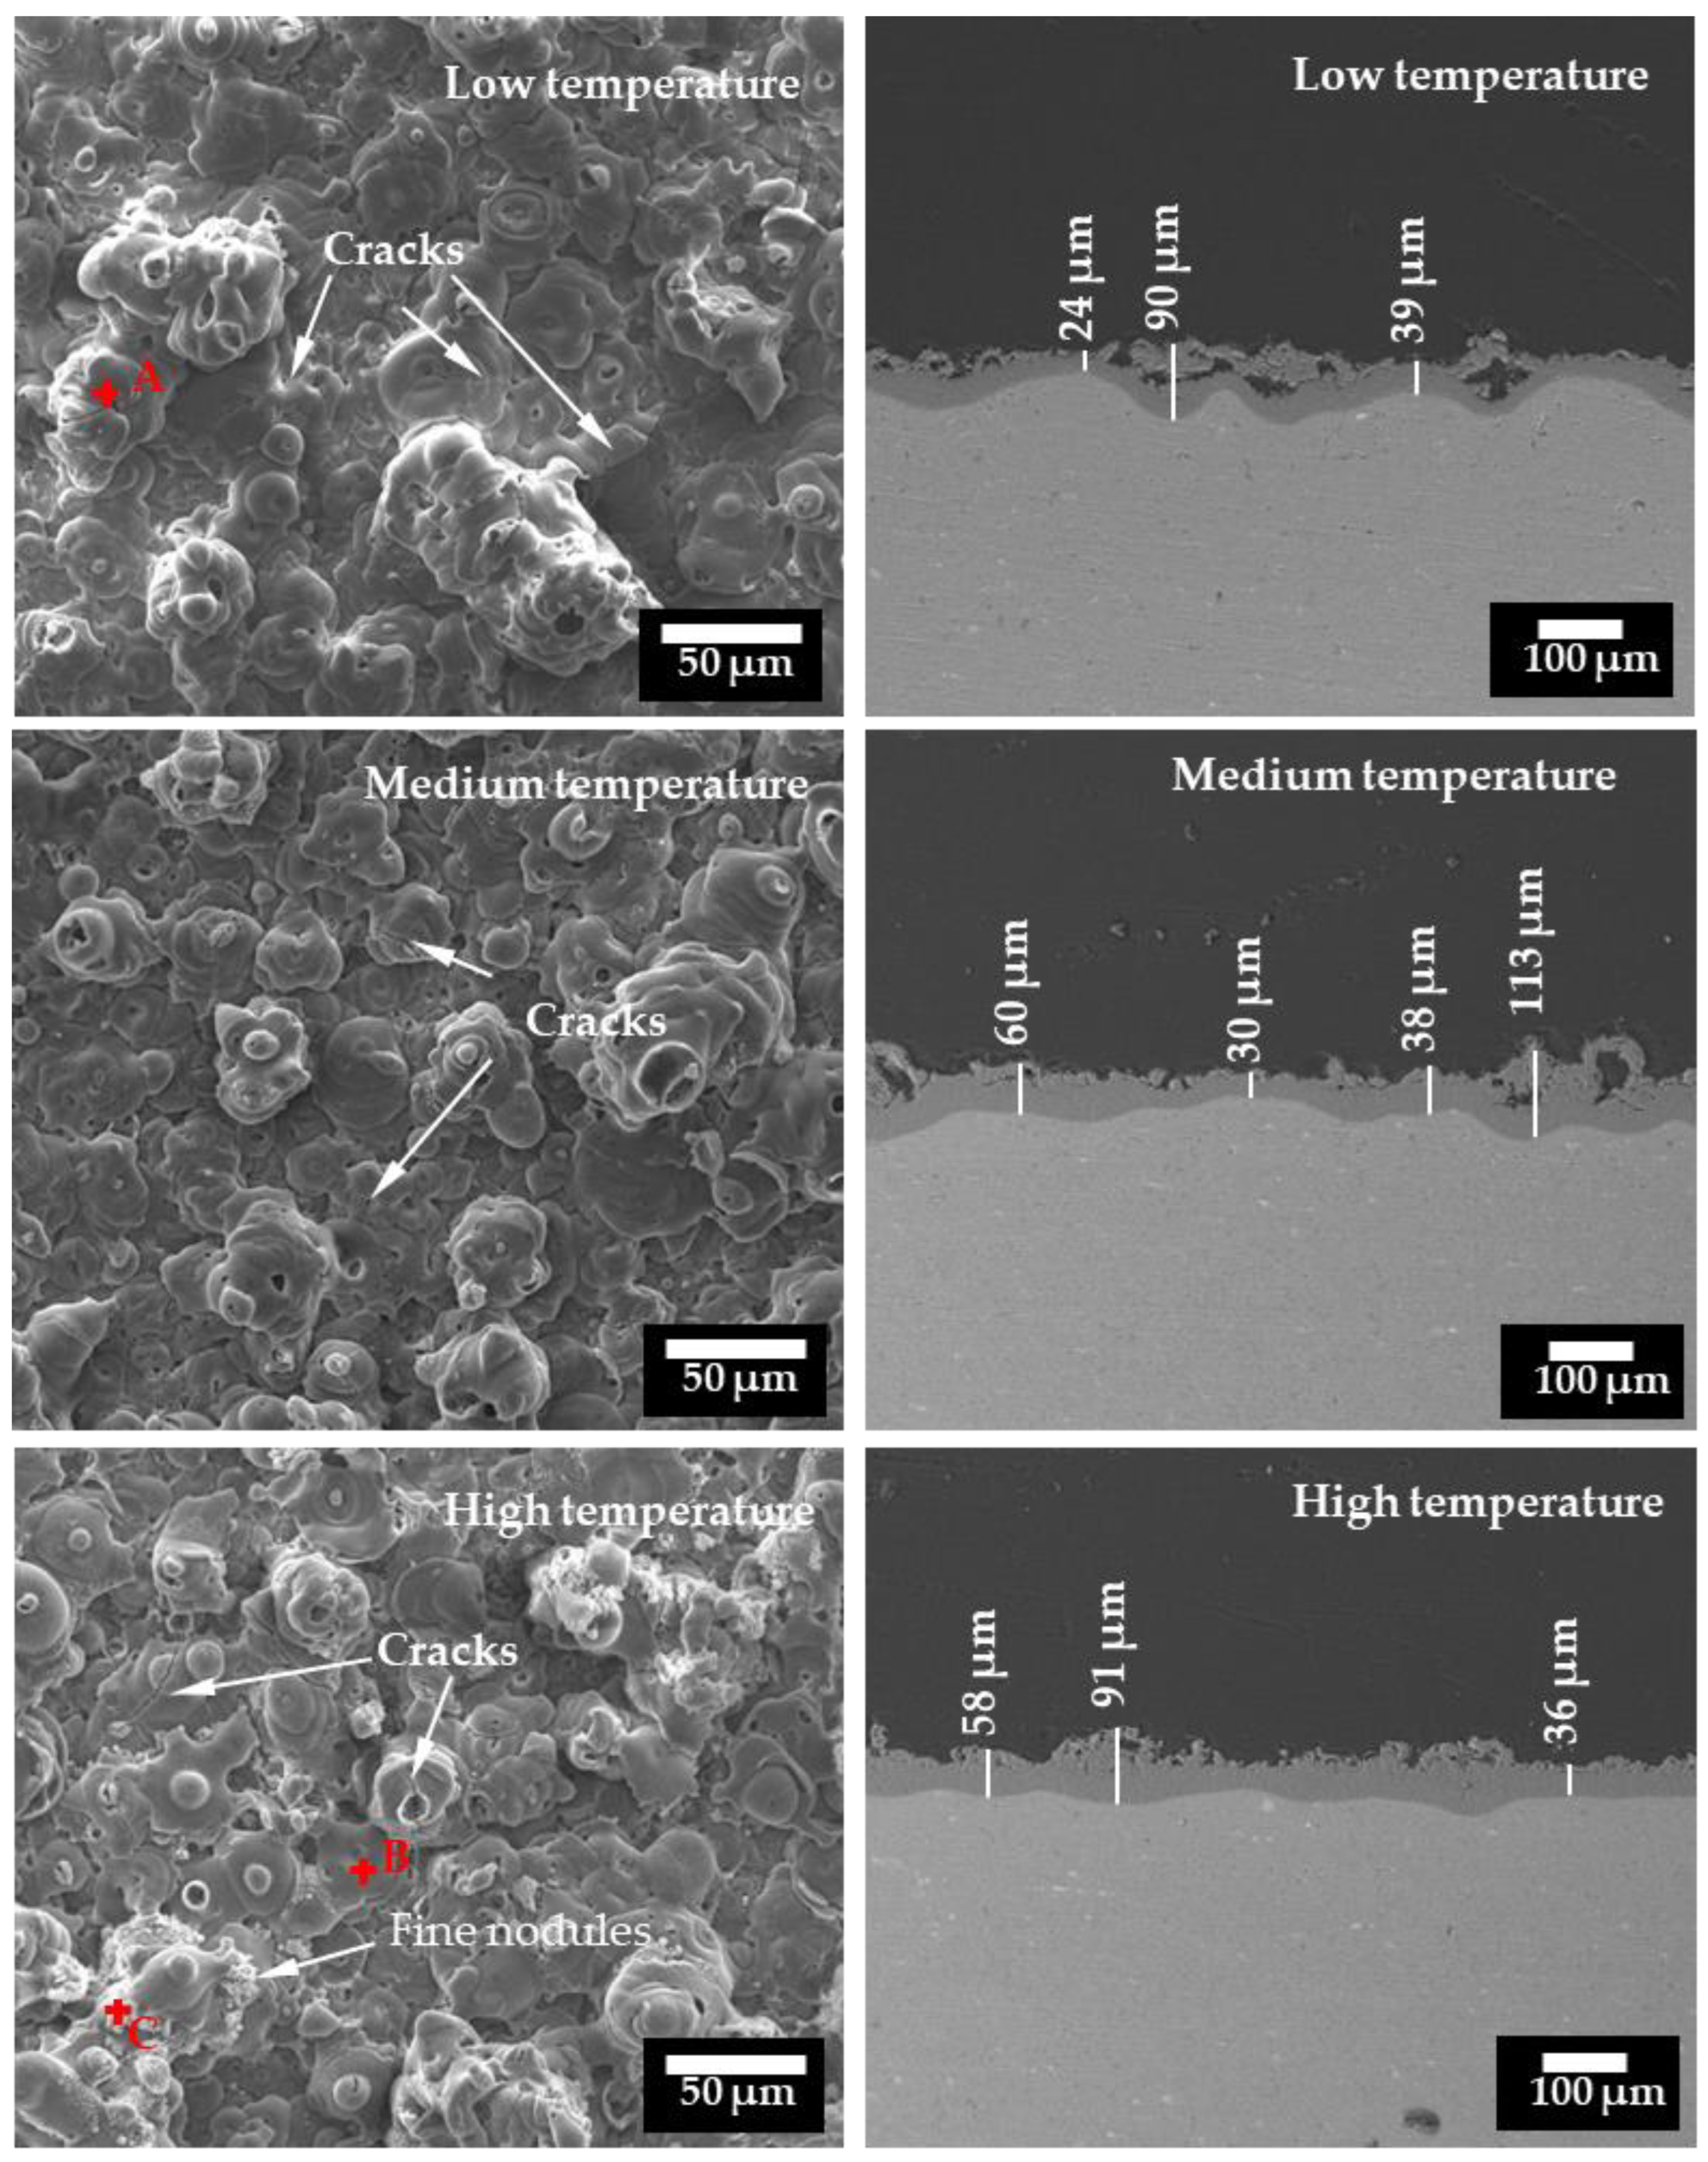
3.3. SEM Morphology
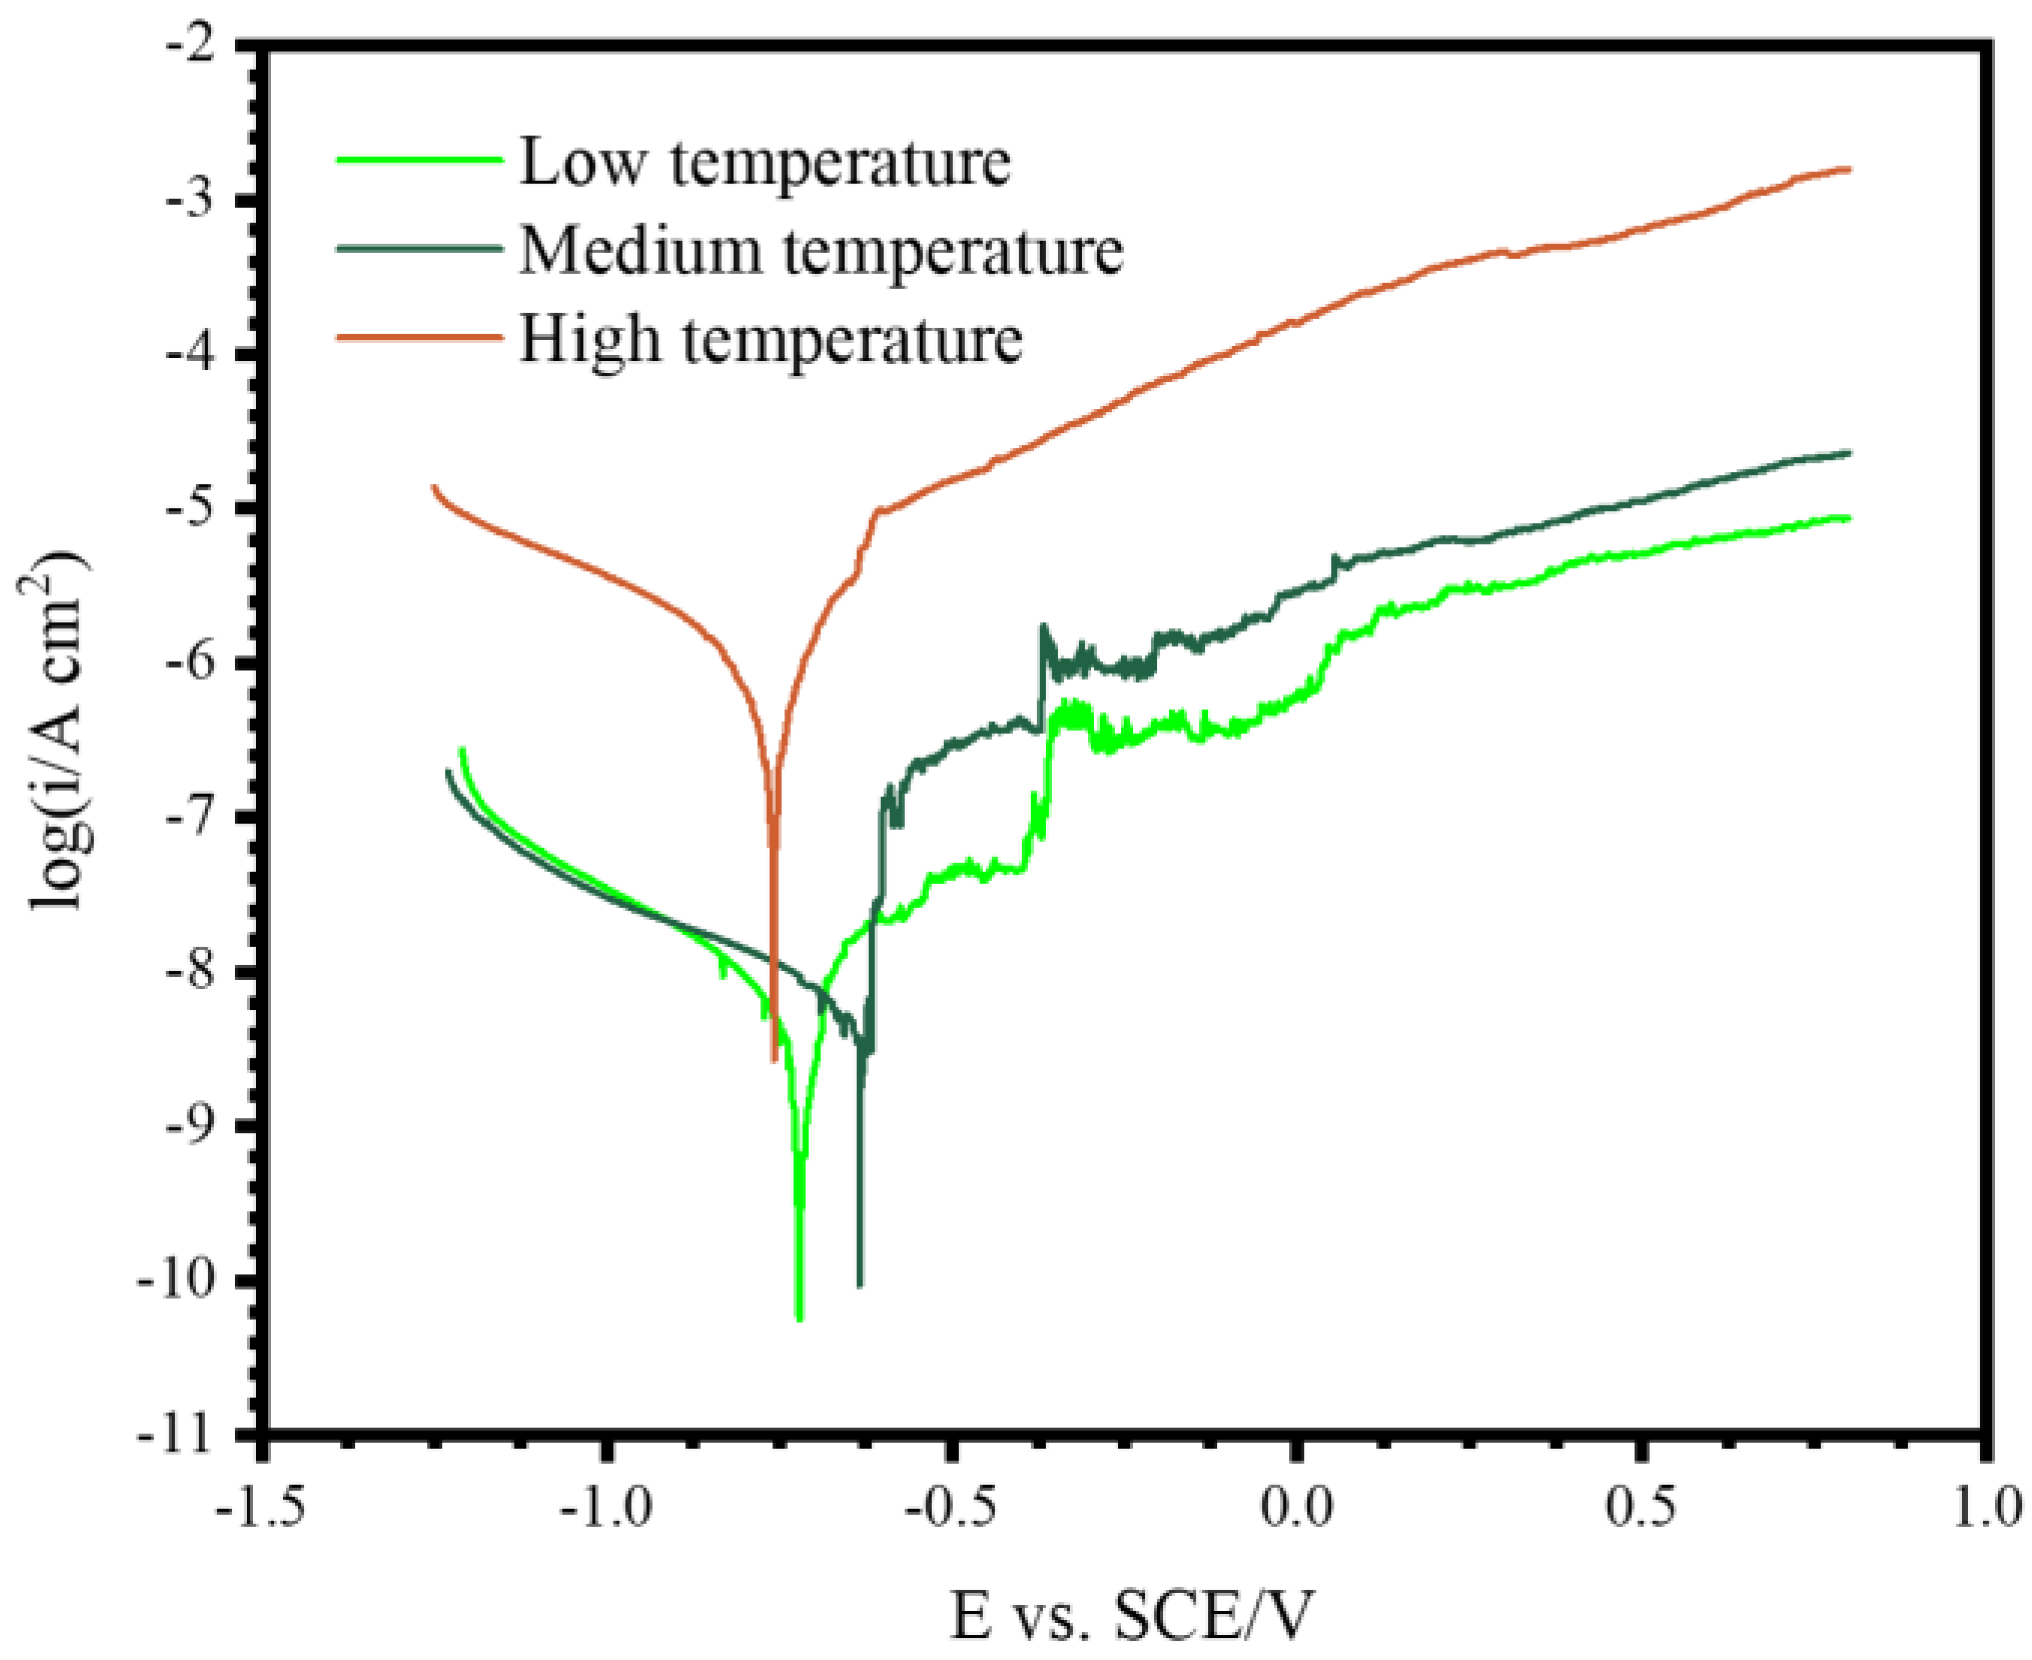
3.4. Corrosion
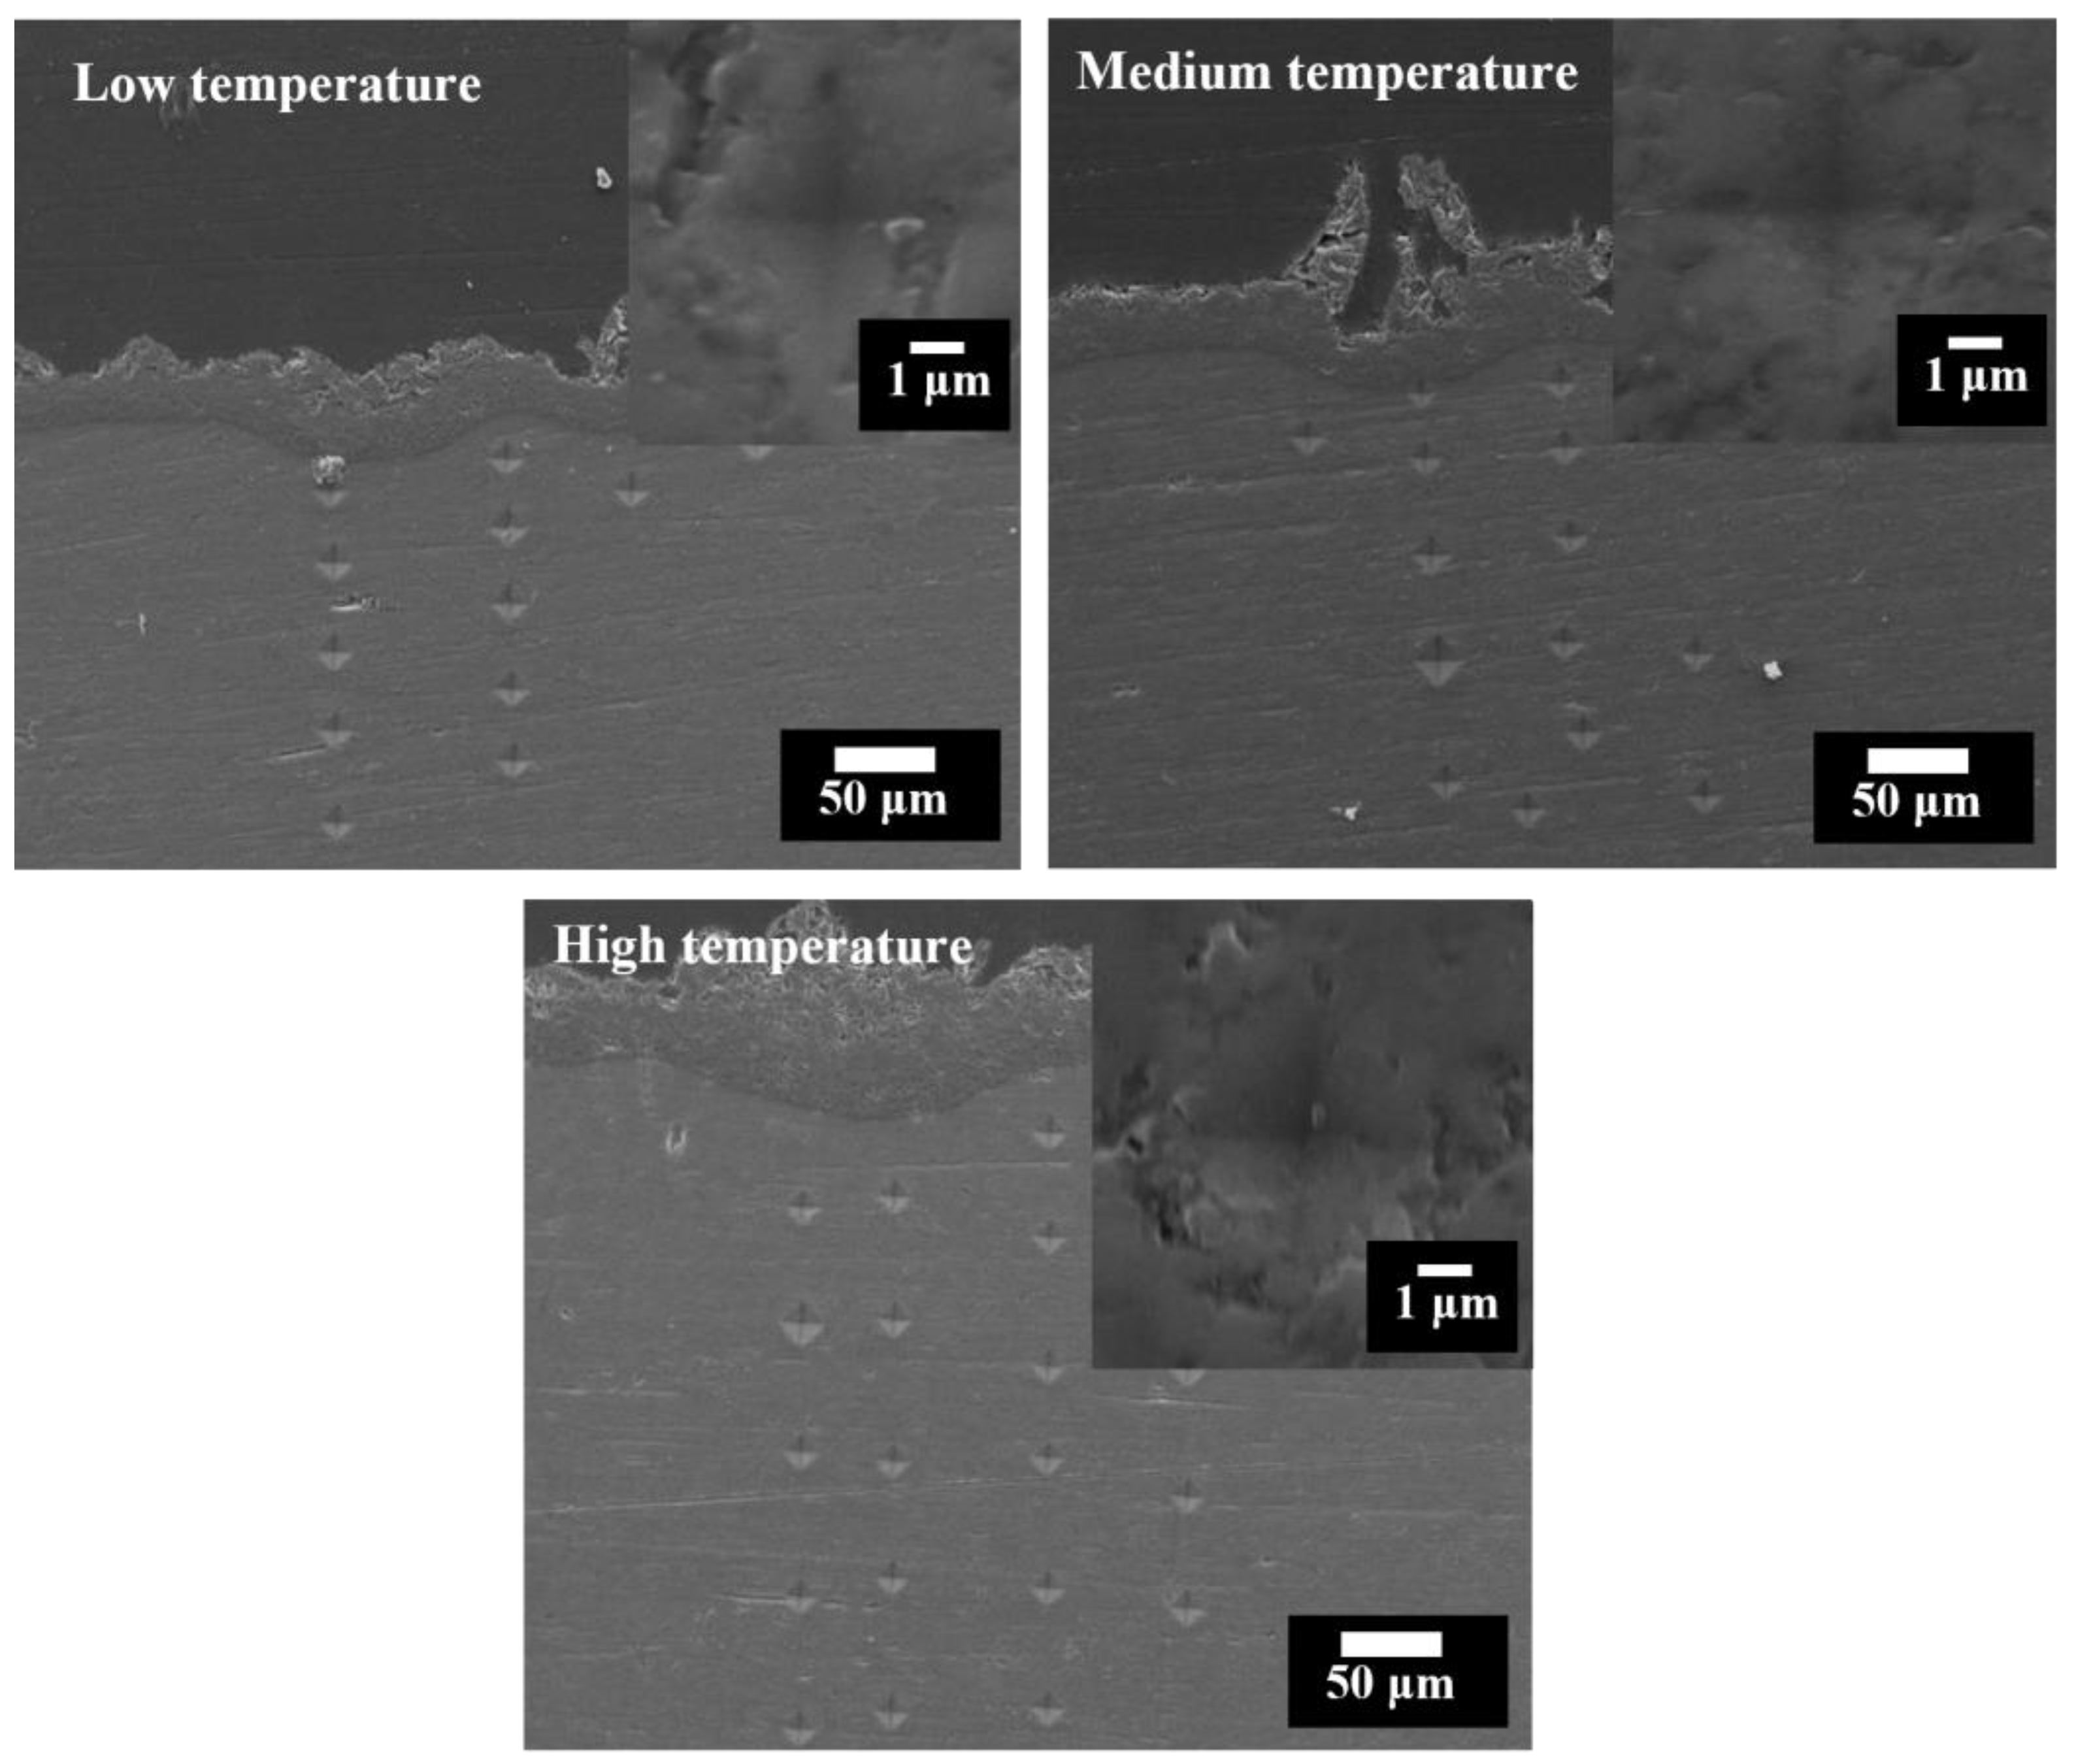
3.5. Microhardness
4. Discussion
5. Conclusions
- The breakdown voltage of the PEO process decreased in the electrolyte with a high temperature.
- The coatings obtained in the high temperature range were more homogeneous than the coatings obtained in the medium and low temperature ranges and possessed higher thickness values according to the eddy current method.
- The coatings obtained in the different temperature ranges showed similar surfaces and cross-sectional morphologies.
- The phase composition of the coatings consisted of α-Al2O3 and γ-Al2O3, with α-Al2O3 being the dominant phase. PEO in the high temperature range led to a slight decrease in the α-Al2O3 content.
- The coatings formed under the low and medium temperature ranges showed excellent corrosion resistance, whereas the corrosion resistance of the coating formed under the high temperature range decreased by two orders according polarization tests.
- The coatings showed hardness values in the range from ~1325 to ~1777 HV. The hardness of the substrate was not affected by the PEO treatments at the different electrolyte temperatures.
Author Contributions
Funding
Data Availability Statement
Acknowledgments
Conflicts of Interest
References
- Yerokhin, A.L.; Nie, X.; Leyland, A.; Matthews, A.; Dowey, S.J. Plasma electrolysis for surface engineering. Surf. Coat. Technol. 1999, 122, 73–93. [Google Scholar] [CrossRef]
- Xue, W.; Deng, Z.; Lai, Y.; Chen, R. Analysis of phase distribution for ceramic coatings formed by microarc oxidation on aluminum alloy. J. Am. Ceram. Soc. 1998, 81, 1365–1368. [Google Scholar] [CrossRef]
- Cheng, Y.L.; Mao, M.K.; Cao, J.H.; Peng, Z.M. Plasma electrolytic oxidation of an Al-Cu-Li alloy in alkaline aluminate electrolytes: A competition between growth and dissolution for the initial ultra-thin films. Electrochim. Acta 2014, 138, 417–429. [Google Scholar] [CrossRef]
- Ji, R.N.; Wang, S.Q.; Zou, Y.C.; Chen, G.L.; Wang, Y.M.; Ouyang, J.H.; Jia, D.C.; Zhou, Y. One-step fabrication of amorphous/ITO-CNTs coating by plasma electrolytic oxidation with particle addition for excellent wear resistance. Appl. Surf. Sci. 2023, 640, 158274. [Google Scholar] [CrossRef]
- Molaei, M.; Fattah-alhosseini, A.; Nouri, M.; Kaseem, M. Assessing the wear properties of plasma electrolytic oxidation TiO2 coatings incorporated ZrO2 nanoparticles on Cp-Ti in simulated body fluid. Appl. Surf. Sci. 2024, 19, 100563. [Google Scholar] [CrossRef]
- Chen, Y.; Nie, X.; Northwood, D.O. Investigation of Plasma Electrolytic Oxidation (PEO) coatings on a Zr–2.5Nb alloy using high temperature/pressure autoclave and tribological tests. Surf. Coat. Technol. 2010, 205, 1774–1782. [Google Scholar] [CrossRef]
- He, X.R.; Feng, T.; Cheng, Y.L.; Hu, P.F.; Le, Z.Z.; Liu, Z.H.; Cheng, Y.L. Fast formation of a black inner α-Al2O3 layer doped with CuO on Al–Cu–Li alloy by soft sparking PEO process. J. Am. Ceram Soc. 2023, 106, 7019–7042. [Google Scholar] [CrossRef]
- Lu, X.; Blawert, C.; Tolnai, D.; Subroto, T.; Kainer, K.U.; Zhang, T.; Wang, F.; Zheludkevich, M.L. 3D reconstruction of plasma electrolytic oxidation coatings on Mg alloy via synchrotron radiation tomography. Corros. Sci. 2018, 139, 395–402. [Google Scholar] [CrossRef]
- Zhang, X.X.; Zhang, Y.P.; Lv, Y.; Dong, Z.H.; Hashimoto, T.; Zhou, X.R. Enhanced corrosion resistance of AZ31 Mg alloy by one-step formation of PEO/Mg-Al LDH composite coating. Corros. Commun. 2022, 6, 67–83. [Google Scholar] [CrossRef]
- Lukiyanchuk, I.V.; Rudnev, V.S.; Tyrina, L.M. Plasma electrolytic oxide layers as promising systems for catalysis. Surf. Coat. Technol. 2016, 307, 1183–1193. [Google Scholar] [CrossRef]
- Coto, M.; Troughton, S.C.; Knight, P.; Joshi, R.; Francis, R.; Kumar, R.V.; Clyne, T.W. Optimization of the microstructure of TiO2 photocatalytic surfaces created by Plasma Electrolytic Oxidation of titanium substrates. Surf. Coat. Technol. 2021, 411, 127000. [Google Scholar] [CrossRef]
- Chen, J.; Zhang, Y.; Ibrahim, M.; Etim, I.P.; Tan, L.; Yang, K. In vitro degradation and antibacterial property of a copper-containing micro-arc oxidation coating on Mg-2Zn-1Gd-0.5Zr alloy. Colloids Surf. B 2019, 179, 77–86. [Google Scholar] [CrossRef] [PubMed]
- Zhang, X.X.; Lv, Y.; Fu, S.; Wu, Y.L.; Lu, X.Q.; Yang, L.; Liu, H.F.; Dong, Z.H. Synthesis, microstructure, anti-corrosion property and biological performances of Mn-incorporated Ca-P/TiO2 composite coating fabricated via micro-arc oxidation. Mater. Sci. Eng. C 2020, 117, 111321. [Google Scholar] [CrossRef] [PubMed]
- Lv, Y.; Cheng, Y.B.; Meng, X.Z.; Xu, J.; Dong, Z.H.; Zhang, X.X. Ultrasound-Auxiliary Preparation of Antifouling Cu-Enriched Titanium Oxide Ceramic Layer. Coatings 2023, 13, 1099. [Google Scholar] [CrossRef]
- Zhang, Y.P.; Li, Y.; Lv, Y.; Zhang, X.X.; Dong, Z.H.; Yang, L.; Zhang, E.L. Ag distribution and corrosion behaviour of the plasma electrolytic oxidized antibacterial Mg-Ag alloy. Electrochim. Acta 2022, 411, 140089. [Google Scholar] [CrossRef]
- Iqbal, M.A.; Matykina, E.; Arrabal, R.; Mohedano, M. Role of anodic precursor layer thickness on PEO coatings: Energy consumption and long-term corrosion performance. Surf. Coat. Technol. 2024, 476, 130186. [Google Scholar] [CrossRef]
- Gao, Y.; Chen, Y.; Xiao, S.; Li, T.J.; Wu, H.; Meng, X.Y.; Li, W.J.; Fan, S.Y.; Ye, Z.H.; Chen, G.H.; et al. Effects and mechanism of Zn on the structure and corrosion resistance of microarc oxidation coatings on aluminum alloy. Appl. Surf. Sci. 2024, 659, 159909. [Google Scholar] [CrossRef]
- Liang, J.; Peng, Z.J.; Cui, X.J.; Li, R.X.; Wang, B. Characterization of V-containing black plasma electrolytic oxide coatings on aluminium alloy: Impact of base electrolytes. J. Mater. Res. Technol. 2024, 30, 110–119. [Google Scholar] [CrossRef]
- Hakimizad, A.; Raeissi, K.; Santamaria, M.; Asghari, M. Effects of pulse current mode on plasma electrolytic oxidation of 7075 Al in Na2WO4 containing solution: From unipolar to soft-sparking regime. Electrochim. Acta 2018, 284, 618–629. [Google Scholar] [CrossRef]
- Michalska, J.; Sowa, M.; Stolarczyk, A.; Warchoł, F.; Nikiforow, K.; Pisarek, M.; Dercz, G.; Pogorielov, M.; Mishchenko, O.; Simka, W. Plasma electrolytic oxidation of Zr-Ti-Nb alloy in phosphate-formate-EDTA electrolyte. Electrochim. Acta 2022, 419, 140375. [Google Scholar] [CrossRef]
- Yerokhin, A.L. Study of heat release during plasma-electrolytic oxidation of aluminum, In Electrophysical & Electrochemical Treatment of Materials; TulGU: Tula, Russia, 1996; pp. 30–36. (In Russian) [Google Scholar]
- Yang, X.; Chen, L.; Qu, Y.; Liu, R.; Wei, K.; Xue, W. Optical emission spectroscopy of plasma electrolytic oxidation process on 7075 aluminum alloy. Surf. Coat. Technol. 2017, 324, 18–25. [Google Scholar] [CrossRef]
- Vasil’eva, M.S.; Rudnev, V.S.; Tyrina, L.M.; Lukiyanchuk, I.V.; Kondrikov, N.B.; Gordienko, P.S. Phase composition of coatings formed on titanium in borate electrolyte by microarch oxidation. Russ. J. Appl. Chem. 2002, 75, 569–572. [Google Scholar] [CrossRef]
- Liang, J.; Guo, B.G.; Tian, J.; Liu, H.W.; Zhou, J.F.; Liu, W.M.; Xu, T. Effects of NaAlO2 on structure and corrosion resistance of microarc oxidation coatings formed on AM60B magnesium alloy in phosphate–KOH electrolyte. Surf. Coat. Technol. 2005, 199, 121–126. [Google Scholar] [CrossRef]
- Stojadinovic, S.; Vasilic, R.; Belca, I.; Petkovic, M.; Kasalica, B.; Nedic, Z.; Zekovic, L. Characterization of the plasma electrolytic oxidation of aluminium in sodium tungstate. Corros. Sci. 2010, 52, 3258–3265. [Google Scholar] [CrossRef]
- Yerokhin, A.L.; Snizhko, L.O.; Gurevina, N.L.; Leyland, A.; Pilkington, A.; Matthews, A. Discharge characterization in plasma electrolytic oxidation of aluminium. J. Phys. D Appl. Phys. 2003, 36, 2110–2120. [Google Scholar] [CrossRef]
- Hashemzadeh, M.; Raeissi, K.; Ashrafizadeh, F.; Hakimizad, A.; Santamaria, M. Incorporation mechanism of colloidal TiO2 nanoparticles and their effect on properties of coatings grown on 7075 Al alloy from silicate-based solution using plasma electrolytic oxidation. Trans. Nonferrous Met. Soc. 2021, 31, 3659–3676. [Google Scholar] [CrossRef]
- Hu, P.F.; Wei, B.J.; Cheng, Y.L.; Cheng, Y.L. Discharge channel structure revealed by plasma electrolytic oxidation of AZ31Mg alloy with magnetron sputtering Al layer and corrosion behaviors of treated alloy. Trans. Nonferrous Met. Soc. 2024, 34, 139–156. [Google Scholar] [CrossRef]
- Ikonopisov, S. Theory of electrical breakdown during formation of barrier anodic films. Electrochim. Acta 1977, 22, 1017–1082. [Google Scholar] [CrossRef]
- Fu, X.C.; Shen, W.X.; Yao, T.Y.; Hou, W.H. Physical Chemistry, 5th ed.; Higher Education Press: Beijing, China, 2006; Volume II, p. 3. [Google Scholar]
- Cheng, Y.L.; Cao, J.H.; Mao, M.K.; Peng, Z.M.; Skeldon, P.; Thompson, G.E. High growth rate, wear resistant coatings on an Al–Cu–Li alloy by plasma electrolytic oxidation in concentrated aluminate electrolytes. Surf. Coat. Technol. 2015, 269, 74–82. [Google Scholar] [CrossRef]
- Gębarowski, W.; Pietrzyk, S. “Growth characteristics of the oxide layer on aluminium in the process of plasma electrolytic oxidation. Arch. Metall. Mater. 2014, 59, 407–411. [Google Scholar] [CrossRef]
- Rogov, A.B.; Matthews, A.; Yerokhin, A. The role of cathodic current in plasma electrolytic oxidation of Aluminium: Phenomenological concepts of the ‘soft sparking’ mode. Langmuir 2017, 33, 11059–11069. [Google Scholar] [CrossRef]
- Cheng, Y.L.; Feng, T.; Cheng, Y.L. A Systematic Study of the Role of Cathodic Polarization and New Findings on the Soft Sparking Phenomenon from Plasma Electrolytic Oxidation of an Al-Cu-Li Alloy. J. Electrochem. Soc. 2022, 169, 071505. [Google Scholar] [CrossRef]


| Sample | Ecorr (V vs. SCE) | ba (mV/dec) | bc (mV/dec) | icorr (A cm−2) |
|---|---|---|---|---|
| Low temperature | −0.723 | 260 | 380 | 2.87 × 10⁻⁹ |
| Medium temperature | −0.653 | 385 | 613 | 3.56 × 10⁻⁹ |
| High temperature | −0.758 | 104 | 525 | 5.38 × 10⁻⁷ |
| Sample | Hardness (HV) | |
|---|---|---|
| Coating | Substrate | |
| Low temperature | 1325 ± 142 | 58.2 ± 5.4 |
| Medium temperature | 1777 ± 496 | 64.2 ± 3.5 |
| High temperature | 1589 ± 260 | 61.7 ± 5.1 |
Disclaimer/Publisher’s Note: The statements, opinions and data contained in all publications are solely those of the individual author(s) and contributor(s) and not of MDPI and/or the editor(s). MDPI and/or the editor(s) disclaim responsibility for any injury to people or property resulting from any ideas, methods, instructions or products referred to in the content. |
© 2024 by the authors. Licensee MDPI, Basel, Switzerland. This article is an open access article distributed under the terms and conditions of the Creative Commons Attribution (CC BY) license (https://creativecommons.org/licenses/by/4.0/).
Share and Cite
Cheng, Y.; Shi, X.; Lv, Y.; Zhang, X. Effect of Electrolyte Temperature on Plasma Electrolytic Oxidation of Pure Aluminum. Metals 2024, 14, 615. https://doi.org/10.3390/met14060615
Cheng Y, Shi X, Lv Y, Zhang X. Effect of Electrolyte Temperature on Plasma Electrolytic Oxidation of Pure Aluminum. Metals. 2024; 14(6):615. https://doi.org/10.3390/met14060615
Chicago/Turabian StyleCheng, Yubing, Xuemei Shi, You Lv, and Xinxin Zhang. 2024. "Effect of Electrolyte Temperature on Plasma Electrolytic Oxidation of Pure Aluminum" Metals 14, no. 6: 615. https://doi.org/10.3390/met14060615
APA StyleCheng, Y., Shi, X., Lv, Y., & Zhang, X. (2024). Effect of Electrolyte Temperature on Plasma Electrolytic Oxidation of Pure Aluminum. Metals, 14(6), 615. https://doi.org/10.3390/met14060615