Abstract
The creep response in the air of commercially pure titanium was investigated at 550, 600, and 650 °C to assess the effect of oxidation on the mechanical response. Experiments demonstrated that prolonged exposures at high temperatures produced a marked reduction in the minimum creep rate under a given applied stress. Microhardness measurements showed that a hardened zone formed in proximity to the surface due to oxygen penetration into the metal. A simplified composite model was then used to describe the creep response. In this model, the sample consisted of two zones, the hard case that was enriched in oxygen and the soft pure-titanium core, both creeping with similar strain rates. Calculations led to an estimation of the dependence of the minimum creep rate on stress and temperature for the hard high-oxygen zone. The simplified composite model presented here provided a good description of the experimental creep data for pure titanium, tested in its air, and a reliable picture of the effect of oxidation on complex Ti alloys.
1. Introduction
The effect of oxidation of titanium and its alloys is a subject that has aroused keen interest among investigators due to the importance of these materials for medium- and high-temperature applications. Detailed studies, such as [1], just to quote a single example, have shown that an increase in the oxidation temperature from 600 to 700 °C significantly intensifies the process of oxide-scale growth. Hardness is very high in correspondence with the oxide layer and gradually decreases as the distance from the surface increases. This high hardness below the oxide layer clearly indicates the presence of an oxygen diffusion zone. A hard and brittle “α-case,” rich in oxygen, thus forms due to oxygen diffusion [2]. In castings, the α-case is the result of a reaction between liquid Ti and the mold wall that leads to the early formation of TiO2 and then of a hard, solid solution of oxygen into titanium on the surface of the part. The case is very brittle, and its cracking during straining causes the early fracture of the sample [2]. This fact is of some relevance when creep tests on Ti and its alloys are carried out in air, since high temperature exposure also causes the penetration of oxygen into the alloy and the formation of the α-case [3]. Oxygen exposure results in a reduction in the minimum creep rate [3,4], although an opposite behavior was once reported [5] (indeed, after testing a single experimental condition). In this context, the analysis of the creep response in the air of commercially pure titanium remains an interesting subject to be dealt with. At least two recent studies have provided a clear picture of the oxidation phenomena that can occur during creep exposure and of their effects on the mechanical properties of pure Ti. Magazzeni and co-workers investigated the oxygen diffusion layer generated on a CP titanium specimen exposed for 230 h at 700 °C in air [6]. These authors compared nanoindentation and electro-microprobe analysis maps, concluding that there is a clear power–law relationship between hardness and oxygen concentration. The same conclusion was previously reached by Zheng-Chen et al. [7]. The Vickers hardness (HV) was found to be proportional to [O]m, where [O] was the oxygen concentration (wt.%) and m was close to 0.5. The oxide scale formation and the diffusion of oxygen in pure metal have, thus, been investigated in some detail, but the effects of oxygen on the creep response of pure Ti in itself remains largely unexplored.
This study is part of a wider research project aimed at clarifying the effects of friction stir welding (FSW) [8] on the creep response in the air of commercially pure Titanium. To properly identify the effects of the extensive microstructural changes introduced by FSW on the creep response, the independent effects of oxidation should be preliminarily quantified. This part of the study aimed at investigating this phenomenon, trying to quantify the effects of oxygen enrichment on the minimum creep rate dependence on stress and temperature. In addition, a simple, easy to handle, and still reasonably accurate model for quantifying the effects of oxidation on creep response (minimum creep rate) will be proposed.
2. Materials and Methods
The material investigated in the present study was commercially pure Ti (grade 2) (CT-Ti Gr.2, UTS of 500 MPa) in the form of a 3 mm thick plate. The material was in an annealed state with a grain size of 20–30 μm. The hardness of the plate (150–160 HV) was typical of an annealed Ti CP-2 containing 0.15% O [7]. Dog-bone creep samples with the geometry illustrated in [8] (3 mm × 3 mm square section, 25 mm gauge length) were creep-tested in constant load machines at 550, 600, and 650 °C. Two types of experiments were carried out: constant load experiments (CLEs) and variable load experiments (VLEs). In most of the CLEs, the samples were loaded after soaking for 0.5 h at the testing temperature, and the load was maintained until interruption of the tests, well in tertiary stage but before fracture. Two CLE samples were annealed at the test temperature (650 °C) for 70 h before loading. In VLEs, the sample was loaded after soaking, but the initial load was maintained until the minimum creep rate was reached and then changed until a new value of the minimum creep rate was attained. In both CLE and VLE experiments, the tests were interrupted during the tertiary stage at strains between 30 and 40%, well before fracture.
To maintain a homogeneous heating profile in the furnace, the test temperature was measured using four thermocouples. Elongation was continuously measured using a linear variable displacement transducer (LVDT). All creep experiments were carried out in air.
Crept samples were mechanically ground, polished, etched using Kroll’s reagent (100 mL H2O + 2 mL HF + 4 mL HNO3), and then observed using a Leica DMi8 (Leica Microsystems, Wetzlar, Germany) optical microscope.
Microhardness measurements under a 25 g load were carried out on sample heads, or, in other words, in unstrained portions of the specimen, to evaluate the hardening effect of oxygen and its penetration.
3. Results
3.1. Creep Response
Figure 1 plots the strain rate vs. strain curves for CLEs and VLEs; the stress values are the nominal ones, calculated with reference to the initial cross-sectional area of the sample. The creep curves exhibited the usual, conventional three-stage shape with a well-defined primary region, a minimum creep rate range, and a prolonged tertiary stage. Figure 1d shows the CLE tests carried out under 20 and 40 MPa (nominal) after 0.5 and 70 h of soaking at the testing temperature. The samples annealed for 70 h exhibited substantially lower values for the strain rate at a given stress. Table 1 summarizes the experimental values of the minimum creep rate (). Figure 2 plots the minimum creep rate as a function of the true stress (σ), or, in other words, the stress corresponding to the strain in which the minimum creep rate was measured. Figure 2a does not discriminate between the data obtained via CLEs or VLEs and seems to suggest that the usual power law
is substantially obeyed. A major point is that the stress exponent n, quite unusually, increased with temperature from 4.6 at 550 °C to 5.8 at 650 °C. A higher creep exponent is, in general, observed when a strengthening mechanism, such as the particle-dislocation interaction, is operative, which is obviously not the case for the pure Ti considered in the present study. Nevertheless, the increase in stress exponent with temperature clearly suggests that a permanence at high T causes a reduction in the minimum creep rate.
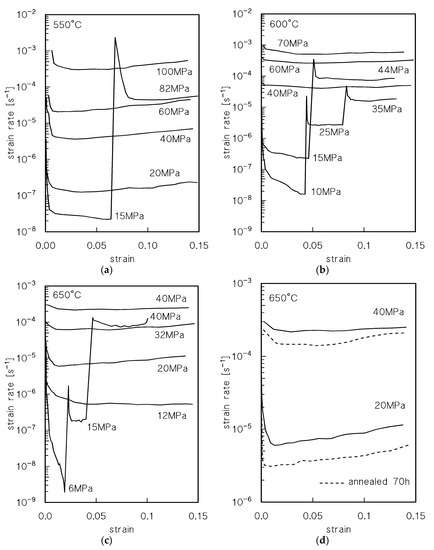
Figure 1.
Strain rate vs. strain creep curves: (a) 550 °C; (b) 600 °C; (c) 650 °C; (d) 650 °C, effect of annealing for 70 h before loading at the testing temperature.

Table 1.
Summary of results of the experimental tests.
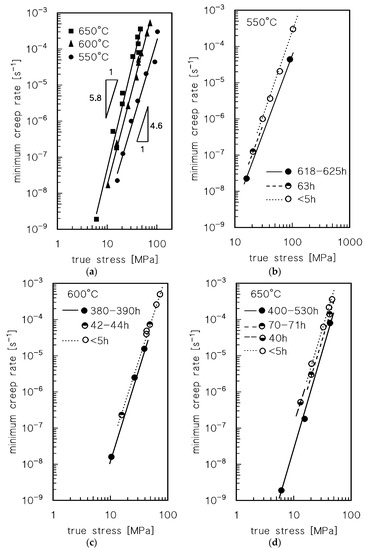
Figure 2.
Minimum strain rate as a function of true stress: (a) all experiments; (b) 550 °C; (c) 600 °C; (d) 650 °C. In (b–d), symbols are differentiated according to the duration of high temperature exposure in correspondence with the minimum creep rate.
An interesting feature is that, after load-changes in the VLEs, the minimum creep rates were well below those recorded under similar loads in the CLEs. This phenomenon is well apparent for the VLE10, where the strain rate under 40 MPa (nominal; the true stress value was 42.9 MPa) was much lower than that measured in a CLE under the same nominal stress. Additionally, Figure 2 provides similar evidence; a clear picture of the material response can be obtained by differentiating the symbols of the experimental data according to the duration of high-temperature exposure they experienced when the considered minimum creep rate was recorded (Figure 2b–d). The minimum creep rates after load changes in VLEs were invariably lower than those that could be calculated by the curve that interpolated the data from CLEs.
Figure 2 clearly suggests that, indeed, the experimental data roughly align on parallel curves, which shift toward lower strain rates when the time of exposure increases. Thus, both Figure 1 and Figure 2 demonstrate that high-temperature exposure results in a substantial hardening of the sample. A similar effect can hardly be explained in terms of microstructural mechanisms in this pure metal unless the effect of oxidation is considered. Thus, a more detailed and quantitative analysis of the hardening effect of oxidation is required.
3.2. Oxidation and Hardening Effect: Microhardness Profiles
Figure 3a shows an example of microhardness measurements on the heads of the samples that experienced a long exposure at high temperatures. As expected, the higher was the temperature and the longer was the duration of exposure, the higher was the hardness of the surface and the thicker was the hardened zone. The formation of a hard and brittle oxide surface layer at 650 °C during the longest time of exposure, on the other hand, is easily noticeable in Figure 3a. This oxide layer was much thinner, or even unnoticeable, at lower temperatures and shorter times of exposure. The hardness of the base metal remained substantially unchanged with respect to the initial value (150–160 HV). This evidence confirms that permanence at these temperatures, in the absence of a significant applied stress, did not produce important changes in the microstructure of the annealed plate.
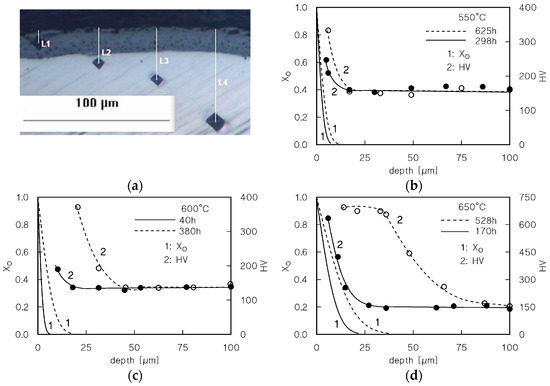
Figure 3.
(a) Microhardness measurements in the VLE sample tested at 650 °C for 625 h; (b–d) microhardness (circles) and calculated profile of oxygen (XO parameter, curves) for the longest tests at 550 °C (b), 600 °C (c), and 650 °C (d).
The hardening effect illustrated in Figure 3 is fully consistent with similar findings in the literature, which demonstrates that this behavior is due to oxygen diffusion in Ti (see, for example, [9,10]). Thus, a correct estimation of oxygen penetration in the material becomes an interesting point to be analyzed.
The simplest model for oxygen penetration [11] is the solution of Fick’s second law in semi-infinite material, which assumes a constant concentration at the surface and a constant diffusion coefficient, as in
where C0 is the initial oxygen concentration in the metal, Cs is the surface concentration, Cx is the concentration at the distance x from the surface, t is time, and D is the diffusion coefficient of oxygen in Ti, as in
where D0 = 2 × 10⁻⁷ s−1 and Q = 169 kJ mol−1 [12]. Figure 3, which also plots the XO variation with the distance from the surface, shows that an increase in microhardness is notable even where the enrichment in oxygen is so low that it is almost unnoticeable.
Figure 4a replots the hardness profile of the sample head that experienced the longest permanence at 650 °C (528 h). The figure also includes the value of the hardness in correspondence with the oxide surface layer, omitted in Figure 3d. The figure shows the existence of four different zones: i. the oxide surface layer (Ia), which cracks even under the HV indenter and, possibly for this reason, exhibits a relatively low HV value; ii. an intermediate zone (Ib) of an almost constant and very high (roughly 700 HV) microhardness—these HV values, in oxygen-rich Ti, are known to correspond to very low ductility [13], hardly capable of tolerating any notable deformation [2]—iii. a zone of decreasing hardness (II); iv: the unaltered core of the sample. For the sake of clarity and simplicity, we will assume in the following paragraphs that zone-Ib corresponds to what is usually called the “α-case” in Ti and Ti alloys. Figure 4b–d shows extensive cracking in the oxide layer, which is detached from the underlying oxygen-rich zones. Many wide cracks, perpendicular to the loading direction, pass through zones Ia and Ib. Finer cracks also develop in zone Ib, but propagate along directions parallel to the surface. Figure 4d shows the different metallographic contrast after etching between the base metal and the oxygen-rich surface.
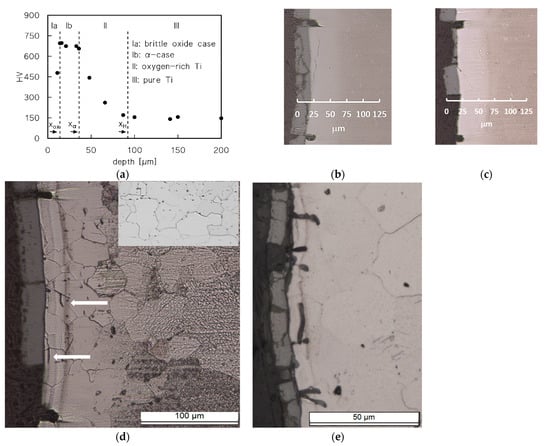
Figure 4.
(a) Microhardness profile on the head of the sample that experienced a prolonged (528 h, VLE10) holding at high temperatures; (b,c) gauge length, cracking of the oxide layer of zone Ib; both large cracks of length ≈ (xox + xα), perpendicular to the surface, and longitudinal fine cracks that propagate under the oxide layer, can be easily observed. The oxide layer is heavily cracked and, in many locations, detached from the underlying oxygen-rich zone; (d) gauge length and microstructure after etching, with vertical fissures occasionally appearing in different locations of the oxygen-rich layer, near the surface (white arrows). The insert shows the microstructure of the plate in as-received state [8]; (e) unetched gauge length after creep at 650 °C, CLE13, and an overall exposure duration of 171 h.
The metallographic preparation was enough to introduce a certain level of cold work into the soft-base metal (the dark region), while the oxygen-rich zone (the bright area) remained substantially unaffected. It should be recalled here that both the oxygen-rich layers and the sample interior had an hcp-structure, which was easily distinguishable only because the O-rich part was much harder and did not suffer from significant cold working during metallographic preparation. The grain size of the base metal did not substantially change after this long time of exposure. The situation was similar along the gauge length of the sample tested under 20 Mpa after a 70 h soaking at 650 °C (Figure 4e). Again, the oxide layer was heavily damaged, and cracks propagated for roughly 10 μm in the oxygen-rich zone.
4. Discussion
4.1. Strengthening Role of Oxygen-Rich Layers
The main issue in properly addressing the roles of the different layers is the identification of the strengthening contribution of zones Ia, Ib, and II. The early cracking of non-deformable surface layers during creep straining should significantly reduce their strengthening role. In particular, the oxide layer largely detaches from the substrate during creep (Figure 4), and for this reason, its strengthening contribution can be thought to be negligible. On the other hand, cracking in the scarcely deformable layer, Ib, during early creep deformation, also illustrated in Figure 4b–e, interrupts the local material continuity, undermining its load-bearing capacity [2]. Thus, zone Ib may also provide a negligible contribution to the creep response in correspondence with the minimum creep rate. This analysis is fully consistent with Rosen and Rottem’s findings [3]. These authors removed from few oxidized samples what they identified as the “α-case”, presumably, what corresponded mostly to zone Ib in Figure 4. The identification of the Rosen–Rottem “α-case” with zone Ib is justifiable, since they were fully aware that microhardness descended toward the original value of the unoxidized Ti-6Al-4V (zone-II in Figure 4a) beyond the depth of their “α-case”. Its removal from the exposed specimen did not significantly change the minimum creep rate, since remained roughly 1/3 of that measured in the absence of oxidation, as in samples that maintained their α-case. This fact proved that the real strengthening effect was played by the oxygen-rich zones below the α-case.
Vaché and Monceau [11] proposed a model equation for the decrease in hardness with distance from the surface of oxidized material in the form
where HV0 is the hardness of the metal with the initial oxygen concentration, HVmax is the maximum hardness, and HVx is the hardness at the distance x from the point where HVmax is measured, usually the surface. Equation (4) implies the same parabolic relationship between microhardness and oxygen concentration obtained in [7], so that a constant HV corresponds to a constant oxygen content. On the other hand, based on the above reasoning, both the oxide layer/zone Ia (thickness xox) and the “α-case”/zone Ib (thickness xα) do not significantly contribute to creep strengthening. Rather, Equation (4) could be tentatively used to quantify the hardness variation with depth in zone II, under the layers of depth (xox + xα). Figure 5 plots the variation in hardness and depth according to Equation (4), with HVmax = 700 HV and HV0 = 150 HV. The correlation between the curves and the experimental profiles is reasonably good, so Equation (4) can be used to estimate the depth of the hardened, oxygen-rich zone II, which causes a significant reduction in the creep rate. The limit for this layer was here tentatively quantified as the x value corresponding to XHV = 0.01.
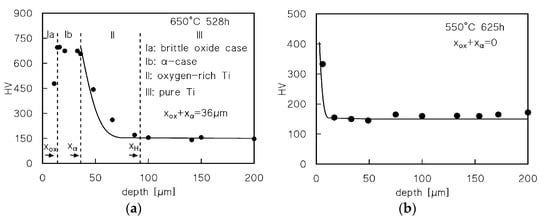
Figure 5.
(a,b) Hardness variation with depth for representative samples; HVmax = 700 HV; HV0 = 150 HV.
4.2. Constitutive Equation for CP-Ti (No or Minor Effects of Oxidation)
A very good description of the creep response of a dataset of pure Ti samples [14] was recently provided by an equation whose derivation was illustrated in detail in [15,16]. This equation assumes the form
where D0L = 1 × 10⁻⁸ m2s−1 and QL = 193 kJ mol−1 describe the self-diffusion mechanism in low-purity Ti through Equation (3) [17], G is the shear modulus, b is the length of the Burgers vector (2.95 × 10⁻¹⁰ m), T is the absolute temperature, k is the Boltzmann constant, R is the gas constant, and A = 40 [15]. The Rmax parameter was tentatively obtained as follows [15]:
where GRT and GT were the shear moduli at room temperature and at testing T, respectively. Figure 6 plots the minimum creep rate vs. stress curves calculated using Equation (5) with A = 40 and Rmax from Equation (6), compared with the data from [14] and the results of the present study from CLEs of short durations, where oxygen can be reasonably assumed to have minor effects. In the case of the samples tested in [14], the effects of oxygen diffusion could be, in the first instance, neglected due to the substantially larger size of the samples (5 mm in diameter; this point will be further discussed in the following). The figure demonstrates that the constitutive equation, in this form, strongly underestimated the creep rate in the high stress regime. Reconsidering the quantification of the Rmax term is, thus, needed. A much better description was, indeed, obtained with
where UTST is the tensile strength at testing temperature and A = 50. This simple modification led to a much better description of the creep response of CP-2 Ti in the intermediate and high strain rate regimes (solid lines in Figure 5).
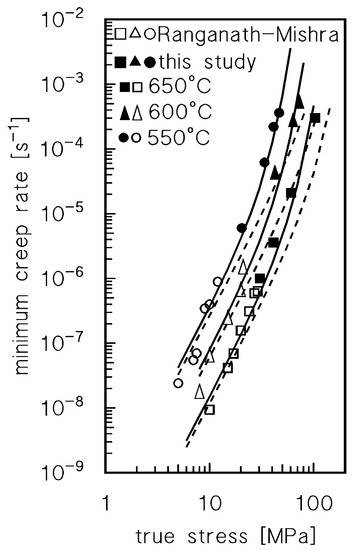
Figure 6.
Experimental data for pure Ti from [14] (round samples 5 mm in diameter) and from present study (CLE, very short test duration), and calculated curves from Equation (6); broken lines: A = 40, Rmax from Equation (6), with UTS = 500 MPa; solid lines: A = 50, Rmax from Equation (7), with UTST = 105, 75, and 55 MPa at 550, 600, and 650 °C, respectively (obtained from data for annealed CP-2 Ti in [18]).
The next step was the study of the effects of oxidation on the value of the minimum creep rate for the longer test duration.
4.3. Quantification of the Effect of Oxidation on Creep Response
The evidence for marked differences in the creep rates of CLEs and VLEs, provided in the previous section, demonstrates that oxygen diffusion results in an increase in microhardness and a reduction in creep rate under a given stress. Pure Ti, in proximity to the surface, is significantly enriched with oxygen as the time of exposure increases. Thus, a “hard zone” (II in Figure 4), not homogeneous in composition, encloses a core of pure Ti. It is obvious that such a complex material can be hardly modeled unless a strong simplification of its structure is applied. In the present study, the real material has been very simply modeled, as presented in Figure 7. Following this approach, and based on the well-known composite material model (CMM), the soft core of the sample (unmodified pure Ti) was surrounded by a hard layer of oxygen-rich titanium of homogeneous composition and properties. The latter assumption is, thus, the major departure from the real situation, since in the crept samples, the oxygen content progressively reduced as the distance from the surface increased.
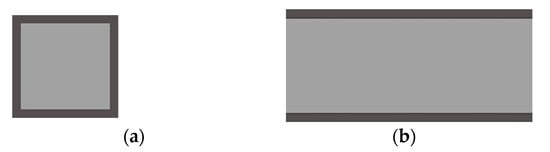
Figure 7.
Composite material model (CMM) of the oxidized creep sample. A soft interior zone (pure Ti, light grey) is surrounded by an external hard zone (oxygen-rich Ti, dark grey) of depth xH. (a) section, side 3 mm; (b) gauge length (tensile axis is horizontal). For the sake of simplicity, the hard zone is homogeneous in oxygen content and properties, an obvious deviation from the real case.
The depth of the hard zone II, xH, can be approximatively estimated by Equation (4) in correspondence with the minimum creep rate. The volume fraction of the hard zone, the surface layer rich in oxygen, can be thus expressed as
where l is the length of side of the sample cross-section, here taken as 3 mm, thus neglecting the effect of elongation, and fS is the volume fraction of the unmodified Ti soft zone.
In the CMM of Figure 7, both the hard and soft zones deform in parallel with the same creep rate under different local stresses (σH and σS, respectively). As a result, load is transferred from the soft (sample interior) to the hard (zone II) portions of the sample, giving,
Zones Ia and Ib do not contribute to load transfer since detachment and cracks interrupt their continuity. To make proper use of Equation (9), a constitutive equation correlating stress, temperature, and strain rate for the hard zone II should be available. This is a major—and practically unsolvable—problem, due to the complete lack of information about the creep response of O-rich titanium. Nevertheless, one can reasonably assume that the model material for the hard zone creeps according to the classical phenomenological equation,
where AH and n, in this simplified approach, are constant, and QH is the apparent activation energy. For the sake of simplicity, it will be supposed here that QH is also stress and temperature independent. In the case of the VLE at 650 °C, the three data points correspond to times of exposure of 400, 513, and 530 h, while for the VLE at 550 °C, the two values of the minimum creep rate were obtained after 618 and 625 h. Equation (4) was then used to estimate xH for XHV = 0.01 after 450 h at 650 °C and 620 h at 550 °C, which provided fH and fS. For a given strain rate, σS is obtained directly from Equations (5) and (7). The model parameters AH, n, and QH were thus tentatively estimated using a fitting procedure of the VLE data at 650 °C and 550 °C.
A good fit of the VLE data at 650 and 550 °C was obtained by taking n = 10, AH = 1 × 10⁸ s−1 Mpa−10, and QH = 620 kJ mol−1. Once the parameters in Equation (10) were estimated, the CMM could be easily used to obtain the model curves at 550, 600, and 650 °C for different exposure durations. Figure 8 plots a direct comparison between the experimental data and model curves. The curves for exposures shorter than 5 h were calculated by assuming that the hard oxygen-rich layer (zone II) was too thin to produce any significant effects. In general terms, the accuracy of the model is more than acceptable.
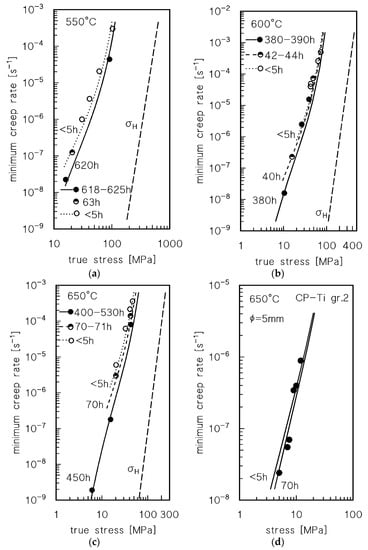
Figure 8.
Comparison between model curves and experimental data (a–c, 3 mm × 3 mm sample; d, round sample 5mm in diameter): (a) 650 °C, model curves calculated for exposure durations of 0, 63, and 620 h; (b) 600 °C, model curves calculated for exposure durations of 0, 40, and 380 h; (c) 650 °C model curves calculated for exposure durations of 0, 70, and 450 h; (d) 650 °C, data from [14], model curves calculated for exposure durations of 0 and 70 h for a sample 5 mm in diameter (Φ). In a-c, the calculated value of the stress acting at a given strain rate in the hard zone (layer II) is also reported.
Figure 8d reports the experimental data from [14]. The authors did not specify if a protective atmosphere was used, which leads one to suppose that testing was performed in air. Unfortunately, no information on the time of exposure in correspondence with the minimum creep rate can be deduced from the source, since the creep curves reported in [14], one CLE (interrupted after 50 h, estimated strain rate = 5 × 10⁻⁸ s−1), and one VLE (load change after 70 h, estimated strain rate = 2 × 10⁻⁸ s−1), indeed applied to a composite. Nevertheless, one can reasonably assume that a similar testing scheme was followed when they investigated unreinforced Ti; that is, for minimum creep rates in the range from 2 × 10⁻⁸ to 5 × 10⁻⁸ s−1, the time corresponding should range between 50 and 100 h. If a 70 h time of exposure is used to estimate xH and the relevant fH volume fraction in a sample 5 mm in diameter, as used in [14], the model curve reported in Figure 8d is obtained. The description of the low-stress experimental data is indeed quite accurate.
4.4. Critical Assessment of the Model
The CMM in the form presented here was based on a highly simplified picture of the real situation, and, for this reason, it did not have the ambition to provide a physical-based description of creep in oxygen-rich Ti (a task otherwise impossible to fulfill due to the already mentioned lack of experimental data). Thus, another obvious question can be raised: is the quantification of the creep strength of the hard zone, shown in Figure 8, reasonable?
To answer this question, we must firstly address the problem of possible strengthening mechanisms operating in oxygen-rich zones. Even a relatively moderate content of oxygen (0.8%) increases the UTS of pure Ti well above 1000 MPa with a hardness just below 400 HV [13,19,20]. According to Figure 3, Figure 4 and Figure 5, most of the oxygen-rich zone II exhibits experimental microhardness values in a range between 200 and 600 HV (Figure 4a, the average of the four microhardness measurements in zone II gives 385 HV, which, as mentioned above, corresponds to a UTS close to 1000 Mpa in a Ti-O alloy). For reference purposes, Ti-6Al-4V alloys [15,16] also usually exhibit a UTS close to 1000 Mpa. This fact implies that oxygen-rich, pure Ti is assimilable, in terms of tensile properties, to more complex industrial alloys. The source of this remarkable strength is usually attributed to solid solution hardening [20]; namely, it may depend on a strong interaction between screw dislocation cores and oxygen atoms. In addition, a recent study provided evidence that even small additions of oxygen (>0.15%) cause the formation of ordered precipitates with a Ti6O-type structure in CP-Ti, grade 2 [21]. Thus, the oxygen-rich layer is indeed a very complex material, where solid solution hardening and possibly a particle–dislocation interaction play a significant role in enhancing strength at room and high temperatures. In the present study, the complex, oxygen-rich zone II was “replaced” by a model material with a homogeneous O content, well above 0.15%, and with different xH thicknesses. Due to the high oxygen content, a solid solution should have surely been operative there. If the ordered precipitates also play any hardening role, which would be realistic, the use of the phenomenological Equation (10) for the model material should indeed result in high values of the apparent stress exponent and activation energy (n and QH) [16], exactly as those tentatively estimated here.
Let one suppose that the creep properties of the oxygen-rich layers in Ti-6Al-4V are reasonably close to those calculated here for pure Ti. Rosen and Rottem investigated the effects of a 3 h pre-oxidation in air at 900 °C on the creep response of the Ti-6Al-4V at 400 °C [3]. Pre-oxidation produced an “α-case” ≈140 μm thick. The samples were tested using VLEs, but creep deformation did not exceed a total strain of 1%, which suggests an overestimation of the minimum creep rate under the lowest stresses—see, for example, the shape of the strain rate vs. that of the strain curves in [15,16]. The Rosen and Rottem creep data for the alloy annealed at 900 °C in a vacuum were thus compared with those published by Whittaker et al. [22], Figure 9a. The figure also plots the model curve for Ti-6Al-4V, calculated, as above, using Equation (5), with the same values for the various parameters used in [16] (D0L = 1.4 × 10⁻³ m2s−1, QL = 303 kJ mol−1 [18], Rmax ≈ 1150 Mpa) and A = 50. The model curve clearly does not consider the effects of oxygen. The figure shows that the agreement between the model curve and the data from [22] is more than tolerable. In addition, it confirms that the values of the low-stress minimum creep rate calculated by Rosen and Rottem using VLEs should be treated cautiously, although they still represent an invaluable source of information on relative differences in the behavior of alloy in oxidized and non-oxidized states (Figure 9b). The minimum creep rate values for exposed material are significantly lower than those for the material annealed in vacuum.
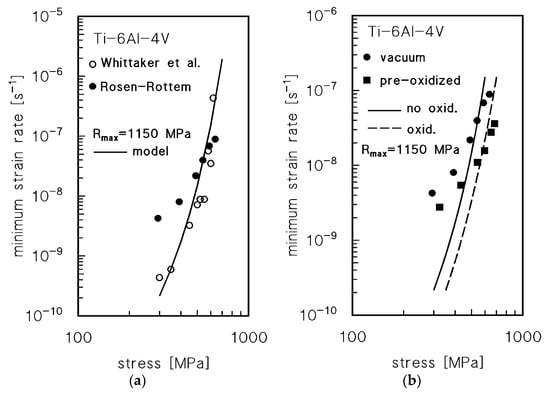
Figure 9.
(a) Minimum creep rate 400 °C for the Ti-6Al-4V alloy annealed at 900 °C for 3 h in vacuum [3] and for a similar alloy with bimodal α + β microstructure [22]. The model curve (no effects of oxygen) was calculated using Equation (5) with D0L = 1.4 × 10⁻³ m2s−1, QL = 303 kJ mol−1 [17], Rmax ≈ 700 MPa and A = 50. (b) Rosen and Rottem data [3] from VLE at 400 °C for the Ti-6Al-4V annealed at 900 °C for 3h in a vacuum or in air. The curves represent the behavior of non-oxidized and oxidized alloys (see text for details).
Now, let us assume, as suggested in the previous section and following Rosen and Rottem’s reasoning, that the α-case (i.e., the more superficial O-rich layer, Ib) does not significantly affect the minimum creep rate values of exposed alloy, in our view because, as the strain accumulates, cracks develop in this zone. No information was provided on the oxide scale, so it will be neglected here. The cracks do not usually penetrate beyond the α-case in creep tests of a relatively short duration [23]. This thick layer could even be, thus, removed, without significantly influencing the creep response. The thickness of the oxygen-rich zone II after 3 h at 900 °C, given by Equation (4) for XH = 0.01, is xH = 44 μm. The CMM (Equations (8)–(10)) provided the broken curve in Figure 9b for the exposed material, to be compared with the model curve for the alloy annealed in vacuum (same curve in Figure 9a).
Further oxidation at the testing temperature of 400 °C could be reasonably neglected. If one considers the predictable overestimation of creep rates under lower stresses in [3], the agreement between model curves and experiments is notably accurate. We have, thus, a direct confirmation of the adequacy of this simplified approach in estimating the effects of oxidation on Ti alloys.
5. Conclusions
The creep response in the air of CP-2 titanium was investigated at temperatures of 550, 600, and 650 °C. Experimental data demonstrated that high-temperature exposure resulted in a marked decrease in the creep rate, suggesting a hardening role of the oxygen-rich layer formed during tests. The growth of the hard superficial layer was, thus, modeled as a function of temperature and time of exposure. The creep sample was modeled as a composite formed by an inner soft core (pure titanium) and a hard outer zone rich in oxygen and homogeneous in composition and properties. A fitting of two-variable load experiments at 550 and 650 °C was used to quantify the creep response of the hard-zone. The resulting composite model, although based on an overly simplified description of the real structure, was able to provide an excellent description of the material response in all the investigated ranges of temperatures and test durations. The model also provides a quite reliable description of the creep response of more complex Ti alloys, such as Ti-6Al-4V.
Author Contributions
Conceptualization, M.R. and S.S.; methodology, S.S.; validation, M.R. and S.S.; formal analysis, M.R., A.S. and S.S.; investigation, M.R., A.S. and S.S.; resources, M.R.; data curation, S.S.; writing—original draft preparation, S.S.; writing—review and editing, M.R. and S.S.; visualization, M.R. and S.S.; supervision, S.S.; project administration, M.R.; funding acquisition, M.R. All authors have read and agreed to the published version of the manuscript.
Funding
This research project is partially funded by Braude College, Karmiel, Israel.
Data Availability Statement
The data presented in this study are available on request from the corresponding author.
Acknowledgments
The assistance of N. Navot with welding the material is highly appreciated.
Conflicts of Interest
The authors declare no conflict of interest.
References
- Aniołek, K. The influence of thermal oxidation parameters on the growth of oxide layers on titanium. Vacuum 2017, 144, 94–100. [Google Scholar] [CrossRef]
- Chan, K.S.; Koike, M.; Johnson, B.W.; Okabe, T. Modeling of Alpha-Case Formation and Its Effects on the Mechanical Properties of Titanium Alloy Casting. Metall. Mater. Trans. 2008, 39A, 171–180. [Google Scholar] [CrossRef]
- Rosen, A.; Rottem, A. The Effect of High Temperature Exposure on the Creep Resistance of Ti-6AI-4V Alloy. Mater. Sci. Eng. 1976, 22, 23–29. [Google Scholar] [CrossRef]
- Poquillon, D.; Parrens, C.; Pugliara, A.; Perrais, M.; Malard, B. Oxidation of Ti–6Al–4V alloy between 450 and 600 °C. Evolution of microstructure and mechanical properties. MATEC Web Conf. 2020, 321, 06009. [Google Scholar] [CrossRef]
- Reis, D.A.P.; Piorino, F.; Barboza, M.J.R.; Nono, M.C.A.; Silva, C.R.M. Influence of the oxidation in creep of Ti-6Al-4V alloy. Acta Microsc. 2003, 12, 219–220. [Google Scholar]
- Magazzeni, C.M.; Gardner, H.M.; Howe, I.; Gopon, P.; Waite, J.C.; Rugg, D.; Armstrong, D.E.J.; Wilkinson, A.J. Nanoindentation in multi-modal map combinations: A correlative approach to local mechanical property assessment. J. Mater. Res. 2021, 36, 2235–2250. [Google Scholar] [CrossRef]
- Zheng Chen, G.; Fray, D.J.; Farthing, T.W. Cathodic Deoxygenation of the Alpha Case on Titanium and Alloys in Molten Calcium Chloride. Metall. Mater. Trans. 2001, 32B, 1041–1052. [Google Scholar] [CrossRef]
- Regev, M.; Almoznino, B.; Spigarelli, S. A Study of the Metallurgical and Mechanical Properties of Friction-Stir-Welded Pure Titanium. Metals 2023, 13, 524. [Google Scholar] [CrossRef]
- Kalienko, M.; Volkov, A.; Leder, M.; Zhelnina, A. Study of oxygen content in titanium alloys after exposure at elevated temperature. MATEC Web Conf. 2020, 321, 11068. [Google Scholar] [CrossRef]
- Gardner, H.M.; Gopon, P.; Magazzeni, C.M.; Radecka, A.; Fox, K.; Rugg, D.; Wade, J.; Armstrong, D.E.J.; Moody, M.P.; Bagot, P.A.J. Quantifying the effect of oxygen on micro-mechanical properties of a near-alpha titanium alloy. J. Mater. Res. 2021, 36, 2529–2544. [Google Scholar] [CrossRef]
- Vaché, N.; Monceau, D. Oxygen Diffusion Modeling in Titanium Alloys: New Elements on the Analysis of Microhardness Profiles. Oxid. Met. 2020, 93, 215–227. [Google Scholar] [CrossRef]
- Bregolin, F.L.; Behar, M.; Dyment, F. Diffusion study of 18O implanted into α-Ti using the nuclear resonance technique. Appl. Phys. 2007, A 86, 481–484. [Google Scholar] [CrossRef]
- Bieler, T.R.; Trevino, R.M.; Zeng, L. Alloys: Titanium, Encyclopedia of Condensed Matter Physics. In Encyclopedia of Condensed Matter Physics; Elsevier: Amsterdam, The Netherlands, 2005; pp. 65–76. [Google Scholar] [CrossRef]
- Ranganath, S.; Mishra, R.S. Steady state creep behaviour of particulate-reinforced titanium matrix composites. Acta Mater. 1996, 44, 927–935. [Google Scholar] [CrossRef]
- Spigarelli, S.; Paoletti, C.; Cabibbo, M.; Cerri, E.; Santecchia, E. On the creep performance of the Ti-6Al-4V alloy processed by additive manufacturing. Addit. Manuf. 2022, 49, 102520. [Google Scholar] [CrossRef]
- Spigarelli, S.; Paoletti, C.; Cerri, E.; Santecchia, C.M. Creep response of Ti–6Al–4V alloy produced by additive manufacturing: Effect of annealing at 1050 °C. Mater. Sci. Eng. 2022, A860, 144278. [Google Scholar] [CrossRef]
- Perez, R.A.; Nakajima, H.; Dyment, F. Diffusion in α-Ti and Zr. Mater. Trans. 2003, 44, 2–13. [Google Scholar] [CrossRef]
- Shahmir, H.; Pereira, P.H.R.; Huang, Y.; Langdon, T.G. Mechanical properties and microstructural evolution of nanocrystalline titanium at elevated temperatures. Mater. Sci. Eng. 2016, A669, 358–366. [Google Scholar] [CrossRef]
- Luo, S.D.; Song, T.; Lu, S.L.; Liu, B.; Tian, J.; Qian, M. High oxygen-content titanium and titanium alloys made from powder. J. All. Comp. 2020, 836, 155526. [Google Scholar] [CrossRef]
- Yu, Q.; Qi, L.; Tsuru, T.; Traylor, R.; Rugg, D.; Mo Rris, J.W.J.; Asta, M.; Chrzan, D.C.; Minor, A.M. Origin of dramatic oxygen solute strengthening effect in titanium. Science 2016, 347, 635–639. [Google Scholar] [CrossRef]
- Poulain, R.; Delannoy, S.; Guillot, I.; Amann, F.; Guillou, R.; Lartigue-Korinek, S.; Thiaudière, D.; Béchade, J.-L.; Clouet, E.; Prima, F. First experimental evidence of oxygen ordering in dilute titanium–oxygen alloys. Mater. Res. Lett. 2022, 10, 481–487. [Google Scholar] [CrossRef]
- Whittaker, M.T.; Harrison, W.J.; Lancaster, R.J.; Williams, S. An analysis of modern creep lifing methodologies in the titanium alloy Ti6-4. Mater. Sci. Eng. 2013, A577, 114–119. [Google Scholar] [CrossRef]
- Evans, R.W.; Hull, R.J.; Wilshire, B. The effects of alpha-case formation on the creep fracture propertied of the high-temperature titanium alloy IMI834. J. Mater. Proc. Technol. 1996, 56, 492–501. [Google Scholar] [CrossRef]


Disclaimer/Publisher’s Note: The statements, opinions and data contained in all publications are solely those of the individual author(s) and contributor(s) and not of MDPI and/or the editor(s). MDPI and/or the editor(s) disclaim responsibility for any injury to people or property resulting from any ideas, methods, instructions or products referred to in the content. |
© 2023 by the authors. Licensee MDPI, Basel, Switzerland. This article is an open access article distributed under the terms and conditions of the Creative Commons Attribution (CC BY) license (https://creativecommons.org/licenses/by/4.0/).