Abstract
Due to the large difference in physical and chemical properties between the substrate and the cladding material, the welding of composite materials is much more difficult than that of single materials. In our work, S32304/Q390C composite material was considered as the research object. By adjusting the welding parameters, two kinds of joint geometry were obtained, namely, the transition layer weld lower (joint A) and higher the composite material interface (joint B). We studied the influence of the transition layer weld on the microstructure and properties of welded joints. The microstructure of the transition layer weld, the distribution of elements, the Schmidt factor of the interface between the transition layer and base layer weld, and the tensile strength of the joint were evaluated. The results show that with the increase of welding heat input, the microstructure of the transition layer weld changes from austenite and skeleton ferrite to austenite and lathy ferrite and austenite and acicular ferrite, while ferrite grows towards the weld center, showing a dendritic shape and a local network structure. At the side of the base layer weld of the interface between the transition and the base layer weld, the thickness of the low-carbon-content layer increased from 100 μm to 150 μm. Iron, chromium, and nickel elements on both sides of the interface were diffused, and the thickness of the diffusion layer increased from 3 μm to 10 μm. The tensile strength values of joints A and B were 648 MPa and 668 MPa, respectively, and the Schmidt factor values were 0.446 and 0.454, respectively. Combination with the analysis of the fracture morphology showed that when the transition layer weld was higher than the interface of the composite plate, the joint had better plastic deformation ability and higher tensile strength.
1. Introduction
Duplex stainless steel and low-alloy high-strength steel composite materials have the outstanding advantages of high strength, good corrosion resistance, and low cost and are widely used in industries such as petroleum, chemical, ocean engineering, and other fields [1]. Therefore, this material has become the focus of people’s attention. In recent years, many related studies have been reported. For example, Zhichao Zhu et al. studied the interfacial structure, interfacial oxide characteristics, and shear fracture model of stainless steel composite plates, and found that the carbon element in the base material diffused to the cladding material, the low-carbon-content ferrite zone formed at the base material near the interface, and the carbon-enriched austenite zone formed in the cladding material, while the interfacial oxides were concentrated in the carbon-enriched austenite zone and the interface bond shear strength of the composite plate increased [2,3,4,5,6]. Chao Yu et al. found that the pure iron intermediate layer can effectively prevent the diffusion of carbon from carbon steel to stainless steel, prevent the formation of carbon-chromium compounds, and improve the mechanical properties of the composite plate [7,8]. Tao Yu et al. studied the microstructure and properties of 304 stainless steel and medium carbon steel composite plates prepared by an argon hot rolling process, and found that chromium-rich M23Cr carbide was precipitated from the stainless steel side, and the low-carbon-content zone appeared on the side of the medium carbon steel [9]. Cuixin Chen et al. studied the interfacial shear strength of stainless steel composite plates and found that different fracture characteristics were related to sufficient carbon diffusion and interface toughening at high rolling temperatures [10]. Visible, in the process of preparation of metal composite materials at the interface between the base material and cladding material, element diffusion and harmful phase formation occur readily, which change the properties of the composite materials [11,12,13].
Similarly, after welding, the carbon of the base layer weld diffuses into the cladding layer weld, and the strength decreases. The chromium and nickel elements of the cladding layer weld are diffused to the base layer weld, and the corrosion resistance decreases. The research results of Kai Kang et al. also showed that the more uniform the microstructure of the stainless steel composite material weld and the higher the chromium content, the better was the corrosion resistance [14,15,16,17]. Chang’an Li et al. who used carbon steel filler metal and stainless steel filler metal to weld the base layer weld of stainless steel composite plate, found that a martensite phase formed in the first layer of the carbon steel filling weld, and a local hardening zone formed [18]. Wenchun Jiang et al. found that the diffusion layer containing martensite formed at the base layer weld area near the interface, because of the diffusion of C, Cr, Ni, and Fe [19,20]. Ning-Nian Gou et al. studied the butt welded joint of 2205/X65 composite plate, and found that the microstructure, tensile strength, hardness, and impact properties of the welded joint showed obvious inhomogeneity in the direction of thickness [21]. In summary, due to the different compositions of the base layer weld and the cladding layer weld, in the welding process, element diffusion and brittle phase formation [22,23,24] are easy to occur in the interface of the base layer and the cladding layer weld, which has a great influence on weld performance. In addition, welding residual stress is also the main cause of welding joint failure [25,26,27]. To improve the quality of welded joints of composite materials and better meet the requirements of use, a transition layer weld is usually added between the base layer weld and the cladding layer weld [28]. Nevertheless, the morphology of the transition layer weld affects the microstructure and properties of the welded joint—the microstructure distribution, composition distribution of the weld, and the formation of interfacial low-carbon-content, carbon-enriched layer, and brittle phase are all related to the weld morphology of the transition layer—and then affects the performance of the welded joint. During the welding process of the transition layer weld, there is a metallurgical reaction between the transition layer weld, the base layer weld and the cladding layer weld. At the same time, the interface of the composite material also melts to a certain extent, and the welding seam of the transition layer undergoes a metallurgical reaction to form intermetallic compounds, which have substantial brittleness and directly affect the performance of the welded joint. When the weld seam of the transition layer is higher than the composite interface, the mixing between the substrate materials and the cladding materials and between the base layer weld and the cladding layer weld is reduced, reducing the possibility of the formation of intermetallic compounds, thereby improving the performance of the welded joint. However, only limited studies have focused on the effect of weld morphology of the transition layer of stainless steel/low alloy high strength steel composite on the microstructure and properties of welded joints. Plasma arc welding, submerged arc welding, and gas tungsten arc welding have the advantages of low production cost, high welding efficiency, stable weld quality, and good applicability [29,30]. At present, they are the main welding methods of stainless steel and low alloy high strength steel composite materials in industry.
In our work, S32304/Q390C composite material was considered as the research object, plasma arc welding, submerged arc welding, and gas tungsten arc welding were used for welding; the first welding base layer was initially welded, followed by the transition layer weld, and finally the cladding layer weld. By adjusting the welding parameters, two kinds of joint geometry were obtained, namely, the transition layer weld lower (joint A) and higher the composite material interface (joint B). After welding, the element distribution and Schmidt factor of the weld interface between the transition layer and base layer were analyzed, and the tensile strength of the join was tested. The microstructure of the transition layer weld, the interface between the transition layer and base layer weld, and the interface between the transition layer and cladding layer weld were observed. The experimental results provide a theoretical basis for the formulation of welding technology for this kind of composite material.
2. Experimental
2.1. Sample Preparation
S32304/Q390C composite material was used as the base metal, the cladding material was S32304 duplex stainless steel with a thickness of 2 mm, and the base material was Q390C low-alloy high-strength steel with a thickness of 16 mm. The base metals were machined to dimensions of 300 mm × 150 mm × 18 mm. A Y groove was prepared with an angle of 75° and a blunt edge of 5 mm. Welding wires, including H08MnA, ER309MoL, and ER2209 with diameters of 3.2, 1.2, and 1.2 mm were used, and the flux was SJ101. The chemical compositions of the S32304 steel, Q390C steel, and welding wire are shown in Table 1. The welding method and welding sequence are as follows: the blunt edge was first welded by plasma arc self-fusion welding to form a double-side forming the weld. Then, Q390C steel was filled with submerged arc welding. Finally, gas tungsten arc welding was used to weld the transition layer weld and cladding layer weld, as shown in Figure 1. The welding process was a single-pass multi-layer welding. The specimens were subjected to mechanical and chemical cleaning before welding. In order to prevent oxidation of the weld zone, the fusion zones, and the heat affected zone during welding, argon gas was used as a protective gas on the front and back of the specimen. In order to prevent hydrogen embrittlement in the welding joint, pure argon was used in the welding process for plasma arc self-fusion welding and gas tungsten arc welding. The welding gas was argon with purity of no less than 99.99%, the flow rate of ionic gas was 5 L/min, the flow rate of gas tungsten arc welding gas was 15 L/min, and the flow rate of the shielding gas was 20 L/min. The optimized process parameters were used in the welding process, as shown in Table 2.

Table 1.
Chemical compositions of base metals and filler metals (wt.%).
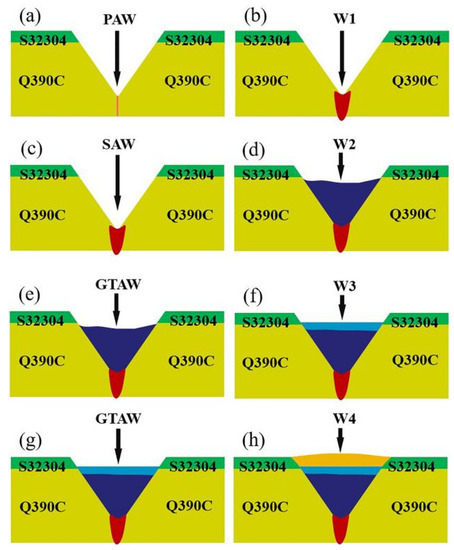
Figure 1.
Schematic drawing for the welding process: (a) plasma-arc weld; (b) W1 weld; (c) submerged-arc weld; (d) W2 weld; (e,g) induction gas tungsten arc welding; (f) W3 weld; (h) W4 weld.
Table 2.
Welding process parameters.
2.2. Characterization Methods
After welding, the sample for observing the microstructure was prepared, and the preparation process involved cutting, grinding, polishing, and etching. Aqua regia was used as the etching solution. A VHX-2000 digital microscope (KEYENCE China, Shanghai China) was used to observe the micromorphology of the etched sample; the observed area included the interface between the base layer weld and the transition layer weld (W2 and W3), the transition layer weld, the interface between the transition layer weld and the cladding layer weld (W3 and W4). The distribution of elements at the interface of welds W2 and W3 was measured using an energy dispersion spectrometer. The transverse tensile properties of welded joints were tested using a universal testing machine. The location and size of the tensile sample met the requirements of GB/T 228-2002 [31]. The details are shown in Figure 2. A universal testing machine was used as the tensile test equipment. The tensile speed was 20 mm/min. The fracture morphology of the tensile specimen was observed under an S-4800 scanning electron microscope (Hitachi, Tokyo, Japan). Electron backscattering diffraction (EBSD) was used to measure the Schmidt factor of the weld interface between the transition layer and the base layer. After grinding, the EBSD samples were first mechanically polished, then etched by an ion etching instrument (Leica RES101, Wetzlar, Germany), and finally tested by an OXFORD EBSD detector produced by NordlysNano (Oxford Instruments, Abingdon, UK), scanning step size 0.5 micron.
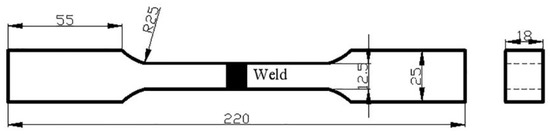
Figure 2.
Geometrical dimension drawing of tensile specimen (units: mm).
3. Results
3.1. Macroscopic and Microscopic Microstructure Characterization
After welding, two kinds of joint geometry were obtained, namely, the transition layer weld lower (joint A) and higher the composite material interface (joint B). Figure 3 shows the cross-sectional micrograph of the weld joints, both welds show a good fusion of base metal, while pores, cracks, slag inclusion, or other macroscopic defects were not observed.
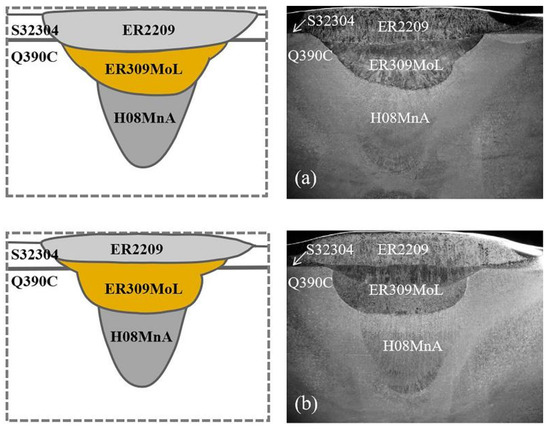
Figure 3.
The optical image of cross-section of joint: (a) Joint A and (b) Joint B.
The microstructures at different positions in the thickness direction of the two joints were observed, the microstructure analysis position of joint A is shown in Figure 4a. Position A is the composite material interface (Figure 4b), and four different zones can be observed. Zone I is the microstructure of the cladding material, consisting of austenite and ferrite, while the austenite is distributed on the ferrite matrix, the distribution is zonal along the rolling direction, and the ratio of the two phases is close to 1:1. Zone II is the microstructure of the interface between the base material and the cladding material; according to the research results of Zhu Zhichao et al. [32], the interfacial zone is composed of interfacial oxide and carbon-enriched layer. Zone III is the microstructure of the base material side of the composite material interface; due to the diffusion of carbon atoms, a low-carbon-content layer is formed, the thickness of the low-carbon-content layer is about 100~120 μm, and the microstructure is coarse ferrite. Zone IV is the microstructure of base material, consisting of pearlite and ferrite. Position B is the interface between weld W2 and W3 (Figure 4c); diffusion of carbon occurred, a low-carbon-content layer formed at the side of the base layer weld, and the thickness of the low-carbon-content layer was approximately 100 μm, while the microstructure changes from pearlite and ferrite to coarse ferrite because of carbon reduction. At the side of the transition layer weld, a carbon-enriched layer was generated. Considering that the diffusion rate of carbon in austenite is less than that in ferrite, the carbon-enriched layer is not apparent. According to the research results of Wang Shaogang [33,34,35,36] et al., carbon diffuses into the transition layer weld and accumulates mainly at the grain boundary, and harmful phases readily form. Position C is the first transition layer weld (Figure 4d), and position E is the second transition layer weld (Figure 4f); the microstructures are austenite and skeletal ferrite. Position D is the interface between weld W3 and W4 (Figure 4e).
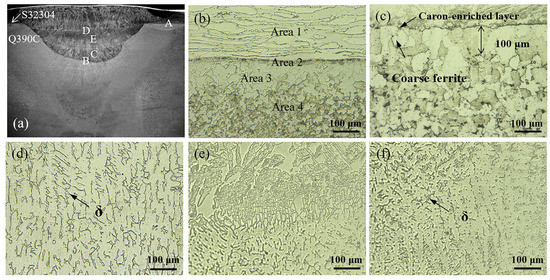
Figure 4.
The microstructure of joint A: (a) the microstructure analysis position of joint A; (b) high-resolution image of position A in (a); (c) high-resolution image of position B in (a); (d) high-resolution image of position C in (a); (e) high-resolution image of position D in (a); (f) high-resolution image of position E in (a).
The microstructure analysis position of joint B is shown in Figure 5a. In addition to the composite material interface, the microstructure analysis position is consistent with that of joint A. Position B is the interface between weld W2 and W3 (Figure 5b), a low-carbon-content layer formed at the side of the base layer weld, while the thickness of the low-carbon-content layer was approximately 150 μm; compared with the corresponding position of joint A, the thickness of the low-carbon-content layer increased by 50 μm. Position C is the first transition layer weld (Figure 5c), and the microstructure is austenite and lathy ferrite; compared with the microstructure of the weld at the corresponding position of joint A (Figure 4c), the skeleton ferrite is transformed into lathy ferrite. According to the research results of Wang Yating et al. [37], the ideal microstructure of an austenitic stainless steel weld is of 5–10% ferritic dendrites distributed on the austenitic matrix, which is conducive to resisting the crack expansion in the weld, while the ferritic dendrites can be used as the second phase to improve the strength of the weld. Position D is the interface between weld W3 and W4 (Figure 5d). Position E is the second transition layer weld (Figure 5e). From Figure 5d,e, the microstructure of the second transition layer of austenite and skeletal ferrite can be seen; compared with the corresponding position of joint A, the skeleton ferrite is transformed into acicular ferrite, and a local network is formed. According to the research results of Li Mingna et al. [38], when the morphology of ferrite is a network structure, if a microcrack occurs, the micro-cracks are distributed along the network dendrites of ferrite. The micro-cracks will then expand rapidly and become the main cracks in the series, eventually leading to weld failure. According to the above microstructure analysis, the weld performance of the transition layer of joint A is better than that of the transition layer of joint B.
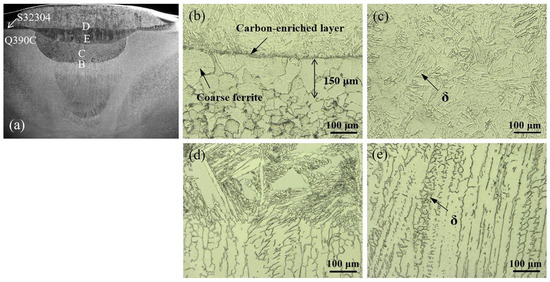
Figure 5.
The microstructure of joint B: (a) the microstructure analysis position of joint B; (b) high-resolution image of position B in (a); (c) high-resolution image of position C in (a); (d) high-resolution image of position D in (a); (e) high-resolution image of position E in (a).
According to the Schaeffler phase component diagram, the microstructure of the transition layer weld is austenite and 10%–20% ferrite, as shown in Figure 6a. The equivalent content of Cr and Ni of the weld W3 (ER309MoL) could be calculated according to the formula. The formulas Creq = Cr + Mo + 1.5 × Si + 0.5 × Nb and Nieq = Ni + 30 × C + 0.5 × Mn are based on the study of Yunfei Meng et al. [37], and the calculated results are 27.49 and 15.85, respectively, while the ratio (θ) of the Creq and Nieq is 1.73. The solidification characteristics of the weld W3 are shown in Figure 6b [39]. When the Creq/Nieq (equivalence ratio) is between 1.5 and 2.0, the solidification mode of the transition layer weld is in FA mode. δ Ferrite is the first precipitated phase, which is transformed into austenite via a peritectic and eutectic reaction. The welding heat input of the transition layer weld of joint A is relatively small, the cooling speed is faster after welding, and the microstructure of the transition layer weld is austenite and skeletal ferrite. The welding heat input of joint B is higher and the cooling rate slower after welding; in the first transition layer weld, the skeleton ferrite is transformed into lathy ferrite and in the second transition layer weld, the skeleton ferrite is transformed into acicular ferrite.
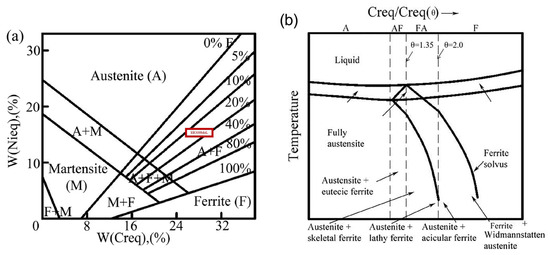
Figure 6.
(a) Schaeffler phase component diagram, (b) solidification characteristics of austenitic stainless steel weld.
3.2. Element Distribution of Interface of Transition Layer and Base Layer Weld
Figure 7 shows the results of the EDS line scanning of the interface of the transition layer weld (W3) and base layer weld (W2). Visible are the contents of Fe, Cr, and Ni distributed in a gradient, indicating that Fe, Cr and Ni have diffused on both sides of the interface. Cr and Ni diffuse from the weld W3 to the weld W2, and Fe diffused from weld W2 to the weld W3. Joint A and B form diffusion layers with a thicknesses of 3 μm and 10 μm, respectively. The carbon content is not obvious, possibly because the X-ray energy dispersive spectrometer (EDS) is not sensitive to lighter elements.
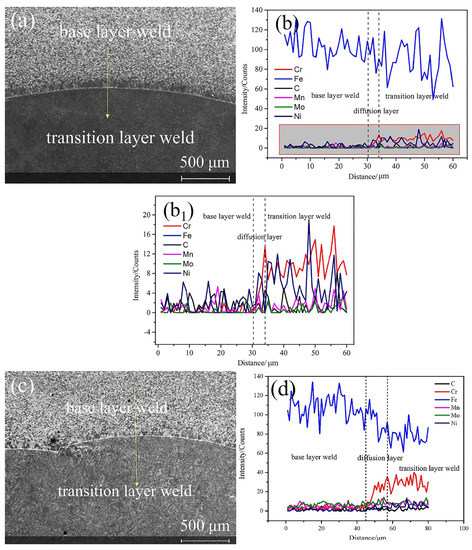
Figure 7.
The position of EDS line scanning of the interface of transition layer and base layer weld: (a) Joint A; (c) Joint B; the results of EDS line scanning of the interface of transition layer and base layer weld: (b) Joint A; (d) Joint B; (b1) a magnification of the lower portion of the graph in scheme (b).
According to Fick’s diffusion law, the diffusion coefficient D and diffusion temperature T have a mathematical relationship, which can be expressed as D = D0exp(−U/RT) [40], where D0 stands for the diffusion constant, and U, R, and T represent the activation energy, gas constant, and temperature, respectively. As the welding heat input increased, the interface temperature increased, the mutual diffusion coefficient of atoms increased, and the interface elements were likely to diffuse. As the temperature increased, the diffusion time increased, the thickness of the diffusion layer increased gradually, and the driving force to form the second phase increased. The high brittleness of the sigma phase results in a decrease in weld performance. Therefore, in order to reduce the driving force to form the sigma phase, and to control the amount of sigma, a lower welding line energy should be used for welding of the transition layer weld.
3.3. Tensile Strength Analysis
Transverse tensile tests were carried out on joints A and B. The stress–strain curve is shown in Figure 8. The tensile strength of joint A is 648 MPa. The tensile strength of joint B is 668 MPa. It can be seen from the figure that the elastic modulus of the tensile test is relatively small and divided into two stages. The reason may be that the base material used in this test is a metal composite material. During the tensile test, the stress is first concentrated at the interface of the composite material, and as the atomic bonding force at the interface is poor, the elastic modulus is small. With the increase of stress, the grains inside the substrate and the cladding material gradually undergo plastic deformation. Due to the different orientations of the grains inside the two materials, the overall elastic modulus of the tensile test is small. To further study the fracture- mode of tensile specimens, we used SEM to observe the fracture morphology of samples, as shown in Figure 9. Figure 9a–c represents the fracture morphology of the base, transition, and cladding layer welds of joint A, respectively. Figure 9d–f illustrates the fracture morphology of the base, transition, and cladding layer weld of joint B. The fracture of the transition layer weld of joint A is a river-shape quasi-cleavage fracture mode, while the fracture mode of the transition layer weld of joint B is a ductile fracture. The cladding layer welds of both joints A and B show a flexible fracture mode with more equiaxed dimples [41], but the size of the dimples in joint B appear to be finer and deeper. The base layer weld of joint A is a ductile–brittle mixed fracture, the base layer weld of joint B shows a ductile fracture, and fractured particles can be observed at the bottom of the dimple. It can be inferred that in the tensile loading process, fracture occurs first in the transition layer weld zone of joint A. With the continuous loading of force, the crack gradually expands to the base layer weld and the cladding layer weld, and finally fracture occurs. However, the fracture morphology of the transition layer weld, base layer weld, and cladding layer weld of joint B, all showed ductile fracture, with the fracture occurring almost simultaneously. EDS surface scanning was performed on the particles at the bottom of the fracture shown in Figure 9d, and the scanning results (Figure 10) showed that the particles consisted of silicon-rich oxides.
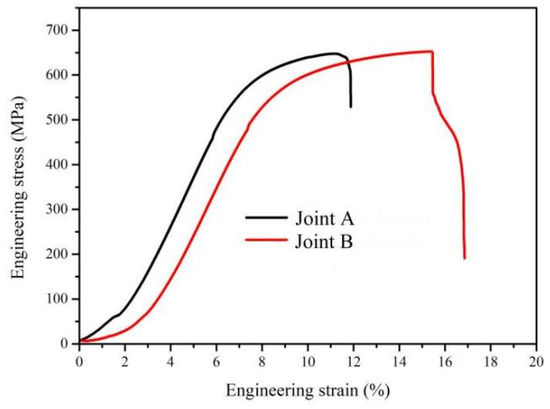
Figure 8.
Engineering stress–strain curves of tensile test of Joint A and Joint B.
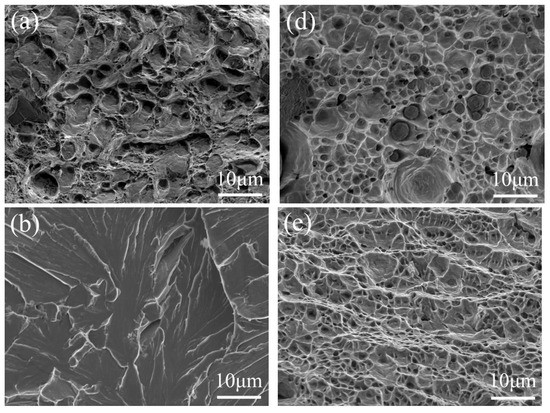
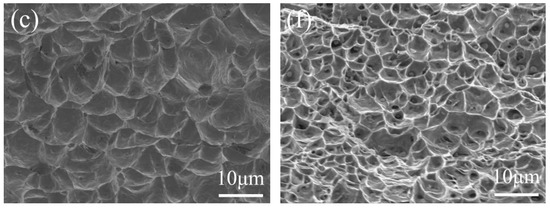
Figure 9.
Fracture morphology of tensile samples: (a) the base layer weld of joint A; (b) the transition layer weld of joint A; (c) the cladding layer weld of joint A; (d) the base layer weld of joint B; (e) the transition layer weld of joint B; (f) the cladding layer weld of joint B.
Figure 10.
EDS surface scanning results of tensile fracture of base layer weld of joint B. (a) High-resolution image of Figure 9a; (b) EDS mapping image of the elements; (c) Zoom in on the green rectangular box shown in (a) (scanning position); (d) Carbon distribution map; (e) Oxygen distribution map; (f) Silicon element distribution map; (g) Iron distribution map; (h) Distribution of carbon, oxygen, silicon and iron.
3.4. Schmidt Factor Analysis of Weld Interface between Transition Layer and Base Layer
The Schmidt factor reflects to some extent the difficulty of plastic deformation of a crystal under an external force. Generally, the grain with large Schmidt factor is of soft orientation, and the corresponding grain is prone to plastic deformation. A small Schmidt factor is called stiff orientation and the corresponding grain is not prone to plastic deformation. Figure 11 shows the distribution diagram of the Schmidt factor at the weld interface between the transition layer and base layer of joint A and joint B. The Schmidt factor value represented by the color red is larger, while the Schmidt factor value represented by yellow and green is smaller. The Schmidt factor of the interface area in Figure 11a,b was counted, and the numerical statistical results of the Schmidt factor of the interface area as shown in Figure 11c,d were obtained. The average Schmidt factor of the grain at the interface of joint A is 0.446, and that of the grain at the interface of joint B is 0.454. It can be seen that joint B has a large Schmidt factor, indicating that the interface of joint B has a good plastic deformation ability.
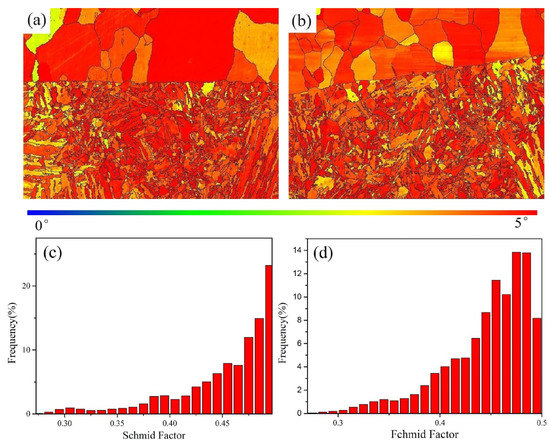
Figure 11.
Schmidt factor distribution in interface area: (a) Joint A; (b) Joint B; Schmidt factor numerical statistics in interface area: (c) Joint A; (d) Joint B.
4. Conclusions
In this investigation, based on the above experimental studies; the following conclusions were obtained:
1. The microstructure of the weld shows that, carbon diffusion occurs at the interface of weld W2 and W3, and a low-carbon-content layer is formed. With the increase of welding line energy of weld W3, the thickness of the low-carbon-content layer increases, and low-carbon-content layers with thicknesses of about 100 μm and 150 μm are formed at the interface of joints A and B, respectively, while the microstructure changes from pearlite and ferrite to coarse ferrite. The microstructure of weld W3 of joint A is austenite and skeletal ferrite. The microstructure of weld W3 of joint B is austenite and lathy ferrite, and austenite and acicular ferrite; part of the ferrite forms a network structure.
2. The EDS result shows that Fe, Cr, and Ni have diffused on both sides of the interface of weld W2 and W3. Joint A and B form diffusion layers with thicknesses of 3 μm and 10 μm, respectively.
The results of the tensile test show that the tensile strength of joint A is 648MPa, and the tensile strength of joint B is 668MPa. Combination with the analysis of fracture morphology shows that when weld W3 is higher than the interface of the composite material, the tensile strength of the joint is higher.
3. The EBSD result shows that, at the interface of weld W2 and W3, the Schmidt factors of joints A and B are 0.446 and 0.454, respectively. The plastic deformation ability of joint B is slightly stronger.
4. According to the above experimental results, to obtain an excellent weld microstructure, the diffusion of elements needs to be reduced to improve the performance of the welded joints. When using gas tungsten arc welding to weld transition layer welds of such composite materials, a small welding heat input with multi-layer and multi-pass welding should be used, and the weld of the transition layer should be higher than the interface of the composite material.
Author Contributions
Conceptualization, Z.W. and Y.F.; methodology, Z.W. and Y.F.; investigation, X.W. and L.Z.; data curation, L.Z. and X.W.; writing—original draft preparation, Y.F.; writing—review and editing, Z.W. and C.L.; supervision, Z.W. and C.L. All authors have read and agreed to the published version of the manuscript.
Funding
The work is supported by the National Key Research and Development Program (grant number 2018YFA0707305), Key R & D program of Shanxi Province (grant number 202102050201001), Shanxi Key Research and Development Program (grant number 202101120401008), Shanxi Youth Science Foundation Project (grant number 201901D211291).
Data Availability Statement
Not applicable.
Acknowledgments
Acknowledge all authors for supporting this article.
Conflicts of Interest
The authors declare no conflict of interest.
References
- Zhang, L.J.; Pei, Q.; Zhang, J.X.; Bi, Z.Y.; Li, P.C. Study on the microstructure and mechanical properties of explosive welded 2205/X65 bimetallic sheet. Mater. Des. 2014, 64, 462–476. [Google Scholar] [CrossRef]
- Findik, F. Recent developments in explosive welding. Mater. Des. 2011, 32, 1081–1093. [Google Scholar] [CrossRef]
- Dhib, Z.; Guermazi, N.; Ktari, A.; Gasperini, M.; Haddar, N. Mechanical bonding properties and interfacial morphologies of austenitic stainless steel clad plates. Mater. Sci. Eng. A 2017, 696, 374–386. [Google Scholar] [CrossRef]
- Liu, B.; Wang, S.; Fang, W.; Yin, F.; Chen, C. Meso and microscale clad interface characteristics of hot-rolled stainless steel clad plate. Mater. Charact. 2018, 148, 17–25. [Google Scholar] [CrossRef]
- Rao, N.V.; Reddy, G.M.; Nagarjuna, S. Weld overlay cladding of high strength low alloy steel with austenitic stainless steel—Structure and properties. Mater. Des. 2011, 32, 2496–2506. [Google Scholar] [CrossRef]
- Zhao, D.; Jiang, C.; Zhao, K. Ultrasonic welding of AZ31B magnesium alloy and pure copper: Microstructure, mechanical properties and finite element analysis. J. Mater. Res. Technol. 2023, 23, 1273–1284. [Google Scholar] [CrossRef]
- Yu, C.; Deng, Z.; Liang, S.; Xiao, H.; Zhao, Y. Effect of pure iron interlayer on microstructure and properties of hot-rolled stainless steel clad plate. Mater. Today Commun. 2021, 28, 102497. [Google Scholar] [CrossRef]
- Zhang, H.; Xiao, Y.; Xu, Z.; Yang, M.; Zhang, L.; Yin, L.; Chai, S.; Wang, G.; Zhang, L.; Cai, X. Effects of Ni-decorated reduced graphene oxide nanosheets on the microstructural evolution and mechanical properties of Sn-3.0Ag-0.5Cu composite solders. Intermetallics 2022, 150, 107683. [Google Scholar] [CrossRef]
- Yu, T.; Jing, Y.; Yan, X.; Li, W.; Pang, Q.; Jing, G. Microstructures and properties of roll-bonded stainleee/medium carbon steel clad plates. J. Mater. Process Technol. 2019, 266, 264–273. [Google Scholar]
- Chen, C.; Liu, M.; Liu, B.; Yin, F.; Dong, Y.; Zhang, X.; Zhang, F.; Zhang, Y. Tensile shear sample design and interfacial shear strength of stainless steel clad plate. Fusion Eng. Des. 2017, 125, 431–441. [Google Scholar] [CrossRef]
- Zhao, H.; Zhao, C.; Yang, Y.; Wang, Y.; Sheng, L.; Li, Y.; Huo, M.; Zhang, K.; Xing, L.; Zhang, G. Study on the Microstructure and Mechanical Properties of a Ti/Mg Alloy Clad Plate Produced by Explosive Welding. Metals 2022, 12, 399. [Google Scholar] [CrossRef]
- Li, Y.; Wu, Z. Microstructural Characteristics and Mechanical Properties of 2205/AZ31B Laminates Fabricated by Explosive Welding. Metals 2017, 7, 125. [Google Scholar] [CrossRef]
- Zhang, C.; Wang, S.; Qiao, H.; Chen, Z.; Mo, T.; Liu, Q. Enhancing the Mechanical Properties of Hot Roll Bonded Al/Ti Laminated Metal Composites (LMCs) by Pre-Rolling Diffusion Process. Metals 2019, 9, 795. [Google Scholar] [CrossRef]
- Kang, K.; Kawahito, Y.; Gao, M.; Zeng, X. Effects of laser-arc distance on corrosion behavior of single-pass hybrid welded stainless clad steel plate. Mater. Des. 2017, 123, 80–88. [Google Scholar] [CrossRef]
- Meng, Y.; Kang, K.; Gao, M.; Zeng, X. Microstructures and properties of single-pass laser-arc hybrid welded stainless clad steel plate. J. Manuf. Process 2018, 36, 293–300. [Google Scholar] [CrossRef]
- Abe, H.; Watanabe, Y. Role of d-ferrite in stress corrosion cracking retardation near fusion boundary of 316NG welds. J. Nucl. Mater. 2012, 424, 57–61. [Google Scholar] [CrossRef]
- Wang, Q.; Chen, S.; Lv, X.; Jiang, H.; Rong, L. Role of δ-ferrite in fatigue crack growth of AISI 316 austenitic stainless steel. J. Mater. Sci. Technol. 2022, 114, 7–15. [Google Scholar] [CrossRef]
- Li, C.; Qin, G.; Tang, Y.; Zhang, B.; Lin, S.; Geng, P. Microstructures and mechanical properties of stainless steel clad plate joint with diverse filler metals. J. Mater. Res. Technol. 2020, 9, 2522–2534. [Google Scholar] [CrossRef]
- Jiang, W.; Luo, Y.; Zhang, G.; Woo, W.; Tu, S. Experimental to study the effect of multiple weld-repairs on microstructure, hardness and residual stress for a stainless steel clad plate. Mater. Des. 2013, 51, 1052–1059. [Google Scholar] [CrossRef]
- Jiang, W.; Wang, B.; Gong, J.; Tu, S. Finite element analysis of the effect of welding heat input and layer number on residual stress in repair welds for a stainless steel clad plate. Mater. Des. 2011, 32, 2851–2857. [Google Scholar] [CrossRef]
- Gou, N.; Zhang, J.; Wang, J.; Bi, B. Butt Welding of 2205/X65 Bimetallic Sheet and Study on the Inhomogeneity of the Properties of the Welded Joint. J. Mater. Eng. Perform. 2017, 26, 1801–1807. [Google Scholar] [CrossRef]
- Chen, Y.; Sun, S.; Zhang, T.; Zhou, X.; Li, S. Effects of post-weld heat treatment on the microstructure and mechanical properties of laser-welded NiTi/304SS joint with Ni filler. Mater. Sci. Eng. A 2019, 771, 138545. [Google Scholar] [CrossRef]
- Shen, J.; Goncalves, R.; Choi, Y.T.; Lopes, J.G.; Yang, J.; Schell, N.; Kim, H.S.; Oliveira, J.P. Microstructure and mechanical properties of gas metal arc welded CoCrFeMnNi joints using a 308 stainless steel filler metal. Scr. Mater. 2023, 222, 115053. [Google Scholar] [CrossRef]
- Shen, J.; Goncalves, R.; Choi, Y.T.; Lopes, J.G.; Yang, J.; Schell, N.; Kim, H.S.; Oliveira, J.P. Microstructure and mechanical properties of gas metal arc welded CoCeFeMnNi joints using a 410 stainless steel filler metal. Mater. Sci. Eng. A 2022, 857, 144025. [Google Scholar] [CrossRef]
- Zhu, Q.; Chen, J.; Gou, G.; Chen, H.; Li, P. Ameliorated longitudinal critically refracted—Attenuation velocity method for welding residual stress measurement. J. Mater. Process Technol. 2017, 246, 267–275. [Google Scholar] [CrossRef]
- Deng, H.; Chen, Y.; Jia, Y.; Pang, Y.; Zhang, T.; Wang, S.; Yin, L. Microstructure and mechanical properties of dissimilar NiTi/Ti6Al4V joints via back-heating assisted friction stir welding. J. Manuf. Process 2021, 64, 379–391. [Google Scholar] [CrossRef]
- Yuhua, C.; Yuqing, M.; Weiwei, L.; Peng, H. Investigation of welding crack in micro laser welded NiTiNb shape memory alloy and Ti6Al4V alloy dissimilar metals joints. Opt. Laser Technol. 2017, 91, 197–202. [Google Scholar] [CrossRef]
- Bandhu, D.; Djavanroodi, F.; Shaikshavali, G.; Vora, J.J.; Abhishek, K.; Thakur, A.; Kumari, S.; Saxena, K.K.; Ebrahimi, M.; Attarilar, S. Effect of Metal-Cored Filler Wire on Surface Morphology and Micro-Hardness of Regulated Metal Deposition Welded ASTM A387-Gr.11-Cl.2 Steel Plates. Materials 2022, 15, 6661. [Google Scholar] [CrossRef]
- Shen, J.; Goncalves, R.; Choi, Y.T.; Lopes, J.G.; Yang, J.; Schell, N.; Kim, H.S.; Oliveira, J.P. Gas tungsten arc welding of as-cast AlCoCrFeNi2,1 eutectic high entropy alloy. Mater. Des. 2022, 223, 111176. [Google Scholar] [CrossRef]
- Lopes, J.G.; Rocha, P.; Santana, D.A.; Shen, J.; Maawad, E.; Schell, N.; Coury, F.G.; Oliveira, J.P. Impact of Arc-Based Welding on the Microstructure Evolution and Mechanical Properties in Newly Developed Cr29.7Co29.7Ni35.4Al4Ti1.2 Multi-Principal Element Alloy. Adv. Eng. Mater. 2023, 2300109. [Google Scholar] [CrossRef]
- GB/T228-2002; Metallic Materials-Tensile Testing at Ambient Temperature. China Standard Press: Beijing, China, 2002. (In Chinese)
- Chu, Q.; Xia, T.; Zhang, L.; Zhao, P.; Zhang, M.; Zheng, J.; Yan, F.; Cheng, P.; Yan, C. Interfacial microstructure and mechanical properties of titanium/steel dissimilar joining. Mater. Lett. 2021, 307, 131069. [Google Scholar] [CrossRef]
- Liu, B.; Wang, S.; Fang, W.; Ma, J.; Yin, F.; He, J.; Feng, J.; Chen, C. Microstructure and mechanical properties of hot rolled stainless steel clad plate by heat treatment. Mater. Chem. Phys. 2018, 216, 460–467. [Google Scholar] [CrossRef]
- Zhu, Z.; He, Y.; Zhang, X.; Liu, H.; Li, X. Effect of interface oxides on shear properties of hot-rolled stainless steel clad plate. Mater. Sci. Eng. A 2016, 669, 344–349. [Google Scholar] [CrossRef]
- Li, H.; Yan, L.; Zhang, H.; Ai, F.; Zhao, D.; Li, Y.; Jiang, Z. Effects of sintering temperature on interface microstructure and element diffusion of WC-Co-Ni-Fe/high-speed steel composites. Mater. Lett. 2021, 310, 131449. [Google Scholar] [CrossRef]
- Wang, S.; Ma, Q.; Li, Y. Characterization of microsture, mechanical properties and corrosion resistance of dissimilar welded joint between 2205 duplex stainless and 16MnR. Mater. Des. 2011, 32, 831–837. [Google Scholar] [CrossRef]
- Wang, Y. Study on Regularity of Austenitic Stainless Steel Weld Toughness and Microstructure; Nanjing University of Science and Technology: Nanjing, China, 2012. [Google Scholar]
- Li, M.; Liu, F.; Yu, H. Effect of post Weld Heat Treatment δ-Ferrite Structure and properties of 308L Weldment Stainless Steel. Hot Working Process 2013, 42, 9–11. [Google Scholar] [CrossRef]
- Sadeghian, M.; Shamanian, M.; Shafyei, A. Effect of heat input on microstructure and mechanical properties of dissimilar joints between super duplex stainless steel and high strength low alloy steel. Mater. Des. 2014, 60, 678–684. [Google Scholar] [CrossRef]
- Hu, G.; Cai, X.; Rong, Y. Fundamentals of Materials Science; Shanghai Jiaotong University Press: Shanghai, China, 2010; pp. 128–139. (In Chinese) [Google Scholar]
- Fu, Z.H.; Yang, B.J.; Shan, M.L.; Li, T.; Zhu, Z.Y.; Ma, C.P.; Zhang, X.; Gou, G.Q.; Wang, Z.R.; Gao, W. Hydrogen embrittlement behavior of SUS301L-MT stainless steel laser-arc hybrid welded joint localized zones. Corros. Sci. 2020, 164, 108337. [Google Scholar] [CrossRef]
Disclaimer/Publisher’s Note: The statements, opinions and data contained in all publications are solely those of the individual author(s) and contributor(s) and not of MDPI and/or the editor(s). MDPI and/or the editor(s) disclaim responsibility for any injury to people or property resulting from any ideas, methods, instructions or products referred to in the content. |
© 2023 by the authors. Licensee MDPI, Basel, Switzerland. This article is an open access article distributed under the terms and conditions of the Creative Commons Attribution (CC BY) license (https://creativecommons.org/licenses/by/4.0/).