Abstract
Heat-treated aluminum–silicon (Al-Si)-based alloys have dominated the cast lightweight alloy industry for several decades. However, in the last decade, Al-Ce-based alloys have shown promise in replacing Al-Si alloys as they remove the need for costly heat treatments. As the properties of Al-Ce alloys depend on the as-cast microstructure, it is important to characterize the solidification kinetics of these alloys. Therefore, this study focused on characterizing the solidification of an Al-Ce alloy with additions of Ni and Mn (nominal composition Al-12.37Ce-3.26Ni-0.94Mn-0.12Fe in weight percent). The alloy was cast in a wedge mold configuration, resulting in cooling rates between 0.18 and 14.27 °C/s. Scanning electron microscopy (SEM) coupled with the energy dispersive x-ray spectroscopy (EDS) and differential scanning calorimetry (DSC) techniques characterized the evolution rate of solid phases. The SEM/EDS data revealed that an Al10CeMn2 phase was present at higher cooling rates. At lower cooling rates, near the center of the casting, a primary Al23Ce4Ni6 phase was more present. It was observed that up to 2.6 atomic percent (at.%) of Mn was dissolved in this primary Al23Ce4Ni6 phase, thereby removing a large portion of the available Mn for forming the Al10CeMn2 phase. DSC analysis showed differences in the samples’ liquidus temperatures, which indicated compositional variations. Inductively coupled plasma–atomic emission spectroscopy (ICP-OES) and Scheil solidification simulations correlated the compositional differences with phase formation, which agreed with the SEM and DSC results. This experiment provides insight into novel Al-Ce-Ni-Mn alloys and where their potential lies in industrial applications.
1. Introduction
With the growth of environmentally friendly technology, there is a high demand dependency on rare earth (RE) element mining. RE elements, such as neodymium, praseodymium, dysprosium, and samarium, are used for high-performance magnets in applications such as electric cars and wind turbines [1,2,3]. However, the desirable RE elements typically comprise approximately 25% of the total material mined. The remaining 75% is discarded as a by-product and has little industrial relevance [4]. Of the RE elements discarded, cerium (Ce) is the most abundant, at 38% [5]. The usefulness of Ce, however, has been researched throughout the 20th century concerning alloying it with aluminum (Al) to help with issues of insufficient thermal stability. For example, Belov et al. [6], in 1999, conducted elevated-temperature experiments on several Al alloys with additions of Ce and nickel (Ni). Targeting 350 °C, Belov and his colleagues found that an Al-12Ce-5Ni (wt.%) alloy exhibited a 75% increase ultimate tensile strength (UTS) over a conventional Al-Si alloy (339) used at the time. However, this research was not continued due to the high cost of Ni and the lack of a Ce supply chain. That is, until the demand for high-performance magnets experienced a dramatic increase, resulting in an abundance of available Ce.
This abundance has captured the interest of researchers investigating how to improve the efficiency of internal combustion engines by creating thermally stable lightweight alloys for next-generation automotive powertrains [7,8,9,10,11]. A clear emergence from all of this research is the potential for the Al-Ce-based alloying system to become a fundamental pillar of high-performance Al alloys that can operate in applications that require excellent thermal stability above 200 °C [12,13,14,15,16]. Extensive research has explored the fundamentals of the Al-Ce binary system to understand the platform from which a new alloying system can be structured. The solidification characteristics and phase analysis of hypoeutectic [17,18], eutectic [13,18,19,20], and hypereutectic [17,18,19,21] binary alloy compositions revealed that the Al11Ce3 phase has excellent castability and thermal stability up to 500 °C. In a hypereutectic composition, primary Al11Ce3 formation occurs. If the content of Ce exceeds 16 wt.%, the primary phase begins to crack because of the large coefficient of the thermal expansion discrepancy [7]. Therefore, most studies have focused on the eutectic composition to avoid any possible decrease in mechanical properties. These eutectic alloys precipitate a lamellae Al-Al11Ce3 phase that can retain up to 80% of its hardness when exposed to 500 °C for 168 h [13,20,22]. For comparison, the Al-Si eutectic composition only retains ~50% of its hardness when exposed to the same test conditions [20]. This evidence justifies building an elevated-temperature Al alloy system based on the Al-Ce binary system. The current major drawback of Al-Ce systems is that the lamellae Al-Al11Ce3 eutectic phase does not provide sufficient precipitate-strengthening benefits for next-generation powertrain applications.
This lack of strength of the Al-Ce eutectic phase brings relevance back to the research conducted by Belov et al. [6], where it was found that the addition of Ni enhanced the strength of these alloys. Although the testing parameters in the 1999 study were not rigorous enough to meet today’s automotive industry demands, they provide insight into how minor alloy elements can be used to add strength to the Al-Ce system. Sims et al. [21] drew inspiration from Belov and his colleagues and investigated two higher-order Al-Ce-based alloys with magnesium (Mg) additions. The alloys under investigation were Al-12Ce-0.4Mg and Al-12Ce-4Si-0.4Mg (wt.%). It was concluded that the Al-Ce-Mg alloy in an as-cast state exhibited a UTS and yield strength (YS) of 200.6 and 78.6 MPa, respectively, while the Al-Ce-Si-Mg alloy exhibited values of 252.3 and 128.2 MPa, respectively, when heat treated to a T6 temper. These alloys were only tested at ambient temperature, but showed comparable strength to alloys such as T6 A356. Weiss et al. [23] took it a step further and tested two Al-Ce-Mg alloys, each with 8 wt.% Ce, but differing in Mg contents (7 vs. 10 wt.%). Both alloys were tested at ambient temperature and 260 °C. The alloy containing 7 wt.% magnesium exhibited a UTS and YS of 195 and 151 MPa, respectively. The alloy with 10 wt.% magnesium exhibited a UTS and YS of 227 and 186 MPa, respectively. When tested at 260 °C, the 7 wt.% Mg alloy retained 69% of its UTS and 80% of its YS. The alloy containing a larger amount of Mg retained 60% of its UTS and 70% of its YS. It is worth noting that these alloys were not conditioned (i.e., exposed to 260 °C for an extended period) before testing; therefore, it is expected that the alloys will perform slightly worse than expected if exposed to powertrain conditions for an extended period. It was also found in the study by Weiss et al. that the alloys were non-responsive to heat treatments, aside from homogenization having a positive effect on alloys with high Mg contents. As these Al-Ce-based alloys are typically not heat-treatable, they depend heavily on their solidification kinetics for their respective mechanical properties. The previous studies cited here do not account for the alloys’ solidification kinetics, but they significantly impact the mechanical properties of the alloys. This solidification rate-dependency of Al-Ce alloys removes the time and resource-consuming heat treatments from the production process. Nguyen et al. [24] and Salonitis et al. [25] predicted that removing necessary heat treatments from Al alloy production alone could save 425,000–675,000 MWh annually. Along with the decreased production cost, decreasing this amount of energy for the manufacturing chain would drastically decrease the ecological footprint of the automotive industry.
Recently, Kozakevich et al. [10,14] investigated the interplay between the cooling rates, microstructures, and mechanical properties of an Al-Ce-Ni-Mn alloy designed for elevated-temperature applications. The alloy was cast in a wedge mold configuration to investigate the effects of different cooling rates on the material’s properties. The alloy exhibited UTS and YS at ambient temperatures ranging from 107 to 131 MPa and 64 to 81 MPa, respectively. At 250 °C, the alloy retained 75 to 83% of its UTS and 73 to 97% of its YS, even after conditioning at 250 °C for 150 h. The variation in tensile strength and tensile retention at 250 °C was highly dependent on the solidification kinetics of the alloy. Scanning electron microscopy (SEM) and energy-dispersive X-ray spectroscopy (EDS) revealed that the volume fraction, size, and morphology of the five phases found, i.e., α-Al, Al23Ce4Ni6, Al11Ce3, Al10CeMn2, and Al20CeMn2, were highly dependent on the solidification kinetics and induced directional solidification.
To better understand the solidification kinetics of the Al-Ce-Ni-Mn alloy, differential scanning calorimetry (DSC) was performed on four samples from critical areas of the wedge mold in [26] (these results are summarized further in Section 3.2 of this paper). The experiment concluded that further investigation into the solidification kinetics of this alloy is warranted; a better understanding would enable a broader utilization of the alloy for various elevated-temperature applications in the automotive industry.
Therefore, the present work aims to develop a more comprehensive understanding of the alloy’s solidification kinetics by performing more in-depth studies on the same samples from [26] and wedge mold casting from [10,14]. The Al-Ce-Ni-Mn alloy’s solidification kinetics, microstructure, and directional solidification-induced composition variances are examined using thermodynamic simulation software, SEM, EDS, optical microscopy, DSC thermal analysis, and inductively coupled plasma–optical emission spectroscopy (ICP-OES).
2. Materials and Methods
The Al-Ce-Ni-Mn ingots used in this research were provided by Eck Industries Inc., Manitowoc, WI, USA. The alloy was melted down in an electrical resistance furnace under argon coverage and then cast in a steel wedge mold. The samples, their locations, and other relevant information are provided in Figure 1. A comprehensive description of the preliminary results and details of the casting process is presented in [10]. The main casting parameters were that the alloy was poured at 700 °C and the wedge mold was preheated to 250 °C.
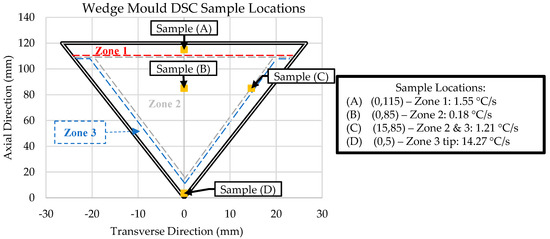
Figure 1.
Sample details for scanning electron microscopy (SEM), energy dispersive x-ray spectroscopy (EDS), differential scanning calorimetry DSC, and inductively coupled plasma–optical emission spectroscopy (ICP-OES) analysis. NOTE: Sample cooling rate data adapted from [10].
The zones in Figure 1 represent regions with unique microstructures throughout the wedge mold casting. Samples were obtained from critical points within the wedge mold to understand the solidification kinetics of these zones. The critical point in Zone 1 (Sample A) was at the top–center of the wedge mold, where a thermocouple was placed during casting. This sample provides us with the exact cooling rate of the sample to compare with the follow-up DSC and ICP-OES experiments. Similarly, Sample D was taken from the thermocouple placed in Zone 3 for the same reason.
Two samples from Zone 2 were taken. The first (Sample B) was from the center, and the second (Sample C) was from the interface between Zones 2 and 3. Both samples were taken at the same axial position (85 mm), but 15 mm apart in the transverse direction. The center of Zone 2 (Sample B) exhibited the lowest cooling rate (0.18 °C/s). The interface between Zone 2 and 3 (Sample C) provided insight into the transition between the initial skin developed immediately after pouring (high cooling rates) and the center of the wedge mold (lowest cooling rates).
Metallography samples were mounted and prepared according to ASTM E3-11 specifications [27]. Mounting was performed in 2-part fast-curing acrylic. After mounting, the samples were sequentially ground with 400, 600, and 1200 silicon carbide abrasive paper and then polished sequentially with 9, 6, 3, and 1 μm abrasive diamond suspension paste. The final polish was performed with 0.6 µm basic colloidal silica diamond polishing lubricant with a pH of 9.
Once the samples were prepared, optical microscopy was performed to measure the secondary dendrite arm spacing (SDAS). SDAS measurements were taken with a VHX-7000 series digital microscope (KEYENCE, Mississauga, ON, Canada) according to method E outlined in [28], which involved measuring between two secondary dendrites parallel to the primary arm. A minimum of 50 measurements were taken for each sample to ensure measurement and standard deviation accuracy. An example of these measurements is shown in Figure 2.
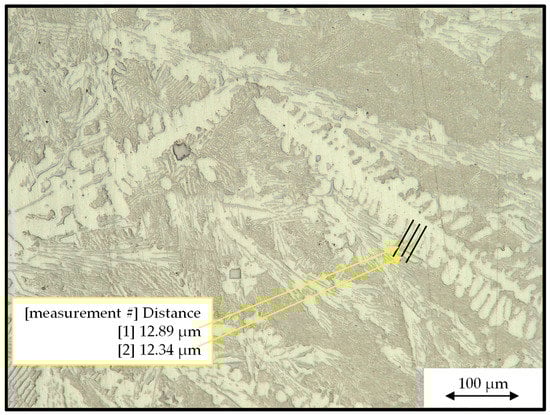
Figure 2.
An optical micrograph showing how the secondary dendrite arm spacing (SDAS) measurements were taken.
The SDAS measurements were then used in Equation (1), adapted from [10], which was specific to this material. Utilizing this equation allowed for calculating the cooling rates where thermocouples were absent during casting (i.e., Samples B and C).
A Mira 3 XMU, field emission gun SEM (TESCAN, Brno, Czech Republic) was utilized to collect micrographs of the alloys’ microstructures. A Cressington 208 HR sputter coater was used to coat the sample with a 5 µm platinum (Pt) layer to enhance conductivity and reduce the charging effects and heating of the samples. The SEM was operated at an accelerating voltage of 20 kV to capture the micrographs. After the micrographs were collected, Oxford Instruments Aztec data acquisition and processing software (4.3, Oxford Instruments NanoAnalysis, High Wycombe, UK) equipped with an 80 mm2 Oxford EDS detector were utilized to characterize the compositions of each phase. EDS point analysis was performed to identify the atomic percentages of the phases. At least 30 point scans per phase were taken to determine the atomic percentage. The EDS data and phase morphologies were compared with those in the literature to determine each phase’s stoichiometry.
A STA 449F3 Jupiter (NETZSCH, Waldkraiburg, Bavaria, Germany) heat flux DSC thermal analysis instrument was employed to understand the Al-Ce-Ni-Mn alloy’s phase evolution as a function of temperature. The initial liquidus and solidus temperatures were determined by Scheil ThermoCalcTM simulations to be 733 °C and 632 °C, respectively. Therefore, the temperature range of the DSC experiment was set from 20 to 750 °C. The heating and cooling rate was selected to be 10.00 °C /min (~0.17 °C /s) based on similar studies previously conducted on Al-Ce alloys [18,29]. Each sample was 0.020 +/− 0.003 g and taken from the locations outlined in Figure 1. Samples from the original ingot material were also extracted and tested. A sample size of 0.020 g has been proven to produce the most accurate results for micro-scale DSC thermal analysis [30]. Each sample was heated and cooled three times, and the results were averaged.
The results of the DSC experiment offer insight into the specifics of solidification kinetics, such as the solidus, liquidus, and latent heat of fusion of the eutectic reaction. The solidus and liquidus temperatures were determined by extrapolating the tangent reaction rate near the tip of the characteristic peak and projecting it to intersect the baseline of the DSC data [18,31,32]. The extrapolation of the onset and end temperatures of the characteristic peak was performed according to ASTM E794 [32] standards. The end temperature of the characteristic peak only correlated with the liquidus if one peak was present in the results (i.e., all phases formed near the eutectic temperature). Finally, the latent heat of fusion of the characteristic peak could be calculated by deriving the area under the peak.
ICP-OES (iCAP 6000, Thermo Fisher Scientific, Waltham, MA, USA) was used in this study to confirm the ingot composition and identify the compositional changes that were the result of the induced directional solidification. Samples of 0.1 g each were selected from six random locations on two different ingots. The samples were dissolved in a solution of HCl and HNO3 for digestion while completely retaining the elements, after which the solution was diluted to perform the final elemental analysis. The average composition of the ingots is shown in Table 1.

Table 1.
Composition of ingots in wt.% based on ICP-OES experimentation.
Following this, three samples of 0.1 g from each sample location (A, B, C, and D, identified in Figure 1) were extracted and tested via ICP-OES to determine the difference in composition due to directional solidification in the wedge mold. The average of the three tests was taken as the sample composition for its specific location.
3. Results and Discussion
3.1. ThermoCalcTM Scheil Solidification
A Scheil solidification simulation was conducted using the ThermoCalcTM software (2022b, Thermo-Calc Software, Solna, Sweden) based on the composition obtained from the ICP-OES analysis of the ingot material. The results are shown in Figure 3.
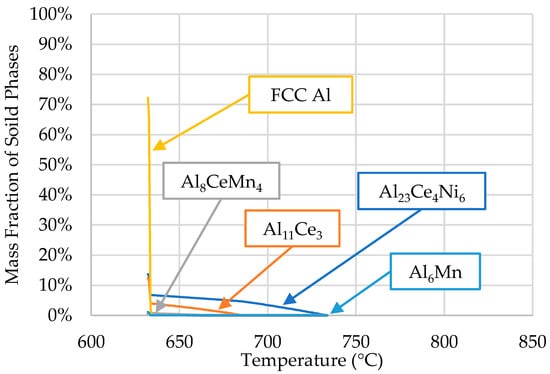
Figure 3.
Scheil simulation of alloys’ solidification for the compositions presented in Table 1.
The phases predicted by ThermoCalcTM were α-Al (FFC Al), Al23Ce4Ni6, Al11Ce3, Al8CeMn4, and Al6Mn. The presence of these phases, except for the Al6Mn phase, was confirmed via SEM/EDS in [10]. Limited research is available on the Al23Ce4Ni6 phase regarding its solidification kinetics. In the early 2000s, Gout et al. [33] concluded that the Al23Ce4Ni6 phase crystallizes in the monoclinic space group C2/m, the cell parameters for which are a = 16.042 (8), b = 4.140 (4), c = 18.380 (8) Å, and β = 113.24 (5)°. Typically, this ternary phase is accompanied by Al11Ce3 and Al3Ni in ternary Al-Ce-Ni alloys; however, the results from [10] and ThermoCalcTM were in agreement that Al3Ni did not form in the Al-Ce-Ni-Mn alloy.
In the preliminary analysis [10], when investigating the interplay between the cooling rate, microstructure, and tensile properties of the current Al-Ce-Ni-Mn alloy, it was found that Al8CeMn4 was absent from the casting. Instead, it was replaced by Al10CeMn2 and Al20CeMn2. Over the past few years, research has been conducted on Al-Ce-Mn alloys, which has focused on the Al-rich portion of this system [34,35,36]. Most significant to the solidification kinetics of the Al-Ce-Ni-Mn alloy described in the current study is the revised portion of the Al-rich corner of the Al-Ce-Mn ternary diagram performed by Yang et al. in [34]. This revised portion of the ternary diagram shows that the Al10CeMn2 and Al20CeMn2 phases dominated earlier during solidification, with the latter phase having a slightly higher thermodynamic driving force. From this revised ternary diagram, it is expected, that for the composition of the alloy under investigation (12.37% Ce, 0.94% Mn), the Al10CeMn2 phase would form earlier during solidification, after which, at ~700 °C, the ternary Al-Ce-Mn phase would transition to Al20CeMn2 and Al11Ce3. This phenomenon is shown below in Figure 4.
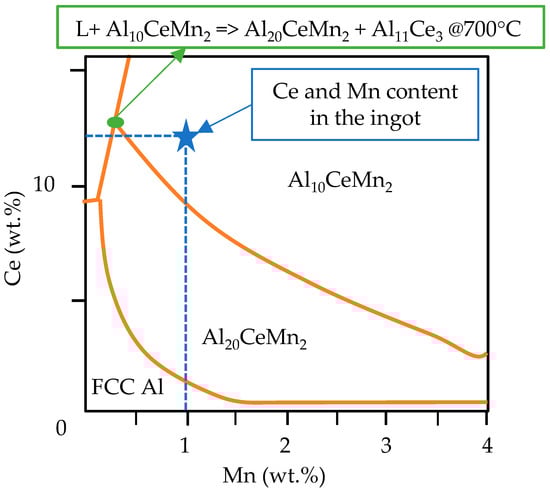
Figure 4.
The modified ternary Al-Ce-Mn liquidus projection and the position of the Al-Ce-Ni-Mn alloy investigated in this stud, data adapted from [34].
Aside from Scheil simulations, ThermoCalc was also used to calculate the solubility of the elements in each phase. More specifically, the amounts of solid-solution Mn in Al23Ce4Ni6, Ni and Mn in Al11Ce3, Ni in Al8CeMn4, and Mn in the α-Al matrix were determined throughout the solidification range (734 to 632 °C). Negligible solubility was found in all cases, except for Mn in the α-Al matrix, where the maximum solid solution at 632 °C was 0.4 at.%, lower than the 0.6 at.% published in the binary Al-Mn literature [37,38]. However, Mondolfo’s investigation into Al-Ce-Mn alloys [39] revealed that Ce reduces Mn’s solid solubility in Al. The SEM/EDS data discussed in the next section show how much Mn is present in the Al matrix and how its solubility is affected by the solidification rate of the alloy.
3.2. SEM/EDS Solidification Trends
Previously in [10], the resulting wedge casting revealed three distinct zones with varying microstructures. Figure 1 shows the sample locations and how the respective cooling rates were determined, while Figure 5 below shows the microstructures at those sample locations. The phases in each zone were relatively similar and contained variations of α-Al, eutectic Al-Al23Ce4Ni6, eutectic Al-Al11Ce3, primary Al23Ce4Ni6, primary Al11Ce3, and Al20CeMn2. The Al10CeMn2 phase was only present in samples C and D near the wall of the casting. All Mn in samples A and B was either in solid solution in the Al matrix or Al20CeMn2 phase.

Figure 5.
SEM micrographs of each sample’s general microstructure.
Point scans were performed for each phase to determine the atomic composition. After this, the atomic composition was compared with that in the published literature on similar phases to determine the correct stoichiometry of a specific phase. The atomic compositions of each phase are summarized in Table 2.
Table 2.
The atomic percentages of phases identified in the Al-Ce-Ni-Mn alloy by EDS.
The Al matrix contained an average of 0.23 atomic percentage (at.%) Mn in solid solution. Higher cooling rates near the wall (e.g., Sample D) resulted in up to 0.44 at.% Mn in the matrix. As previously stated, these values are lower than those in the published literature [37,38] on Al-Mn alloys (~0.62 at.% Mn into α-Al). However, as also mentioned above, Mondolfo’s investigation into Al-Ce-Mn alloys [39] revealed that Ce lowered the solubility of Mn in the matrix, which explained the lower values of Mn in α-Al presented in Table 2.
Al11Ce3 was present in two morphologies: blocky primary and lamellae eutectic phases. These morphologies are consistent with those in the literature data on the binary Al-Ce alloys [17,19,20]. The primary intermetallic phase resided in samples B, C, and D, but not at the top of the casting (Sample A). The stoichiometry of the primary phase was consistent with the literature [40] and contained no Ni or Mn in a solid solution. The lamellae eutectic Al11Ce3 contained a trace amount of Ni (0.16 at.%) in a solid solution. Research by Tang et al. in [41,42] revealed that between 0.6 and 1.7 at.% Ni can be dissolved into the Al11Ce3 phase. However, the alloys in these studies had significantly higher Ce and Ni contents, which justifies why they experienced an elevated amount of Ni in the solid solution of the Al11Ce3 phase.
The solubility of Ni in the eutectic phase and not the primary phase can be explained by the precipitation kinetics of the Al23Ce4Ni6 phases. In the early stages of solidification (~732 °C), the primary Al23Ce4Ni6 phase (also known as the τ8 phase [33,41,42,43,44]) began to form, drawing Al and Ni out of the liquid at a higher rate than Ce. Eventually, the liquid became Ce-enriched, and the Al11Ce3 primary phase began to precipitate out of the liquid around 686 °C. As the primary Al23Ce4Ni6 phase had a high growth rate, no excess Ni could be dissolved into the primary Al11Ce3 phase. However, once the alloy reached the eutectic temperature, the precipitation of the lamellae Al-Al23Ce4Ni6 and Al-Al11Ce3 phases occurred simultaneously. These phases were thin and fine, and because Ni had negligible solubility in the Al matrix, the remaining Ni entered both eutectic lamellae phases, resulting in ~0.16 at.% Ni in the Al-Al11Ce3 eutectic phase. However, due to the nano-scale size of the Al11Ce3 eutectic phase, the electron beam during EDS analysis may have been penetrating the surrounding Al-matrix, thereby diluting the measurements. Therefore, the expected Ni composition in the eutectic Al-Al11Ce3 could be calculated based on the ratio of Ce to Ni. As the Ce:Ni ratio was ~40:1, we could scale the 6.41 at.% Ce up to ~20 at.% based on our EDS data, which is consistent with the literature. Doing so scaled the Ni at.% in the eutectic Al11Ce3 to ~0.509 at.%, which was closer to the values published in the literature [41,42].
Similarly, the EDS results from the Al23Ce4Ni6 eutectic phase also presented evidence of dilution due to the surrounding Al-matrix. When scaling the Ni:Mn ratio of the eutectic phase up to the expected composition of 15.77 at.% Ni, it is expected that ~2.6 at.% Mn would be found in the solid solution of the eutectic Al23Ce4Ni6 lamellae, which was approximately the Mn content found in the primary phase. Aside from the Mn content found in the Al23Ce4Ni6 phases, the amounts of Ce and Ni shown in Table 2 are consistent with the published data in [33,41,42,43,44]. The eutectic and primary phases were larger in sample B than those in the other samples. This is consistent with the results presented in [14]. As shown in Table 2, both morphologies of this phase had significant Mn solubility (~2.56 at.%), a phenomenon that is not currently predictable by the ThermoCalcTM software.
The same conclusion applies to both ternary Al-Ce-Mn phases in the wedge mold casting. It was found that the Al10CeMn2 phase had an average of 3.3 at.% Ni in solid solution, while the Al20CeMn2 phase contained much less (i.e., 0.32 at.%) Ni in solid solution. The Al10CeMn2 and Al20CeMn2 phases were consistent in size and morphology with those found and characterized in [34,35].
3.3. DSC Thermal Analysis
The SEM micrographs and EDS compositional analysis show that the phase morphologies and volume fractions within each zone of the wedge mold casting differed significantly. These factors depended on the changes in the progression of phase evolution that resulted from varying cooling rates. DSC thermal analysis was necessary to understand the phase precipitation characteristics and to gain further insight into the solidification kinetics of this alloy. Initial DSC thermal analysis was performed in [26] to show how the solidification kinetics affected the alloy’s microstructure. The preliminary DSC results are shown in Figure 6 below. The indicated sample locations correspond to those in the experimental procedure section above. The solidus temperature, latent heat of fusion of the eutectic phase, and liquidus temperature were extracted from the DSC results.
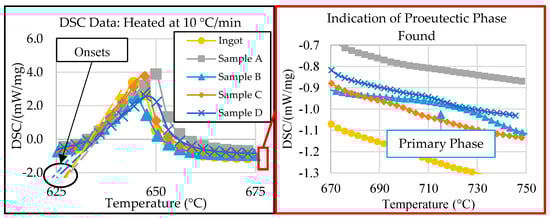
Figure 6.
DSC data of all samples, modified and adapted from [26].
Figure 6 shows that all samples provided a similar solidus temperature (onset) to the 632 °C predicted by the Scheil simulation of the ingot material in ThermoCalcTM, except for that of Sample B, which was 5 °C lower [26]. The discrepancy in eutectic temperatures between Sample B and the ingot suggested a compositional variance in the center of the wedge mold (Zone 2). Additionally, the exploded view in Figure 6, on the right, shows evidence of primary formation in samples B, C, and D at different temperatures, suggesting compositional variations between the DSC samples. These results are consistent with the SEM micrographs.
The compositional difference between the samples, indicated by the initial DSC results, suggested that further investigation was needed before determining if the end temperature of the eutectic reaction could be considered as the liquidus temperature for Samples A, C, and D. Additional information is also needed from sample B to ensure that no other primary peak forms above 800 °C. For this reason, the determined liquidus temperature of each sample is discussed in Section 3.4 below.
Aside from the liquidus and solidus temperatures, the DSC data show the significant variance in the eutectic reaction latent heat of fusion between samples. The latent heat of fusion from DSC thermal analysis was calculated based on the energy absorbed (exothermic is identified in Figure 6) during the melting of the eutectic phase, which was then normalized by the sample’s total mass. Therefore, if the samples had significantly different latent heat of fusion values, they must also have had different volume fractions of eutectic phases. For example, sample B contained the least characteristic latent heat of fusion. In Figure 5, sample B also had the highest volume fraction of primary phases, indicating that sample B had a different composition to the original ingot. This compositional difference resulted from the cooling gradient induced by the wedge mold configuration. This significant cooling gradient varied the alloy’s solidification kinetics, resulting in differences in the compositions within the critical zones of the casting. The significance of how the composition varied was characterized via ICP-OES analysis.
3.4. ICP-OES Data
ICP-OES analysis was performed to characterize the composition gradient that directly resulted from the solidification kinetics of the Al-Ce-Ni-Mn alloy and the directional solidification induced by the wedge mold casting configuration. The results of the ICP-OES experiments are shown in Figure 6. In Figure 6, the downward-pointing arrows highlighted in red indicate the elemental percentage of change compared with the original ingot’s composition shown in Table 1. The green upward-pointing arrows indicate increases in elemental composition based on the original ingot values.
Figure 7 shows that the ICP-OES results of samples A and C exhibited significant decreases in Ce, Ni, and Mn compared with the original ingot composition. In turn, the Ce, Ni, and Mn concentrations increased in Samples B and D. The exact compositions are shown below in Table 3.
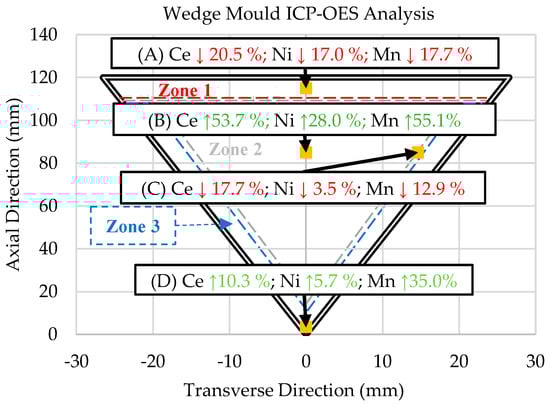
Figure 7.
Summary of the wt.% changes of each sample compared with the ingot composition as determined by the ICP-OES analysis of locations in the wedge mold. NOTE: The up and down arrows indicate percent increases or decreases, respectively, from the original ingot composition in Table 1.
Table 3.
ICP-OES data for the Ingot materials and samples A, B, C, and D (all values in wt.%).
The ICP-OES-determined compositions of each sample were used in Scheil simulations to determine the solidification kinetics of each critical zone of the wedge mold. The results of these Scheil simulations are shown in Figure 8.
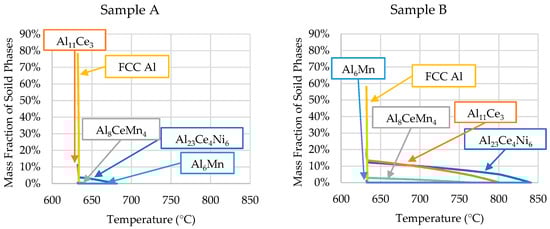
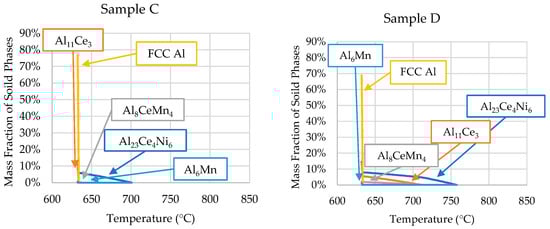
Figure 8.
Scheil simulations of the alloys’ solidification for the compositions determined by the ICP-OES analyses of each sample position (presented in Table 3).
The phase evolutions shown in Figure 8 are consistent with the SEM micrographs and DSC data. The only discrepancy is that small amounts of Al6Mn precipitated close to the end of Scheil solidification in all the samples. However, SEM/EDS showed no presence of Al6Mn in the casting. As mentioned, ThermoCalcTM did not account for the precipitation of Al10CeMn2 and Al20CeMn2. Instead, the software predicted the Al8CeMn4 phase to precipitate, which was disproved by the EDS data in Table 2.
The Scheil simulation for each sample revealed that Sample A contained proeutectic Al23Ce4Ni6 starting to precipitate at 682 °C. The software predicted 3.8 wt.% (<1 vol.%) of the primary A23Ce4Ni6 phase, which was consistent with the SEM micrographs. The relatively low amount of the primary phase, coupled with the precipitation temperature being close to the eutectic temperature, explains why the phase did not register in the DSC results. It is likely that, during DSC experimentation, the proeutectic formation of the Al23Ce4Ni6 phase was encapsulated in the characteristic peak. Therefore, the end temperature of the characteristic peak (655 °C) from the DSC results for sample A was likely the liquidus temperature of the sample. This value was lower than the Scheil-predicted value of 682 °C. The disagreement between liquidus temperatures was likely because the mass fraction of the primary phases was not significant enough for the DSC to detect the resulting reaction energy. The DSC and Scheil simulation agreed that the solidus temperature of sample A was 632 °C.
The comparison between the DSC and ThermoCalcTM results is summarized in Table 4 for all samples. Table 4 shows that all samples agreed with the Scheil simulation and DSC results of the solidus temperature, except for sample B. The DSC results for Sample B showed that the solidus temperature was 627 °C, while the Scheil simulation predicted the solidus temperature to be 632 °C, a 5 °C difference. The other samples were between 1 and 3 °C off the simulated value.
Table 4.
Liquidus and solidus temperatures of ICP-OES sample compositions based on Scheil simulations compared with DSC.
The solidification range of sample B’s ICP-OES composition increased significantly due to the hypereutectic Ce and Ni contents. The precipitation of the primary Al23Ce4Ni6 phase began at 840 °C, compared with 734 °C in the ingot material, as predicted by the Scheil simulation. As the DSC experiment on this sample only went up to 800 °C, the liquidus temperature of the alloy could not be determined by the DSC data. However, the Scheil simulation of sample B’s composition in Figure 8 offers insight into what exactly is happening during solidification within the wedge mold. The large solidification range and low cooling rate (0.18 °C/s) explain why the SEM micrographs of Sample B showed larger primary phases than the other samples. As Sample B was from Zone 2, it could be observed that, when Zone 3 solidified (sample D) first at a relatively high cooling rate (14.27 °C/s), elevated amounts of Ce and Ni resided in the liquid. Excess Ni and Ce resided in the liquid because the high cooling rate of Zone 3 did not allow enough time for the primary Al23Ce4Ni6 and Al11Ce3 phases to precipitate in significant amounts. Zone 2 began to solidify much slower because the steel mold was heat-soaked, resulting in significantly reduced heat flux. The slower solidification rate and elevated amounts of Ce and Ni allowed for the formation of large primary Al23Ce4Ni6 and Al11Ce3 intermetallics.
Sample D’s Ni and Mn contents were very similar to those of sample B; however, the microstructure was vastly different. Figure 8 and Table 4 show that the solidification range for sample D compared with sample B was ~83 °C smaller. This smaller solidification range and the significantly higher cooling rate resulted in the precipitation of the Al10CeMn2 phase in sample D, but not in sample B. As previously stated, the revised Al-Ce-Mn ternary diagram from Yang et al. [34] shows that the ternary Al10CeMn2 phase transitioned to Al11Ce3 and Al20CeMn2 at 700 °C. The high cooling rates experienced in sample D did not allow enough time for this reaction to occur, trapping the Al10CeMn2 phase in the solid. This phenomenon was also evident in sample C at a cooling rate of 1.21 °C/s. Samples A and B had no Al10CeMn2 in their microstructure, which indicates that, to remove this phase, an Mn content of 0.771 wt.% (or less) or a cooling rate lower than 1.21 °C/s is required.
Sample C showed good agreement in the solidus and liquidus temperatures between the Scheil simulation and DSC results, as shown in Table 4. As sample C had a composition closely resembling the ingot composition, the formation of the primary phases was presented in the DSC results. Therefore, the liquidus temperature (700 °C) could be extracted from the DSC results.
4. Conclusions
This study investigated the solidification kinetics of an Al-Ce alloy with additions of Ni and Mn when cast in a wedge mold configuration. The wedge mold configuration was determined to induce significant directional solidification, leading to large microstructure variations throughout the final cast product. When analyzing the three critical zones of the wedge mold casting via SEM/EDS, DSC Thermal Analysis, and ICP-OES, the following conclusions were drawn:
- The cooling rate and directional solidification drastically affected the formation of the ternary Al-Ce-Mn phases. Cooling rates above 1.21 °C/s did not allow the Al10CeMn2 phase to transition into Al20CeMn2 + Al11Ce3 at 700 °C. Therefore, the Al-Ce-Ni-Mn alloy can have its mechanical properties tailored based on which Al-Ce-Mn ternary phase benefits specific applications.
- Induced directional solidification also significantly impacted the consistency of composition throughout the final cast product. The solidification sequence must be considered when casting these novel alloys, as rapidly solidified areas will lead to hypereutectic compositions in the slower-cooled regions of the casting, as is evident in the ICP-OES results in this study. A hypereutectic composition and large solidification range lead to significant primary blocky Al23Ce4Ni6 and Al11Ce3 phases, which may be desirable or undesirable, depending on the application.
- The Al23Ce4Ni6 phase had a notably higher (~2.6 at.%) Mn solubility than that predicted by the ThermoCalcTM software. The same was true for the solubility of Ni in Al10CeMn2 (3.33 at.%) and Al20CeMn2 (0.32 at.%).
The comprehensive correlations between the solidification cooling rate, directional solidification-induced compositional variances, and the resulting microstructure/phase evolution provide critical insight into how this novel Al alloy can be tailored for different applications in the automotive industry.
Author Contributions
Conceptualization, J.R.K.; methodology, J.R.K. and J.S.; software, J.R.K.; validation, J.R.K. and J.S.; formal analysis, J.R.K.; investigation, J.R.K.; resources, D.S. and D.W.; data curation, J.R.K.; writing—original draft preparation, J.R.K.; writing—review and editing, J.S., D.S. and D.W.; visualization, J.R.K. and J.S.; supervision, D.S. and D.W.; project administration, D.S. and D.W.; funding acquisition, D.S. and D.W. All authors have read and agreed to the published version of the manuscript.
Funding
This work was supported by Eck Industries and the Mitacs International Award (Application Ref. IT23293).
Data Availability Statement
The raw and processed data required to produce these findings are available for download from Mendeley Data “Solidification kinetics of an Al-Ce alloy with additions of Ni and Mn”, https://data.mendeley.com/datasets/nmmvwn9yf4, Accessed April 2023.
Acknowledgments
The authors would like to acknowledge Mark Button and Sudip Shrestha of the UBCO FiLTER laboratory for their contributions to the ICP-OES and SEM data used in this article.
Conflicts of Interest
David Weiss is an employee of Eck Industries Inc. and is one of the inventors of the alloy system.
References
- Castro-Alvarez, A.; Gil, Y.; Llanos, L.; Aravena, D. High performance single-molecule magnets, Orbach or Raman relaxation suppression. Inorg. Chem. Front. 2020, 7, 2478–2486. [Google Scholar] [CrossRef]
- Goll, D.; Kronmüller, H. High-performance permanent magnets. Naturwissenschaften 2000, 87, 423–438. [Google Scholar] [CrossRef] [PubMed]
- Hirosawa, S.; Nishino, M.; Miyashita, S. Perspectives for high-performance permanent magnets: Applications, coercivity, and new materials. Adv. Nat. Sci. Nanosci. Nanotechnol. 2017, 8, 013002. [Google Scholar] [CrossRef]
- Survey, U.S.G. Mineral Commodity Summaries. Available online: https://www.usgs.gov/centers/nmic/mineral-commodity-summaries (accessed on 15 January 2023).
- Sims, Z.C.; Kesler, M.S.; Henderson, H.B.; Castillo, E.; Fishman, T.; Weiss, D.; Singleton, P.; Eggert, R.; McCall, S.K.; Rios, O. How cerium and lanthanum as coproducts promote stable rare earth production and new alloys. J. Sustain. Metall. 2022, 8, 1225–1234. [Google Scholar] [CrossRef]
- Belov, N.A.; Naumova, E.A.; Eskin, D.G. Casting alloys of the Al-Ce-Ni system: Microstructural approach to alloy design. Mater. Sci. Eng. A 1999, 271, 134–142. [Google Scholar] [CrossRef]
- Stroh, J.; Sediako, D.; Weiss, D. Development of cerium-reinforced specialty aluminum alloy with application of X-ray and neutron diffraction. Int. J. Met. 2021, 15, 29–39. [Google Scholar] [CrossRef]
- Aghaie, E.; Stroh, J.; Sediako, D.; Rashidi, A.; Milani, A.S. Improving the mechanical properties of the B319 aluminum alloy by addition of cerium. Mater. Sci. Eng. A 2020, 793, 139899. [Google Scholar] [CrossRef]
- Kozakevich, J.R.; Stroh, J.; Sediako, D.; Weiss, D.; Loukus, A.; Vogel, S.C. Elevated temperature creep and tensile performance of extruded Mg-10Ce alloy. J. Mater. Eng. Perform. 2022, 32, 2758–2765. [Google Scholar] [CrossRef]
- Kozakevich, J.R.; Stroh, J.; Mallouhi, V.; Sediako, D.; Weiss, D. Interplay between cooling rate, microstructure, and mechanical properties of an Al-Ce-Ni-Mn alloy. In Light Metals; Springer: Berlin/Heidelberg, Germany, 2022; pp. 83–89. [Google Scholar] [CrossRef]
- Fodran, E.J. Microstructural Evolution and Thermal Stability of Al-Ce-Ni ternary Eutectic. Ph.D. Thesis, The University of Florida, Gainesville, FL, USA, August 2002. [Google Scholar]
- Weiss, D. Improved high-temperature aluminum alloys containing cerium. J. Mater. Eng. Perform. 2019, 28, 1903–1908. [Google Scholar] [CrossRef]
- Czerwinski, F. Thermal stability of aluminum–cerium binary alloys containing the Al–Al11Ce3 eutectic. Mater. Sci. Eng. A 2021, 809, 140973. [Google Scholar] [CrossRef]
- Kozakevich, J.R. Development and Characterization of A Novel Near-Eutectic Al-Ce Alloy with Additions of Ni and Mn for Elevated Temperature Applications in the Automotive Industry. Master’s Thesis, The University of British Columbia, Kelowna, BC, Canada, December 2022. [Google Scholar]
- Stroh, J. Development of Orecipitation-Strengthened Aluminum Alloys and Manufacturing Processes for Next Generation Automotive Powertrains. Ph.D. Thesis, The University of British Columbia, Kelwona, BC, Canada, April 2021. [Google Scholar]
- Sims, Z.C.; Rios, O.R.; Weiss, D.; Turchi, P.E.; Perron, A.; Lee, J.R.; Li, T.T.; Hammons, J.A.; Bagge-Hansen, M.; Willey, T.M.; et al. High performance aluminum-cerium alloys for high-temperature applications. Mater. Horiz. 2017, 4, 1070–1078. [Google Scholar] [CrossRef]
- Stroh, J.; Sediako, D.; Weiss, D.; Peterson, V.K. In situ neutron diffraction solidification analyses of rare earth reinforced hypoeutectic and hypereutectic aluminum-silicon alloys. In Light Metals 2020; Springer: Berlin/Heidelberg, Germany, 2020; pp. 174–178. [Google Scholar] [CrossRef]
- Aniolek, M.; Smith, T.; Czerwinski, F. Combining differential scanning calorimetry and cooling- heating curve thermal analysis to study the melting and solidification behavior of al-ce binary alloys. Metals 2021, 11, 372. [Google Scholar] [CrossRef]
- Czerwinski, F.; Amirkhiz, B.S. On the Al-Al11Ce3 eutectic transformation in aluminum-cerium binary alloys. Materials 2020, 13, 4549. [Google Scholar] [CrossRef] [PubMed]
- Czerwinski, F. A search for the eutectic system of high-temperature cast aluminum alloys. Mater. Sci. Technol. 2021, 37, 683–692. [Google Scholar] [CrossRef]
- Sims, Z.C.; Weiss, D.; McCall, S.K.; McGuire, M.A.; Ott, R.T.; Geer, T.; Rios, O.; Turchi, P.A.E. Cerium-based, intermetallic-strengthened aluminum casting alloy: High-volume co-product development. J. Miner. Met. Mater. Soc. 2016, 68, 1940–1947. [Google Scholar] [CrossRef]
- Czerwinski, F. Thermal stability of aluminum alloys. Materials 2020, 13, 3441. [Google Scholar] [CrossRef]
- Weiss, D.; Rios, O.; Sims, Z.C.; Mccall, S.; Ott, R. Casting characteristics of high cerium content aluminum alloys. In Light Metals; Springer: Berlin/Heidelberg, Germany, 2017; pp. 205–211. [Google Scholar]
- Nguyen, R.T.; Imholte, D.D.; Rios, O.R.; Weiss, D.; Sims, Z.; Stromme, E.; McCall, S.K. Anticipating impacts of introducing aluminum-cerium alloys into the United States automotive market. Resour. Conserv. Recycl. 2019, 144, 340–349. [Google Scholar] [CrossRef]
- Salonitis, K.; Jolly, M.; Pagone, E.; Papanikolaou, M. Life-cycle and energy assessment of automotive component manufacturing: The dilemma between aluminum and cast iron. Energies 2019, 12, 2557. [Google Scholar] [CrossRef]
- Kozakevich, J.R.; Stroh, J.; Sediako, D.; Weiss, D. DSC thermal analysis of a near eutectic Al-Ce alloy with additions of Ni and Mn. COM Light Met. 2023, in press. [Google Scholar]
- ASTM(2017); Standard Guide for Preparation of Metallographic Specimens. ASTM International: West Conshohocken, PA, USA, 2017. [CrossRef]
- Vandersluis, E.; Ravindran, R. Comparison of measurement methods for secondary dendrite arm spacing. Metallogr. Microstruct. Anal. 2017, 6, 89–94. [Google Scholar] [CrossRef]
- Zhang, H.; Zhang, C.; Zhang, L.; Zhai, F.; Tian, J. Effect of Cu on the microstructure and the property of Al-Ce-Ni-Cu amorphous nano-composite materials. Adv. Mater. Res. 2013, 624, 248–251. [Google Scholar] [CrossRef]
- Haghdadi, H.; Phillion, A.B.; Maijer, D.M. Microstructure characterization and thermal analysis of aluminum alloy B206 during solidification. Metall. Mater. Trans. A Phys. Metall. Mater. Sci. 2015, 46, 2073–2081. [Google Scholar] [CrossRef]
- Boettinger, W.J.; Kattner, U.R.; Moon, K.W.; Perepezko, J.H. DTA and heat-flux DSC measurements of alloy melting and freezing. In Methods for Phase Diagram Determination; Zhao, J.C., Ed.; Elsevier Ltd.: Amsterdam, The Netherlands, 2007; pp. 151–221. [Google Scholar] [CrossRef]
- ASTM (2015) E794-06; Standard Test Method for Melting and Crystallization Temperatures by Thermal. ASTM International: West Conshohocken, PA, USA, 2015. [CrossRef]
- Gout, D.; Benbow, E.; Gourdon, O.; Miller, G.J. Crystallographic, electronic and magnetic studies of Ce4Ni 6Al23: A new ternary intermetallic compound in the cerium-nickel-aluminum phase diagram. J. Solid State Chem. 2003, 174, 471–481. [Google Scholar] [CrossRef]
- Yang, Y.; Bahl, S.; Sisco, K.; Lance, M.; Shin, D.; Shyam, A.; Plotkowski, A.; Dehoff, R.R. Primary solidification of ternary compounds in Al-rich Al–Ce–Mn alloys. J. Alloys Compd. 2020, 844, 156048. [Google Scholar] [CrossRef]
- Coury, F.G.; Kiminami, C.S.; Botta, W.J.; Bolfarini, C.; Kaufman, M.J. Design and production of Al-Mn-Ce alloys with tailored properties. Mater. Des. 2016, 110, 436–448. [Google Scholar] [CrossRef]
- Gordillo, M.A.; Cernatescu, I.; Aindow, T.T.; Watson, T.J.; Aindow, M. Phase stability in a powder-processed Al-Mn-Ce alloy. J. Mater. Sci. 2014, 49, 3742–3754. [Google Scholar] [CrossRef]
- Liu, X.J.; Ohnuma, J.; Kainuma, R.; Ishida, K. Thermodynamic assessment of the Aluminum-Manganese (Al-Mn) binary phase diagram. J. Phase Equilibria 1999, 20, 45–56. [Google Scholar] [CrossRef]
- Mondolfo, L.F. Al–Mn Aluminum–Manganese system. In Aluminum Alloys: Structures and Properties; Butterworth-Heinemann: Oxford, UK, 1976; pp. 324–329. [Google Scholar] [CrossRef]
- Mondolfo, L.F. Al–Ce–Mn Aluminum–Cerium–Manganese system. In Aluminum Alloys: Structures and Properties; Butterworth-Heinemann: Oxford, UK, 1976; pp. 470–471. [Google Scholar] [CrossRef]
- Okamoto, H. Al-Ce (Aluminum-Cerium). J. Phase Equilibria Diffus. 2011, 32, 392–393. [Google Scholar] [CrossRef]
- Tang, C.; Du, Y.; Zhou, H. The phase equilibria of the Al-Ce-Ni system at 500 °C. J. Alloys Compd. 2009, 470, 222–227. [Google Scholar] [CrossRef]
- Tang, C.; Du, Y.; Xu, H.H.; Xiong, W.; Zhang, L.J.; Zheng, F.; Zhou, H.Y. Experimental investigation of the Al-Ce-Ni system at 800 °C. Intermetallics 2008, 16, 432–439. [Google Scholar] [CrossRef]
- Raghavan, V. Al-Ce-Ni (Aluminum-Cerium-Nickel). J. Phase Equilibria Diffus. 2009, 30, 265–267. [Google Scholar] [CrossRef]
- Tang, C.; Du, Y.; Wang, J.; Zhou, H.; Zhang, L.; Zheng, F.; Lee, J.; Yao, Q. Correlation between thermodynamics and glass forming ability in the Al-Ce-Ni system. Intermetallics 2010, 18, 900–906. [Google Scholar] [CrossRef]


Disclaimer/Publisher’s Note: The statements, opinions and data contained in all publications are solely those of the individual author(s) and contributor(s) and not of MDPI and/or the editor(s). MDPI and/or the editor(s) disclaim responsibility for any injury to people or property resulting from any ideas, methods, instructions or products referred to in the content. |
© 2023 by the authors. Licensee MDPI, Basel, Switzerland. This article is an open access article distributed under the terms and conditions of the Creative Commons Attribution (CC BY) license (https://creativecommons.org/licenses/by/4.0/).