
Production and Functional Properties of Graded Al-Based Syntactic Metal Foams


Abstract
1. Introduction
2. Materials and Methods
2.1. Materials
2.2. Production
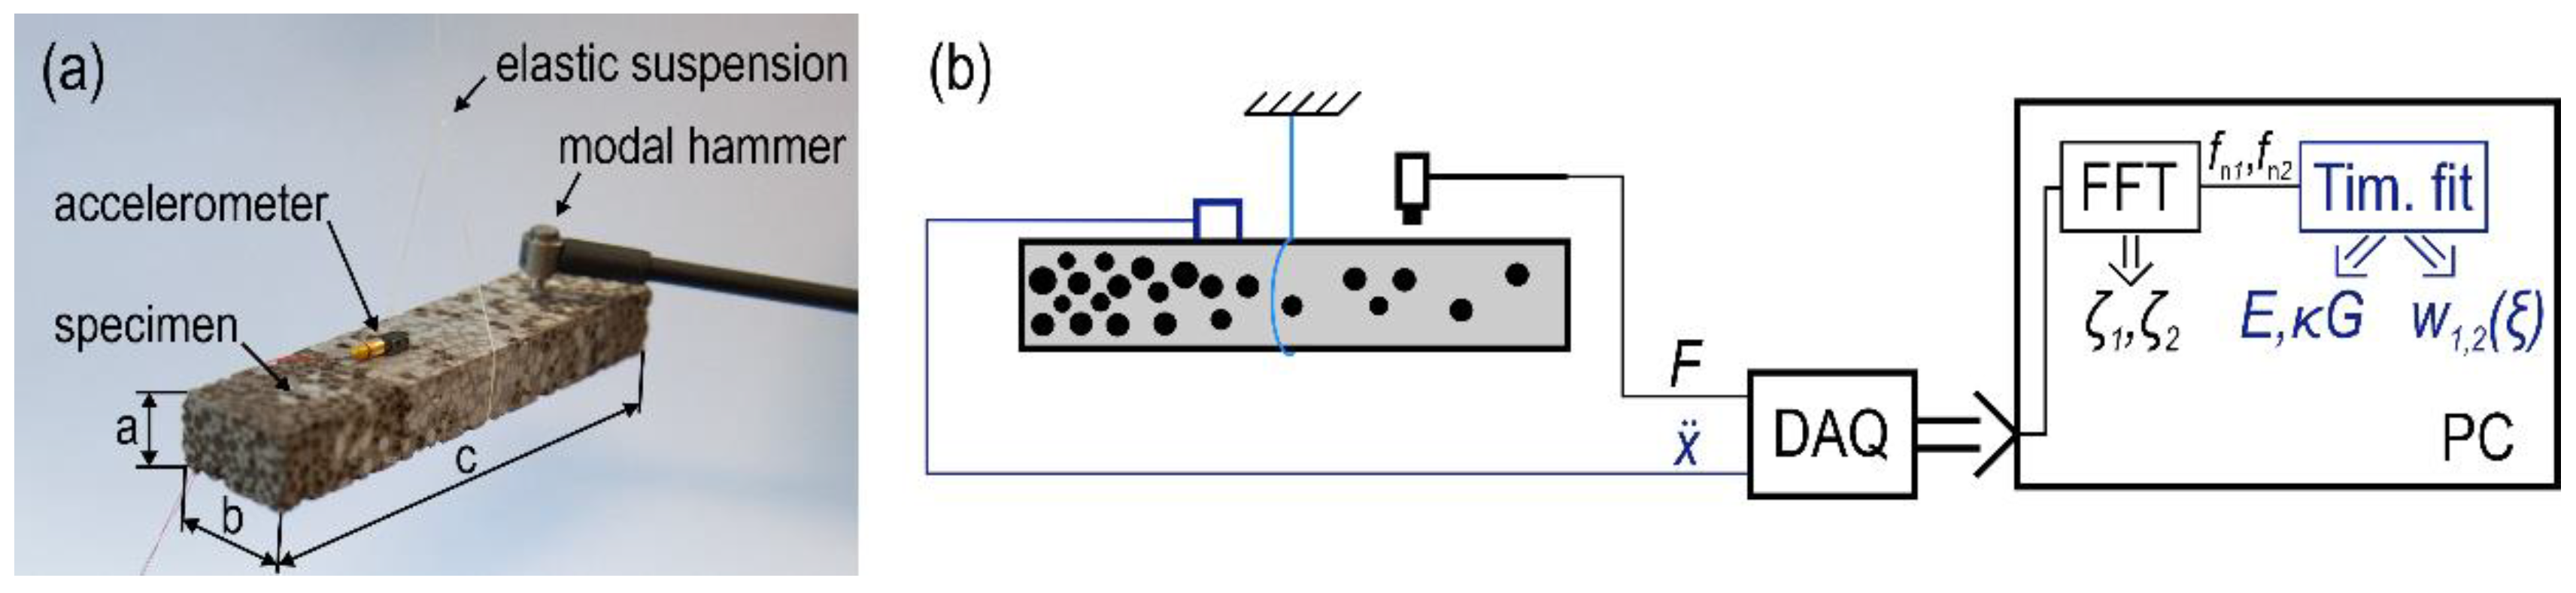
2.3. Methods
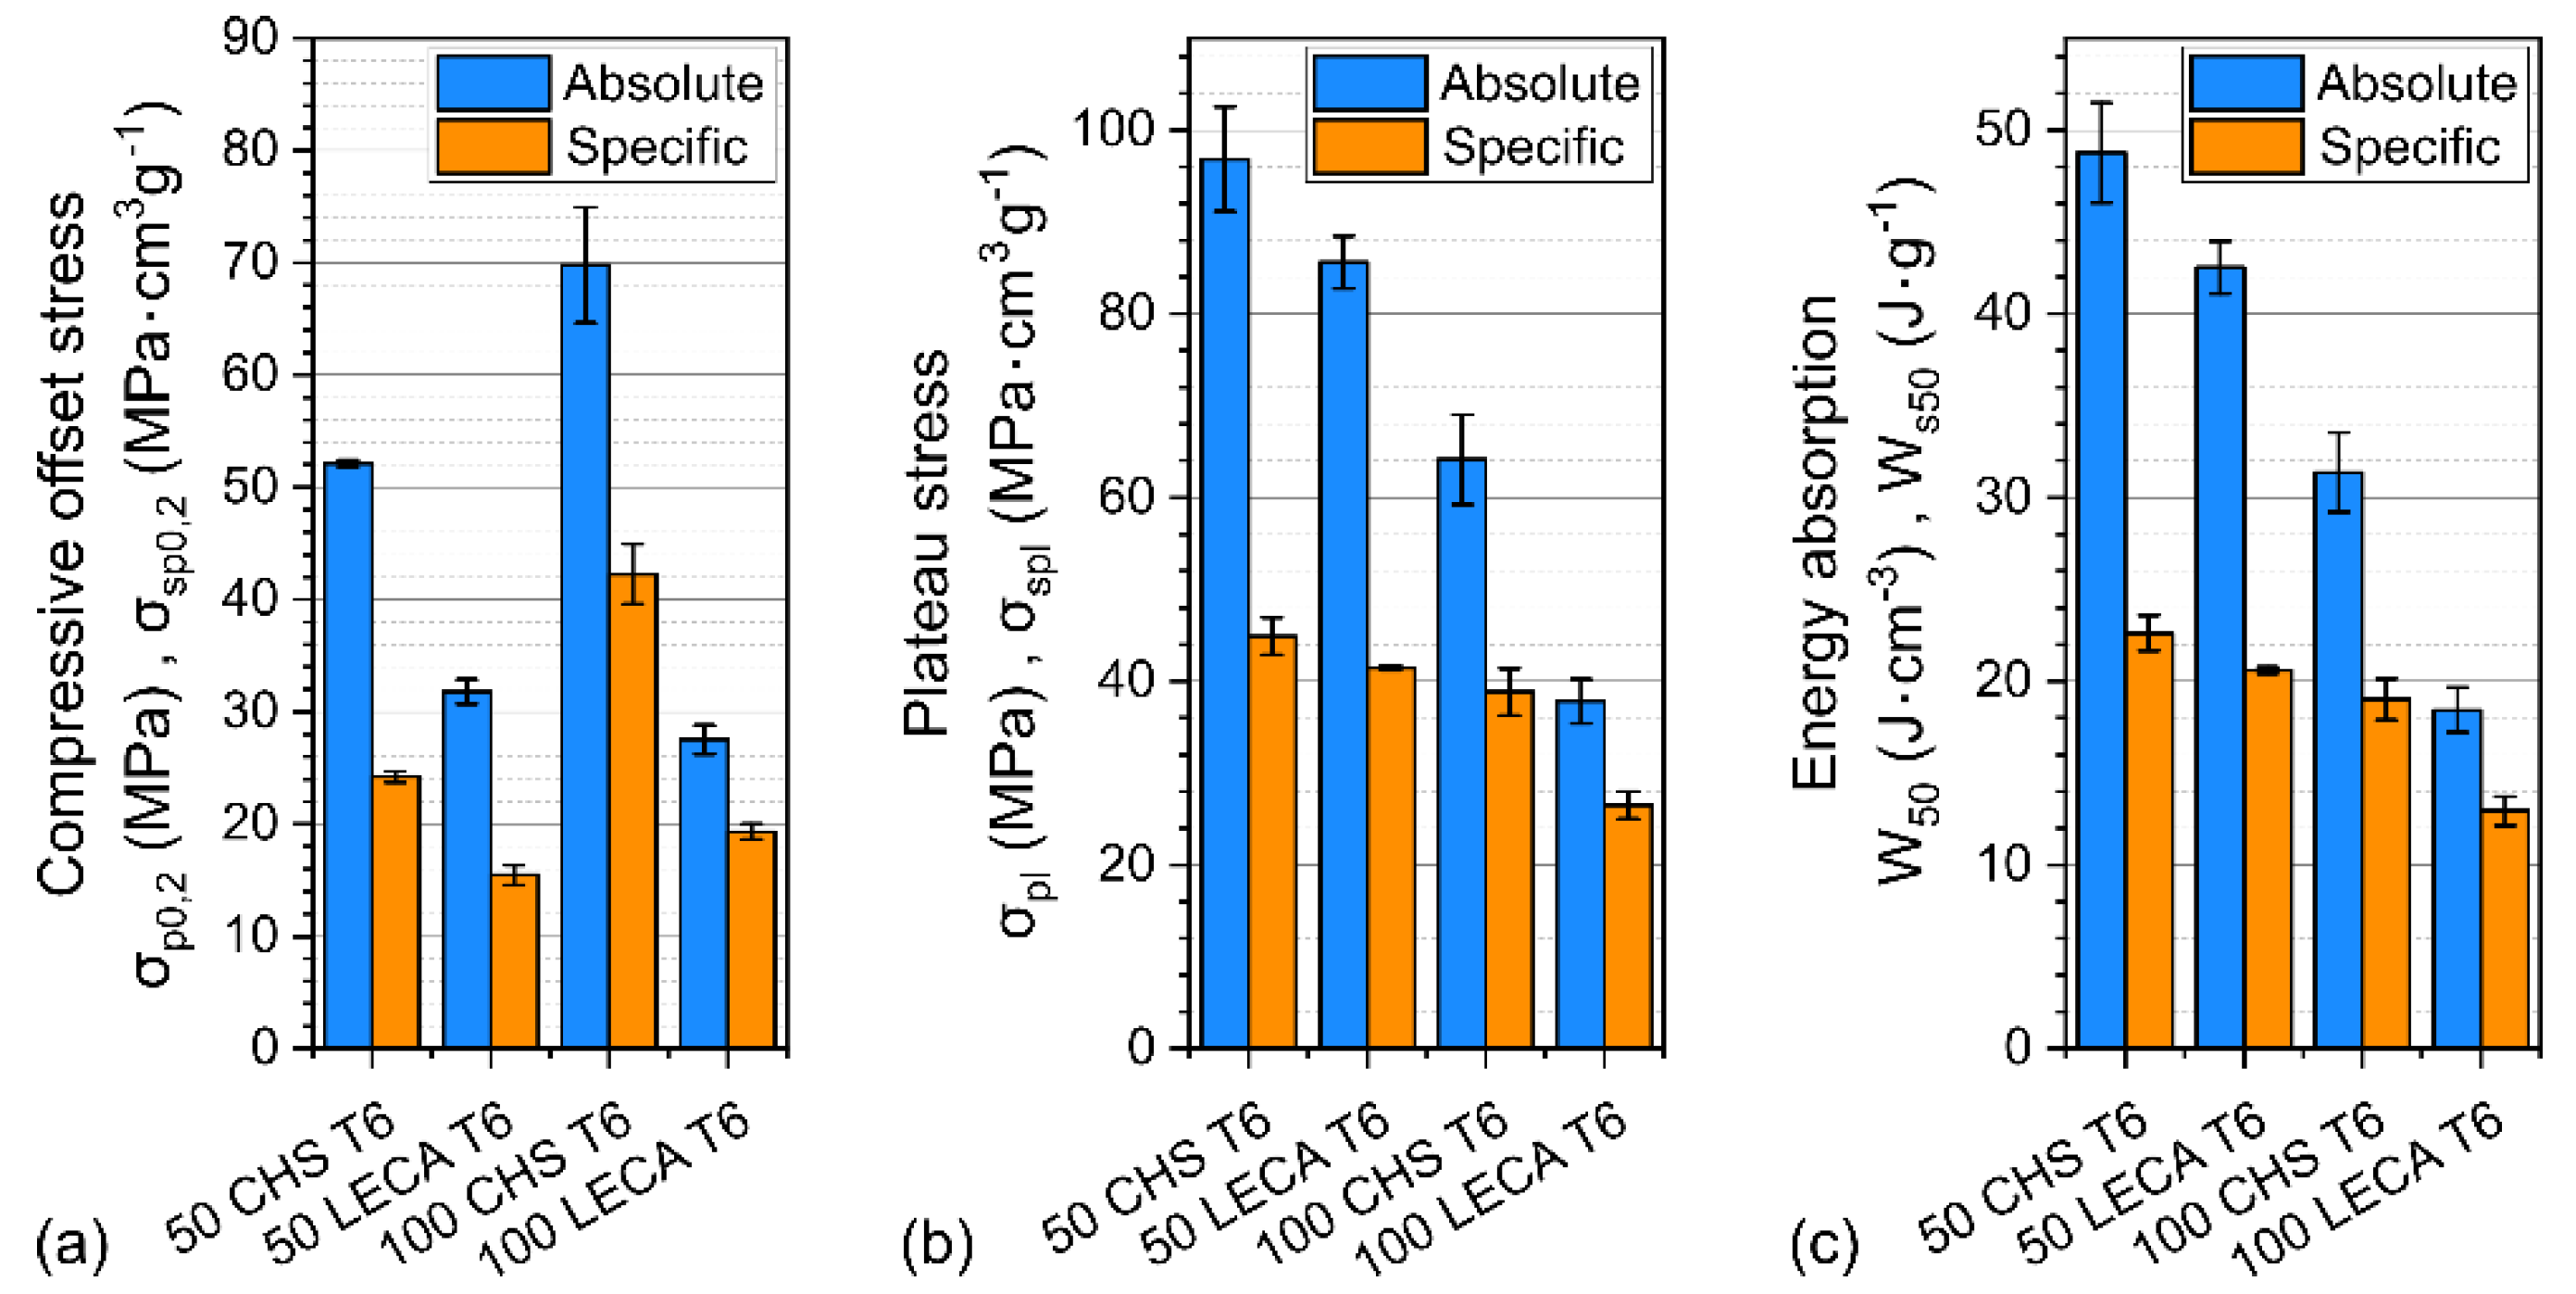
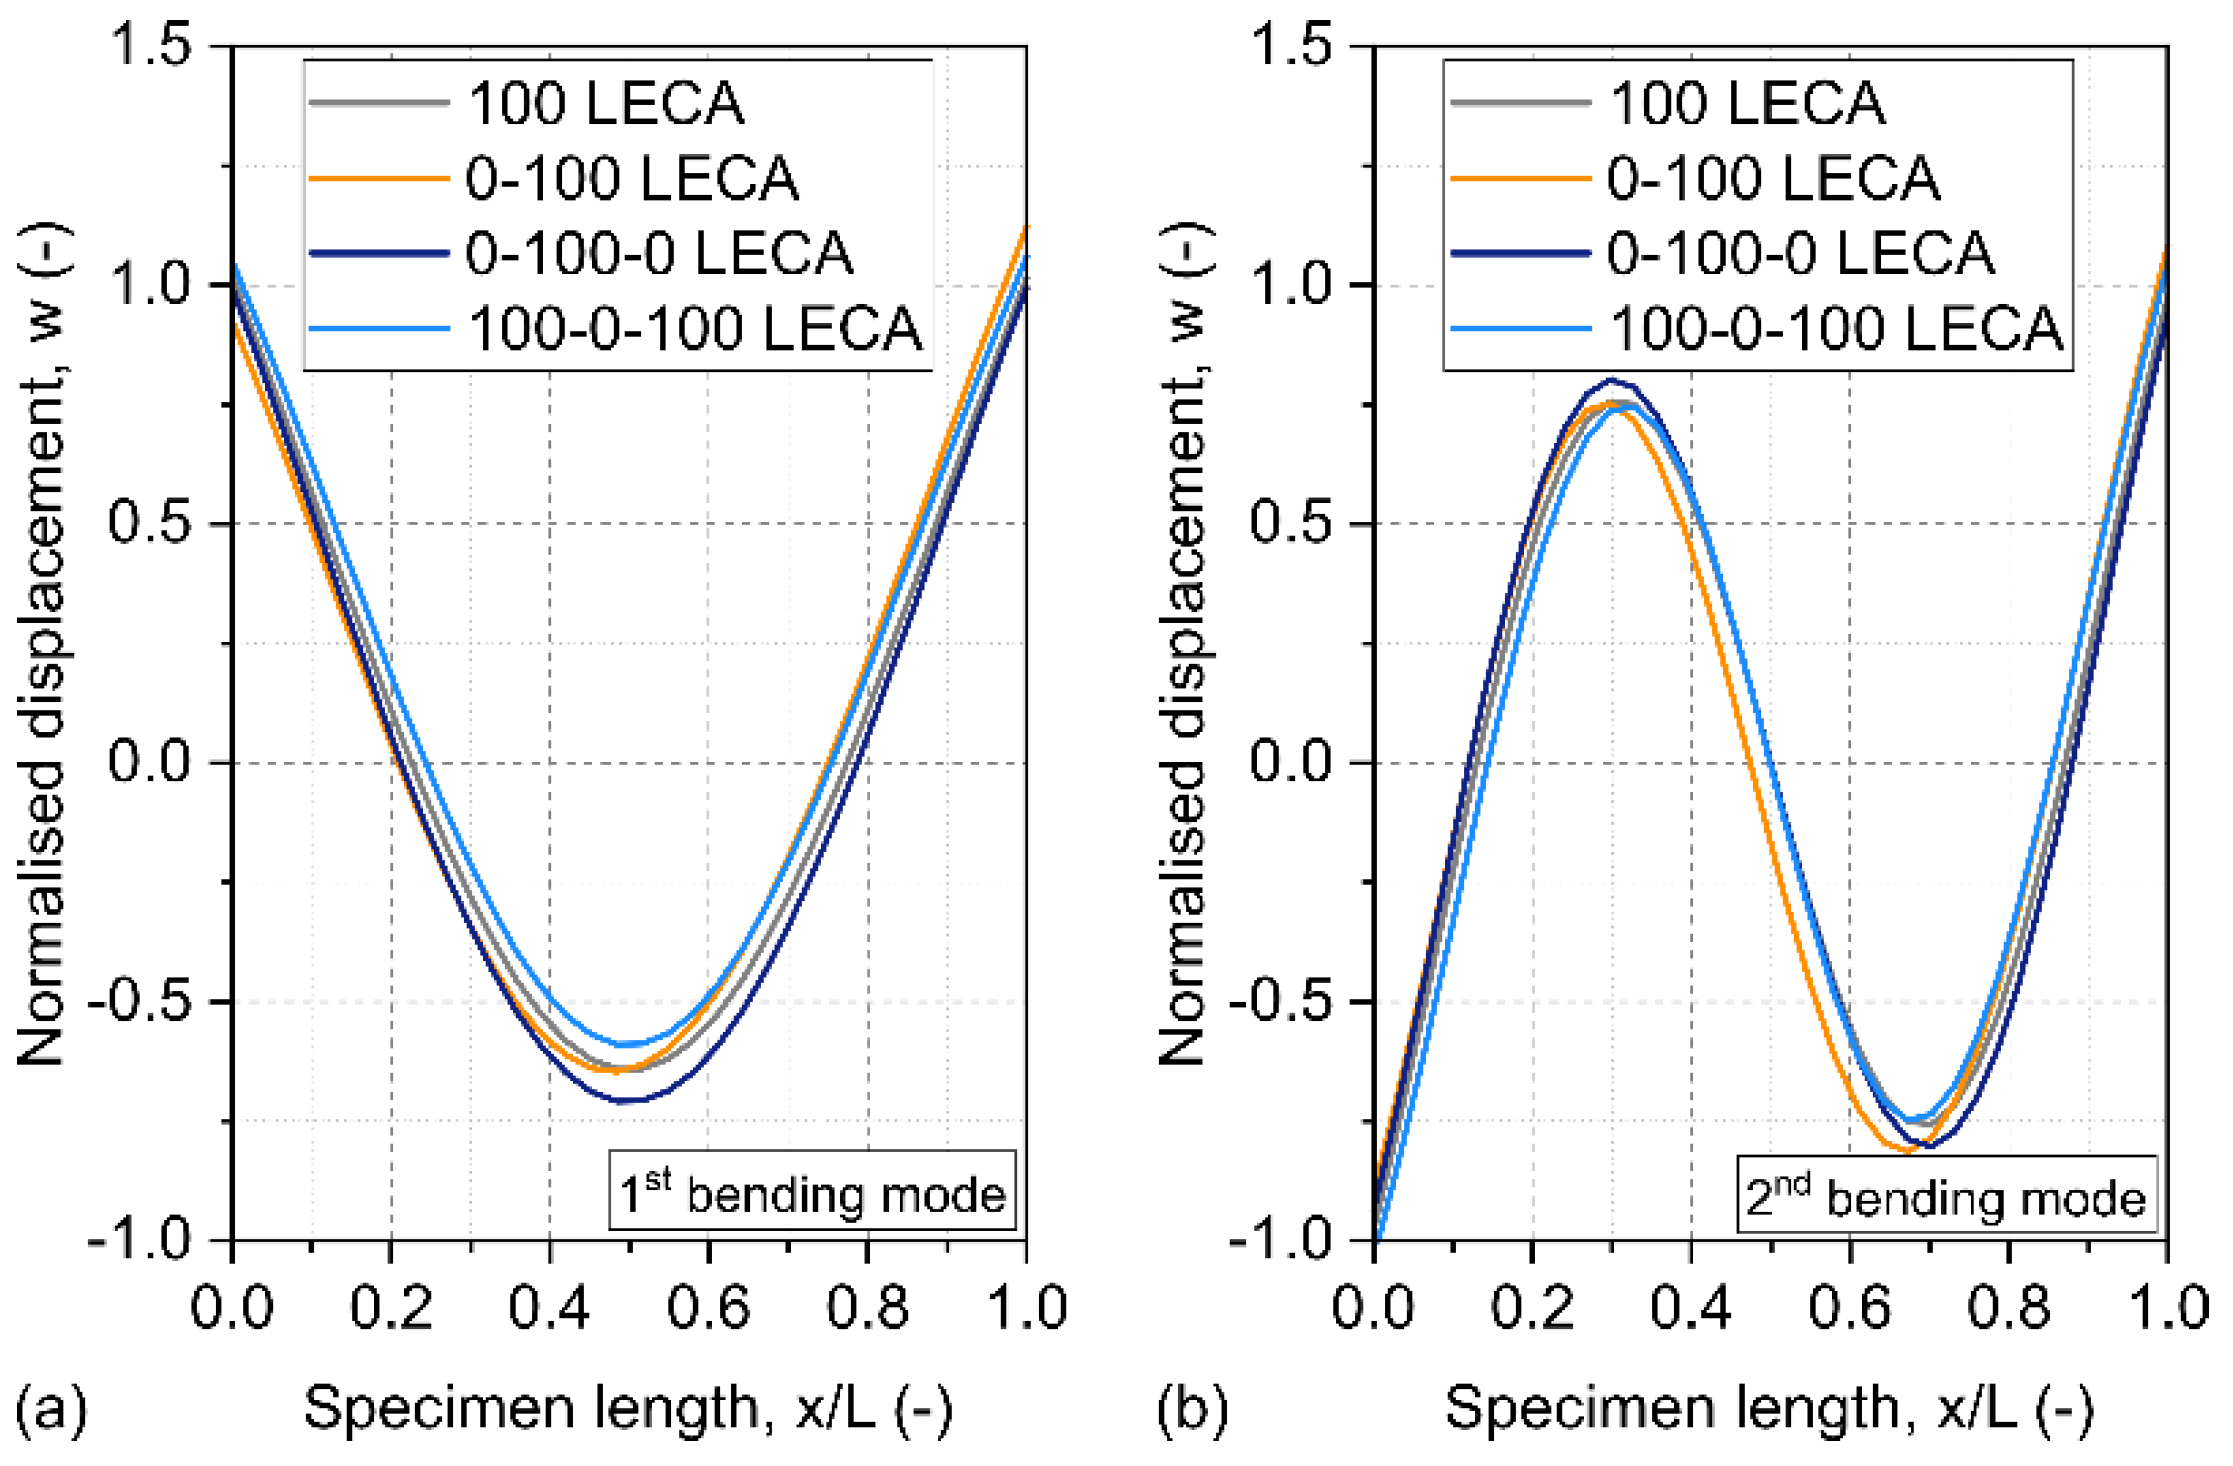
3. Results and Discussion
4. Conclusions
Author Contributions
Funding
Data Availability Statement
Conflicts of Interest
References
- Hangai, Y.; Takahashi, K.; Yamaguchi, R.; Utsunomiya, T.; Kitahara, S.; Kuwazuru, O.; Yoshikawa, N. Nondestructive observation of pore structure deformation behavior of functionally graded aluminum foam by X-ray computed tomography. Mater. Sci. Eng. A 2012, 556, 678–684. [Google Scholar] [CrossRef]
- Zhang, Y.; Zang, X.-Y.; Wang, K.; He, S.-Y.; Liu, J.-G.; Zhao, W.; Gong, X.-L.; Yu, J. Fabrication of functionally radial graded metallic foam. Mater. Lett. 2020, 264, 127292. [Google Scholar] [CrossRef]
- Movahedi, N.; Conway, S.; Belova, I.V.; Murch, G.E.; Fiedler, T. Influence of particle arrangement on the compression of functionally graded metal syntactic foams. Mater. Sci. Eng. A 2019, 764, 138242. [Google Scholar] [CrossRef]
- Movahedi, N.; Murch, G.E.; Belova, I.V.; Fiedler, T. Functionally graded metal syntactic foam: Fabrication and mechanical properties. Mater. Des. 2019, 168, 107652. [Google Scholar] [CrossRef]
- Salehi, M.; Mirbagheri, S.M.H.; Ramiani, A.J. Efficient energy absorption of functionally-graded metallic foam-filled tubes under impact loading. Trans. Nonferrous Met. Soc. China (Eng. Ed.) 2021, 31, 92–110. [Google Scholar] [CrossRef]
- Huang, W.; Liu, G.; Li, H.; Wang, F.; Wang, Y. Compressive properties and failure mechanisms of gradient aluminum foams prepared by a powder metallurgy method. Metals 2021, 11, 1337. [Google Scholar] [CrossRef]
- Wang, X.H.; Li, J.S.; Hu, R.; Kou, H.C.; Zhou, L. Mechanical properties of porous titanium with different distributions of pore size. Trans. Nonferrous Met. Soc. China (Eng. Ed.) 2013, 23, 2317–2322. [Google Scholar] [CrossRef]
- Rahmani, M.; Petrudi, A.M. Optimization and experimental investigation of the ability of new material from aluminum casting on pumice particles to reduce shock wave. Period. Polytech. Mech. Eng. 2020, 64, 224–232. [Google Scholar] [CrossRef]
- Bekoz, N.; Oktay, E. Mechanical properties of low alloy steel foams: Dependency on porosity and pore size. Mater. Sci. Eng. A 2013, 576, 82–90. [Google Scholar] [CrossRef]
- Naeem, M.A.; Gábora, A.; Mankovits, T. Influence of the manufacturing parameters on the compressive properties of closed cell aluminum foams. Period. Polytech. Mech. Eng. 2020, 64, 172–178. [Google Scholar] [CrossRef]
- Yi, Z.; Si-Yuan, H.; Jia-Gui, L.; Wei, Z.; Xiao-Lu, G.; Jin, Y. Density gradient tailoring of aluminum foam-filled tube. Compos. Struct. 2019, 220, 451–459. [Google Scholar] [CrossRef]
- Timoshenko, S.P. LXVI. On the Correction for Shear of the Differential Equation for Transverse Vibrations of Prismatic Bars. Lond. Edinb. Dublin Philos. Mag. J. Sci. 1921, 41, 744–746. [Google Scholar] [CrossRef]
- Van Rensburg, N.F.J.; van der Merwe, A.J. Natural frequencies and modes of a Timoshenko beam. Wave Motion 2006, 44, 58–69. [Google Scholar] [CrossRef]
- Albertelli, P.; Esposito, S.; Mussi, V.; Goletti, M.; Monno, M. Effect of metal foam on vibration damping and its modelling. Int. J. Adv. Manuf. Technol. 2021, 117, 2349–2358. [Google Scholar] [CrossRef]
- Banhart, J.; Baumeister, J.; Weber, M. Damping properties of aluminium foams. Mater. Sci. Eng. A 1996, 205, 221–228. [Google Scholar] [CrossRef]
- Kádár, C.; Szlancsik, A.; Dombóvári, Z.; Orbulov, I.N. Monitoring the failure states of a metal matrix syntactic foam by modal analysis. Mater. Lett. 2019, 257, 126733. [Google Scholar] [CrossRef]
- Geist, B.; McLaughlin, J.R. Asymptotic Formulas for the Eigenvalues of the Timoshenko Beam. J. Math. Anal. Appl. 2001, 253, 341–380. [Google Scholar] [CrossRef][Green Version]
- Trefethen, L.N. 6. Chebyshev Differentiation Matrices. In Spectral Methods in MATLAB; Society of Industrial and Applied Mathematics: Philadelphia, PA, USA, 2000; pp. 51–59. [Google Scholar]


| Material Properties | Tensile Strength Rm (MPa) | Proof Stress Rp0.2 (MPa) | Modulus of Elasticity E (GPa) | Strain A (%) | Melting Range T (°C) | Density ρ (g∙cm−3) | |||||||||
| Al99.5 | 60 | 20 | 69 | 25 | 645–658 | 2.7 | |||||||||
| AlSi10MnMg | 279 | 133 | 78 | 8.1 | 550–590 | 2.64 | |||||||||
| Chemical Composition | Si (wt.%) | Mg (wt.%) | Fe (wt.%) | Cu (wt.%) | Mn (wt.%) | Zn (wt.%) | Ti (wt.%) | Cr (wt.%) | Al (wt.%) | ||||||
| Al99.5 | max. 0.25 | max. 0.005 | max. 0.4 | max. 0.05 | max. 0.05 | max. 0.07 | max. 0.05 | - | Bal | ||||||
| AlSi10MnMg | 10.50–13.00 | - | 0.45–0.90 | max. 0.08 | max. 0.55 | max. 0.15 | max. 0.15 | - | Bal | ||||||
| Id | Volume Ratio of Filler Material in the Mixture (%) | ||||||
|---|---|---|---|---|---|---|---|
| Layer 1 | Layer 2 | Layer 3 | Layer 4 | Layer 5 | Layer 6 | Layer 7 | |
| 0-100 LECA | - | 20 | 40 | 60 | 80 | 100 | - |
| 0-100-0 LECA | 0 | 33 | 67 | 100 | 67 | 33 | 0 |
| 100-0-100 LECA | 100 | 67 | 33 | 0 | 33 | 67 | 100 |
| 100 LECA | 100 | ||||||
| 50 LECA | 50 | ||||||
| 100 CHS | 100 | ||||||
| 50 CHS | 50 | ||||||
| Id | a (mm) | b (mm) | c (mm) | m (g) |
|---|---|---|---|---|
| 100 LECA | 16.00 | 24.28 | 109.72 | 62.4839 |
| 0-100 LECA | 14.95 | 24.87 | 110.38 | 75.6855 |
| 0-100-0 LECA | 15.00 | 24.97 | 109.95 | 87.2848 |
| 100-0-100 LECA | 14.85 | 24.90 | 109.92 | 81.9114 |
| 50 LECA | 15.03 | 25.01 | 109.64 | 82.5562 |
| 100 CHS | 14.71 | 25.18 | 111.47 | 72.4299 |
| 50 CHS | 14.97 | 24.92 | 111.03 | 91.6829 |
| Id | Without Heat Treatment | After Heat Treatment | ||||||
|---|---|---|---|---|---|---|---|---|
(Hz) | (-) | (MPa) | (MPa) | (Hz) | (-) | (MPa) | (MPa) | |
| 100 LECA | 6374.35 | 0.0061 | 18.89 | 5.03 | 6461.69 | 0.0050 | 19.07 | 5.96 |
| 14,320.07 | 0.0032 | 14,734.54 | 0.0023 | |||||
| 0-100 LECA | 5312.50 | 0.0073 | 20.36 (20.71) | 3.06 (3.06) | 5343.33 | 0.0048 | 19.15 (19.47) | 4.38 (4.36) |
| 11,065.19 | 0.0042 | 11,733.33 | 0.0012 | |||||
| 0-100-0 LECA | 5803.09 | 0.0039 | 22.50 (21.38) | 8.91 (9.62) | 5646.67 | 0.0034 | 21.83 (20.74) | 6.69 (7.10) |
| 13,531.59 | 0.0033 | 12,900.00 | 0.0029 | |||||
| 100-0-100 LECA | 6670.03 | 0.0055 | 29.62 (32.72) | 5.08 (4.85) | 6373.33 | 0.0053 | 26.11 (28.80) | 5.46 (5.16) |
| 13,874.33 | 0.0026 | 13,600.00 | 0.0018 | |||||
| 50 LECA | 5386.42 | 0.0076 | 17.17 | 5.68 | 5630.00 | 0.0034 | 18.12 | 9.00 |
| 12,254.70 | 0.0045 | 13,200.00 | 0.0022 | |||||
| 50 CHS | 6764.11 | 0.0031 | 27.42 | 17.54 | 6493.33 | 0.0042 | 28.97 | 9.60 |
| 15,440.19 | 0.0034 | 14,833.33 | 0.0017 | |||||
| 100 CHS | 8316.53 | 0.0033 | 47.103 | 16.0259 | 9102.82 | 0.0034 | 45.48 | 13.76 |
| 19,250.67 | 0.0031 | 20,668.68 | 0.0031 | |||||
Publisher’s Note: MDPI stays neutral with regard to jurisdictional claims in published maps and institutional affiliations. |
© 2022 by the authors. Licensee MDPI, Basel, Switzerland. This article is an open access article distributed under the terms and conditions of the Creative Commons Attribution (CC BY) license (https://creativecommons.org/licenses/by/4.0/).
Share and Cite
Károly, D.; Iklódi, Z.; Kemény, A.; Kincses, D.B.; Orbulov, I.N. Production and Functional Properties of Graded Al-Based Syntactic Metal Foams. Metals 2022, 12, 263. https://doi.org/10.3390/met12020263
Károly D, Iklódi Z, Kemény A, Kincses DB, Orbulov IN. Production and Functional Properties of Graded Al-Based Syntactic Metal Foams. Metals. 2022; 12(2):263. https://doi.org/10.3390/met12020263
Chicago/Turabian StyleKároly, Dóra, Zsolt Iklódi, Alexandra Kemény, Domonkos B. Kincses, and Imre N. Orbulov. 2022. "Production and Functional Properties of Graded Al-Based Syntactic Metal Foams" Metals 12, no. 2: 263. https://doi.org/10.3390/met12020263
APA StyleKároly, D., Iklódi, Z., Kemény, A., Kincses, D. B., & Orbulov, I. N. (2022). Production and Functional Properties of Graded Al-Based Syntactic Metal Foams. Metals, 12(2), 263. https://doi.org/10.3390/met12020263