
Determination of the Activation Energy for Hydride Decomposition Using a Sieverts-Type Apparatus and the Kissinger Equation


Abstract
:1. Introduction
2. Materials and Methods
3. Results and Discussion
4. Conclusions
Author Contributions
Funding
Institutional Review Board Statement
Informed Consent Statement
Data Availability Statement
Conflicts of Interest
References
- Zhao-Karger, Z.; Hu, J.; Roth, A.; Wang, D.; Kubel, C.; Lohstroh, W.; Fichtner, M. Altered thermodynamic and kinetic properties of MgH2 infiltrated in microporous scaffold. Chem. Commun. 2010, 46, 8353–8355. [Google Scholar] [CrossRef] [PubMed] [Green Version]
- Sabitu, S.T.; Goudy, A.J. Dehydrogenation kinetics and modeling studies of MgH2 enhanced by transition metal oxide catalysts using constant pressure thermodynamic driving forces. Metals 2012, 2, 219–228. [Google Scholar] [CrossRef] [Green Version]
- Figen, A.K.; Coskuner, B.; Piskin, S. Hydrogen desorption kinetics of MgH2 synthesized from modified waste magnesium. Mater. Sci. 2014, 32, 385–390. [Google Scholar] [CrossRef] [Green Version]
- Xiao, X.; Liu, Z.; Yarahmadi, S.S.; Gregorya, D.H. Facile preparation of β-/γ-MgH2 nanocomposites under mild conditions and pathways to rapid dehydrogenation. Phys. Chem. Chem. Phys. 2016, 18, 10492–10498. [Google Scholar] [CrossRef] [PubMed] [Green Version]
- Mustafa, N.S.; Juahir, N.; Halim Yap, F.A.; Ismail, M. Enhanced hydrogen storage properties of MgH2 by the addition of PdCl2 Catalyst. Int. J. Electroact. Mater. 2016, 4, 1–7. Available online: https://www.researchgate.net/publication/293820495_Enhanced_Hydrogen_Storage_Properties_of_MgH_2_by_The_Addition_of_PdCl_2_Catalyst (accessed on 31 December 2021).
- Blainea, R.L.; Kissinger, H.E. Homer Kissinger and the Kissinger equation. Thermochim. Acta 2012, 540, 1–6. [Google Scholar] [CrossRef]
- Bobet, J.-L.; Akiba, E.; Darriet, B. Study of Mg-M (M=Co, Ni and Fe) mixture elaborated by reactive mechanical alloying: Hydrogen sorption properties. Int. J. Hydrog. Energy 2001, 26, 493–501. [Google Scholar] [CrossRef]
- Santos, S.F.; Ishikawa, T.T.; Botta, W.J.; Huot, J. MgH2 + FeNb nanocomposites for hydrogen storage. Mater. Chem. Phys. 2014, 147, 557–562. [Google Scholar] [CrossRef]
- Asselli, A.A.C.; Santos, S.F.; Huot, J. Hydrogen storage in filed magnesium. J. Alloys Compd. 2016, 687, 586–594. [Google Scholar] [CrossRef]
- Bobet, J.-L.; Akiba, E.; Nakamura, Y.; Darriet, B. Study of Mg-M (M=Co, Ni and Fe) mixture elaborated by reactive mechanical alloying-hydrogen sorption properties. Int. J. Hydrog. Energy 2000, 25, 987–996. [Google Scholar] [CrossRef]
- Song, M.Y.; Kwak, Y.J.; Lee, S.H.; Park, H.R. Enhancement of hydrogen storage characteristics of Mg by addition of nickel and niobium (V) fluoride via mechanical alloying. Korean J. Met. Mater. 2016, 54, 210–216. [Google Scholar] [CrossRef]
- Song, M.Y.; Ivanov, E.I.; Darriet, B.; Pezat, M.; Hagenmuller, P. Hydriding properties of a mechanically alloyed mixture with a composition Mg2Ni. Int. J. Hydrog. Energy 1985, 10, 169–178. [Google Scholar] [CrossRef]
- Song, M.Y.; Choi, E.; Kwak, Y.J. Preparation of a Mg-based alloy with a high hydrogen-storage capacity by adding a polymer CMC via milling in a hydrogen atmosphere. Int. J. Hydrog. Energy 2019, 44, 3779–3789. [Google Scholar] [CrossRef]
- Song, M.Y.; Choi, E.; Kwak, Y.J. Increase in the dehydrogenation rate of Mg-CMC (Carboxymethylcellulose, Sodium Salt) by adding Ni via hydride-forming milling. Met. Mater. Int. 2019, 25, 516–527. [Google Scholar] [CrossRef]
- Song, M.Y.; Choi, E.; Kwak, Y.J. Nickel, graphene, and yttria-stabilized zirconia (YSZ)-added Mg by grinding in hydrogen atmosphere for hydrogen storage. Metals 2019, 9, 1347. [Google Scholar] [CrossRef] [Green Version]
- Campostrini, R.; Abdellatief, M.; Leoni, M.; Scardi, P. Activation energy in the thermal decomposition of MgH2 powders by coupled TG–MS measurements. J. Therm. Anal. Calorim. 2014, 116, 225–240. [Google Scholar] [CrossRef]
- Vyazovkin, S. Kissinger method in kinetics of materials: Things to beware and be aware of. Molecules 2014, 25, 2813. [Google Scholar] [CrossRef] [PubMed]
- Kissinger, H.E. Variation of peak temperature with heating rate in differential thermal analysis. J. Res. Natl. Bur. Stand. 1956, 4, 217–221. [Google Scholar] [CrossRef]
- Han, J.S.; Pezat, M.; Lee, J.-Y. Thermal desorption of hydrogen from magnesium hydride. Scr. Metall. 1986, 20, 951–956. [Google Scholar] [CrossRef]
- Han, J.S.; Pezat, M.; Lee, J.-Y. A study of the decomposition of magnesium hydride by thermal analysis. J. Less-Common Met. 1987, 130, 195–402. [Google Scholar] [CrossRef]


| Heating Rate Φ (K/min) | Onset Time (s) | Onset Temperature (K) | tm (s) | Tm (K) |
|---|---|---|---|---|
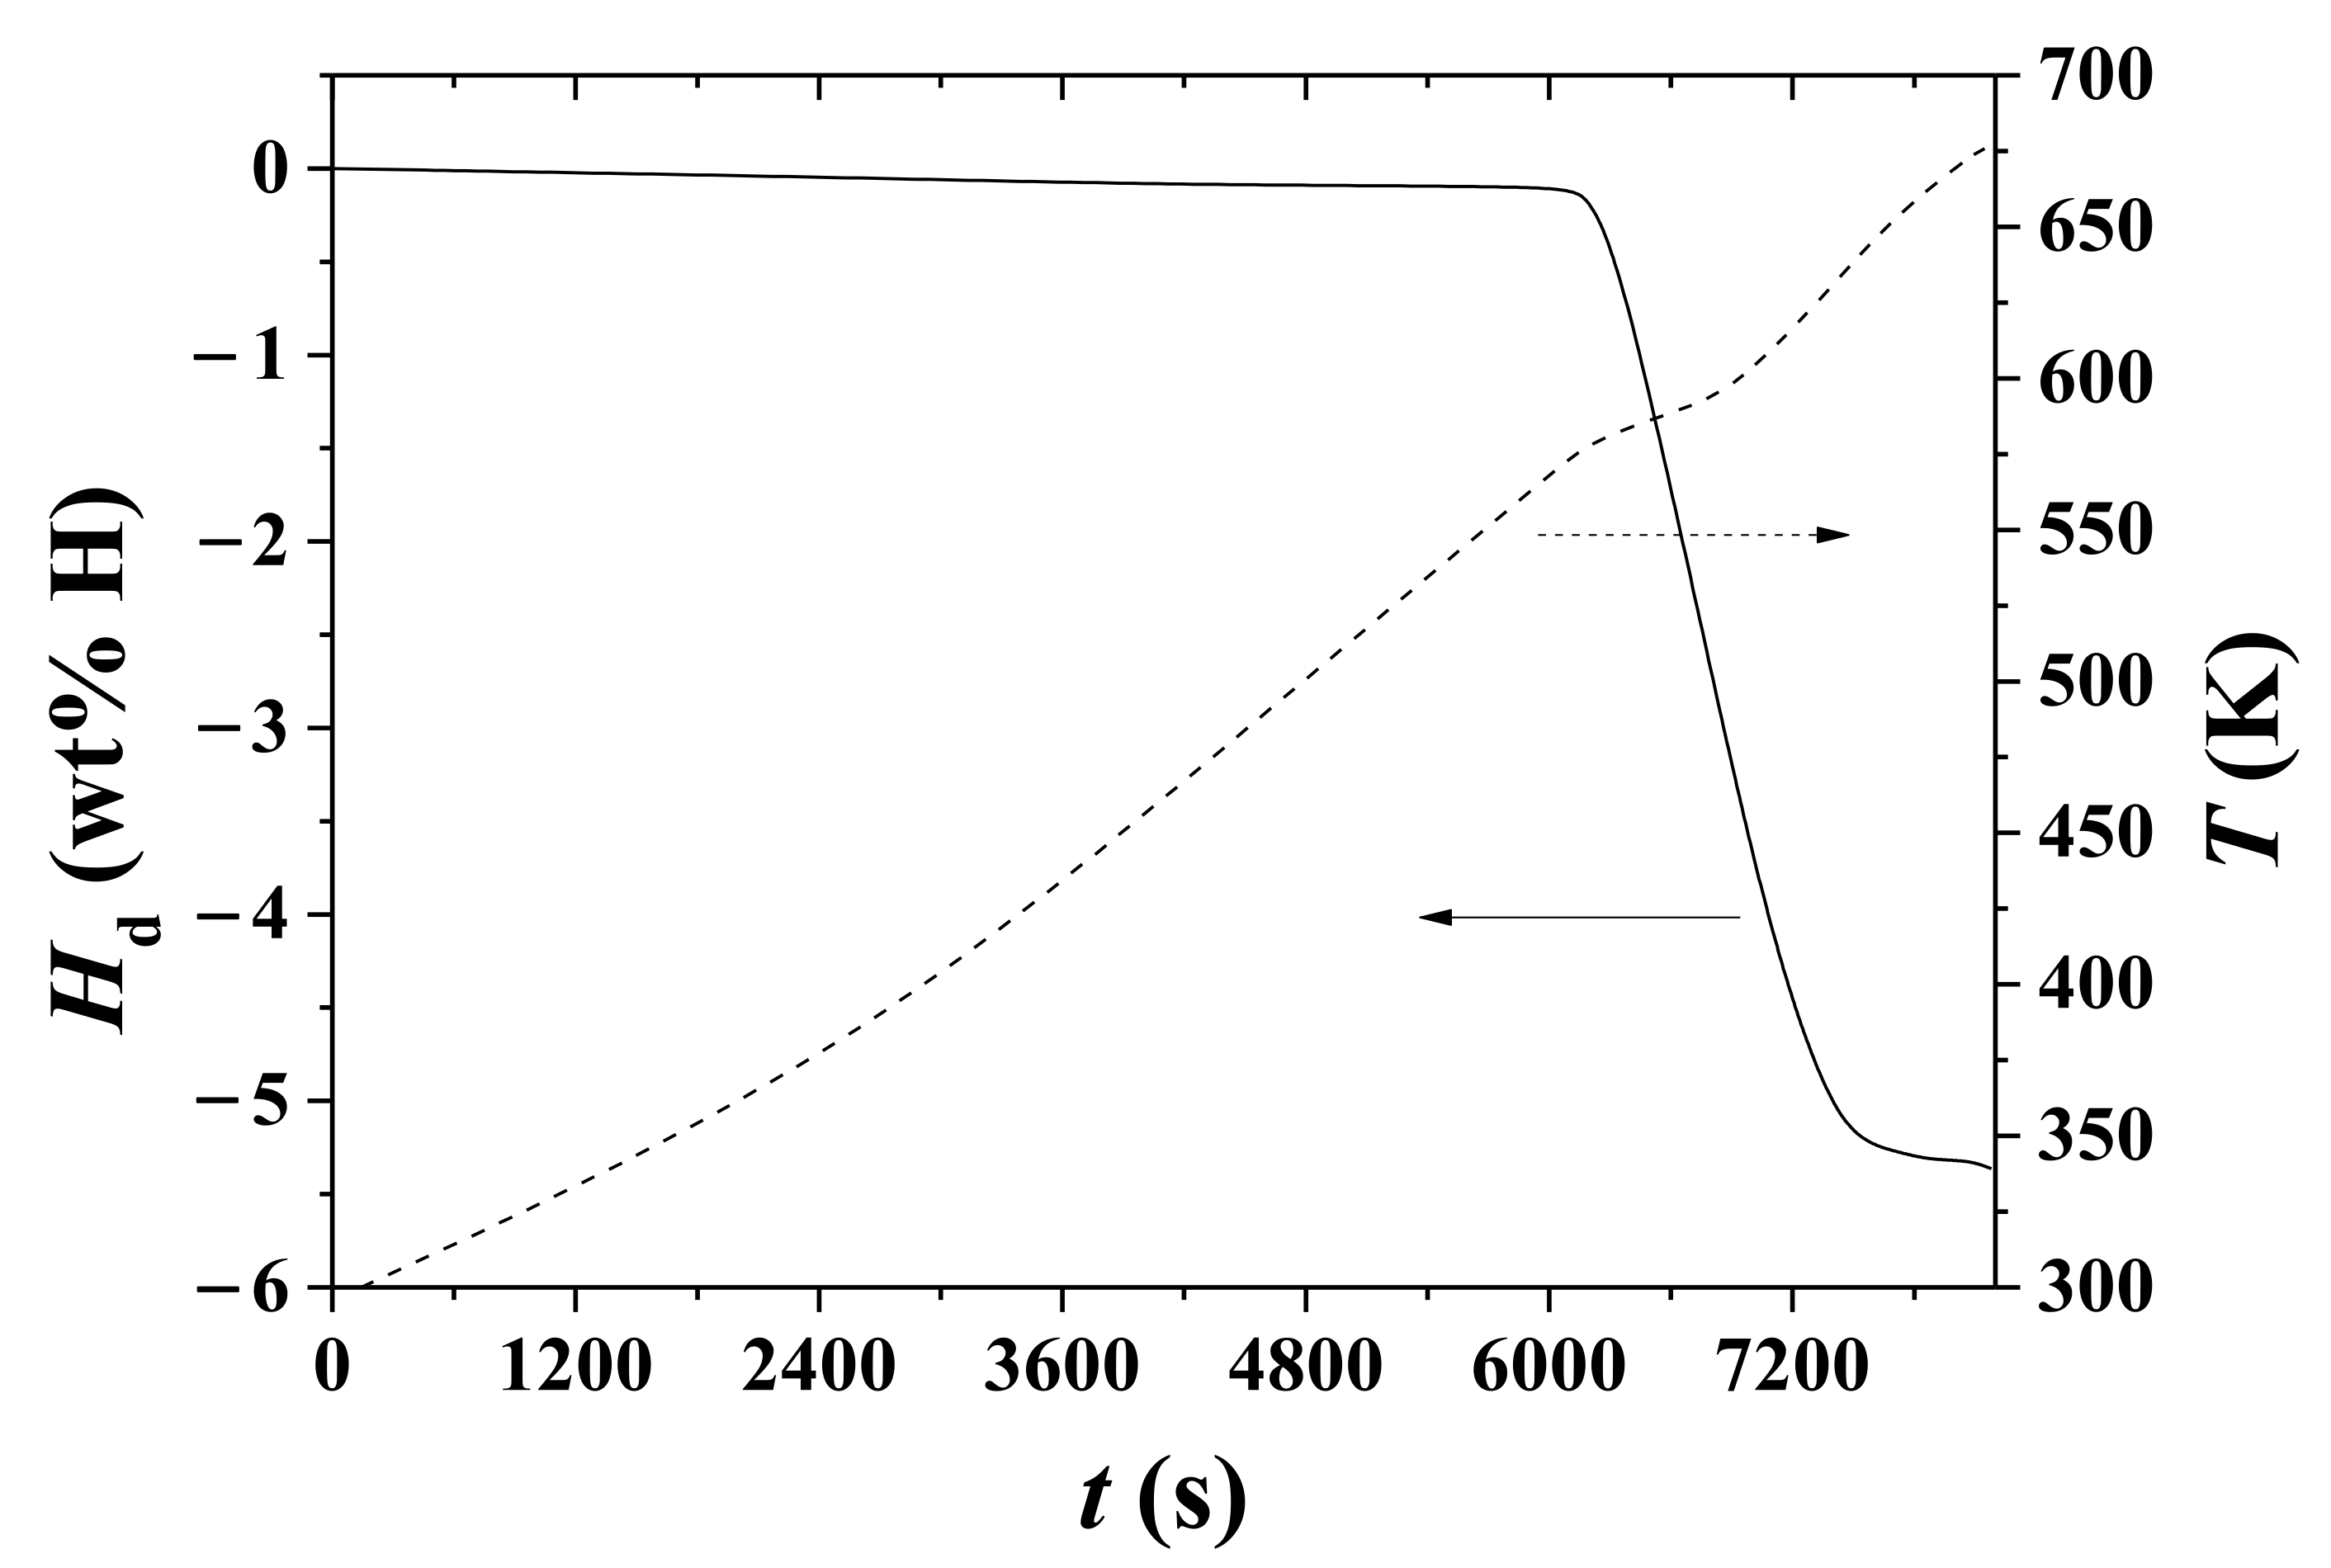
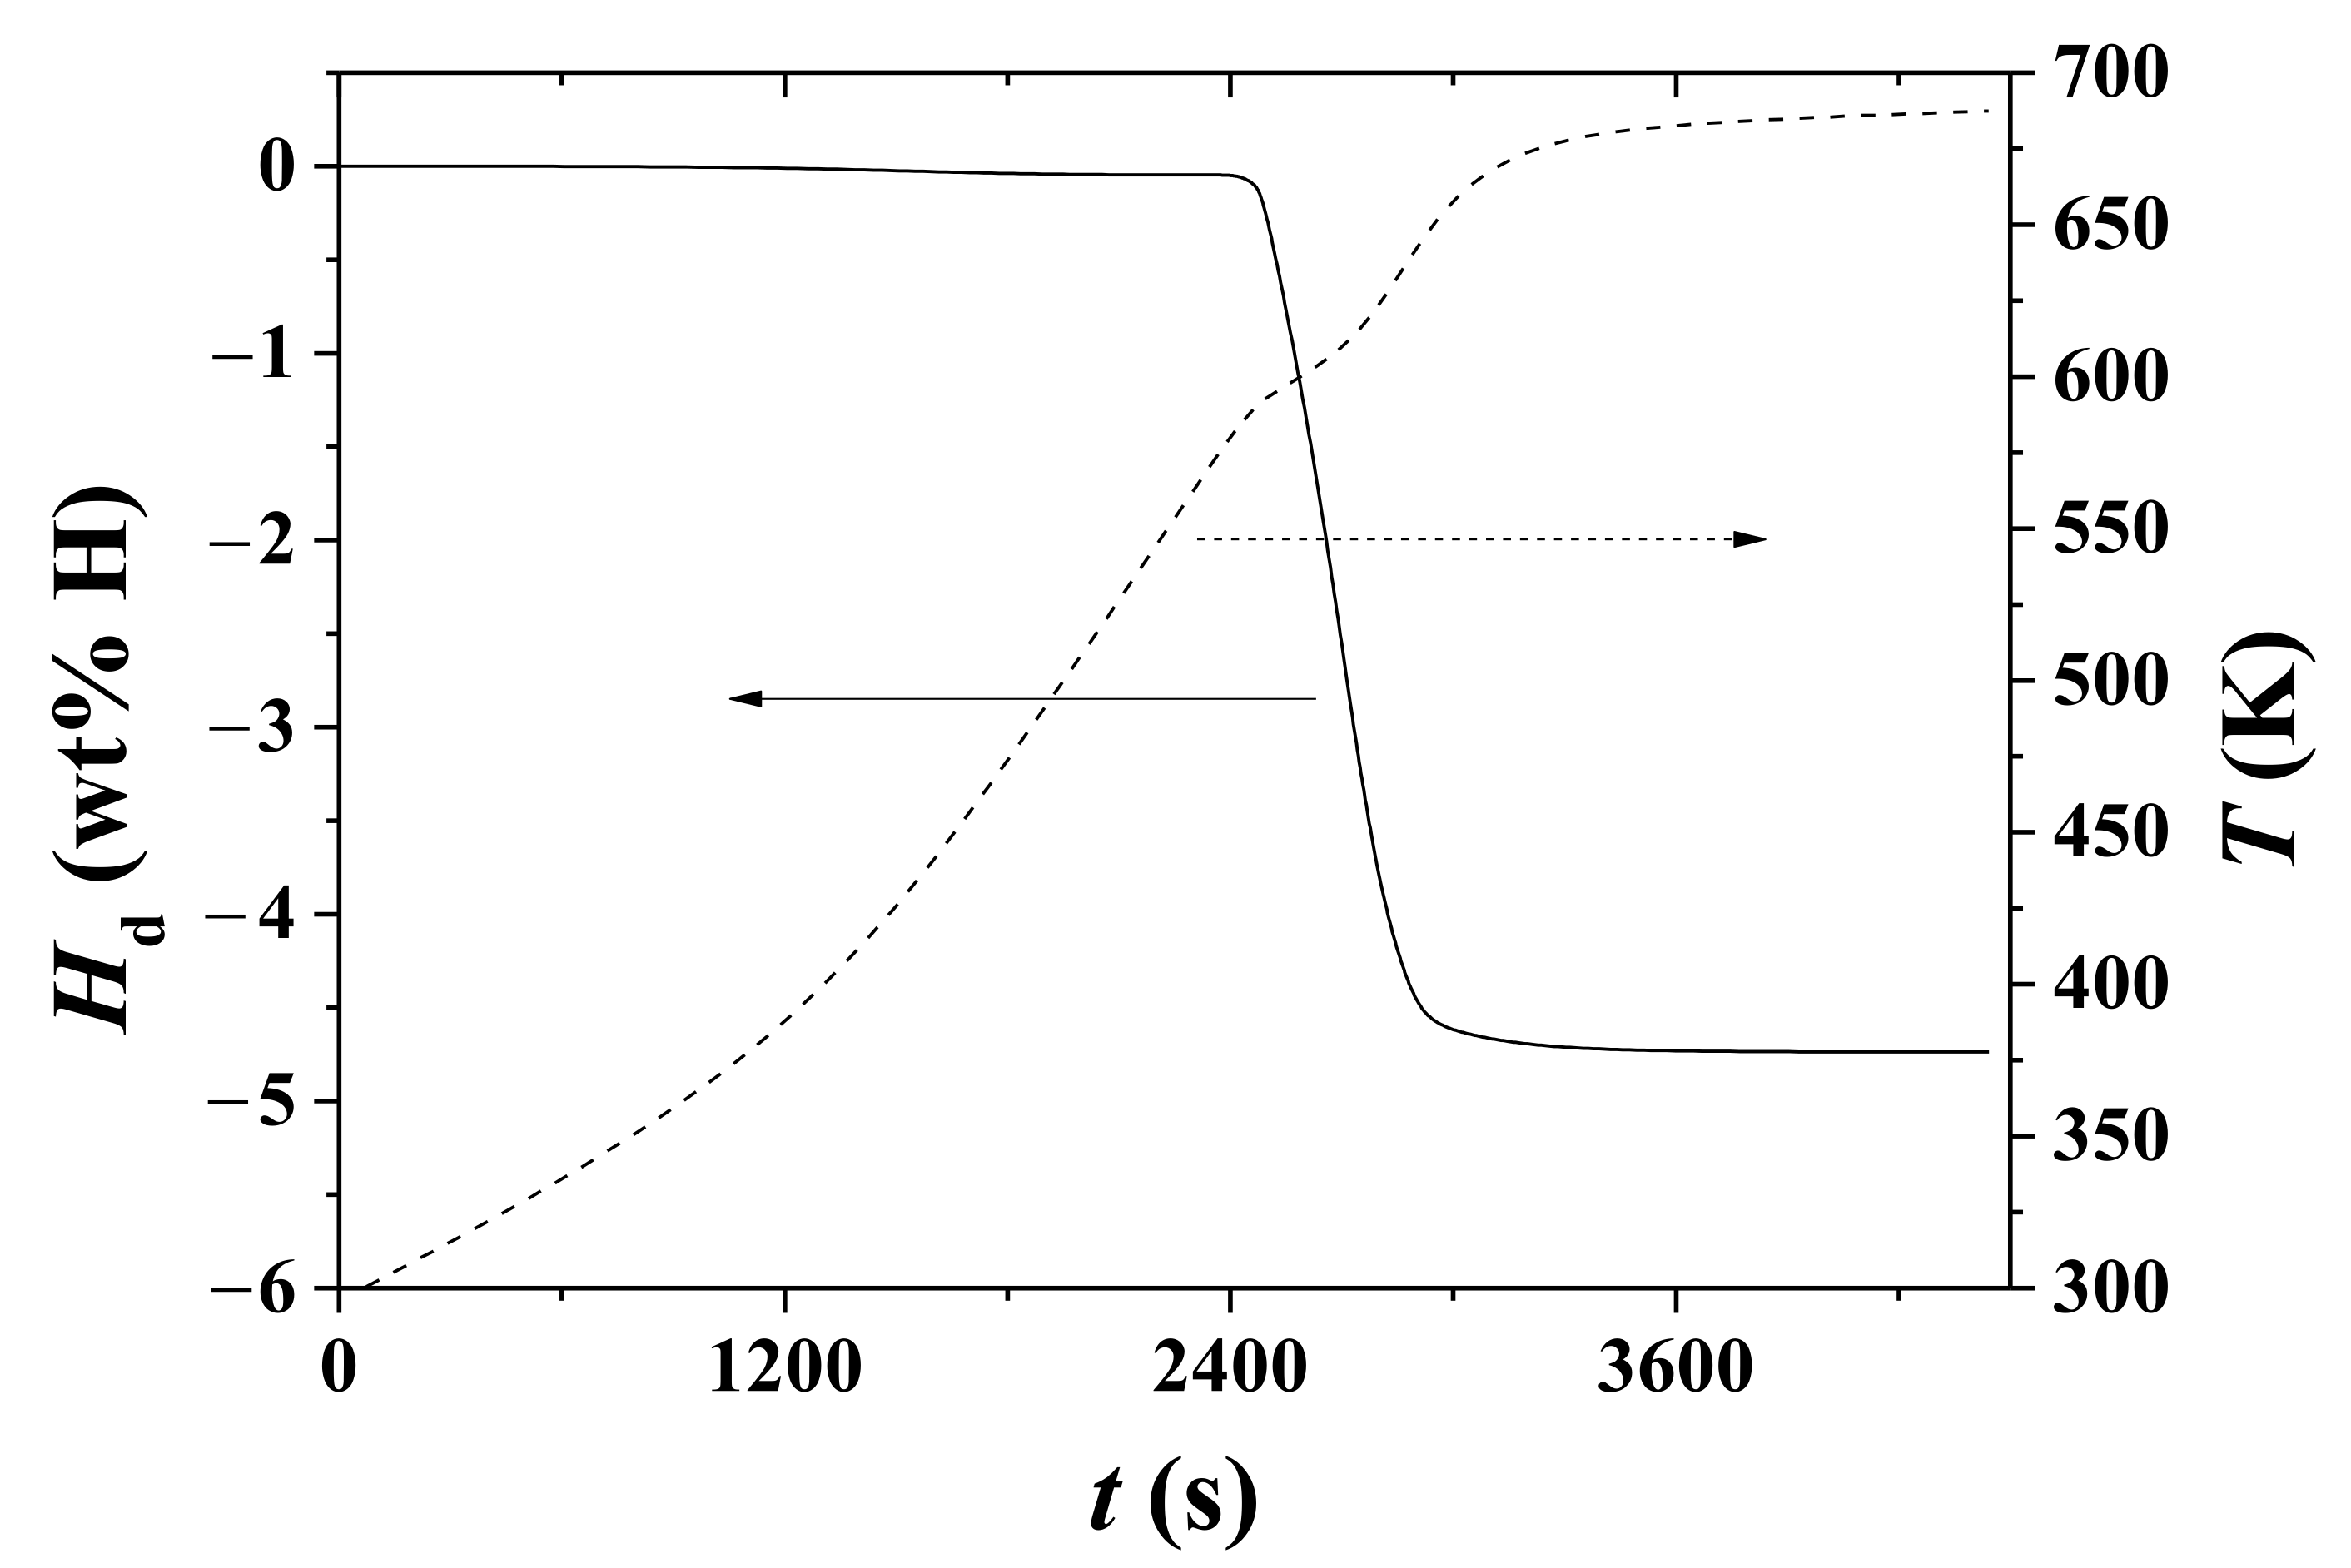
| 3 | 6060 | 572.1 | 6780 | 590.0 |
| 6 | 3327 | 573.6 | 2510 | 596.3 |
| 9 | 2441 | 586.6 | 2570 | 606.3 |
| 12 | 1931 | 588.8 | 2180 | 612.5 |
| 15 | 1589 | 590.0 | 1856 | 613.0 |
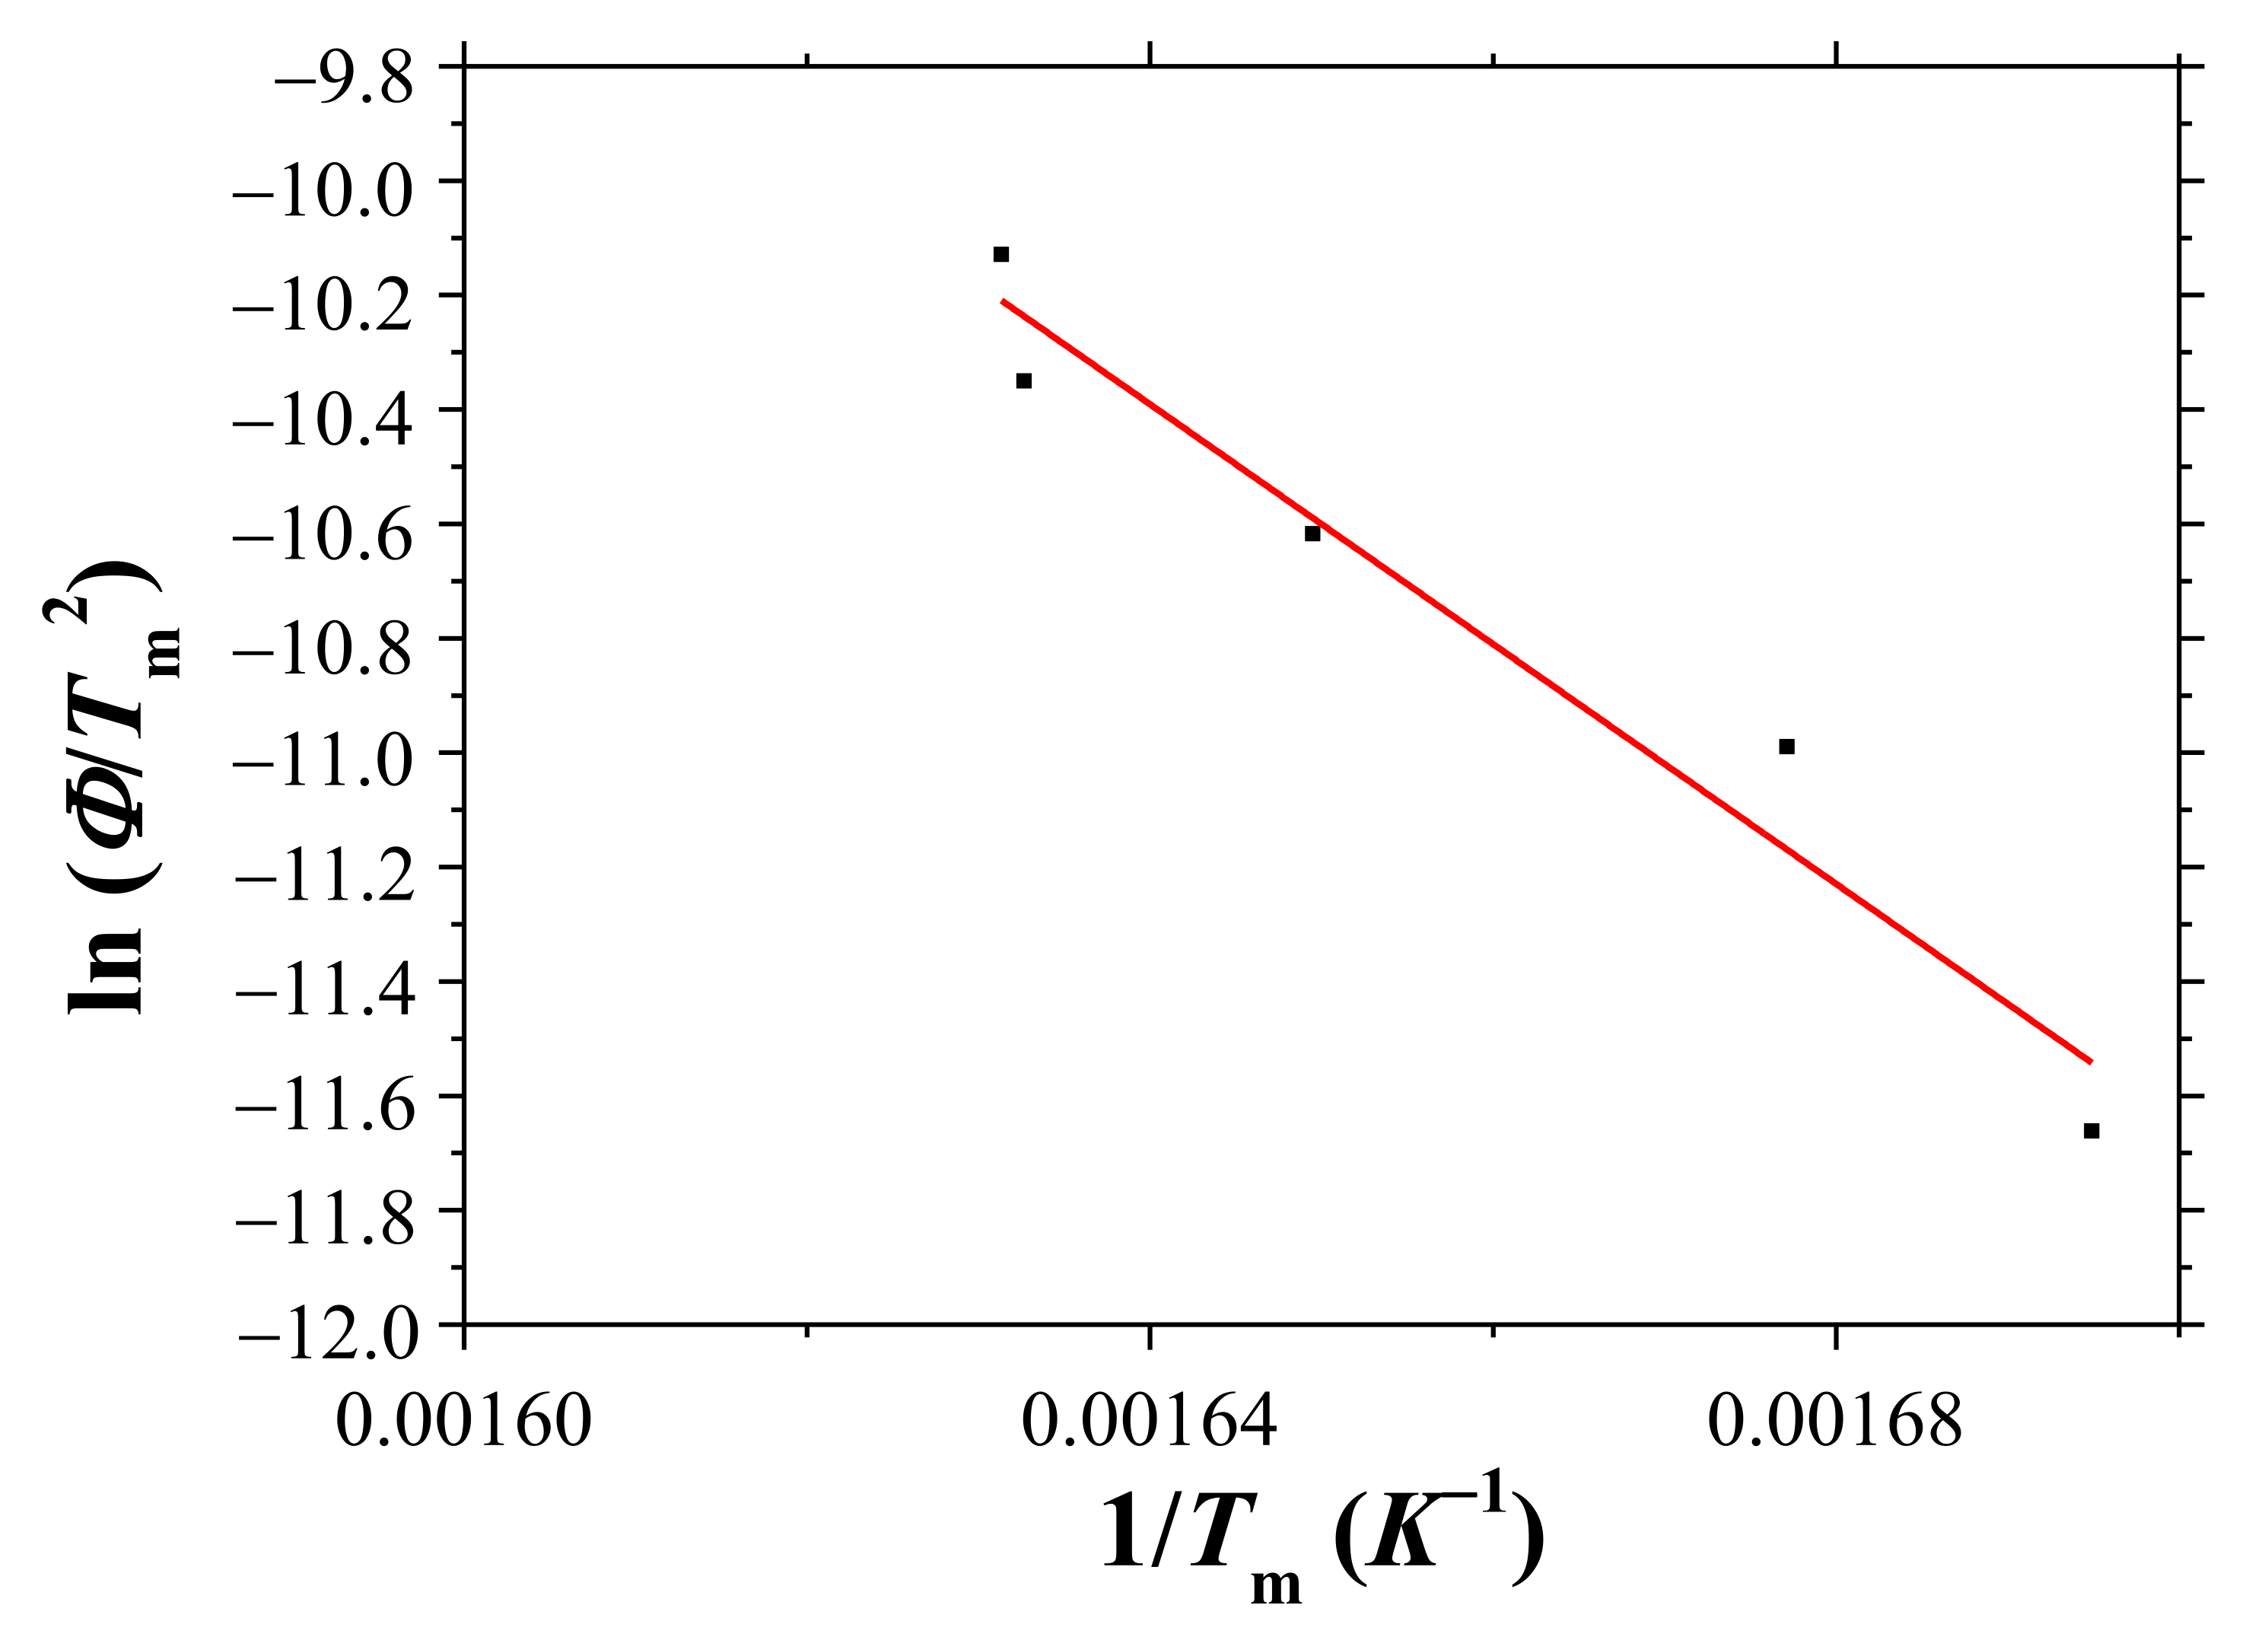
| Heating Rate Φ (K/min) | Tm (K) | ln (Φ/Tm2) | 1/Tm |
|---|---|---|---|
| 3 | 590.0 | −11.6616 | 0.001695 |
| 6 | 596.3 | −10.9896 | 0.001677 |
| 9 | 606.3 | −10.6174 | 0.001649 |
| 12 | 612.5 | −10.3502 | 0.001633 |
| 15 | 613.0 | −10.1287 | 0.001631 |
| Sample | Composition | Preparation Condition | Analysis Method | Activation Energy (kJ/mol) | Reference |
|---|---|---|---|---|---|
| commercial MgH2 | MgH2 | Kissinger plot | 195 | [1] | |
| ball-milled MgH2 with graphite | 0.3 g MgH2 + 2 g graphite | ball milling | Kissinger plot | 165 | [1] |
| infiltrated MgH2/ACF (activated carbon fiber) composite | 0.3 g MgH2 + 2 g ACF | infiltration | Kissinger plot | 143 | [1] |
| MgH2 (without oxide) | MgH2 | Kissinger plot | 174 | [2] | |
| MgH2 + 4 mol% Nb2O5 | 96 mol% MgH2 + 4 mol% Nb2O5 | ball milling | Kissinger plot | 95 | [2] |
| MgH2 + 4 mol% Fe3O4 | 96 mol% MgH2 + 4 mol% Fe3O4 | ball milling | Kissinger plot | 108 | [2] |
| MgH2 + 4 mol% ZrO2 | 96 mol% MgH2 + 4 mol% ZrO2 | ball milling | Kissinger plot | 113 | [2] |
| MgH2 + 4 mol% CeO2 | 96 mol% MgH2 + 4 mol% CeO2 | ball milling | Kissinger plot | 140 | [2] |
| MgH2 | MgH2 | ball milling waste magnesium with tetrahydrofuran (THF) | Doyle and Kissinger non-isothermal kinetic models | 255 | [3] |
| MgH2 | MgH2 | ball milling waste magnesium with NaCl | Doyle and Kissinger non-isothermal kinetic models | 256 | [3] |
| as-received MgH2 | MgH2 | Kissinger plot | 213 | [4] | |
| ball-milled MgH2 | MgH2 | ball milling | Kissinger plot | 138 | [4] |
| MgH2/LiCl mixture | ball milling after treatment with tetrahydrofuran (THF) | Kissinger plot | 115 | [4] | |
| as-milled MgH2 | MgH2 | milling | Kissinger plot | 142 | [5] |
| MgH2 + 20 wt% PdCl2 | 80 wt% MgH2 + 20 wt% PdCl2 | milling with PdCl2 | Kissinger plot | 99 | [5] |
| commercial MgH2 | MgH2 | Friedman method | 240 | [16] | |
| Mg–5Ni | 95 wt% Mg + 5 wt% Ni | milling in hydrogen | Kissinger plot | 174 | this work |
Publisher’s Note: MDPI stays neutral with regard to jurisdictional claims in published maps and institutional affiliations. |
© 2022 by the authors. Licensee MDPI, Basel, Switzerland. This article is an open access article distributed under the terms and conditions of the Creative Commons Attribution (CC BY) license (https://creativecommons.org/licenses/by/4.0/).
Share and Cite
Song, M.-Y.; Kwak, Y.-J. Determination of the Activation Energy for Hydride Decomposition Using a Sieverts-Type Apparatus and the Kissinger Equation. Metals 2022, 12, 265. https://doi.org/10.3390/met12020265
Song M-Y, Kwak Y-J. Determination of the Activation Energy for Hydride Decomposition Using a Sieverts-Type Apparatus and the Kissinger Equation. Metals. 2022; 12(2):265. https://doi.org/10.3390/met12020265
Chicago/Turabian StyleSong, Myoung-Youp, and Young-Jun Kwak. 2022. "Determination of the Activation Energy for Hydride Decomposition Using a Sieverts-Type Apparatus and the Kissinger Equation" Metals 12, no. 2: 265. https://doi.org/10.3390/met12020265
APA StyleSong, M.-Y., & Kwak, Y.-J. (2022). Determination of the Activation Energy for Hydride Decomposition Using a Sieverts-Type Apparatus and the Kissinger Equation. Metals, 12(2), 265. https://doi.org/10.3390/met12020265