Abstract
This study focuses on the results of the welding process when the Taguchi method is added to the design of experimental welding parameters when creating the welding procedure for gas tungsten arc welding (GTAW) by ASME Code for duplex stainless steel (UNS31803). A Vickers hardness tester is employed to collect and convert the tensile strength data for each test piece (weld bead, base material, and heat-affected area). A ferritic rate meter can quickly determine the ferric contents, which affect corrosion resistance and susceptibility to cracking. The test data are entered into the Taguchi technique to analyze the influence of each component on the welding quality. The L9 (34) orthogonal table is used to design the parameters for the experiment. We fixed the same shielding gas and flow rate. Backing gas at root, workpiece clamping angle, heat input, and interlayer temperature are employed as control factors for the four essential variables of the GTAW process. The ideal set of quality analysis and optimization parameters can be found. The welding parameters could be used to improve the welding quality of thin and short duplex stainless steel pipe fittings during argon welding.
1. Introduction
The industry is facing enormous pressure from international net-zero emissions requirements. According to data from the Ministry of Economic Affairs, offshore wind power will provide 19.8 billion kWh of electricity in 2025, reducing carbon dioxide emissions by 10.47 million tons [1]. Compared with coastal wind turbines, offshore wind turbines are installed offshore, and the equipment structure needs to be more vital to withstand external forces such as sea wind erosion and ocean currents.
However, because part of the weight and volume of the underwater structure of the offshore wind turbine is quite large, it is mainly completed by “welding” between steels. Welding is often the preferred processing method in the industry because of its simple operation and rapid connection of materials [1]. Because the heat is concentrated in the local area of the welded part during the welding process, the heat source is rapidly heated and locally cooled on the base metal, causing rapid microstructural changes in the molten metal in the weld bead and heat-affected zone and at the same time generating thermal strain and thermal stress. Therefore, the actual operation process will affect the uniformity of welding quality, so the research on the optimization process of welding has attracted many researchers to invest in it [2,3,4,5,6,7,8,9,10,11,12,13,14,15]. Singh et al. [5] studied the thermal efficiency and penetration depth of inert tungsten arc welding; their study was conducted for the analysis of AISI 304L stainless steel. The welding method selected was GTAW, and the test part was compared with the actual welding condition and numerical simulation software. Firstly, a three-dimensional finite element model was established. The parameters selected in the welding process were input into the simulation software for analysis, and the maximum melting efficiency of 44% was calculated based on the isovolume method [4]. The investigations of Pujari et al. [6] revealed that the weld joint’s geometry significantly influences the welding channel’s mechanical properties, so the Taguchi method was used to analyze AA 7075-T6 aluminum alloy, and the welding method selected was GTAW. The experimental parameters were partially set as the following six parameters: peak current, primary current, frequency, pulse on time, gas flow rate, and welding speed. In this study, the specimens were verified by radiographic inspection (NDT). It was found that there were no cracks in the inner part of the welding channel, and the porosity was very low, so it was confirmed that choosing the appropriate parameters for GTAW welding could effectively improve the welding quality [5].
At high temperatures, the metallographic structure of duplex stainless steel is 100% ferrite. The austenite will not develop in time, leaving an excessive amount of ferrite iron structure after cooling down if the heat input during welding is minimal and the heat-affected zone cools down too soon. Even an adequate austenite structure can be achieved, this will lead to the growth of fertile iron grains in the heat-affected zone and the development of dangerous intermetallic phases, which would embrittle the welded joint. The most straightforward technique to avoid the problem mentioned above is to manage the welding’s heat input and the temperature at which the bead layers pass through each other—achieving a great mix of high tensile strength, toughness, and strong corrosion resistance in the final product after welding.
In this paper, the authors are interested in investigating the welding quality of the typical GTAW process on the offshore wind power site. We fixed the same shielding gas and flow rate to understand the influences of the different kinds of backing gas at the root, workpiece clamping angle, heat input, and interlayer temperature for welding quality. Since we are considering a practical welding process in which these variables are not expected to undergo significant variation, we fixed the same shielding gas and flow rate in the GTAW process. Furthermore, for simplified analysis, the ferrite iron’s hardness and percentage (weld bead, base metal, and heat-affected zone) of the welded test piece are measured using a ferritic rate meter and the Vickers hardness tester using the Taguchi method. The measurement data are imported together with the two test data into the Taguchi approach using the UNS S31803 duplex stainless steel to analyze the contributions of each piece to the welding quality.
2. Experimental Design
The Taguchi method [16] can effectively increase product quality with small amounts of experimental data, and was used to simplify the experiment design using an orthogonal array and the signal-to-noise (S/N) ratio representing product quality or manufacturing process stability. The S/N ratio measures the proportion of meaningful signals (Psignal) to meaningless noises (Pnoise) in communication quality. A higher S/N ratio represents better production quality. The equation reads as follows [17]:
Statistical mean square deviation (MSD), converted into S/N ratio in signal processing, is calculated using the formula as follows [17]:
The S/N ratio can distinguish between the Larger-The-Better (LTB), Smaller-The-Better (STB), and Nominal-The-Best (NTB) quality levels. In this study, to explore the influence of different welding parameters on the target value of the desired hardness, the formula of LTB is calculated as follows [17]:
The target value of the percentage of ferrite iron, the formula of NTB, is calculated as follows [17]:
where y denotes measurable response statistic, represents the sample mean, and s2 is the sample variance of n units. The Taguchi method’s parameter design will first use the L8 orthogonal table to identify four crucial factors and two levels for factor testing to confirm each factor’s contribution; then, the L9 orthogonal table will be used to identify four factors and three levels of the orthogonal table for precise experiments. In the experiment, UNS31803 duplex stainless steel was used as the base material, the welding method was the GTAW process, and ER2209 stainless steel welding rods were used as the welding consumables. S31803 duplex stainless steel is a hollow stainless steel thin round tube assembly of ø33.4 (mm) × t3.38 (mm) × L50 (mm), welded with S31803 solid rod for duplex stainless, ASME AWS SFA-5.9 ER2209 × ψ2.4 (mm). The welding method uses the GTAW process and ER2209 stainless steel electrodes as the consumable rod. The chemical composition requirements of the UNS S31803 base metal and ER2209 filler are shown in Table 1 and Table 2. The actual welding process is shown in Figure 1.

Table 1.
S31803 chemical composition requirements (%).
Table 2.
ER2209 filler chemical composition requirements (%).
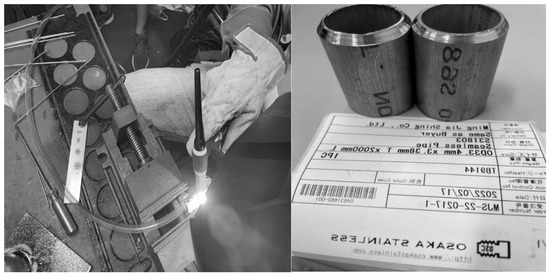
Figure 1.
Actual welding diagram of GTAW process for duplex stainless steel pipe.
Following the essential variables of ASME section IX code, after evaluation and analysis, the factors of welding quality engineering were selected as the control factors, i.e., (1) backing gas at root, (2) workpiece clamping angle (o), (3) heat input (A), and (4) interlayer temperature (°C), etc. Each factor was analyzed with Taguchi’s direct table experiment using three levels, as shown in Table 3.
Table 3.
Taguchi direct cross-tabulation table control factor and three levels comparison table.
3. Results and Discussion
After the experimental plan completes the welding test piece, the workpiece’s weld bead’s outside and interior will be examined. The metallographic structure of the weld bead, base metal, heat-affected zone (HAZ), and hardness data is helpful for subsequent data analysis using the Taguchi method. Sandpaper is used to remove the surface-attached oxides and oil stains from the test piece’s inspection points. The surface of the weld bead, the heat-affected zone’s surface, and the test piece’s base metal is measured next using the ferritic rate meter. the percentage of ferrite iron (called α-Fe content) on the surface is found, followed by taking the average of five measurements in the same spot. To get the correct measurement value when using the ferritic rate meter, the measuring rod needs to be kept perpendicular to the measuring surface, as demonstrated in Figure 2. We give the data and S/N ratio calculated by Equation (4) in Table 4.
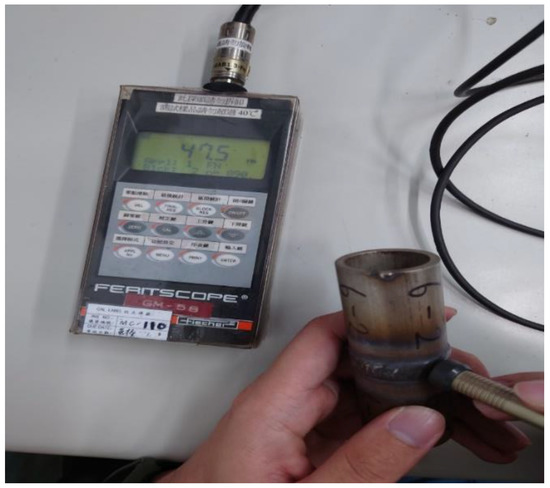
Figure 2.
Percentage detection of the test piece with a ferritic rate meter.
Table 4.
The percentage of ferrite iron measured in the duplex stainless steel material.
To collect and convert the tensile strength data for each test piece, a Vickers hardness tester is also employed in Figure 3. The same test piece was used to analyze the hardness values of welded specimens (welding bead, base material, and heat affected area). We follow the ASTM A370 [16] and ASTM E140 [17,18] specifications and convert the approximate tensile strength, as shown in Table 5.
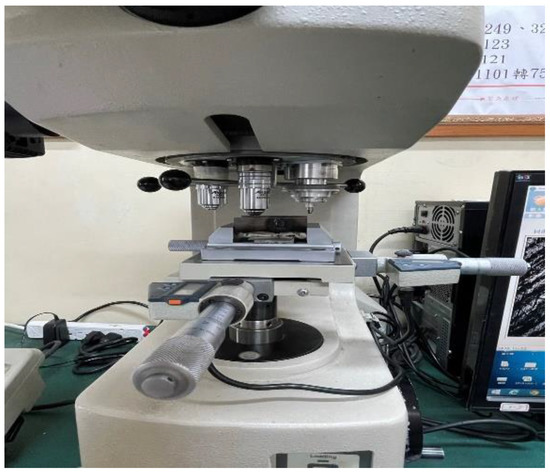
Figure 3.
Vickers hardness values of welded specimens.
Table 5.
Vickers hardness values were measured in the duplex stainless steel material. Unit: MPa.
The Taguchi method is used to analyze the characteristics of α-Fe content in the welding specimen, and the variance analysis is performed through the analysis software. Then the contribution of each factor is calculated. The higher the degree of contribution, the greater is the degree of change in the analysis results. The degree of contribution is the proportion of the sum of squares (SS) of each factor to the total sum of squares, and the contribution of each factor in this test is shown in Table 6.
Table 6.
Analysis of variation and contribution of α-Fe content of UNS31803 Duplex stainless steel.
The same Taguchi method was used to analyze the Vickers hardness values of welded specimens, and the analysis software was used to analyze the variance and calculate the contribution of each factor. Then, the contribution of each factor is calculated, and the contribution of each factor of Vickers hardness in this study is shown in Table 7.
Table 7.
Variation and contribution analysis of Vickers Hardness of UNS31803 duplex stainless steel.
The size of the difference between the values of the experimental S/N ratio was ranked to compare the difference between the maximum value and the minimum value. The smaller factor ranking indicates the more significant difference in effect, and also represents the higher the importance, as shown in Table 8. Next, the impact of the experiments on the S/N ratio is shown in Figure 4, from which it can be seen that the experimental factor levels of the α-Fe content of UNS31803 duplex stainless steel in the L9 direct cross table are A2, B3, C3, and D1, respectively.
Table 8.
S/N ratio factor response table of α-Fe content of UNS31803 duplex stainless steel in L9 direct cross table.
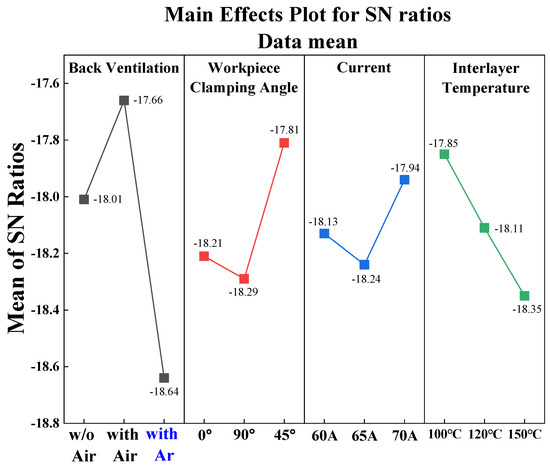
Figure 4.
S/N ratio factor response graph of α-Fe content of UNS31803 duplex stainless steel in L9 direct cross table.
The difference between the numerical values of the S/N ratio of each experiment is also sorted, and the difference between the maximum value and the minimum value is compared. The smaller the factor ranking, the more significant is the difference in effect and the higher the importance, as shown in Table 9. Next, the experiment’s impact on the S/N ratio is shown in Figure 5, from which it can be seen that the Vickers hardness experiment factor levels of UNS31803 stainless steel in the L9 direct cross table are A3, B2, C2, and D1, respectively.
Table 9.
S/N ratio factor response table of Vickers hardness value test experiment of UNS31803 duplex stainless steel in L9 direct cross table.
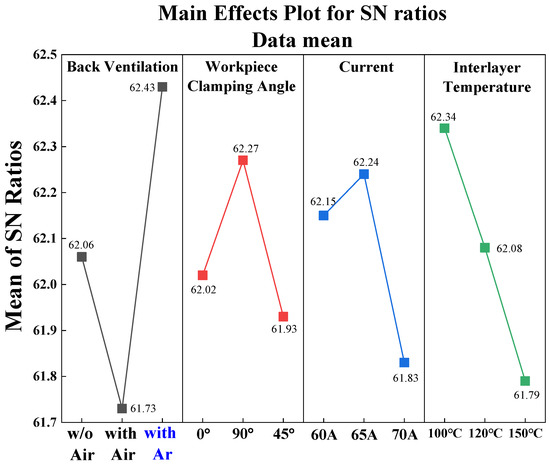
Figure 5.
S/N ratio factor response graph of Vickers hardness test of UNS31803 duplex stainless in L9 direct cross table.
4. Conclusions
After analyzing the results and verifying the results of this study using the UNS S31803 duplex stainless steel, the following conclusions were obtained:
- In this study, we performed gas tungsten arc welding under the same environmental conditions to optimize the quality of Vickers hardness and the quality of α-Fe content. We tested the combinations using the Taguchi method of direct cross-tabulation, and analyzed them to find a better combination of control factor levels.
- The data were obtained from the welding test by arranging the combinations in Taguchi’s direct cross-tabulation table. After compiling them, Taguchi analyzed each control factor’s data. The combination of A3, B2, C2, and D1 (backing gas with argon gas, workpiece clamping angle 90°, current 65 A, and interlayer temperature 100 °C) with the α-Fe content of 57.00% and tensile strength of 1453 MPa is the stable combination with the better Vickers hardness quality.
Author Contributions
Conceptualization, M.-C.L. and C.-C.H.; methodology, M.-C.L. and C.-C.H.; software, M.-C.L. and C.-C.C.; validation, C.-C.C. and C.-C.H.; formal analysis, M.-C.L. and C.-C.C.; investigation, M.-C.L., C.-C.C. and C.-C.H.; resources, M.-C.L. and C.-C.H.; data curation, M.-C.L. and C.-C.C.; writing, C.-C.C. and C.-C.H.; visualization, M.-C.L., C.-C.C. and C.-C.H.; supervision, M.-C.L. and C.-C.H.; project administration, M.-C.L. and C.-C.H.; funding acquisition, M.-C.L. and C.-C.H. All authors have read and agreed to the published version of the manuscript.
Funding
This research was supported by the Marine Science and Technology Office, National Kaohsiung University of Science and Technology, Taiwan, under 111E16.
Data Availability Statement
Not applicable.
Conflicts of Interest
The authors declare no conflict of interest.
References
- Hoffman, D.J.; Dahle, K.R.; Fisher, D.J. Welding; Pearson Education: London, UK, 2016. [Google Scholar]
- Zhao, T.; Chen, Y.; Han, S.; Hersch, J. A study of electron drift velocity in ArCO2 and ArCO2CF4 gas mixtures. Nucl. Instrum. Methods Phys. Res. Sect. A Accel. Spectrometers Detect. Assoc. Equip. 1994, 340, 485–490. [Google Scholar] [CrossRef]
- Tong, L.G.; Gu, J.C.; Wang, L.; Yin, S.W. Influences of deposited metal material parameters on weld pool geometry during shield metal arc welding. Int. J. Heat Mass Transf. 2015, 90, 968–978. [Google Scholar] [CrossRef]
- Juang, S.C.; Tarng, Y.S. Process parameter selection for optimizing the weld pool geometry in the tungsten inert gas welding of stainless steel. J. Mater. Process. Technol. 2002, 122, 33–37. [Google Scholar] [CrossRef]
- Singh, B.; Singhal, P.; Saxena, K.K. Investigation of Thermal Efficiency and Depth of Penetration during GTAW Process. Mater. Today Proc. 2019, 18, 2962–2969. [Google Scholar] [CrossRef]
- Pujari, K.S.; Patil, D.V.; Mewundi, G. Selection of GTAW process parameter and optimizing the weld pool geometry for AA 7075-T6 Aluminium alloy. Mater. Today Proc. 2018, 16, 1188–1195. [Google Scholar] [CrossRef]
- Wang, S.H.; Chiu, P.K.; Yang, J.R.; Fang, J. Gamma (γ) phase transformation in pulsed GTAW weld metal of duplex stainless steel. Mater. Sci. Eng. A 2006, 420, 26–33. [Google Scholar] [CrossRef]
- Singh, G.; Saxena, R.K.; Pandey, S. An examination of mechanical properties of dissimilar AISI 304 stainless steel and copper weldment obtained using GTAW. Mater. Today Proc. 2020, 26, 2783–2789. [Google Scholar] [CrossRef]
- Li, X.; Li, J.; Liao, Z.; Jin, F.; Zhang, F.; Xiong, J. Microstructure evolution and mechanical properties of rotary friction welded TC4/SUS321 joints at various rotation speeds. Mater. Des. 2016, 99, 26–36. [Google Scholar] [CrossRef]
- Hao, X.; Dong, H.; Li, P.; Xia, Y. Dissimilar joining of TC4 alloy to ST16 steel by GTAW. J. Manuf. Process. 2019, 37, 413–417. [Google Scholar] [CrossRef]
- Shanmugasundar, G.; Karthikeyan, B.; Ponvell, P.S.; Vignesh, V. Optimization of Process Parameters in TIG Welded Joints of AISI 304L -Austenitic Stainless Steel using Taguchi’s Experimental Design Method. Mater. Today Proc. 2019, 16, 1188–1195. [Google Scholar] [CrossRef]
- Xiansheng, N.; Zhenggan, Z.; Xiongwei, W.; Luming, L. The use of Taguchi method to optimize the laser welding of sealing neuro-stimulator. Opt. Lasers Eng. 2011, 49, 297–304. [Google Scholar] [CrossRef]
- Ghosh, N.; Pal, P.K.; Nandi, G. Parametric Optimization of MIG Welding on 316L Austenitic Stainless Steel by Grey-Based Taguchi Method. Procedia Technol. 2016, 25, 1038–1048. [Google Scholar] [CrossRef]
- Pai, A.; Sogalad, I.; Basavarajappa, S.; Kumar, P. Results of tensile, hardness and bend tests of modified 9Cr 1Mo steel welds: Comparison between cold wire and hot wire gas tungsten arc welding (GTAW) processes. Int. J. Press. Vessel. Pip. 2019, 169, 125–141. [Google Scholar] [CrossRef]
- Sivam, S.S.S.; Saravanan, K.; Pradeep, N.; Moorthy, K.S.; Rajendrakumar, S. Grey Relational Analysis and Anova to Determine the Optimum Process Parameters for Friction Stir Welding of Ti and Mg Alloys. Period. Polytech. Mech. Eng. 2018, 62, 277–283. [Google Scholar] [CrossRef]
- ASTM A370-21; Standard Test Methods and Definitions for Mechanical Testing of Steel Products. International Association for Testing Materials: West Conshohocken, PA, USA, 2021.
- Ross, P.J. Taguchi Techniques for Quality Engineering; McGraw-Hill Book Company: New York, NY, USA, 1996. [Google Scholar]
- ASTM E140-12B; Standard Hardness Conversion Tables for Metals Relationship Among Brinell Hardness, Vickers Hardness, Rockwell Hardness, Superficial Hardness, Knoop Hardness, Scleroscope Hardness, and Leeb Hardness. International Association for Testing Materials: West Conshohocken, PA, USA, 2019.
Publisher’s Note: MDPI stays neutral with regard to jurisdictional claims in published maps and institutional affiliations. |
© 2022 by the authors. Licensee MDPI, Basel, Switzerland. This article is an open access article distributed under the terms and conditions of the Creative Commons Attribution (CC BY) license (https://creativecommons.org/licenses/by/4.0/).