Abstract
The temperature dependences of the kinematic viscosity and surface tension of liquid pipe steel with different modes of melt preparation were investigated. A transition zone was found on the temperature dependences of the thermophysical properties, which separates the regions with different activation energies of viscous flow and surface tension. At the heating stage in the transition zone, the thermal decomposition of clusters based on cementite Fe3C occurs. As a result of the decomposition, free carbon atoms appear which tend to give a uniform distribution in liquid iron with increasing temperature. At a low content of alloying elements and impurities, a high-temperature melt should have a large-scale cluster structure, which provides a more uniform distribution of chemical elements. The melt after vacuum degassing has a narrow transition zone near 1920 K, in contrast to the wide transition zone of the melt without vacuum degassing. The wider transition zone is shifted to high-temperature and this shift is associated with the thermal decomposition of carbides and oxides. Studies have shown that heating liquid pipe steel above the temperature of the liquid–liquid structural transition makes it possible to obtain a more homogeneous structure with a more uniform distribution of alloying and impurity elements in the melt. The sharp drop in surface tension at temperatures above 1920 K in the melt without vacuum degassing is associated with the diffusion of free S and O atoms, which are released after thermal decomposition of sulfides and oxides.
1. Introduction
Large diameter pipes up to 1420 mm are made of pipe steel and are used for production and long-distance transmission of oil and gas. Pipe steel should have high strength, toughness, and a low ductile–brittle transition temperature. To achieve these properties, the steel must contain C, no more than 0.24 wt%, Mn, no more than 1.4 wt%, and Si, no more than 0.6 wt% depending on the strength class. Microalloying with Al, Nb, Ti, V in an amount not exceeding 0.15 wt% of each element contributes to grain refinement. To improve the corrosion resistance, a limited amount of Cr, Ni, Mo, Cu is introduced into the steel. The content of impurities P, S, N, O should be at the minimum level. As a rule, the content of alloying elements and impurities in pipe steel does not exceed 2 wt%, so this steel can be called a multicomponent low alloyed steel.
For the production of large diameter pipes, a welded method is used based on a straight or spiral seam. In the case of a welded production method, the strength properties of the pipes are significantly affected by the heat-affected zone (HAZ) [1,2]. HAZ is a region of the base metal that does not melt but has a microstructure and properties that are different from that of the molten and base metal. The pipe flattening test evaluates the ductility of a weld.
Usually, to obtain high-strength pipes, the influence of the chemical composition on the microstructure and mechanical properties of welding HAZ is investigated [3]. On the other hand, it is known that the preparation of the melt has a significant effect on the structure and properties of the steel [4]. A large number of alloying elements and impurities in the pipe steel affect the micro-heterogeneous structure of the melt [5,6,7,8]. The tendency for some atoms to approach each other leads to an inhomogeneous distribution and the formation of clusters [9,10,11]. Clusters represent groups of atoms with a certain chemical composition and arrangement of atoms relative to each other. The inhomogeneous structure of the molten metal manifests itself in the features of the temperature dependences of the physical properties, for example, the melt viscosity [12,13].
Kinematic viscosity is related to the mobility of liquid particles, and the temperature dependence of viscosity can be represented in the form of the Arrhenius equation [14]:
where ν is the kinematic viscosity (m2·s−1), ν0 is the pre-exponential factor with the dimension of the kinematic viscosity, Ea is the activation energy of the viscous flow (J·mol−1), R is the gas constant (J·K−1·mol−1), T is the absolute temperature (K). According to Equation (1), at constant ν0 and Ea, the melt viscosity decreases with increasing temperature. After taking the logarithm we obtain the Arrhenius plot:
Thus, the logarithm of the kinematic viscosity is a linear function of the inverse absolute temperature. From the temperature dependence Equation (2), one can find the activation energy Ea and the pre-exponential factor ν0.
When heating or cooling the liquid multicomponent alloy, a liquid–liquid structure transition can occur [15,16,17,18]. The structure transition changes the chemical composition and size of the clusters and leads to a change in the activation energy. In the transition zone, the Arrhenius plot deviates from linearity and this anomaly can present a different shape [19]. On the other hand, the structure of the melt depends on the temperature and holding time, that is, on the heat treatment of the liquid steel. Thus, the melt preparation can significantly affect the physical properties of the steel.
A change in the melt structure can also affect the temperature dependence of the density [6,20]. In multicomponent melts, the chemical composition of the surface can differ significantly from the bulk [21]. The chemical composition of the surface layer depends on the ability of alloying and impurity elements to diffuse to the surface and evaporate [22,23], that is, on the segregation energy and vapor pressure.
In this work, we investigated pipe steel used for the production of welded casing pipes with a diameter of up to 530 mm. Casing pipes are lowered into the borehole, to keep the rock from sagging. The aim of our study was a semi-quantitative assessment of the melt structure and the relationship between the structure of liquid pipe steel with different modes of melt preparation and the results of weld flattening tests. For this, the temperature dependences of the kinematic viscosity and surface tension of liquid pipe steel samples with different modes of melt preparation were investigated.
2. Materials and Methods
Samples of pipe steel were obtained after melting the alloy in an electrical arc furnace, out-of-furnace treatment of the melt, casting slabs 90 mm thick, hot rolling to a final thickness of 8 mm, accelerated cooling, and coiling. Liquid steel 1 was tapped from an arc furnace at a temperature of 1925 K without vacuum degassing. Liquid steel 2 was tapped from an arc furnace at 1970 K with vacuum degassing. The specimens had different properties after weld flattening tests. Sample 1 gave unsatisfactory test results and sample 2 good results. The chemical composition of the samples is presented in Table 1 and represents the average of three measurements. An ARL 4460 Metals Analyzer was used to determine the C, S, N, and O content, and other chemical elements were determined using a Leco GDS 500A Optical Emission Spectrometer. The error in determining the chemical composition was 1%. The liquidus temperature of pipe steel Tl = 1770 K was determined by a formula derived from multiple regression analysis [24]. The formula relates the liquidus temperature to the C, Si, Mn, Cr, Mo, Ni, P, S content for low alloyed steel. The liquidus temperature 1770 K corresponds to the lower boundary of the temperature range for studying the thermophysical properties of liquid pipe steel.

Table 1.
Chemical composition of pipe steel samples.
The samples of pipe steel were placed in a beryllium oxide beaker to measure the temperature dependence of the kinematic viscosity. The kinematic viscosity was determined by the method of torsional vibrations in an atmosphere of pure helium at a pressure of 105 Pa [25]. Before the measurement, the melt was kept at a predetermined temperature for 5 min to stabilize the structural state. During heating and cooling, the melt temperature was changed with a step of 30 K. The error in measuring the kinematic viscosity was 3%. The surface tension was measured in the same mode using the method of a sessile drop in a helium atmosphere. The error in measuring the surface tension did not exceed 3%.
3. Results and Discussion
Figure 1 shows the kinematic viscosity on a natural logarithmic scale lnν as a function of the inverse absolute temperature T−1 upon heating to maximum temperature Tmax = 2090 K and cooling the pipe steel melt 1. Linear sections of Arrhenius plots are a linear regression of experimental points and correspond to the melt flow with constant activation energy Ea. We assume that in linear regions with increasing temperature the viscosity decreases due to an increase in the mobility of atoms or clusters without changing the melt structure. In the temperature range 1940–1980 K, a transition zone was found, in which the activation energy of the viscous flow changes. In the transition zone, there is an anomalous deviation from the linear Arrhenius plot, which indicates that here the melt structure is nonequilibrium. The transition zone takes place both in the heating and cooling stages. Similar temperature dependences of the kinematic viscosity were also obtained for another sample of pipe steel 1 with heating to maximum temperature Tmax = 2000 K.
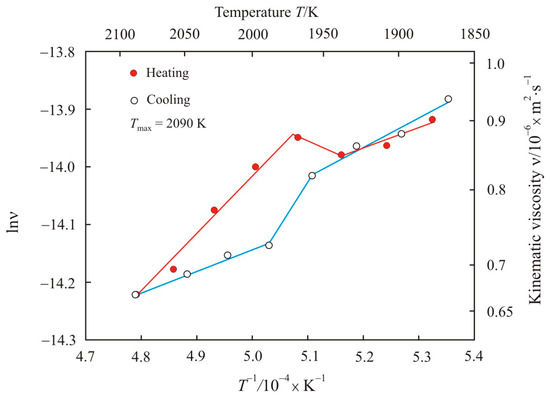
Figure 1.
Kinematic viscosity on a natural logarithmic scale lnν as a function of the inverse absolute temperature T−1 upon heating to maximum temperature Tmax = 2090 K and cooling the pipe steel melt 1.
Figure 2 shows the kinematic viscosity on a natural logarithmic scale lnν as a function of the inverse absolute temperature T−1 upon heating to maximum temperature Tmax = 1995 K and cooling the pipe steel melt 2. Arrhenius plot of the pipe steel melt 2 also has two linear sections in the low-temperature and high-temperature regions at the heating and cooling stages, but with a narrow transition zone near 1920 K.
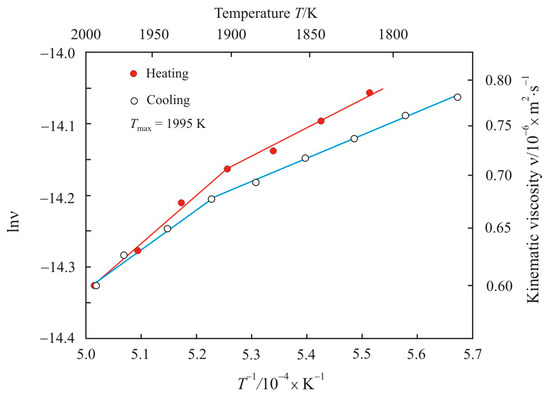
Figure 2.
Kinematic viscosity on a natural logarithmic scale lnν as a function of the inverse absolute temperature T−1 upon heating to maximum temperature Tmax = 1995 K and cooling the pipe steel melt 2.
The calculated activation energies Ea and pre-exponential factors ν0 are given in Table 2. It can be seen that the highest activation energy takes place in the high-temperature region at the heating stage. At the cooling stage, the activation energy decreases, but still remains above the initial values.
Table 2.
Calculated activation energy of viscous flow Ea and pre-exponential factor ν0 in pipe steel melt for linear sections of Arrhenius plots.
Earlier [26], for simple liquid metals and multicomponent FeCuNbSiB-based melts, a relationship was found between the reduced activation energy Ea·(RT)−1 and the pre-exponential factor ν0.
where C is a dimensionless constant that generally depends on temperature. This relationship is universal for all quantities, the temperature dependence of which is expressed by the Arrhenius equation. Figure 3 shows the relationship between the reduced activation energy Ea·(RT)−1 and the pre-exponential factor in natural logarithmic scale lnν0 for pipe steel melts at a temperature of 1950 K. The adjusted coefficient of determination R2adj for linear relation Equation (3) is 0.98, and the constant C = −14.1. For simple liquid metals and multicomponent FeCuNbSiB-based melts, the dimensionless constants are −14.7 and −13.9, respectively [26].
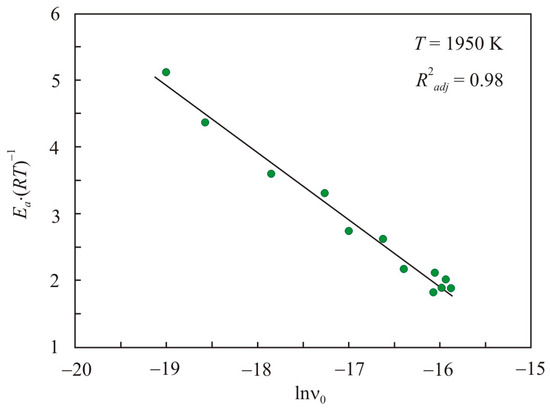
Figure 3.
Relation of the reduced activation energy Ea·(RT)−1 with the pre-exponential factor in the natural logarithmic scale lnν0 for pipe steel melts at a temperature of 1950 K.
In the transition state theory [27], the motion of one layer of liquid relative to another occurs due to the transition of a particle of size a (m) from the equilibrium state to a free site (hole). In such a mechanism of viscous flow, the kinematic viscosity can be expressed in the form [27,28]
where kB is the Boltzmann constant (J·K−1), ρ is the density (kg·m−3), vf/v is the relative free volume. If the pre-exponential factor from Equation (4) is substituted into Equation (2), then we obtain the relationship between the reduced activation energy and the particle size in the form
where C1 is a dimensionless constant, which in the general case also depends on temperature. It follows from Equation (5) that the activation energy increases with an increase in the size of particles participating in the viscous flow.
Electronegativity measurements χLB on the Luo–Benson scale for the main chemical elements of pipe steel Fe, C, Si, Cu, Ni, Cr, Mn are 1.72, 5.19, 3.41, 2.30, 1.92, 1.72, and 1.71, respectively [29]. Carbon atoms are most strongly associated with iron atoms since these two elements have the most distinct electronegativities. Therefore, in the low-temperature region, the most stable clusters in the melt are formed on the basis of cementite Fe3C, which has a melting point of 1923 K [30]. Iron in cementite can be replaced by Mn or other transition metals [31].
At high temperatures, the alloying elements and impurities should move into positions with a uniform distribution among the iron atoms. Figure 4 explains how the uniformity of the atom distribution can be related to the size of C-centered clusters. The carbon atoms (red) are in a 12 × 12 flat cell among the iron atoms. Figure 4a carbon atoms are surrounded by iron atoms in 3 × 3 clusters. This diagram most closely illustrates a melt with cementite clusters. After the cementite decomposition, free carbon atoms appear, which tend to be uniformly dispersed among the iron atoms. Figure 4b shows the distribution of carbon atoms in 6 × 6 clusters. The central cells in the cluster are shown in gray; they are the positions of the preferred arrangement of carbon atoms in the central part of the cluster. Cells into which carbon atoms move along the shortest path when going from 3 × 3 to 6 × 6 are marked in pink. This state corresponds to a more uniform distribution of free carbon atoms. From Figure 4 it follows that for a uniform distribution of impurity atoms, it is preferable to have a large-scale cluster structure.
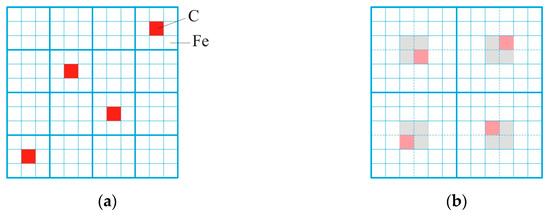
Figure 4.
Schematic representation of the cluster structure in a low-alloyed Fe-C melt with a cluster size of 3 × 3 (a) and 6 × 6 (b). Red cells represent carbon atoms in 3 × 3 clusters, gray cells represent the preferred locations for carbon atoms in 6 × 6 clusters, pink cells represent the places where carbon atoms move along the shortest path.
Let us now discuss the temperature dependences of the kinematic viscosity considering the relationship between the activation energy and the cluster size. During heating to the transition zone, the melt has a low activation energy, see Table 2. Most likely, in the low-temperature region, the viscosity is determined by stable Fe3C clusters. In the transition zone, the kinematic viscosity increases or does not change. This indicates a decrease in the activation energy of the viscous flow. Taking into account the relationship between the activation energy and the cluster size, it should be assumed that the thermal decomposition of clusters occurs in the transition zone. In the high-temperature region, at the heating stage, the activation energy increases by a factor of 2–3 in comparison with the low-temperature region. Consequently, after the cluster decomposition, a new large-scale cluster structure is formed, which provides increased uniformity in the atom distribution in accordance with the scheme in Figure 4. Thus, the temperature near 1920 K can be taken as the temperature of the liquid–liquid structural transition for pipe steel.
At the cooling stage with decreasing temperature, the interaction of carbon and iron atoms intensifies, and they tend to occupy positions close to Fe3C. Such a directed motion of atoms with high mobility in the high-temperature region promotes fragmentation of the cluster structure of the melt and a decrease in the activation energy.
The pipe steel melt 2 has a narrow transition zone, see Figure 2. This melt is cleaner and contains less impurities because it was tapped from the arc furnace at a higher temperature with a vacuum degassing. Wider transition zone in the pipe steel melt 1, see Figure 1, most likely, indicates a more diverse phase composition of the clusters. Silicon can form fairly stable bonds with iron; however, the melting point of FeSi is 1683 K and below the temperature of the beginning of the transition zone of 1940 K. On the other hand, Si, Cu, Ni, Cr, Mn can be attracted to carbide clusters and also be a part of iron clusters without carbon.
Oxides can play a significant role in the formation of the cluster structure of the pipe steel melt 1, since the alloy was melted at a lower temperature without vacuum degassing. Manganese oxide MnO has a melting point of 2123 K. The melting point of silicon oxide in the β-cristobalite form is 1996 K, and in the β-tridymite form it is 1943 K [32]. Thus, a wider transition zone in the pipe steel melt 1, which is shifted to the high temperature region compared to the pipe steel melt 2, see Figure 1 and Figure 2, can be associated with both the decomposition of carbides and high-temperature oxides.
The melt density when cooled is higher than when heated [28]. This indicates that the atoms occupy positions with the lowest potential energy at this maximum temperature, and they tend to remain in these positions during the cooling. Heating the melt above the temperature of the anomalous zone is accompanied by a transition to a more homogeneous structure with a higher density and a flow of the melt with an increased activation energy. After solidification, the overheated melt partially retains high-temperature structural elements with a more uniform distribution of atoms. This structure helps to reduce the liquidus temperature. With an increase in the rate of melt transition to the solid state, the heredity of the high-temperature structure intensifies.
Figure 5 shows the temperature dependence of the surface tension upon heating to maximum temperature Tmax = 1995 K and cooling of the pipe steel melt 1. In the low-temperature region at the heating stage, the surface tension first drops and then returns to the initial value. At temperatures above 1920 K, the surface tension rapidly decreases, and the drop continues during the cooling stage to a temperature of 1920 K. Earlier above this temperature, we found a transition zone in which the activation energy of the viscous flow changes, see Figure 1.
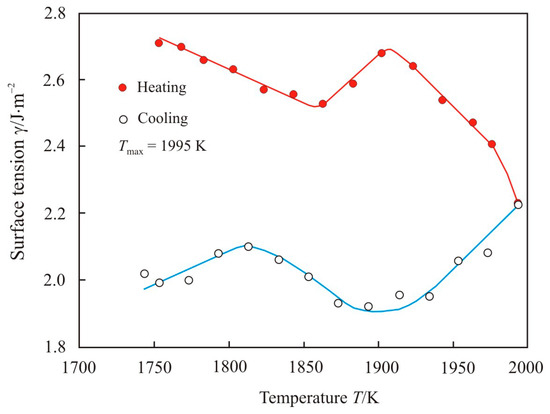
Figure 5.
The temperature dependence of the surface tension upon heating to maximum temperature Tmax = 1995 K and cooling of the pipe steel melt 1.
Figure 6 shows the temperature dependence of the surface tension upon heating to maximum temperature Tmax = 1875 K and cooling of the pipe steel melt 1. The maximum temperature of 1875 K below the beginning of the transition zone, and the temperature dependence of the surface tension do not undergo sharp changes.
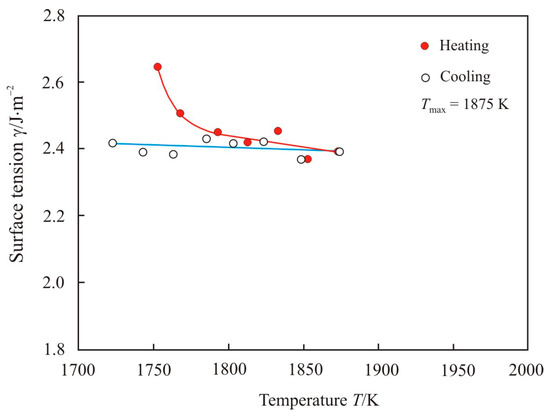
Figure 6.
The temperature dependence of the surface tension upon heating to maximum temperature Tmax = 1875 K and cooling of the pipe steel melt 1.
The temperature dependence of the surface tension upon heating to maximum temperature Tmax = 1995 K and cooling of the pipe steel melt 2 is shown in Figure 7. When heated, the surface tension decreases to a temperature of 1920 K. With further heating and at the stage of cooling, the surface tension remains almost unchanged. Comparison of Figure 5 and Figure 7 shows a significant difference in the surface tension of pipe steel 1 and 2. It should be recalled that molten steel 1 was tapped from an arc furnace at 1925 K without vacuum degassing, while molten steel 2 was tapped from an arc furnace at 1970 K with vacuum degassing. Therefore, sample 1 contains an increased sulfur and oxygen content, see Table 2.
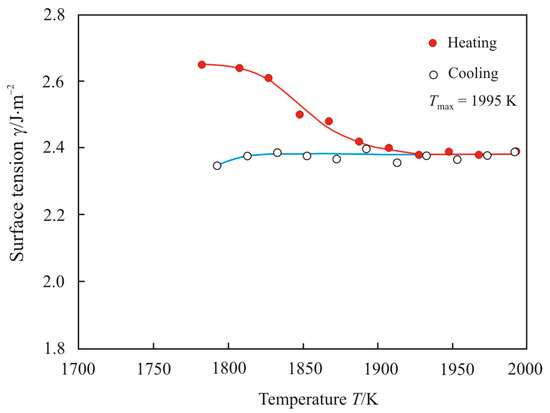
Figure 7.
The temperature dependence of the surface tension upon heating to maximum temperature Tmax = 1995 K and cooling of the pipe steel melt 2.
The surface tension of a multicomponent melt depends on the chemical composition of the surface layer. Copper and nickel in iron have the highest surface segregation energies −0.83 and −0.65 eV per atom, respectively [23], and they primarily diffuse to the surface. The energy of surface segregation of Mn in Fe is noticeably lower and equal to −0.16 eV per atom, but Mn is the main alloying element in pipe steel, so its content in the surface layer will prevail. Copper and manganese actively reduce the surface tension in the iron melt [33]. However, Mn predominates, and it has a major effect on reducing surface tension in the low-temperature region of the pipe steel melt 1 and 2.
The sharp drop in surface tension in the pipe steel melt 1 can be explained by diffusion of sulfur and oxygen, which are surface-active elements and, even in small amounts, significantly reduce the surface tension of steel [33]. Free S and O atoms appear after the thermal decomposition of manganese sulfides MnS (Tm = 1888 K) and oxides MnO (Tm = 2123 K) and SiO2 Tm = 1943–1996 K.
4. Conclusions
The temperature dependences of the kinematic viscosity and surface tension of liquid pipe steel with different modes of melt preparation before casting were investigated. The temperature dependences of the thermophysical properties of the liquid pipe steel have a transition zone that separates the regions with different activation energies for viscous flow and surface tension. Thermal decomposition of clusters based on cementite Fe3C occurs in the transition zone at the heating stage. The decomposition is accompanied by the appearance of free carbon atoms, which tend to give a uniform distribution in liquid iron with increasing temperature. The activation energy of the viscous flow increases with increasing cluster size. In the high-temperature region of liquid pipe steel, the activation energy is the highest and the cluster size is the largest. It has been proved that with a low content of alloying elements and impurities, a high-temperature melt should have a large-scale cluster structure, which provides a more uniform distribution of chemical elements. The liquid pipe steel with vacuum degassing has a narrow transition zone near 1920 K, in contrast to the wide transition zone of 1940–1980 K in the pipe steel without vacuum degassing. The wider transition zone, which is shifted to a high temperature, can be attributed to the thermal decomposition of both carbides and high-temperature oxides. Thus, heating liquid pipe steel above the temperature of the liquid–liquid structural transition makes it possible to obtain a more homogeneous structure with a more uniform distribution of alloying and impurity elements in the melt. In the low-temperature region, the surface tension of the liquid pipe steel is reduced due to the increased Mn content in the surface layer. A sharp drop in the surface tension of the pipe steel without vacuum degassing at temperatures above 1920 K is associated with the diffusion of free sulfur and oxygen atoms, which appear after the thermal decomposition of sulfides and oxides.
Author Contributions
Conceptualization, V.S.T., Y.N.S., and N.P.T.; methodology, Y.N.S.; software, V.S.T.; validation, Y.N.S. and V.S.T.; formal analysis, V.S.T. and N.P.T.; investigation, V.S.T.; resources, V.S.T. and N.P.T.; data curation, V.S.T.; writing—original draft preparation, Y.N.S.; writing—review and editing, Y.N.S.; visualization, Y.N.S.; supervision, V.S.T. and N.P.T.; project administration, V.S.T.; funding acquisition, V.S.T. All authors have read and agreed to the published version of the manuscript.
Funding
This research received no external funding.
Data Availability Statement
The data presented in this article is available upon request from the corresponding author.
Acknowledgments
The article was made within the framework of state work No. FEUZ-0836-0020.
Conflicts of Interest
The authors declare no conflict of interest.
References
- Lancaster, J. Handbook of Structural Welding: Processes, Materials and Methods Used in the Welding of Major Structures, Pipelines and Process Plant; Woodhead Publishing: Cambridge, UK, 1997; pp. 83–96. [Google Scholar]
- Sharma, S.K. A review on welding of high strength oil and gas pipeline steels. J. Nat. Gas Sci. Eng. 2017, 38, 203–217. [Google Scholar] [CrossRef]
- Chen, X.-W.; Qiao, G.-Y.; Han, X.-L.; Wang, X.; Xiao, F.-R.; Liao, B. Effect of Mo, Cr and Nb on microstructure and mechanical properties of heat affected zone for Nb-bearing X80 pipeline steels. Mater. Des. 2014, 53, 888–901. [Google Scholar] [CrossRef]
- Baum, B.A.; Khasin, G.A.; Tyagunov, G.V.; Klimenkov, Y.A.; Bazin, Y.A.; Kovalenko, L.V.; Mikhailov, V.B.; Raspopov, G.A. Liquid Steel; Metallurgiya: Moscow, Russia, 1984; pp. 52–76. [Google Scholar]
- Baum, B.A. Metal Liquids; Nauka: Moscow, Russia, 1979; pp. 67–80. [Google Scholar]
- Popel, P.S.; Sidorov, V.E. Microheterogeneity of liquid metallic solutions and its influence on the structure and properties of rapidly quenched alloys. Mater. Sci. Eng. A 1997, 226, 237–244. [Google Scholar] [CrossRef]
- Calvo-Dahlborg, M.; Popel, P.S.; Kramer, M.J.; Besser, M.; Morris, J.R.; Dahlborg, U. Superheat-dependent microstructure of molten Al-Si alloys of different compositions studied by small angle neutron scattering. J. Alloys Comp. 2013, 550, 9–22. [Google Scholar] [CrossRef]
- Konev, S.N.; Dovgopol, S.P.; Geld, P.V. Phase diagram of the Fe-B system in the melt. Doklady Akademii Nauk SSSR 1982, 262, 88–90. [Google Scholar]
- Zhou, S.X.; Dong, B.S.; Qin, J.Y.; Li, D.R.; Pan, S.P.; Bian, X.F.; Li, Z.B. The relationship between the stability of glass-forming Fe-based liquid alloys and the metalloid-centered clusters. J. Appl. Phys. 2012, 112, 023514. [Google Scholar] [CrossRef]
- Bel’tyukov, A.L.; Lad’yanov, V.I.; Shishmarin, A.I. Viscosity of Fe-Si melts with silicon content up to 45 at%. High Temp. 2014, 52, 185–191. [Google Scholar] [CrossRef]
- Zhou, S.; Dong, B.; Xiang, R.; Zhang, G.; Qin, J.; Bian, X. Influence of clusters in melt on subsequent glass-formation and crystallization of Fe-Si-B metallic glasses. Prog. Nat. Sci. Mater. 2015, 25, 137–140. [Google Scholar] [CrossRef] [Green Version]
- Zamyatin, V.M.; Baum, B.A.; Mezenin, A.A.; Shmakova, K.Y. Time dependences of the melt properties, their significance, features and options for explanation. Rasplavy 2010, 5, 19–31. [Google Scholar]
- Chikova, O.; Sinitsin, N.; Vyukhin, V.; Chezganov, D. Microheterogeneity and crystallization conditions of Fe-Mn melts. J. Cryst. Growth 2019, 527, 125239. [Google Scholar] [CrossRef]
- Frenkel, J. Kinetic Theory of Liquids; Nauka: Leningrad, Russia, 1975; pp. 224–228. [Google Scholar]
- Tanaka, H. General view of a liquid-liquid phase transition. Phys. Rev. E 2000, 62, 6968–6976. [Google Scholar] [CrossRef]
- Vasin, M.G.; Lad’yanov, V.I. Structural transitions and nonmonotonic relaxation processes in liquid metals. Phys. Rev. E 2003, 68, 051202. [Google Scholar] [CrossRef] [PubMed] [Green Version]
- He, Y.; Li, J.; Wang, J.; Kou, H.; Beagunon, E. Liquid-liquid structure transition and nucleation in undercooled Co-B eutectic alloys. Appl. Phys. A 2017, 123, 391. [Google Scholar] [CrossRef]
- Zhao, X.; Wang, C.; Zheng, H.; Tian, Z.; Hu, L. The role of liquid-liquid transition in glass formation of CuZr alloys. Phys. Chem. Chem. Phys. 2018, 19, 15962–15972. [Google Scholar] [CrossRef] [PubMed]
- Tsepelev, V.S.; Starodubtsev, Y.N. Nanocrystalline soft magnetic iron-based materials from liquid state to ready product. Nanomatarials 2021, 11, 108. [Google Scholar] [CrossRef] [PubMed]
- Tsepelev, V.; Starodubtsev, Y.; Konashkov, V.; Wu, K.; Wang, R. Melt viscosity of nanocrystalline alloys in the model of free volume. J. Alloys Comp. 2019, 790, 547–550. [Google Scholar] [CrossRef]
- Popel, S.I. Surface Phenomena in Melts; Metallurgiya: Moscow, Russia, 1994; pp. 48–68. [Google Scholar]
- Egry, I.; Ricci, E.; Novakovic, R.; Ozawa, S. Surface tension of liquids metals and alloys—Recent developments. Adv. Colloid Interface Sci. 2010, 159, 198–212. [Google Scholar] [CrossRef] [PubMed]
- Ruban, A.V.; Skriver, H.L.; Nørskov, J.K. Surface segregation energy in transition-metal alloys. Phys. Rev. B 1999, 59, 15990–16000. [Google Scholar] [CrossRef] [Green Version]
- Mills, K.S.; Karagadde, S.; Lee, P.D.; Yuan, L.; Shahbazian, F. Calculation of physical properties for use in models of continuous casting process—Part 2: Steels. ISIJ Int. 2016, 56, 274–281. [Google Scholar] [CrossRef]
- Tsepelev, V.; Konashkov, V.; Starodubtsev, Y.; Belozerov, Y.; Gaipisherov, D. Optimum regime of heat treatment of soft magnetic amorphous materials. IEEE Trans. Magn. 2012, 48, 1327–1330. [Google Scholar] [CrossRef]
- Starodubtsev, Y.N.; Tsepelev, V.S.; Tsepeleva, N.P. Kinematic viscosity of multicomponent FCuNbSiB-based melts. Nanomaterials 2021, 11, 1042. [Google Scholar] [CrossRef] [PubMed]
- Glasstone, S.; Laidler, K.; Eyring, H. The Theory of Rate Processes; The Kinetics of Chemical Reactions, Viscosity, Diffusion and Electrochemical Phenomena; McGraw Hill: New York, NY, USA; London, UK, 1941; pp. 477–551. [Google Scholar]
- Tsepelev, V.S.; Starodubtsev, Y.N.; Wu, K.M.; Kochetkova, Y.A. Nanoparticles size in Fe73.5Cu1Mo3Si13.5B9 melt. Key Eng. Mater. 2020, 861, 107–112. [Google Scholar] [CrossRef]
- Filippov, G.G.; Gorbunov, A.I. Novel approach to selection of practical scale of electronegativity of atoms. Ros. Khim. Zh. 1995, 39, 39–43. [Google Scholar]
- Goldschmidt, H.J. Interstitial Alloys; Butterworths: London, UK, 1967; pp. 88–101. [Google Scholar]
- Bhadeshia, H.K.D.H. Cementite. Int. Mater. Rev. 2020, 65, 1–27. [Google Scholar] [CrossRef] [Green Version]
- Kiessling, R.; Lange, N. Non-Metallic Inclusions in Steel; Metallurgiya: Moscow, Russia, 1978; pp. 23–34. [Google Scholar]
- Keene, B.J. Review of data for surface tension of iron and its binary alloys. Int. Mater. Rev. 1988, 33, 1–37. [Google Scholar] [CrossRef]
Publisher’s Note: MDPI stays neutral with regard to jurisdictional claims in published maps and institutional affiliations. |
© 2021 by the authors. Licensee MDPI, Basel, Switzerland. This article is an open access article distributed under the terms and conditions of the Creative Commons Attribution (CC BY) license (https://creativecommons.org/licenses/by/4.0/).