Abstract
A new approach method has been studied for the efficient and accurate prediction of high-entropy alloys (HEAs) properties. The artificial neural network (ANN) algorithm was employed to predict the mechanical properties such as yield strength, microstructure, and elongation of the alloy by training from the mole fraction and post-process information that has an influence on the mechanical properties. The mean error rate of prediction for the yield strength was 19.6%. Microstructure predictions were consistent for all test data. On the other hand, the ANN model trained only with mole fraction data had a yield strength prediction error of 33.9%. Omission of post-process data caused a decrease in the accuracy. In addition, the prediction was performed with the lasso regression model in the same way. The mean error rate of the lasso model trained with only a mole fraction was 26.1%. The lasso model trained with a mole fraction and post-process data had a yield strength prediction error of 31.1%. The linear regression equation showed limitations, as the accuracy decreased as the number of independent variables increased. As there are more variables affecting metal properties, the ANN approach is more advantageous, and the more data there are, the more accuracy increases, making it possible to design HEAs alloys that are simpler and more efficient than conventional methods. This approach predicted HEAs properties using only mole fraction and post-processing information, without the need to use conventional physicochemical theories or perform derived complex calculations.
1. Introduction
High-entropy alloys (HEAs) are alloys that are formed by mixing equal or relatively large proportions of usually five or more elements. HEAs systems are in contrast to traditional alloys, which contain just one or two primary constituent chemical species. As a result of their unique microstructure and properties, these HEAs have attracted the research interest of the scientific community and have been under development. However, there are thousands of combinations for experiments with all elements including mole fractions. It is impossible to carry out experiments in all cases. An empirical design through trial and error has been replaced by computer-based alloy designs. In terms of the formulation and accuracy of the predictive model, most of it comes from experimental data, which requires a significant amount of experimental input. HEAs have been generally known to require high entropy to obtain a stable phase of a single solid solution [1]. Atomic size mismatch, mixed enthalpy, valence electron concentration, and thermodynamic parameters have been studied for the purpose of predicting these HEA properties [2,3,4,5]. The calculation of phase diagram (CALPHAD) which consists of thermodynamic databases from extensive experimental and thermodynamic calculations based on Gibbs free energy has been studied [6,7,8]. The molecular dynamics simulation method also has been used to predict alloy properties [9]. The method of predicting properties through thermodynamic calculations requires calculating various indices that determine HEA properties such as the parameters of the entropy of mixing, enthalpy of mixing, atomic size difference, valence electron concentration, Allen, and Pauling electronegativity every time the component ratio changes [10]. However, these methods do not always derive accurate results. In addition, calculations require exclusive software or equipment.
In this study, based on the ANN algorism, we propose an efficient framework for selecting the optimal component elements and post-process conditions in the most important step, HEA design. Research on efficient alloy design by machine learning has been performed. Manzoor et al. [11] used machine learning and density functional theory calculations to predict the vibrational entropy of FCC solids and reduce complex computations. Zhang et al. [12] studied the prediction accuracy of the phase formation problem of HEAs using genetic algorithms. Pei et al. [13] predicted 93% of the formation of the solid solution by machine learning. HEA is being studied not only in the metallurgical industry but also in the medical field because of its superior properties such as high strength, high ductility, corrosion resistance, and thermal stability compared to other alloys [14,15,16]. If the mole fraction of elements and process conditions required to obtain the properties of HEA can be known in advance, the number of experiments can be reduced in the design stage. As input data for ANN learning, mole fraction and post-process data were used. In order to improve the model prediction performance even with a small dataset, the accuracy was verified through the model optimization process. The ANN prediction model showed a similar prediction tendency to the linear regression method compared to the lasso regression model, and the effects of variables on the alloy properties were compared. As the number of variables and data increased, the ANN prediction model made more accurate predictions. This methodology greatly simplifies calculation and opens a new way to predict the properties of HEA with less data, which can be utilized to predict properties in advance through alloy design.
2. Methodology
2.1. HEAs Data Information
From the reference [9,14,15,16,17,18,19,20,21,22,23,24,25,26,27,28,29,30,31,32,33,34,35,36,37], the experimental data for various HEAs were collected to train the model for predicting HEA characteristics. The collected data are mole fraction, post-process information, yield strength, phase, and elongation. There are two groups of HEA: the refractory metal group consisting of Al, Hf, Nb, Ta, Ti, Zr, V, Mo, and W, and the transition group containing Al, Co, Cr, Fe, Ni, Cu, and Mn. All data were obtained after the casting process. Post-process data were arranged in order heat treatment, cooling condition, cold-roll conditions, hot-roll conditions, heat treatment, forging condition, hot isostatic pressing (HIP) conditions, and heat treatment. For the post-process that did not proceed, the 0 value was put. The reason that the heat treatment condition is in three columns is that there are cases in which heat treatment is performed after each post-process is finished. These post-process and mole fraction data were used as input data for training the ANN prediction model. Yield strength, elongation, and microstructure were set as the output data to predict. The training data set was a total of 36 data. After the model was derived, 8 test data were used to evaluate the accuracy of metal group data. All data are shown in Table 1.

Table 1.
Collected data set of high-entropy alloys mole fraction with post-process conditions and properties results data used for input and output in an artificial neural network prediction model.
2.2. Data Preprocessing and Model Evaluation
From the collected data, three ANN models were derived based on three result data such as yield strength, microstructure, and elongation. These are the alloy properties that are basic information of metal alloy to use in mechanical systems. The three models are independent models because each model has different weights and biases even though they are using same input data. Yield strength and elongation prediction models are predicting the results as numeric. The output of the microstructure phase was encoded according to FCC, BCC, and FCC + BCC. When predicting the microstructure phase, the results were expressed as probabilistic using the softmax algorithm. All data have been normalized to a range of 0–1 with a maximum of 1 and a minimum of 0. Normalizing is expressed as shown in Equation (1).
where and are the maximum and minimum values of descriptor of our training data, respectively.
A mean square error (MSE) was used to estimate the accuracy of the prediction model. Until MSE value is minimized through a training data set, weights and biases are updated repeatedly. MSE is expressed as in Equation (2).
where is measured output data from the result of alloy analysis in previous research. is a calculated output data from the prediction model. i is the test number in Table 1, Table 2 and Table 3.
Table 2.
Particular parameter used in artificial neural network prediction model on all layers.
Table 3.
The prediction results of high-entropy alloy phases.
Optimization Process for ANN Prediction Model
A total of 36 input data that consist of a mole fraction and post-process information are used as input data. When the hidden layer of the model was one layer, the model was evaluated by increasing the number of nodes from 1 to 100 by 1. In the case of two hidden layers, the model was evaluated by increasing the number of nodes from 1 to 50 by 1 in each layer. The results of the two models were evaluated by recording the MSE value and mean error value. The results of the model optimization process are shown in Figure 1.
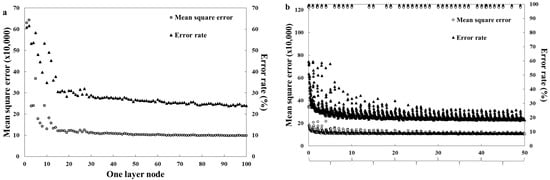
Figure 1.
Accuracy change according to the number of nodes. (a) In the case of one hidden layers; (b) In the case of two hidden layers.
An optimal model size should be found in the ANN model to get an accurate prediction model. For the ANN model with one hidden layer, the MSE value decreased as the number of nodes increased. The MSE value converges to 11,000 when the number of nodes is more than 40. The average error rate converges to a value of 24% after 60 nodes. For ANN models with two hidden layers, the accuracy increases rapidly even with a small increase in the number of nodes, regardless of a node number in the first or second layer. The MSE value converges to 100,000, and the mean error converges to 20%. The optimized layer size representing the minimum mean error was (3, 47). The model training process involves choosing the gradient descent optimizer and the type of activation function to find the optimal parameters. In this study, an Adam optimizer was used that was introduced by Diederik P. [37]. Features are a fast search for optimal parameters and high accuracy. ReLU was used as the activation function. ReLU is an activation function for deep neural network algorithms. The parameter values applied to the ANN algorithm are given in Table 2.
2.3. Optimization Process for Lasso Linear Regression Prediction Model
A conventional linear regression is described as shown in Equation (3).
where w [0–n] is the weights to multiply to each independent variable [0–n]. b is a constant called the bias. Each independent variable is multiplied by a weight and added a bias. The calculated prediction result is compared with the actual measurement result by the MSE equation of loss function. The purpose is to find the parameter that minimizes the MSE value through gradient descent. For higher accuracy, these calculations are iteratively calculated to find the optimal parameters of the weights and bias values.
The lasso regression finds the optimal parameters of weight and bias by imposing an L1-norm penalty on the MES equation. This penalty allows the sum of the absolute values of the weights to be minimized so that the weight of a particular independent variable can be zero. Therefore, the influence of the independent variable term that does not have a large effect on a dependent variable is ignored. At this time, the effect of the penalty is adjusted by multiplying the α-constant. In this study, α was set to 0.01. The number of lessons was 10,000. The formula to which we added the L1-norm penalty is given in Equation (4).
where is the weight value, and α is the constant. When the α value is increased, more weights values are zero. In this study, the α value was set at 0.01.
3. Results and Discussion
3.1. Evaluation Predicting Accuracy of ANN Models
Figure 2 shows the prediction results of the ANN model trained by mole fraction and post-process information for eight test data. The mean error rate of yield strength on the test data excluding the training data was 19.6%. The average difference was 205 MPa, and the coefficient of determination was 0.9068. In the elongation model, the mean error was 40.2%, the mean difference was 4.3%, and the coefficient of determination for all data predictions was 0.7950. Yield strength had high accuracy in the prediction of mechanical properties of HEAs than elongation prediction results. This low accuracy for elongation was no different in result between the model trained by all input data and the model trained by only mole fraction data. As for the elongation, the accuracy of prediction was low because there was a difference in the result value depending on the shape of the specimen to be measured or the measurement method. In order to accurately predict the elongation in the future, unification of the measurement method and more independent variables affecting elongation are needed. The results of the microstructure were accurately predicted for all data. The BCC, FCC, and BCC + FCC phases were encoded to (1, 0), (0, 1), and (1, 1) each. The result is shown in Table 3.
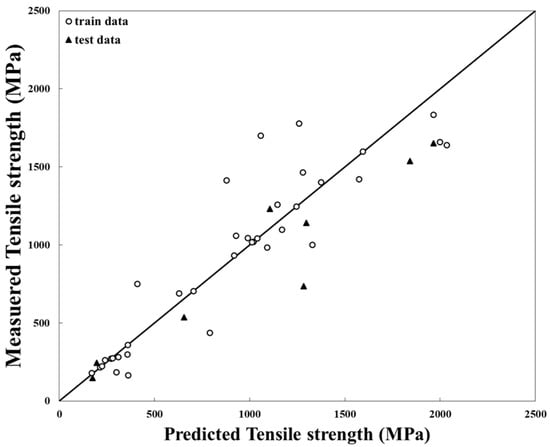
Figure 2.
Accuracy of an ANN model trained with elemental mole fraction and process data.
Figure 3 shows the accuracy of an ANN model trained only on mole fraction information. For the yield strength prediction, the mean error was 33.9%. The mean difference was 241 MPa, and the coefficient of determination was 0.8117. Compared with the results in Figure 2, it had a higher accuracy of prediction results than the model trained with only the mole fraction information. In addition to HEA, existing alloys and metals have a post-process to control the mechanical properties. Even data having the same mole fraction show different mechanical properties depending on the post-process conditions. These facts influenced the accuracy of the model regarding data. The yield strength prediction results of eight test data calculated from both ANN models are given in Table 4.
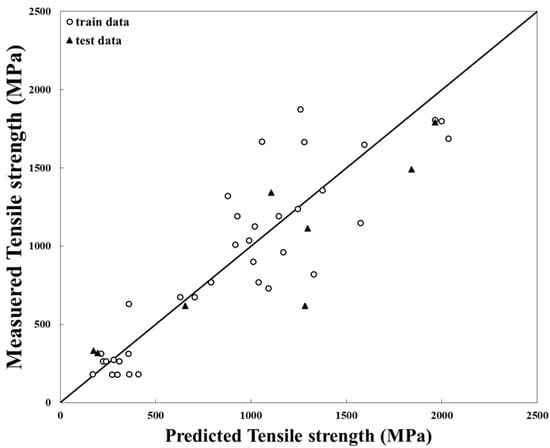
Figure 3.
Accuracy of an ANN model trained only on elemental mole fractions.
Table 4.
Comparison of the predicted results data calculated by the ANN model, which was trained on post-process and mole fraction data vs. mole fraction data.
3.2. Evaluation Predicting Accuracy of Lasso Linear Models
Figure 4 shows the prediction results of the lasso linear model for eight test data. The mean error of yield strength was 31.1%. The mean difference was 233 MPa, and the coefficient of determination was 0.8475. The number of independent variables used in the lasso regression model was 28. The hot rolling rate and forge data’s weights were zero from a total of 30 independent variables. The lasso linear regression model predicted yield strength as 14% of accuracy for 36 training data but showed low accuracy for the eight test data. When new HEA data were input, the output would be low accuracy. Thus, this model cannot be used as a prediction model. Although lasso linear regression is a more improved model than conventional linear regression, it had an error when predicting the yield strength of HEA. The mechanical properties of HEA cannot be expressed as simply linear regression. The HEA model has complex interaction by atomic radius, valance electron concentration, and shear modulus.
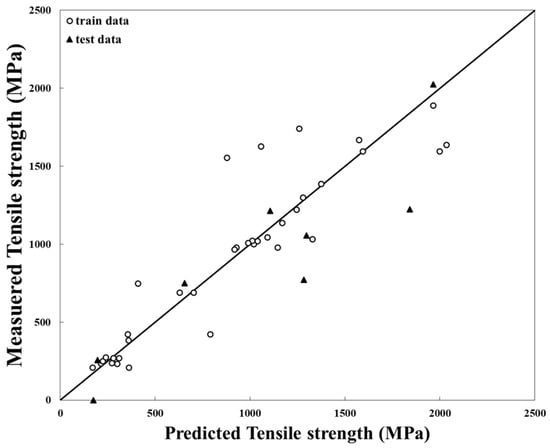
Figure 4.
Accuracy of a lasso model trained with elemental mole fraction and process data.
Figure 5 shows the results of the lasso linear model trained by only mole fraction data. The mean error was 26.1%. The mean difference was 233 MPa, and the coefficient of determination was 0.8363. Compared with the results in Figure 4, the model trained by mole fraction information showed higher accuracy than the model trained by the mole fraction and post-process data to predict the mechanical properties of HEA. This result is contrary to the prediction result of the ANN model. As the many numbers of independent variables increased, the inaccuracy of the calculation result was also increasing. Due to this feature of the linear regression method, it was difficult to express complex data in a linear model. Despite imposing a lasso penalty that made the insignificant independent variable zero, the lasso linear model with a few independent variables of the only mole fraction was more accurate. The yield strength prediction results of eight test data calculated from both lasso linear models are given in Table 5.

Figure 5.
Accuracy of a lasso model trained only on elemental mole fractions.
Table 5.
Comparison of the predicted results data calculated by the lasso linear model, which was trained by post-process and mole fraction data vs. mole fraction data.
3.3. Effect of Process Input Data on Transition Metals and Refractory Metals
In Table 4, when the results of the refractory metal group and the transition metal group were calculated separately, the results accuracy calculated from a model trained by mole fraction and post-process information was higher than that of the model trained by only mole fraction. The transition metal group improved the accuracy by 25.0% from 52.0% to 27.0%. The refractory metal group improved the accuracy by 1.9% from 15.9% to 14.0%. In particular, the transition metal showed significant improvement. The characteristic of the transition metal group is basically a group with a low yield strength. Yield strength is largely changed according to post-treatment process conditions. To get higher prediction accuracy of the transition metal group, post-process information that has more effect on the mechanical properties was important. When post-process information is more detailed, such as at a big data level, the accuracy of the prediction model is likely to improve. The lasso prediction results in Table 5 showed the opposite results to the ANN prediction results. In the transition metal group, the error rate of the model trained only with the mole fraction was 34%, and the model trained with the post-process showed an error rate of 46%, which actually decreased the accuracy by 12%. Similarly, the refractory metal group showed a 2% reduction in error rate from 18% to 16%. This result also reflected the character of the linear regression equation through which the prediction accuracy decreases as the number of variables increases.
3.4. Assessment of the Influence of Elements in Alloys
Figure 6 shows the coefficient ratio of each variable in the lasso regression analysis derived from only element data. The absolute value of the coefficient is expressed as a percentage, and the coefficient having a negative value is indicated as a minus in the variable name. It is correct to derive the model by dividing the transition and refractory groups, but since the elements included in the alloy are often manufactured by mixing them, they were used as input data without classifying all elements. Mn and W are not indicated because the coefficients are 0, as the characteristics of the lasso regression analysis make the coefficients 0 if there is no influence. Elements that had a positive effect on strength were Al, Mo, Zr, Ti, Ta, Cu, and Cr, whereas elements that had a negative effect were V, Nb, Hf, Ni, Co, and Fe.
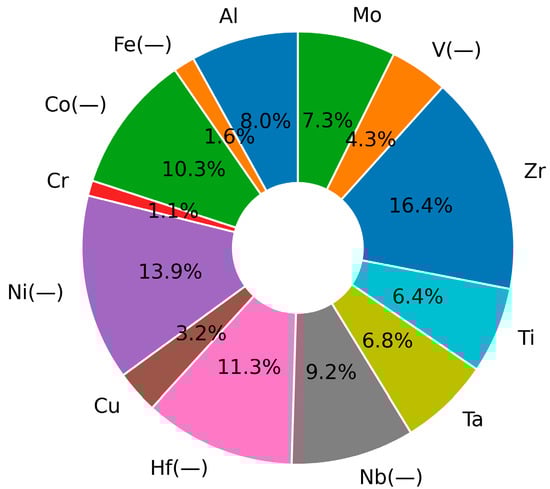
Figure 6.
Influence of coefficients in the lasso regression model.
Table 6 shows the effect of the change of each variable value on the yield strength in the ANN model derived from elemental data and process data. These data are obtained by calculating the value that changes when 1 is increased in the normalized data. It is similar to the coefficient value of each variable derived from lasso regression. Unlike lasso regression, the effect of the same element on the 44 data used for training and testing each piece of data is different for each piece of data. Due to the nature of the neural network, each and every datum has an effect on all nodes, resulting in a yield strength value, so the correlation between input variables is strong. Elements that had a positive influence on strength were Al, Cr, Cu, Nb, Ta, Ti, Zr, Mo, and W, whereas elements that had a negative influence were Co, Fe, Ni, Mn, Hf, and V. Compared with the lasso regression analysis, only Nb elements showed different results, but other elements showed the same results. In Table 6, the ratio of whether the effect of a specific element on the yield strength is positive or negative for each data is shown. The effect of each element on the yield strength of the alloy was confirmed similarly, but the ANN model shows higher accuracy because it reflects the different correlations due to different elements and post-process for each data. In the case of Cr, the yield strength increased as the amount of Cr increased in most HEAs, but the 28 AlCoCrCuFeNi and eight Al0.5CoCrCuFeNi alloys in Table 6 resulted in a decrease in yield strength. This was the result of a complex causal relationship.
Table 6.
Yield strength prediction data set that changes when the input data increases by 1.
In TiZrHfNbX (X = V or Cr) HEA, the yield strength was increased when the Cr element was added instead of the V element [28]. The fact that the V element lowers the yield strength was similar to the conclusion calculated from the ANN and lasso model. In addition, the effect of Al on Al CoCrFeNi HEA was found to be positive. At low Al content, the alloys form FCC structures. When the Al amount is continuously increased, the formation of the BCC phase has been induced. It also increases the strength of the HEA with a modulated spinodal structure. The complete spinodal structure can be obtained in amounts of Al0.9-2.0. The cast Al0.9 alloy has a maximum hardness of HV 527 due to the optimal radial decomposition and interconnecting structure [38]. Positively affecting elements such as Al had the same positive effects on other HEAs. In addition, elements such as Fe, Ni, and Co also had a negative effect on other alloys.
In the post-process data of Table 6, the size of the data set is small, and inaccurate results are often shown. The HIP process reduces the tensile strength due to grain coarsening in AlxCoCrFeNi alloy of the transition metal group [39]. Table 6 also shows that hot isostatic pressing has a negative effect on yield strength. However, similar to other heat treatment temperatures, it is difficult to obtain accurate and detailed results because the experimental data by temperature or time conditions are not trained. In the case of trend prediction, cold rolling and forge were confirmed as variables to improve the tensile strength. This process is known to increase the yield strength of metals through work hardening. In the case of heat treatment, the result was that the tensile strength decreased as the temperature increased and the tensile strength increased with time. This result is also difficult to be trusted due to the lack of heat treatment data, and more accurate results can be obtained when more data are collected in the future.
4. Conclusions
In this paper, a new methodology for predicting the mechanical properties of HEA is proposed. The design of HEA is complicatedly entangled with material theories including thermodynamic and physical relationships between constituent elements and post-processing. To approach this process efficiently, the mechanical properties of the alloy were predicted using only the mole fraction and post-process data using the ANN algorithm. The main results are as follows:
- The ANN prediction model showed high accuracy only when learning the post-process data together; the tensile strength showed an error rate of 19.7%, and the microstructure was consistent in all test data. Elongation prediction showed a high error rate of 40.2%.
- In the case of the lasso linear regression, the error rate of the model trained with post-processing data was 31.1%, and the error rate of the lasso model trained only on the mole fraction was 26.1%, showing low accuracy. The linear regression model did not sufficiently reflect the complex causal relationships in the data as the variable increased.
- When post-process data were trained with the element mole fraction, the model error rate decreased from 15.9% to 14% in the refractory metal group, and the error rate of the transition metal group decreased from 52% to 27% in the transition metal group. In contrast, the lasso model showed the opposite trend.
- In the ANN model, Al, Cr, Cu, Nb, Ta, Ti, Zr, Mo, and W increased the strength as these components increased, and Co, Fe, Ni, Mn, Hf, and V decreased the tensile strength. In the lasso model, the same results were obtained except for Nb. In addition, in the post-process, cold rolling and forging improved the tensile strength.
Author Contributions
Conceptualization, S.C.; methodology, S.C.; software, S.C.; validation, S.Y. and B.S.; formal analysis, J.K.; investigation, S.C.; writing—original draft preparation, S.C.; writing—review and editing, S.H.; supervision, S.Y. All authors have read and agreed to the published version of the manuscript.
Funding
This research received no external funding.
Institutional Review Board Statement
Not applicable.
Informed Consent Statement
Not applicable.
Data Availability Statement
Data available on request from the authors.
Acknowledgments
This research was supported by the Ministry of Trade, Industry, and Energy (MOTIE) in Korea, under the Fostering Global Talents for Innovative Growth Program (P0008750) supervised by the Korea Institute for Advancement of Technology (KIAT).
Conflicts of Interest
The authors declare no conflict of interest.
References
- Yeh, J.W. Alloy design strategies and future trends in high-entropy alloys. JOM 2013, 65, 1759–1771. [Google Scholar] [CrossRef]
- Singh, S.; Wanderka, N.; Kiefer, K.; Siemensmeyer, K.; Banhart, J. Effect of decomposition of the Cr-Fe-Co rich phase of AlCoCrCuFeNi high entropy alloy on magnetic properties. Ultramicroscopy 2011, 111, 619–622. [Google Scholar] [CrossRef]
- Gao, M.C.; Zhang, B.; Guo, S.M.; Qiao, J.W.; Hawk, J.A. High-entropy alloys in hexagonal close-packed structure. Metall. Mater. Trans. A 2016, 47, 3322–3332. [Google Scholar] [CrossRef]
- Zhang, C.; Zhang, F.; Chen, S.; Cao, W. Computational thermo.dynamics aided high-entropy alloy design. JOM 2012, 64, 839–845. [Google Scholar] [CrossRef]
- Domìnguez, L.A.; Goodall, R.; Todd, I. Prediction and validation of quaternary high entropy alloys using statistical approaches. Mater. Sci. Technol. 2015, 31, 1201–1206. [Google Scholar]
- Senkov, O.N.; Miller, J.D.; Miracle, D.B.; Woodward, C. Accelerated exploration of multi-principal element alloys for structural applications. Calphad 2015, 50, 32–48. [Google Scholar] [CrossRef]
- Tazuddin; Gurao, N.P.; Biswas, K. In the quest of single phase multi-component multiprincipal high entropy alloys. J. Alloy. Compd. 2017, 697, 434–442. [Google Scholar] [CrossRef]
- Xie, L.; Brault, P.; Thomann, A.L.; Bauchire, J.M. AlCoCrCuFeNi high entropy alloy cluster growth and annealing on silicon: A classical molecular dynamics simulation study. Appl. Surf. Sci. 2013, 285, 810–816. [Google Scholar] [CrossRef] [Green Version]
- Senkov, O.N.; Woodward, C.F. Microstructure and properties of a refractory NbCrMo0.5Ta0.5TiZr alloy. Mater. Sci. Eng. A 2011, 529, 311–320. [Google Scholar] [CrossRef]
- Osintsev, K.; Konovalov, S.; Gromov, V.; Panchenko, I.; Chen, X. Phase composition prediction of Al-Co-Cr-Fe-Ni high entropy alloy system based on thermodynamic and electronic properties calculations. Mater. Today Proc. 2021, 46, 961–965. [Google Scholar] [CrossRef]
- Manzoor, A.; Aidhy, D.S. Predicting vibrational entropy of fcc solids uniquely from bond chemistry using machine learning. Materialia 2020, 46, 961–965. [Google Scholar] [CrossRef]
- Zhang, Y.; Wen, C.; Wang, C.; Antonov, S.; Xue, D.; Bai, Y.; Su, Y. Phase prediction in high entropy alloys with a rational selection of materials descriptors and machine learning models. Acta Mater. 2019, 185, 528–539. [Google Scholar] [CrossRef]
- Pei, Z.; Yin, J.; Hawk, J.A.; Alman, D.E.; Gao, M.C. Machine-learning informed prediction of high-entropy solid solution formation: Beyond the Hume-Rothery rules. Comput. Mater. 2020, 6, 50. [Google Scholar] [CrossRef]
- Daoud, H.M.; Manzoni, A.; Volkl, R.; Wanderka, N.; Glatzel, U. Microstructure and tensile behavior of Al8Co17Cr17Cu8Fe17Ni33 (at.%) high-entropy alloy. JOM 2013, 65, 1805–1814. [Google Scholar] [CrossRef]
- Wang, F.J.; Zhang, Y.; Chen, G.L.; Davies, H.A. Tensile and compressive mechanical behavior of a CoCrCuFeNiAl0.5 high entropy alloy. Int. J. Mod. Phys. B 2009, 23, 1254–1259. [Google Scholar] [CrossRef]
- Stepanov, N.D.; Shaysultanov, D.G.; Salishchev, G.A.; Tikhonovsky, M.A. Structure and mechanical properties of a light-weight AlNbTiV high entropy alloy. Mater. Lett. 2015, 142, 153–155. [Google Scholar] [CrossRef]
- Senkov, O.N.; Scott, J.M.; Senkova, S.V.; Meisenkothen, F.; Miracle, D.B.; Woodward, C.F. Microstructure and elevated temperature properties of a refractory TaNbHfZrTi alloy. J. Mater. Sci. 2012, 47, 4062–4074. [Google Scholar] [CrossRef]
- Yang, X.; Zhang, Y.; Liaw, P.K. Microstructure and compressive properties of NbTiVTaAlx high entropy alloys. Procedia Eng. 2012, 36, 292–298. [Google Scholar] [CrossRef] [Green Version]
- Wu, Z.; Bei, H.; Pharr, G.M.; George, E.P. Temperature dependence of the mechanical properties of equiatomic solid solution alloys with face-centered cubic crystal structures. Acta Mater. 2014, 81, 428–441. [Google Scholar] [CrossRef]
- Kuznetsov, A.V.; Shaysultanov, D.G.; Stepanov, N.D.; Salishchev, G.A.; Senkov, O.N. Tensile properties of an AlCrCuNiFeCo high-entropy alloy in ascast and wrought conditions. Mater. Sci. Eng. A 2012, 533, 107–118. [Google Scholar] [CrossRef]
- Shun, T.T.; Du, Y.C. Microstructure and tensile behaviors of FCC Al0.3CoCrFeNi high entropy alloy. J. Alloy. Compd. 2009, 479, 157–160. [Google Scholar] [CrossRef]
- Senkov, O.N.; Wilks, G.B.; Scott, J.M.; Miracle, D.B. Mechanical properties of Nb25Mo25Ta25W25 and V20Nb20Mo20Ta20W20 refractory high entropy alloys. Intermetallics 2011, 19, 698–706. [Google Scholar] [CrossRef]
- Ng, C.; Guo, S.; Luan, J.; Wang, Q.; Lu, J.; Shi, S.; Liu, C.T. Phase stability and tensile properties of Co-free Al0.5CrCuFeNi2 high-entropy alloys. J. Alloy. Compd. 2014, 584, 530–537. [Google Scholar] [CrossRef]
- Fazakas, E.; Zadorozhnyy, V.; Varga, L.K.; Inoue, A.; Louzguine-Luzgin, D.V.; Tian, F.; Vitos, L. Experimental and theoretical study of Ti20Zr20Hf20Nb20X20 (X ¼ V or Cr) refractory high-entropy alloys. Int. J. Refract. Met. Hard Mater. 2014, 47, 131–138. [Google Scholar] [CrossRef]
- Senkov, O.N.; Senkova, S.V.; Miracle, D.B.; Woodward, C. Mechanical properties of low-density, refractory multi-principal element alloys of the Cr–Nb–Ti–V–Zr system. Mater. Sci. Eng. A 2013, 565, 51–62. [Google Scholar] [CrossRef]
- Otto, F.; Dlouhy, A.; Somsen, C.; Bei, H.; Eggler, G.; George, E.P. The influences of temperature and microstructure on the tensile properties of a CoCrFeMnNi high-entropy alloy. Acta Mater. 2013, 61, 5743–5755. [Google Scholar] [CrossRef] [Green Version]
- Senkov, O.N.; Woodward, C.; Miracle, D.B. Microstructure and properties of aluminum-containing refractory high-entropy alloys. JOM 2014, 66, 2030–2042. [Google Scholar] [CrossRef]
- Senkovab, O.N.; Semiatina, S.L. Microstructure and properties of a refractory high-entropy alloy after cold working. J. Alloy. Compd. 2015, 649, 1110–1123. [Google Scholar] [CrossRef]
- Galiab, A.; Georgeab, E.P. Tensile properties of high- and medium-entropy alloys. Intermetallics 2013, 39, 74–78. [Google Scholar]
- Senkov, O.N.; Senkova, S.V.; Woodward, C. Effect of aluminum on the microstructure and properties of two refractory high entropy alloys. Acta Mater. 2014, 68, 214–228. [Google Scholar] [CrossRef]
- Guo, N.N.; Wang, L.; Luo, L.S.; Li, X.Z.; Su, Y.Q.; Guo, J.J.; Fu, H.Z. Microstructure and mechanical properties of refractory MoNbHfZrTi high-entropy alloy. Mater. Des. 2015, 81, 87–94. [Google Scholar] [CrossRef]
- Gludovatz, B.; Hohenwarter, A.; Catoor, D.; Chang, E.H.; George, E.P.; Ritchie, R.O. A fracture-resistant high-entropy alloy for cryogenic applications. Science 2014, 345, 1153–1158. [Google Scholar] [CrossRef] [PubMed] [Green Version]
- Wu, Y.D.; Cai, Y.H.; Wang, T.; Si, J.J.; Zhu, J.; Wang, Y.D.; Hui, X.D. A refractory Hf25Nb25Ti25Zr25 high-entropy alloy with excellent structural stability and tensile properties. Mater. Lett. 2014, 130, 277–280. [Google Scholar] [CrossRef]
- Yang, X.; Zhang, Y. Prediction of high-entropy stabilized solid-solution in multicomponent alloys. Mater. Chem. Phys. 2012, 132, 233–238. [Google Scholar] [CrossRef]
- Hemphilla, M.A.; Yuanb, T.; Wanga, G.Y.; Yehc, J.W.; Tsaic, C.W.; Chuanga, A.; Liawa, P.K. Fatigue behavior of Al0.5CoCrCuFeNi high entropy alloys. Acta Mater. 2012, 60, 5723–5734. [Google Scholar] [CrossRef]
- Tsai, C.W.; Tsai, M.H.; Yeh, J.W.; Yang, C.C. Effect of temperature on mechanical properties of Al0.5CoCrCuFeNi wrought alloy. J. Alloy. Compd. 2010, 49, 160–165. [Google Scholar] [CrossRef]
- Diederik, P.K.; Jimmy, L.B. ADAM: A Method For Stochastic Optimization. arXiv 2014, arXiv:1412.6980. [Google Scholar]
- Wang, W.R.; Wang, W.L.; Wang, S.C.; Tsai, Y.C.; Lai, C.H.; Yeh, J.W. Effects of Al addition on the microstructure and mechanical property of AlxCoCrFeNi high-entropy alloys. Intermetallics 2012, 26, 44–51. [Google Scholar] [CrossRef]
- Joseph, J.; Hodgsona, P.; Jarvisb, T.; Wub, X.; Stanfordc, N.; Fabijanica, D.K. Effect of hot isostatic pressing on the microstructure and mechanical properties of additive manufactured AlxCoCrFeNi high entropy alloys. Mater. Sci. Eng. A 2018, 733, 59–70. [Google Scholar] [CrossRef]
Publisher’s Note: MDPI stays neutral with regard to jurisdictional claims in published maps and institutional affiliations. |
© 2021 by the authors. Licensee MDPI, Basel, Switzerland. This article is an open access article distributed under the terms and conditions of the Creative Commons Attribution (CC BY) license (https://creativecommons.org/licenses/by/4.0/).