Abstract
The article presents a detailed study and characterization of the oxide layers on the surface of iron particles of various sizes. Ten iron samples with a size range from a few nm to 50 µm were studied in detail using SEM, TEM, XRD, and TGA analysis. The composition of the multiphase oxide layers on the powder surface was investigated. The main components of the oxide layer were FeO, Fe3O4, and Fe2O3. By the obtained data, a model for the calculation of a multiphase oxide layer thickness on the surface of iron particles was proposed. The proposed model was validated and can be used for the characterization and certification of micro– and nanoscale iron particles.
1. Introduction
Nanotechnology and nanostructured materials have become highly popular at the end of the last century when common engineering materials reach their application limits. Since that, nanomaterials are of great interest by virtue of their unusual mechanical, electrical, optical, and magnetic properties in a highly-dispersed state as well as the potential to create new and innovative products [1,2,3]. Nanostructured materials are currently used in almost all innovative products-from coatings and composites to structural and functional elements. That is why the study of nanomaterials characteristics and regulation of their physical and chemical properties is an important task of modern materials science [4,5,6,7].
One of the most actively developing areas of nanomaterial science is the study of iron group transition metals and two-component systems based on them [8,9,10,11,12]. Increased attention to these objects is usually caused by the peculiarities of magnetic properties. Iron nanoparticles and materials based on them have some advances such as high saturation magnetization values in relatively low magnetic fields, short remagnetization times, and the possibility of varying the magnitude of the coercive force when doping materials [13,14,15,16]. Iron nanoparticles are also actively used for the production of catalysts, information storage systems, current sources, solar panels, and other high-tech products [17,18,19,20].
As is well known, nanoparticles have a developed surface and can react with various substances contained in the environment, in particular oxygen, moisture, organic compounds, and so on [21,22,23]. During this process, intensive chemical transformations occur on highly developed surfaces of nanoscale powders, including the formation of oxide layer [24,25,26]. A number of nanomaterials, including iron nanoparticles, are used as pyrophoric substances and chemically active materials [27,28], thus an oxide layer formation on their surface can significantly narrow the range of their applications. In this regard, the mechanisms of surface layer formation on nanoparticles and the properties of the oxide layer is an urgent and important research task [29,30].
Potential novel applications of iron nanoparticles and the possibility of adjusting their reactivity causing many fundamental and applied studies devoted to change in their properties with their size as well as oxidation with the formation of a surface layer [31,32,33]. However, a reliable calculation method of oxide layer thickness on the nanoparticles of various metals has not yet been developed. The oxide layer can be visualized and evaluated using high-resolution transmission electron microscopy. However, the use of transmission electron microscopy for nanoparticle certification has a number of limitations: (i) low prevalence and high cost of such microscopes; (ii) specific requirements for research objects and difficult analysis procedure; (iii) localization of analysis results. In previous studies [34,35,36,37], some methods for determining the thickness of the oxide layer on the surface of metal particles, including iron particles, were proposed. These methods were based on TEM, XPS, chemical oxidation, gas adsorption, etc. and according to the results obtained, the proposed methods had good convergence between the calculated and practical values. However, these methods, as a rule, did not take into account the thickness of a single layer in the multiphase oxide layer and did not include thermogravimetry analysis data for calculations. Therefore, this work aimed to study multiphase oxide layer on the surface of the iron nanoparticles of various sizes. The outcome of this study is the basis of a simpler model for determining the thickness of a multiphase oxide layer on nanoscale iron powders based on the thermogravimetry analysis data. This proposed calculation method was validated and can be used for the characterization of iron micro- and nanoparticles.
2. Materials and Methods
Ten iron-containing powders were used for the research. The sample codes and corresponding information about the synthesis methods are presented in Table 1.

Table 1.
Description of initial powder samples.
Some samples (m-Fe_01; m-Fe_02; n-FeO_01; n-FeO_02; n-Fe2O3_01) were purchased from manufacturers of iron-containing powders. All purchased powders were manufactured in strict accordance with technical standards (see Table 1).
Synthesis of n-Fe2O3_02 sample was carried out by using spray pyrolysis [38,39]. An aerosol was made from a Fe(NO3)3 solution (10 wt.%) using an ultrasonic powder dispenser. The prepared aerosol was fed by an air stream into the RT 50/250/13 Nabertherm tube furnace and decomposed to produce iron (III) oxide according to Equation (1):
4Fe(NO3)3 → 2Fe2O3 + 12NO2 + 3O2.
The n–Fe(OH)3 sample was obtained by precipitation as a result of iron chloride and an aqueous solution of ammonia interaction (2):
FeCl3 + 3NH3 + 3H2O = Fe(OH)3 + 3NH4Cl
The n–FeOOH sample was obtained by precipitation of iron hydronitrate (Fe(NO3)3 9H2O) using the method described in [40]. Samples of n–Fe(OH)3 and n–FeOOH were obtained by the same method while the only difference between them was reagents. In the first case (n–Fe(OH)3), iron chloride was used as an initial salt and ammonium hydroxide was used as precipitator. In the second case (n–FeOOH), iron hydronitrate was used as an initial salt and sodium hydroxide was used as the precipitator.
Samples n-Fe_01 and n-Fe_02 were synthesized by chemical precipitation from various iron salts according to the method described in [23,40]. The used method was based on the interaction of iron salts with alkali to form iron hydroxides. The resulting hydroxides were subjected to heat treatment to produce iron oxides, which were subsequently reduced in a hydrogen atmosphere and were stored in the laboratory for the past few years. These samples were used to estimate the thickness of the oxide layer after long-term storage.
Iron oxides, hydroxides, and iron powder were reduced in a hydrogen atmosphere at 450 °C to produce iron powders. Heat treatment also resulted in the removal of iron salt residues from the powders. Then the powders were passed in a nitrogen atmosphere and an oxide layer was formed on their surface. For the passivation process, technical nitrogen with dissolved oxygen was used, so an oxide layer was formed on the particles. Reduction conditions of powders and their designations are shown in Table 2.
Table 2.
Reduction conditions of iron-containing powders.
The samples were reduced under non-isothermal conditions. The heating time (recovery time) was 90 min. After reaching the temperature of 450 °C, the heating was stopped and the flow of hydrogen was blocked. Then technical nitrogen was added to the working chamber of the furnace for passivation.
The morphology of the powders was studied using the Tescan Vega 3SB scanning electron microscope (SEM) and the LEO 912 AB transmission electron microscope (TEM). The average particle diameters were calculated using the ImageJ software. Qualitative phase analysis was performed on the Difrey-401 X-ray diffractometer using Cr-Kα radiation. The number of oxide phases in the samples was estimated using thermogravimetry (TGA). TGA analysis was performed using a SDT-Q600 thermal analyzer in a hydrogen atmosphere with a heating rate of 10 °C/min. The accuracy of the thermal analyzer was ± 0.5 °C for temperature measurement and ±0.01 µg for mass measurement.
3. Results and Discussion
The results of the qualitative phase analysis of iron powders are shown in Figure 1. According to the results, only two phases (Fe and Fe3O4) were present in the samples m–Fe_01, m–Fe_02, and Fe(n–Fe2O3_02). In the Fe(n–FeO_02) sample synthesized from iron (II) oxide, only Fe phase with the BCC lattice was detected. Three phases (Fe, FeO, and Fe2O3) were observed in the Fe(n–FeOOH) sample synthesized from iron (III) oxide-hydroxide. The XRD patterns of the samples Fe(n–FeO_01) and Fe(n–FeO_02), Fe(n–Fe2O3_01) and Fe(n–Fe2O3_02), Fe(n–Fe(OH)3), and Fe(n–FeOOH) were identical despite different synthesis methods and conditions. An iron phase and three phases of various iron oxides were detected in the n–Fe_01 and n–Fe_02 samples synthesized by chemical precipitation (see Figure 2). Thus, in accordance with the results of qualitative phase analysis, it was found that the studied powders had a different phase composition with different content and ratio of iron oxides.
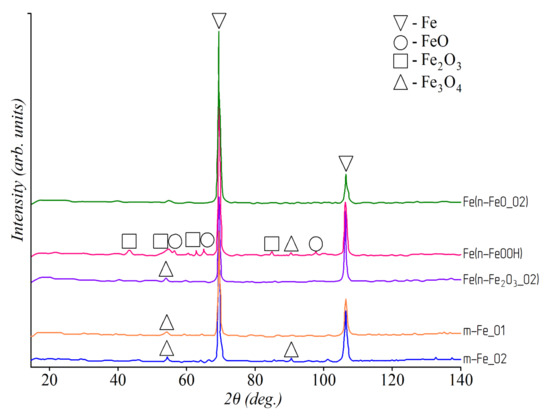
Figure 1.
XRD patterns of studied iron powder samples.
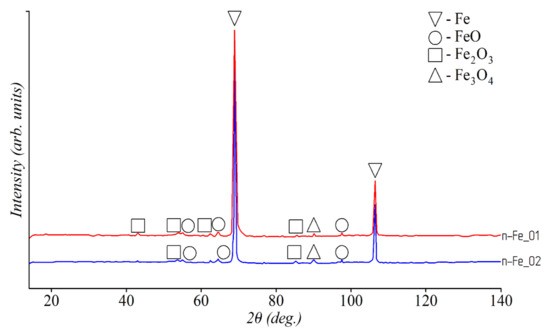
Figure 2.
XRD patterns of n-FeO_01 and n-FeO_02 samples.
The results of TEM analysis (see Figure 3) demonstrated that the Fe(n–Fe2O3_01) sample consisted of nanoparticles agglomerates about 100 nm in size, which were surrounded by an oxide shell. These agglomerates had dissimilar fraction size. Both large and small fractions of about 75 nm and 20 nm, respectively, were detected. The same was detected in the case of Fe(n-Fe(OH)3) sample (see Figure 3b), while the Fe(n–FeO_01) sample was a highly aggregated powder consisting of fine particles with an average size of 100–200 nm (see Figure 3c).
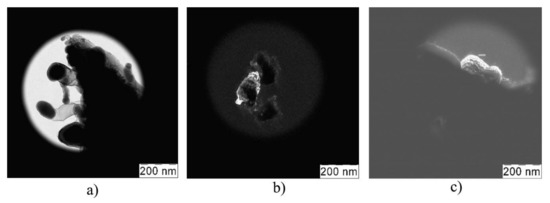
Figure 3.
TEM images of iron samples: Fe(n–Fe2O3_01) (a); Fe(n–Fe(OH)3) (b);Fe(n–FeO_01) (c).
Fe(n-FeOOH), Fe(n–Fe2O3_02), and Fe(n-FeO_02) samples consisted of fine particles with a size of no more than 30 µm (see Figure 4). Fe(n–FeOOH) sample consisted of agglomerated iron nanoparticles with an average size of less than 1 µm. The Fe(n–Fe2O3_02) sample was characterized by a spherical particle shape and an average size of no more than 3 µm. The Fe(n-Fe_02) sample consisted of larger irregularly shaped particles with an average size of 20–30 µm.
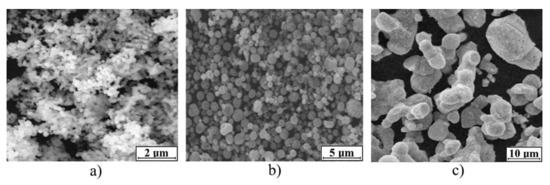
Figure 4.
SEM images of iron samples: Fe(n–FeOOH) (a); Fe(n–Fe2O3_02) (b); Fe(n-FeO_02) (c).
m-Fe_01 and m-Fe_02 samples consisted of rounded particles with an average diameter of 45 µm and 30 µm, respectively (see Figure 5). The n–Fe_01 and n–Fe_02 samples consisted of ultrafine particles of up to 100 nm in size.
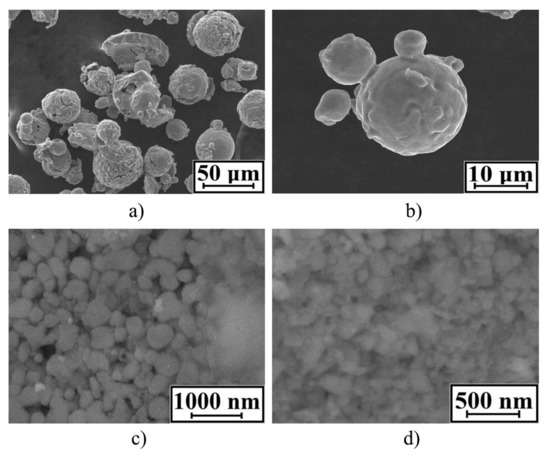
Figure 5.
SEM of iron samples: m–Fe_01 (a); m–Fe_02 (b); n–Fe_01 (c); n–Fe_02 (d).
Figure 6 demonstrates the weight change of the samples during heating in a hydrogen atmosphere. As can be seen, in the case of m-Fe_01, m–Fe_02, n–Fe_01, and n-Fe_02 samples, the weight change was insignificant, which was associated with a high content of metallic iron. In the remaining samples, the beginning of active weight loss was observed at about 300 °C. As is known, the reduction of iron oxides by hydrogen at a temperature below 600 °C proceeds according to the following scheme: Fe2O3 → Fe3O4 → FeO → Fe. Consequently, the sample reduction process was observed between 300 °C and 480 °C.
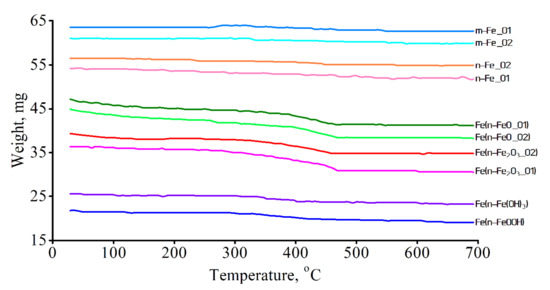
Figure 6.
TGA analysis of iron samples.
The extended TGA curves for the most representative samples are shown in Figure 7. The detected peaks characterized the oxidation degree of iron. In accordance with the obtained data, several types of iron oxides were identified in the studied samples. This fact was also confirmed by the results of the qualitative phase analysis (see Figure 1 and Figure 2). Using the Origin Pro software, the TGA curves were split corresponding to the reduction of each metal oxide (see Figure 8). The content of each metal oxide () was determined by the calculation of the area under each peak of TGA curve.
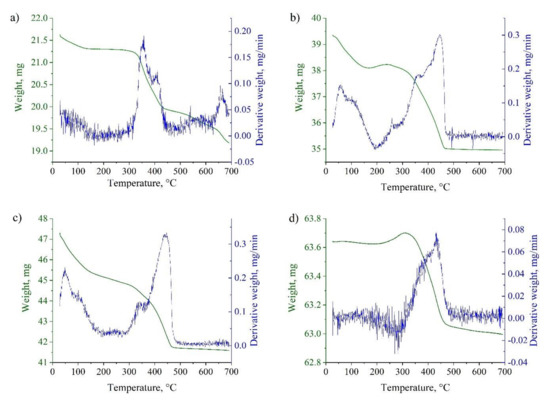
Figure 7.
TGA curves for samples reduction in a hydrogen atmosphere: Fe(n–FeOOH) (a); Fe(n–Fe2O3_01) (b); Fe(n–FeO_02) (c); m–Fe_01 (d).
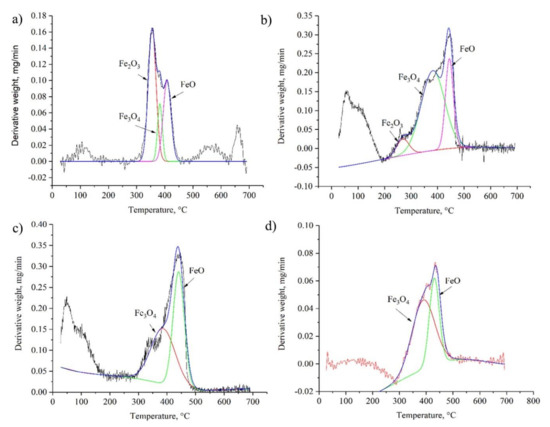
Figure 8.
Split TGA curves: Fe(n–FeOOH) (a); Fe(n–Fe2O3_01) (b); Fe(n–FeO_02) (c); m–Fe_01 (d).
According to previous studies, it was found that iron oxidation is always accompanied by the formation of a multiphase oxide layer [41,42]. The phase composition of the oxide layer may include several oxides: wustite (FexO, where x = 0.836–0.954), magnetite (Fe3O4), and hematite (Fe2O3). To calculate the thickness of the surface layer, the geometry of iron particles was assumed as spherical (see Figure 9). According to the presented model, the volume of the surface oxide layer () was expressed by Equations (3) and (4):
where
—relative volume fraction of an individual oxide phase, %;
V—particle volume, nm3
h and R—thickness and radius of the individual oxide phase, nm (see Figure 9).

Figure 9.
Model for the thickness calculation of a multiphase oxide layer.
According to Equation (3), the volume of the surface layer was equal to the difference between the particle volume and the metal volume and was calculated using the molar fractions of metal oxide in the particle volume (see Equation (4)). When comparing Equations (3) and (4), the equation for the thickness of the oxide layer on the surface of iron particles was obtained (5):
Since the calculation of the thickness of the oxide layer cannot be absolutely precise, an absolute measurement error was determined to explain the accuracy of calculations. By logarithmation and differentiation of Equation (5) to calculate the thickness of the oxide layer on iron particles, the following equation was obtained (6):
By replacing the differential of independent variables with absolute errors, the following equation was obtained for the relative error in determining the thickness of the oxide layer (7):
where ∆R and ∆νMeO is an absolute error in measuring the average linear radius and metal oxide content, respectively.
The relative error in measuring the metal oxide content was 2% while the relative error of measuring the average linear radius according to the SEM and TEM results was 1%. Thus, the calculated relative error in measuring the thickness of a multiphase oxide layer on iron particles was no more than 5%.
Using the proposed model, the thickness of the multiphase oxide layer of the studied samples was calculated. When analyzing the TGA curves, it was found that all the samples under study have at least two maxima. This fact indicated the presence of the multiphase oxide layer in the studied samples as well as a reduction of at least two iron oxides during heating in a hydrogen atmosphere. The results of the oxide layer thickness calculations according to the proposed model are presented in Table 3.
Table 3.
Results of the multiphase oxide layer thickness calculations.
To verify the adequacy of the developed model for determining the thickness of a multiphase oxide layer, the calculated values were compared with electron microscopy data. This comparison showed stable correspondence of the calculated and experimental values. Below we presented a comparison for three most representative samples: n–Fe_02, Fe(n–FeO_01), and Fe(n–FeO_02).
TEM of the n–Fe_02 sample is demonstrated in Figure 10a. Based on the series of TEM analysis, a spherical iron particle with an average linear size of 274 nm was surrounded by a solid oxide layer with an average thickness of 16 nm. Comparing to this, the total thickness (FeO + Fe3O4 + Fe2O3) of the n–Fe_02 sample oxide layer, calculated using the proposed model, was 15.4 nm.
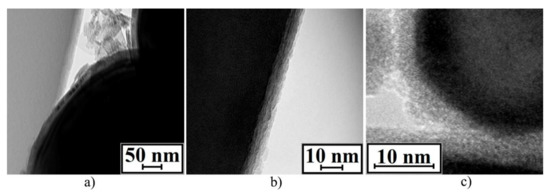
Figure 10.
TEM of oxide layers: n–Fe_02 sample (a); Fe(n–FeO_01) sample (b); Fe(n–FeO_02) sample (c).
According to the TEM analysis of the Fe(n–FeO_01) sample (see Figure 10b), a spherical iron particle with an average linear size of 111 nm was surrounded by a solid oxide layer with an average thickness of 6 nm. In comparison, the total thickness of the oxide layer (FeO + Fe3O4) of the Fe(n–FeO_01) sample, calculated using the proposed model, was equal to 5.7 nm. According to the TEM analysis of the Fe(n–FeO_02) sample (see Figure 10c) a spherical iron particle with an average linear size of 128 nm was surrounded by a solid oxide layer with an average thickness of 4 nm. The total thickness of the Fe(n–FeO_02) oxide layer (FeO + Fe3O4 + Fe2O3) was 3.8 nm according to the proposed model.
Based on the presented results, it can be concluded that the proposed model and direct measurements of the oxide layer thickness on iron particles demonstrated high reproducibility. The difference in the obtained values was related to the locality of electron microscopy and the assumptions made in the proposed method. Overall, it was concluded that the proposed model for calculation of a multiphase oxide layer thickness is adequate and can be used for characterization and certification of micro- and nanoscale iron particles.
4. Conclusions
An oxide layer study for ten different samples of iron particles was investigated. In particular, microscale iron powders (m-Fe_01 and m-Fe_02), nanoscale iron powders (n-Fe_01 and n-Fe_02), and nanoscale iron oxide and hydroxide powders (n-FeO_01, n-FeO_02, n-Fe2O3_01, n-Fe2O3_02, n–Fe(OH)3 and n–FeOOH) were used for the study. Some samples were purchased from manufacturers and a series of samples were synthesized from iron oxides and hydroxides by heating in a hydrogen atmosphere. All samples were subjected to the same heat treatment under non-isothermal conditions to obtain iron particles coated with an oxide layer. The iron particles were carefully characterized using electron microscopy, TGA analysis, and XRD analysis. All presented samples consisted of iron particles surrounded by a multiphase oxide layer. FeO, Fe3O4, and Fe2O3 were the main components of the oxide layer. Based on the presented research, a model for the calculation of a multiphase oxide layer thickness using thermogravimetric analysis data was proposed. The proposed model demonstrated high reproducibility of the calculated data with the results of transmission electron microscopy in the case of iron particles with various sizes and production methods.
Author Contributions
Conceptualization, E.V.Z., E.L.D., E.N.S., and A.Y.N.; Data curation, E.L.D., A.A.V. and I.A.P.; Formal analysis, I.A.P., D.Y.O. and A.A.G.; Investigation, E.V.Z., E.L.D., E.N.S., and A.A.V.; Methodology, E.L.D. and E.N.S.; Supervision, A.Y.N. and A.A.G.; Visualization, A.A.V. and I.A.P.; Writing—original draft, E.V.Z., A.A.V. and A.Y.N.; Writing—review and editing, D.Y.O. and A.A.G. All authors have read and agreed to the published version of the manuscript.
Funding
The research was carried out within the framework of the State assignment # 075-00268-20-02 (ID: 0718-2020-0040) on the topic: «Complex processing of hydrocarbons to produce hydrogen-containing gases and precursors of composite materials for additive manufacturing».
Data Availability Statement
The data presented in this study are available on request from the corresponding author. The data are not publicly available due to privacy.
Acknowledgments
I.A.P. gratefully acknowledges financial support of the Ministry of Science and Higher Education of Russian Federation in the frame work of Increase Competitiveness Program of NUST MISIS.
Conflicts of Interest
The authors declare no conflict of interest.
References
- Jeevanandam, J.; Barhoum, A.; Chan, Y.S.; Dufresne, A.; Danquah, M.K. Review on nanoparticles and nanostructured materials: History, sources, toxicity and regulations. Beilstein J. Nanotechnol. 2018, 9, 1050–1074. [Google Scholar] [CrossRef] [PubMed]
- Chen, Y.; Lai, Z.; Zhang, X.; Fan, Z.; He, Q.; Tan, C.; Zhang, H. Phase engineering of nanomaterials. Nat. Rev. Chem. 2020, 4, 243–256. [Google Scholar] [CrossRef]
- Dang, S.; Zhu, Q.-L.; Xu, Q. Nanomaterials derived from metal-organic frameworks. Nat. Rev. Mater. 2017, 3, 17075. [Google Scholar] [CrossRef]
- Das, I.; Ansari, S.A. Nanomaterials in science and technology. J. Sci. Ind. Res. 2009, 68, 657–667. [Google Scholar]
- Wu, W. Inorganic nanomaterials for printed electronics: A review. Nanoscale 2017, 9, 7342–7372. [Google Scholar] [CrossRef]
- Charitidis, C.A.; Georgiou, P.; Koklioti, M.A.; Trompeta, A.-F.; Markakis, V. Manufacturing nanomaterials: From research to industry. Manuf. Rev. 2014, 1, 11. [Google Scholar] [CrossRef]
- Wu, Q.; Miao, W.-S.; Zhang, Y.-D.; Gao, H.-J.; Hui, D. Mechanical properties of nanomaterials: A review. Nanotechnol. Rev. 2020, 9, 259–273. [Google Scholar] [CrossRef]
- Huber, D.L. Synthesis, properties, and applications of iron nanoparticles. Small 2005, 1, 482–501. [Google Scholar] [CrossRef]
- Gupta, A.K.; Gupta, M. Synthesis and surface engineering of iron oxide nanoparticles for biomedical applications. Biomaterials 2005, 26, 3995–4021. [Google Scholar] [CrossRef]
- Laurent, S.; Forge, D.; Port, M.; Roch, A.; Robic, C.; Vander Elst, L.; Muller, R.N. Magnetic iron oxide nanoparticles: Synthesis, stabilization, vectorization, physicochemical characterizations and biological applications. Chem. Rev. 2008, 108, 2064–2110. [Google Scholar] [CrossRef]
- Ali, A.; Zafar, H.; Zia, M.; Ul Haq, I.; Phull, A.R.; Ali, J.S.; Hussain, A. Synthesis, characterization, applications, and challenges of iron oxide nanoparticles. Nanotechnol. Sci. Appl. 2016, 9, 49–67. [Google Scholar] [CrossRef]
- Wu, W.; He, Q.; Jiang, C. Magnetic iron oxide nanoparticles: Synthesis and surface functionalization strategies. Nanoscale Res. Lett. 2008, 3, 397–415. [Google Scholar] [CrossRef] [PubMed]
- Estelrich, J.; Sánchez-Martín, M.J.; Busquets, M.A. Nanoparticles in magnetic resonance imaging: From simple to dual contrast agents. Int. J. Nanomed. 2015, 10, 1727–1741. [Google Scholar]
- Wu, W.; Wu, Z.; Yu, T.; Jiang, C.; Kim, W.-S. Recent progress on magnetic iron oxide nanoparticles: Synthesis, surface functional strategies and biomedical applications. Sci. Technol. Adv. Mater. 2015, 16, 023501. [Google Scholar] [CrossRef] [PubMed]
- Mohapatra, J.; Mitra, A.; Tyagi, H.; Bahadur, D.; Aslam, M. Iron oxide nanorods as high-performance magnetic resonance imaging contrast agents. Nanoscale 2015, 7, 9174–9184. [Google Scholar] [CrossRef]
- Tong, S.; Quinto, C.A.; Zhang, L.; Mohindra, P.; Bao, G. Size-Dependent Heating of Magnetic Iron Oxide Nanoparticles. ACS Nano 2017, 11, 6808–6816. [Google Scholar] [CrossRef]
- Liu, G.; Gao, J.; Ai, H.; Chen, X. Applications and potential toxicity of magnetic iron oxide nanoparticles. Small 2013, 9, 1533–1545. [Google Scholar] [CrossRef]
- Fu, C.; Ravindra, N.M. Magnetic iron oxide nanoparticles: Synthesis and applications. Bioinspired Biomim. Nanobiomaterials 2012, 1, 229–244. [Google Scholar] [CrossRef]
- Pandey, P.C.; Panday, D. Novel synthesis of nickel-iron hexacyanoferrate nanoparticles and its application in electrochemical sensing. J. Electroanal. Chem. 2016, 763, 63–70. [Google Scholar] [CrossRef]
- Koo, B.; Xiong, H.; Slater, M.D.; Prakapenka, V.B.; Balasubramanian, M.; Podsiadlo, P.; Johnson, C.S.; Rajh, T.; Shevchenko, E.V. Hollow iron oxide nanoparticles for application in lithium ion batteries. Nano Lett. 2012, 12, 2429–2435. [Google Scholar] [CrossRef]
- Sidorova, E.N.; Dzidziguri, E.L.; Vinichenko, Y.P.; Ozherelkov, D.Y.; Shinkaryov, A.S.; Gromov, A.A.; Nalivaiko, A.Y. Metal nanoparticles formation from nickel hydroxide. Materials 2020, 13, 4689. [Google Scholar] [CrossRef] [PubMed]
- Luong, N.H.; Long, N.N.; Vu, L.V.; Hai, N.H.; Nghia, P.T.; Van Anh, N.T. Metallic nanoparticles: Synthesis, characterisation and application. Int. J. Nanotechnol. 2011, 8, 227–240. [Google Scholar] [CrossRef]
- Dzidziguri, E.L.; Sidorova, E.N.; Inkar, M.; Yudin, A.G.; Kostitsyna, E.V.; Ozherelkov, D.Y.; Slusarsky, K.V.; Nalivaiko, A.Y.; Gromov, A.A. Cobalt nanoparticles synthesis by cobalt nitrate reduction. Mater. Res. Express 2019, 6, 105081. [Google Scholar] [CrossRef]
- Chernavskii, P.A.; Ivantsov, M.I.; Pankina, G.V.; Lunin, V.V. Heat effect during the low-temperature oxidation of nickel nanoparticles in a porous matrix. Russ. J. Phys. Chem. A 2011, 85, 2050–2053. [Google Scholar] [CrossRef]
- Yang, D.-Q.; Gillet, J.-N.; Meunier, M.; Sacher, E. Room temperature oxidation kinetics of Si nanoparticles in air, determined by x-ray photoelectron spectroscopy. J. Appl. Phys. 2005, 97, 024303. [Google Scholar] [CrossRef]
- Dzidziguri, E.L.; Sidorova, E.N.; Yahiyaeva, J.E.; Ozherelkov, D.Y.; Gromov, A.A.; Nalivaiko, A.Y. Low-temperature oxidation of metal nanoparticles obtained by chemical dispersion. Micro Nano Lett. 2020, 15, 461–464. [Google Scholar] [CrossRef]
- Ribas, D.; Černík, M.; Benito, J.A.; Filip, J.; Marti, V. Activation process of air stable nanoscale zero-valent iron particles. Chem. Eng. J. 2017, 320, 290–299. [Google Scholar] [CrossRef]
- Wilharm, C.K. Combustion Model for Pyrophoric Metal Foils. Propellants Explos. Pyrotech. 2003, 28, 296–300. [Google Scholar] [CrossRef]
- Park, C.-D.; Magana, D.; Stiegman, A.E. High-quality Fe and γ-Fe2O3 magnetic thin films from an epoxide-catalyzed sol-gel process. Chem. Mater. 2007, 19, 677–683. [Google Scholar] [CrossRef]
- Mikhailova, S.S.; Shakov, A.A.; Mikhailik, O.M. Surface structure analysis of stabilized iron particles by XPS with chemical derivatization. Bull. Russ. Acad. Sci. Phys. 2011, 75, 1468–1472. [Google Scholar] [CrossRef]
- Antony, J.; Qiang, Y.; Baer, D.R.; Wang, C. Synthesis and characterization of stable iron-iron oxide core-shell nanoclusters for environmental applications. J. Nanosci. Nanotechnol. 2006, 6, 568–572. [Google Scholar] [CrossRef] [PubMed]
- Popovici, E.; Dumitrache, F.; Morjan, I.; Alexandrescu, R.; Ciupina, V.; Prodan, G.; Vekas, L.; Bica, D.; Marinica, O.; Vasile, E. Iron/iron oxides core-shell nanoparticles by laser pyrolysis: Structural characterization and enhanced particle dispersion. Appl. Surf. Sci. 2007, 254, 1048–1052. [Google Scholar] [CrossRef]
- Cheong, S.; Ferguson, P.; Hermans, I.F.; Jameson, G.N.L.; Prabakar, S.; Herman, D.A.J.; Tilley, R.D. Synthesis and stability of highly crystalline and stable iron/iron oxide core/shell nanoparticles for biomedical applications. ChemPlusChem 2012, 77, 135–140. [Google Scholar] [CrossRef]
- Görner, W.; Förster, H. Determination of oxide film thickness on metal and ceramic materials using activation analysis and B.E.T. gas adsorption method. J. Radioanal. Nucl. Chem. Artic. 1995, 192, 139–145. [Google Scholar] [CrossRef]
- Martin, J.E.; Herzing, A.A.; Yan, W.; Li, X.-Q.; Koel, B.E.; Kiely, C.J.; Zhang, W.-X. Determination of the oxide layer thickness in core-shell zerovalent iron nanoparticles. Langmuir 2008, 24, 4329–4334. [Google Scholar] [CrossRef] [PubMed]
- Manchili, S.K.; Shvab, R.; Zehri, A.; Ye, L.; Hryha, E.; Liu, J.; Nyborg, L. Surface analysis of iron and steel nanopowder. Surf. Interface Anal. 2018, 50, 1083–1088. [Google Scholar] [CrossRef]
- Manchili, S.K.; Wendel, J.; Hryha, E.; Nyborg, L. Analysis of iron oxide reduction kinetics in the nanometric scale using hydrogen. Nanomaterials 2020, 10, 1276. [Google Scholar] [CrossRef]
- Kim, J.H.; Koo, H.Y.; Hong, S.K.; Han, J.M.; Jang, H.C.; Ko, Y.N.; Hong, Y.J.; Kang, Y.C.; Kang, S.H.; Cho, S.B. Combustion characteristics of the heat pellet prepared from the Fe powders obtained by spray pyrolysis. Adv. Powder Technol. 2012, 23, 387–392. [Google Scholar] [CrossRef]
- Majerič, P.; Jenko, D.; Friedrich, B.; Rudolf, R. Formation of bimetallic Fe/Au submicron particles with ultrasonic spray pyrolysis. Metals 2018, 8, 278. [Google Scholar] [CrossRef]
- Ryzhonkov, D.I.; Levina, V.V.; Dzidziguri, E.L.; Khrustov, E.N. Controlling the properties of nanodimensional metal oxide powders via introduction of dispersing additions. Russ. J. Non-Ferr. Met. 2008, 49, 308–313. [Google Scholar] [CrossRef]
- Xue, M.; Wang, S.; Wu, K.; Guo, J.; Guo, Q. Surface structural evolution in iron oxide thin films. Langmuir 2011, 27, 11–14. [Google Scholar] [CrossRef] [PubMed]
- Parkinson, G.S. Iron oxide surfaces. Surf. Sci. Rep. 2016, 71, 272–365. [Google Scholar] [CrossRef]
Publisher’s Note: MDPI stays neutral with regard to jurisdictional claims in published maps and institutional affiliations. |
© 2020 by the authors. Licensee MDPI, Basel, Switzerland. This article is an open access article distributed under the terms and conditions of the Creative Commons Attribution (CC BY) license (http://creativecommons.org/licenses/by/4.0/).