Review

Cluster-Related Phenomena in the Properties and Transformations of Transition Metal-Based Glassy Alloys

1
Department of Mechanical Engineering, University of Dunaujvaros, Tancsics M. u. 1/A, H-2400 Dunaujvaros, Hungary
2
Erich Schmid Institute of Materials Science, Austrian Academy of Sciences, Jahnstraße 12, A 8700 Leoben, Austria
3
Institute of Experimental Physics, Slovak Academy of Sciences, 04001 Košice, Slovakia
4
Department of Physics, Technical University of Košice, 04001 Košice, Slovakia
5
Department of Materials Science, Chair of Materials Physics, Montanuniversität Leoben, Jahnstraße 12, A-8700 Leoben, Austria
*
Author to whom correspondence should be addressed.
Adjunct with Center of Composite Materials of the National University of Science and Technology “MISiS”, LeninskyProsp., 4, 119049 Moscow, Russia.
Metals 2020, 10(8), 1025; https://doi.org/10.3390/met10081025
Submission received: 18 June 2020 / Revised: 13 July 2020 / Accepted: 21 July 2020 / Published: 31 July 2020
(This article belongs to the Special Issue Heterogeneities in Metallic Glasses)

Abstract

:
A survey of the cluster formation tendency and mechanism in transition metal-based glassy alloys is made with an emphasis on their manifestation in various physical properties. The cluster formation is partially inherited from the supercooling of the melt. However, it also develops due to the interaction between dissolved hydrogen and the frozen glassy structure. The glassy state as “cluster assembly” is regarded as a structural background for the interpretation of several anomalous concentration dependences of thermal and magnetic properties in these glasses. We will focus on the manifestation of alloying effects, the relation between irreversible and reversible structural relaxations both in the high, and low temperature range (observed near to the glass transition or after low temperature storage). The development of the cluster assembly is the consequence of the co-existence of various bonding types between the alloy components. These are brought together in the melt, ensuring sufficient glass-forming ability. The nucleation mechanism of the amorphous-nanocrystalline transformation is also explained as a cluster phenomenon, which significantly contributes to the evolution of magnetic ultra-softness in FINEMET-type alloys. Finally, the role of the quenched-in cluster structure in the mechanism of reversible and irreversible H-absorption is discussed. Irreversible H-induced structural rearrangements can appear as microphase separation in multicomponent systems, governed by the affinity difference between the metallic components and the absorbed hydrogen. This kind of H-induced reordering is responsible for the “volume activation” of amorphous H-storage alloys and it also causes the gradual breakdown of storage capacity during cyclic absorption–desorption steps. This article mainly focuses on the cluster phenomena in Fe-based glasses because of its unique combination of high mechanical strength, strong corrosion resistance, good thermal stability and excellent magnetic properties.

1. Introduction

In materials science and chemistry, the term “cluster” means an assembly of a few (from several tens to few hundreds) atoms [1], being in bonding relation during the time period of observation. This time period can be the measurement itself, being directed to the study of a given attribute or phenomenon. Nanometer-sized dimensions either in the case of individual clusters or as the building units of cluster-assembled macroscopic materials, are typical [2]. The properties are strongly size-dependent on these dimensions and differ significantly from those in the bulk (condensed) phases with the same composition with conventional rather large grain size [3,4]. A lot of evidence exists on the size dependence of even such basic properties as the ionization energy [5], or the melting point [6] (both properties are coupled with the average bond strength between the constituent atoms). This difference provides a wide range of possibilities for property tailoring in several fields of materials science [7,8]. The chemical bonding itself can also differ over the cluster size dimension (1–2 nm) even in the case of a single component material [9]. The origin of metastability is exclusively a topological coordination deficit of significant atom fractions in the vicinity of interfaces in case of single component materials [9]. In two, or multicomponent clusters, chemical metastabilities can also develop [10]. The mentioned “size effects” arise from the relationship between grain dimension and the length-scales of given physical phenomena (for example, the free path of delocalized valence electrons in a metallic system). The clusters treated in this paper are developed in the glass-forming melts and get frozen in during the cooling process to temperatures below the glass transition (Tg) [11]. Consequently, continuous physical and chemical transition can be imagined between these nanometer-sized structural units and the neighboring part of material. Hence, the properties of individual clusters usually cannot be tailored, but their properties depend rather on the thermodynamic character of the melt, and the translation mobility of constituent atoms is highly composition-specific. The dimension ranges, between 1–2 nm to few tens of nanometers, are the consequence of temperature-dependent structural changes in the glass-forming liquid. The second type of cluster formation originates from hydrogen absorption in various glassy alloys (solid–gas interaction in the range of 100–200 °C or electrochemical saturation at room temperature). During H-induced cluster formation the frozen-in cluster structure interacts with the dissolved hydrogen, forming reversible or irreversible atomic contacts between alloy components, i.e., new cluster types are formed in the glassy structure (a sterically extended form is H-induced microphase separation in the amorphous state). It is assumed that clusters are embedded in the glassy matrix in both cases, and neither sharp compositional, nor topological interfaces develop between the individual clusters and their surroundings.
Based on thermodynamical considerations, the polycluster nature of metallic glasses is universalized in reference [12]. According to these considerations, the clusters are regarded as dominant structural units in several metallic glasses. This concept is supported by several high resolution electron diffraction experiments [13,14,15,16]. Such structural units are also interpreted as “medium-range order”, suggesting that certain types of atomic ordering may extend far beyond the first neighbor atomic distance in the liquid-quenched glassy state. These structural units are formed in supercooled liquids beyond the glass transition temperature (TTg). The real structure of the quenched-in cluster assembly depends on the quenching and heat treatment conditions. The clusters in melt-spun ribbons can exhibit a texture relative to the ribbon plane [12].
The polycluster concept of glassy structures [12] is not in contradiction to the macroscopically homogeneous, single-phase nature of the glassy state, because distinct boundaries between individually ordered regions do not exist.
The detailed theoretical analysis of the above-mentioned phenomena is beyond the scope of this paper. We focus rather on the metallurgical background of cluster formation as well as the experimental manifestation of the possible existence of clusters in various physical properties. An attempt is also made for the interpretation of extraordinary properties and phenomena in a few transition metal-based glasses, both in as-quenched state, and also in their response to special heat treatments including sample storage at low temperature. Several of these phenomena are not fully explained yet, in spite of the strong research activities in the past decades.
Finally, some consequences of hydrogen absorption including the Curie-temperature shift and the change of the stress sensitivity of magnetic properties, such as coercivity (Hc), during H-absorption will be analyzed. Hydrogen-induced phase separation in the amorphous state will also be discussed as a cluster phenomenon.

2. Cluster Formation and Their Influence on Properties

2.1. Origin and Role of Cluster Formation and Glass-Forming Tendency in Supercooled Metallic Liquids

The cluster formation tendency in two- or multi-component liquids is not restricted to metallic systems (association formation [12,17]). In the early period of research on glass-like substances the existence of regions with a relatively large degree of ordering was assumed on the basis of the anomalous behavior of thermal expansion and the refractive index [18,19,20]. The tendency for cluster formation in various liquids develops mainly below the melting temperature and is enhanced at sufficient supercooling, as illustrated in Figure 1 where the phenomenology of glass formation from the supercooled melt is depicted. Within the “A” temperature range, the system is in internal equilibrium, because the characteristic time scale of elementary atomic motion is 10−14 –10−9 s. The properties at each point are invariant of the direction of temperature change, i.e., the system has no thermal history and, from the thermodynamic point of view it is “ergodic”. With increasing supercooling, translational atomic displacements dramatically slow down, (typically 10 orders of magnitude near to 1.2 Tg), so the change of properties during this time-scale can already be detected. Consequently, the actual properties can depend on the direction of temperature change (region B). This is the typical temperature range, in which relaxation phenomenon can be observed, i.e., the properties change during the period of observation. The final degree of cluster formation will be frozen at Tg.
In general, thermodynamic terms, the concept of “relaxation” refers to processes leading to equilibrium at a given temperature and pressure, including small structural changes in a single amorphous phase. In many application-oriented references [22], “structural relaxation” is directed to the improvement of soft magnetic properties via appropriate heat treatments at temperatures Trelax < Tg. This will be discussed later. Here, only those property changes are discussed, which are associated with the cooling rate, i.e., the cluster forming phenomena in the supercooled liquid state.
Cluster formation in the liquid state is supported by structure-sensitive properties, like electrical conductivity or viscosity. The cluster-forming liquids show an abnormal concentration dependence of resistivity (resistivity increase) around the compound formation compositional range [23].
Therefore, one can say that either the number or the mobility of conduction electrons decreases partially due to cluster formation: This fact is also in agreement with the conclusion that the interdiffusion constants change with the heat of mixing [24].
Another indication for the existence of cluster formation (ordering) in the glass-forming melt is the previously mentioned increase of specific heat (development of excess specific heat) in the undercooled liquid regime. This indicates that such short-range ordering may have an essential influence on the glass-forming ability.
The interpretation of high glass-forming ability (c.f. bulk amorphous alloys) is also based on the supposition of pronounced cluster formation in the liquid state [25,26]. It is proposed that cluster formation in the supercooled melt induces kinetic hindering to the formation of crystalline nuclei (equilibrium phases). The clusters, which are associated groups of atoms, can be considered as a molecule described with AjBj formula, but with a flexible structure in which the atomic distances between the unlike atoms are nearly constant, but the bonding angle is variable over a wide range.
In a first approximation, the supercooled glass-forming melt can be described as a flexible assembly of associates and the remaining components are distributed randomly.
The clusterized liquid structure exerts a hindering effect on the formation of critical nuclei and the growth of crystalline phases and, thus, increases the glass formation tendency. A simple thermodynamic description of cluster formation is reported in [27], using the regular solution model concept. This consideration leads to the formation of associates, according to (1).
Δ H = Δ H r e g + Δ H A j B j a s
The entire mixing enthalpy of alloy formation (ΔH, which can be directly determined by calorimetry), consists of two terms: ΔHreg which is due to the interaction between the hetero-atoms (components), and ΔHasAjBj arising from the interaction between the atoms within the associates. This term describes the extra stabilization of the melt, compared to the regular solution model.

2.2. Some Structural and Bonding Aspects of the Investigated Glass-Forming Melts and the Relaxation Mechanism during Supercooling

The success of applied structural models for the cluster formation tendency is different in metal–metal and metal–metalloid glass-forming melts. For metal–metal melts, the proposal of icosahedral atom assembly is successful because this model fits to the experimentally verified dense random packing nature of several glass-forming melts and glasses [28].
However, such consideration is over-simplified for transition metal-metalloid alloys, because of the large difference between the atomic radii and the electronegativity of the components [29,30]. A large number of metallic liquids belong to this category, where a partially localized nature of bonds develops due to the addition of metalloid (glass former) components. The electronegativity of metalloid atoms is higher than the average of the metallic components. Therefore, structural description with clusters with different local symmetries is more favorable [31,32,33].
The cluster formation with local concentration and symmetries is also supported by the experimentally observed stabilization of the undercooled melt resulting in a significant activation threshold for the formation of crystalline nuclei, i.e., the undercooling ability of several metallic melts is in contrast to the assumption that chemical short-range order in metallic melts and in the crystalline nuclei would be similar. This indicates that the number or the mobility of conduction electrons decrease significantly (which is also manifested in the specific heat (ΔCp) increase in the undercooled liquid regime), which hints also to a change in short-range ordering near to the glass transition temperature. Hence, the glass-forming melts possess their own characteristic short-range order, which is usually independent of that in the corresponding crystalline solid phases.
In summary, cluster formation contributes to melt stabilization, enhances the ability for supercooling, and decreases either the number or the mobility of conduction electrons. This is also manifested in the increasing specific heat (ΔCp) in the deeply undercooled liquid regime. One can suppose, therefore, that the outlined cluster structure (including simultaneously local chemical short-range ordering) represents the background for the development of glass forming ability.

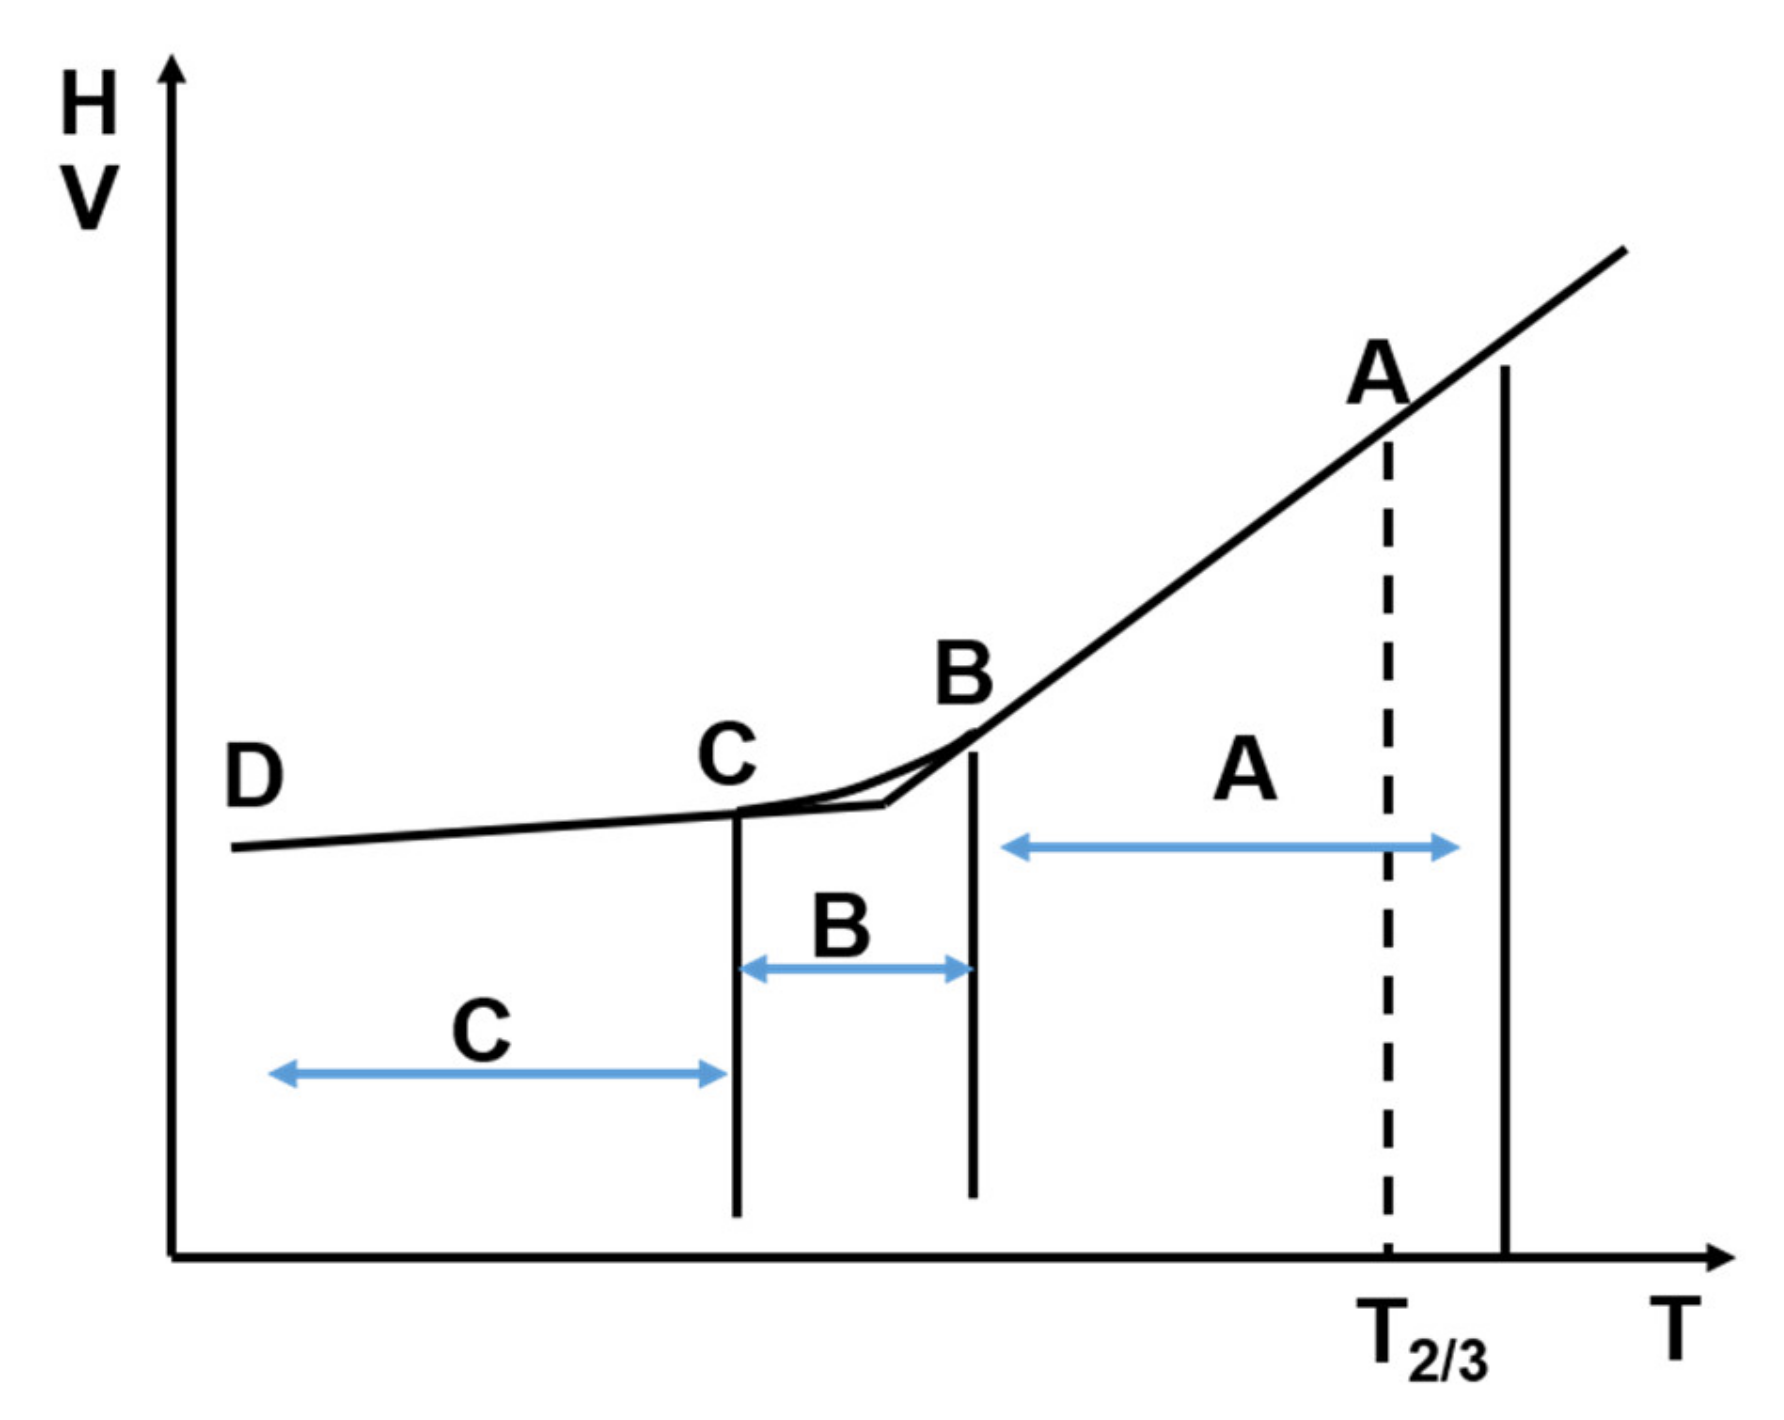
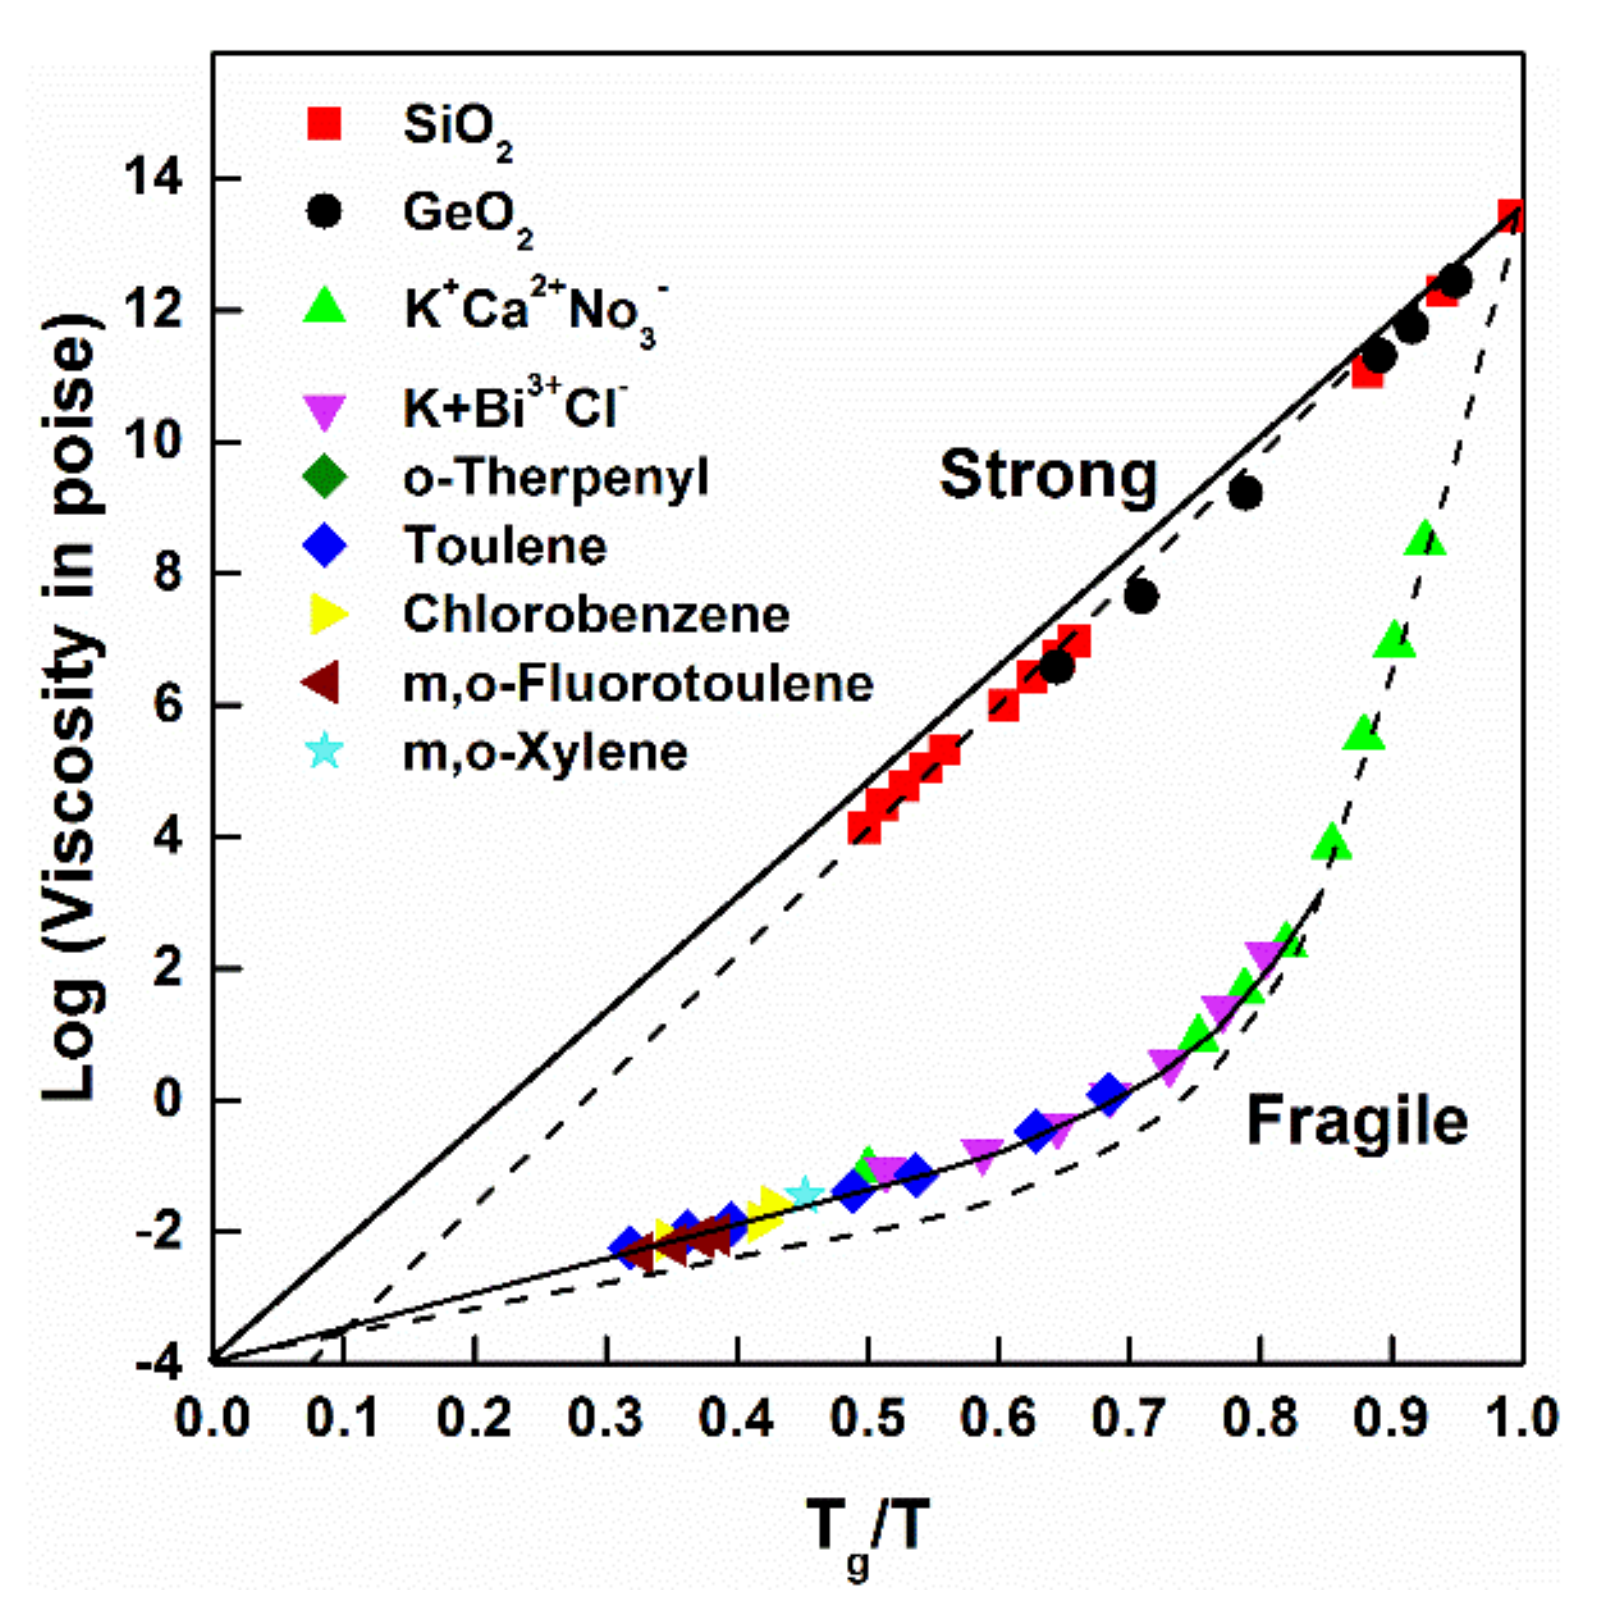
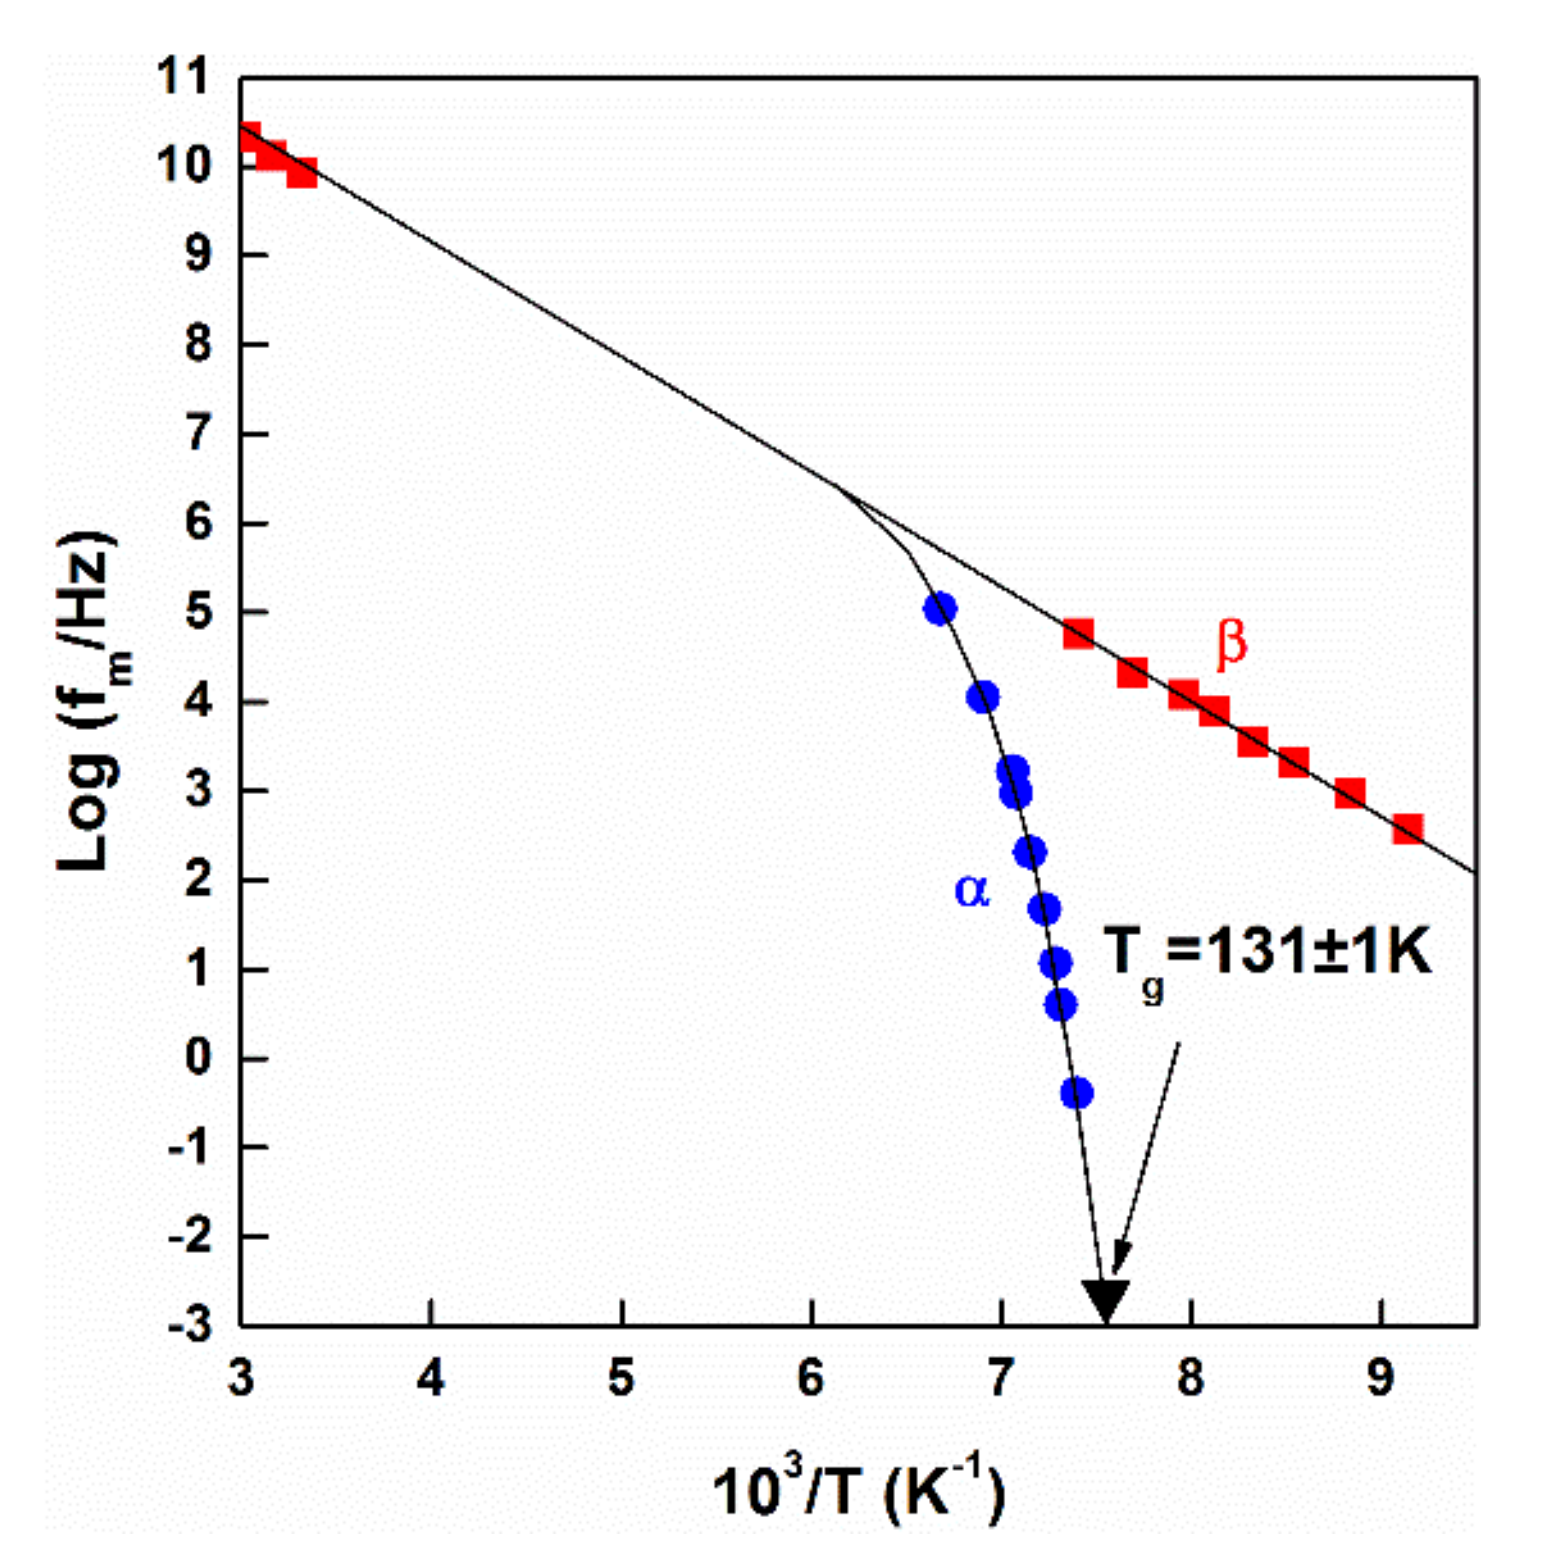
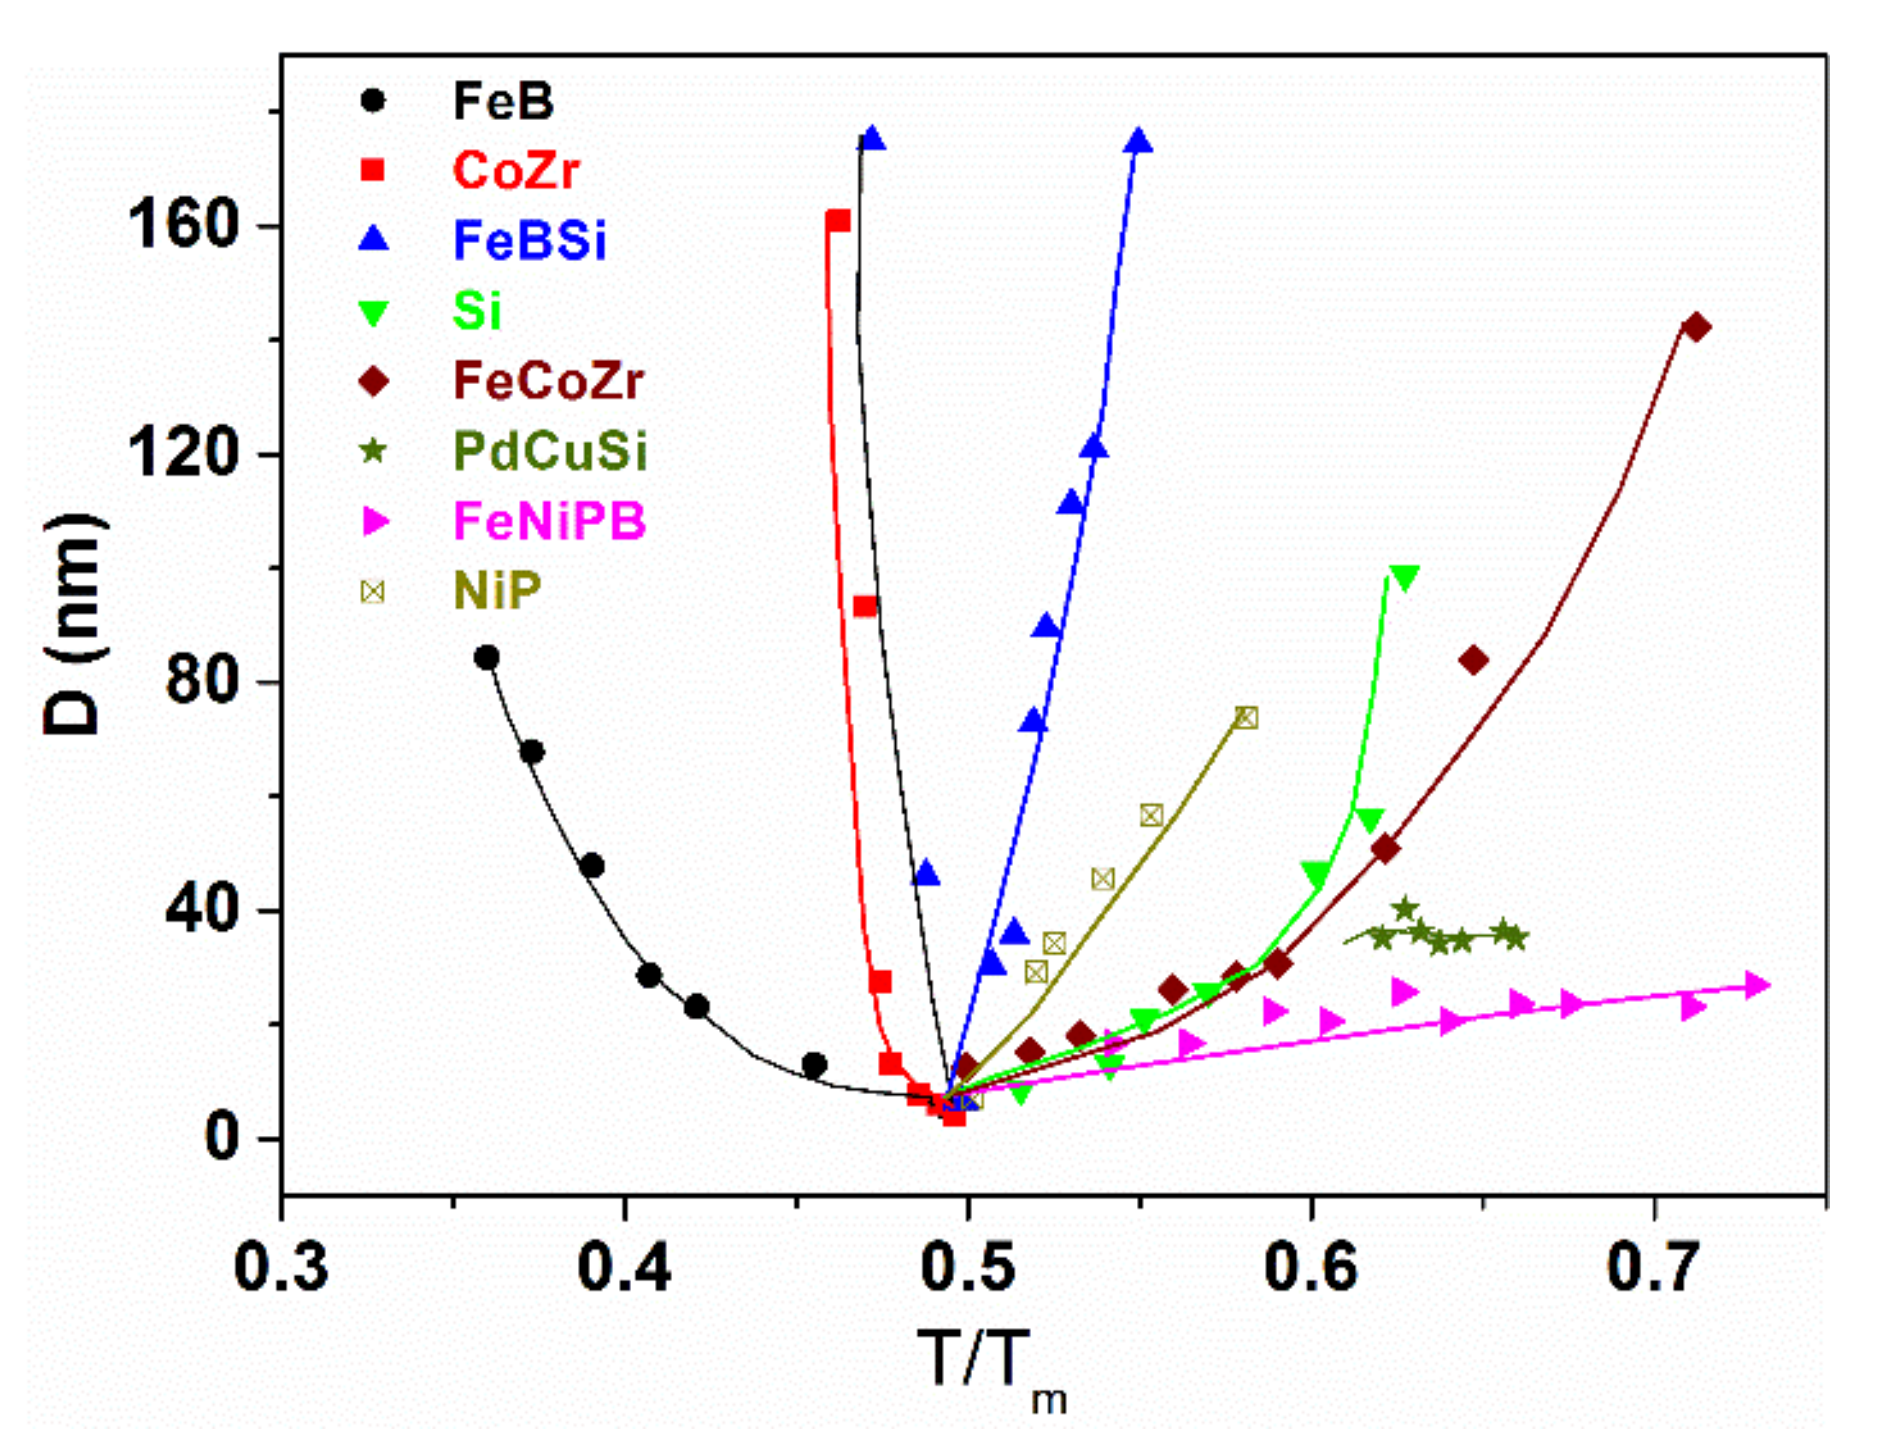
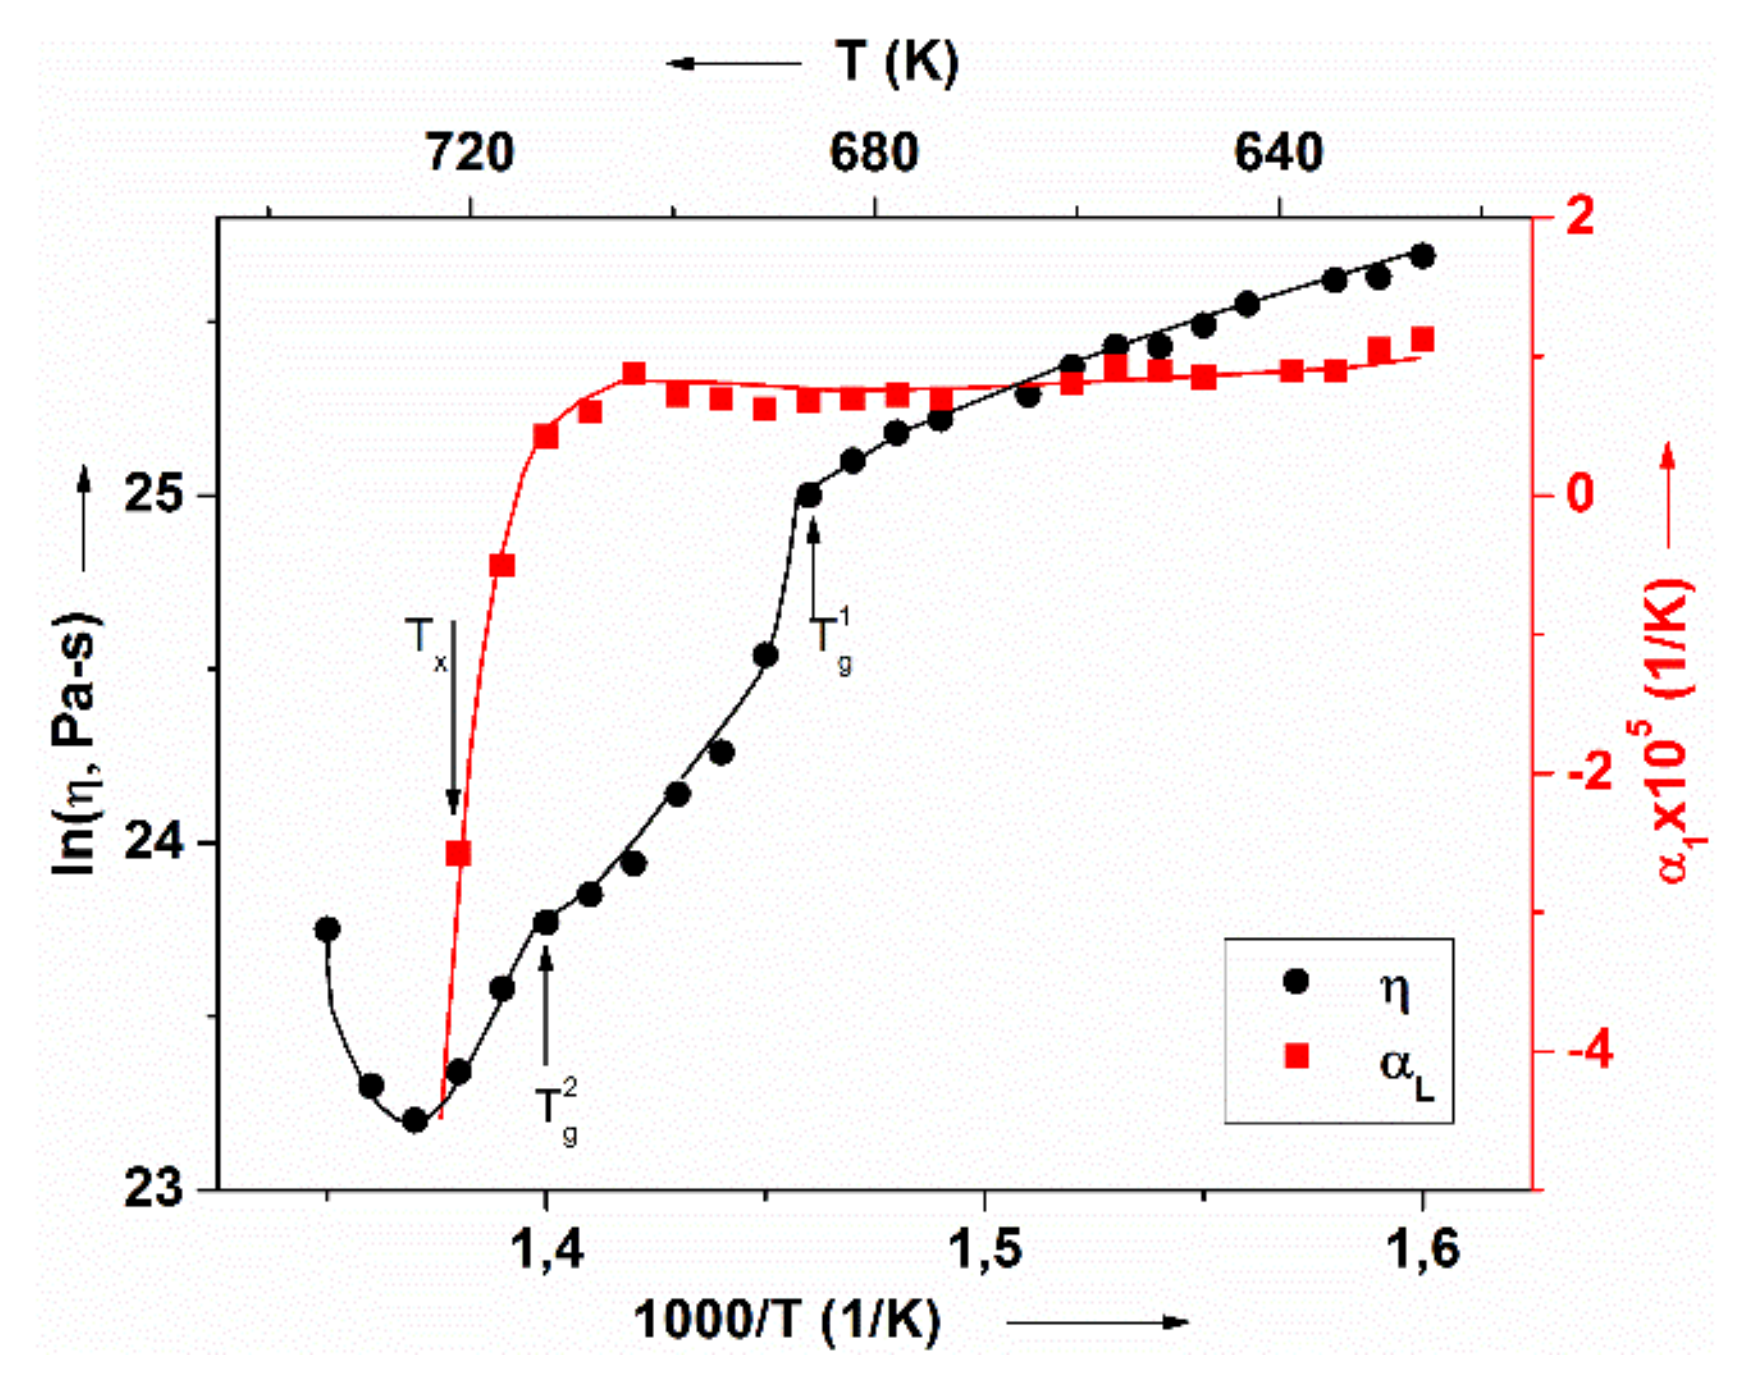
2.3. Temperature Dependence of Viscosity and Cluster Formation Tendency in Supercooled Liquids

It is generally accepted that temperature dependence of the viscosity of liquids contains information about the mechanism of translation and rotation mobility of components at the atomic level and hence—at least indirectly—provides information on the cluster formation tendencies in various liquids [34].
The outlined thermodynamic considerations have already pointed to the importance of the dynamic factors (participation of translation atomic mobility in liquid supercooling, i.e., avoiding the formation of crystalline nuclei).
The mobility upon diffusion, which is necessary for the formation of critical crystalline nuclei, is increasingly suppressed when the melt temperature decreases below the melting point (supercooling). The distribution of components between co-existing clusters plays an important role in the mobility of components at the atomic level [24]. The temperature dependence of global translation atomic mobility is reflected in the change of viscosity. The Stokes–Einstein equation [35]
D = K B T 6 π η r
phenomenologically expresses coupling between displacements at the atomic level and the viscosity, which can be derived from macroscopic measurements. (D: constant, KB: Boltzmann constant, T: absolute temperature, η: shear viscosity, r: molecular level distances).
The temperature dependence of viscosity η(T) as a macroscopic property is used for the description of dynamic phenomena during the process of supercooling. Two basic types of T-dependence are known [36]:
One of them is described by the Arrhenius equation:
η = A   e x p E ( T T 0 )
where E is activation energy, and T0 is reference temperature. Such temperature dependence is characteristic for “strong liquids”, with dominantly covalent bonding character. A single value of activation energy (E) is typical in the whole temperature range without a change of liquid structure [36,37]. A typical example is the SiO2 melt; dynamic breaking and restoration of the SiO2 network is supposed as the basis of elementary atomic displacements in the whole supercooling range. Such η(T) dependence is illustrated in Figure 2.
In contrast, a Vogel–Fulcher type η(T) dependence is typical in “fragile” liquids:
η = η 0 e x p B T T 0
The constant B is valid only within a restricted (2–4 orders) temperature range (i.e., the activation energy is not constant between Tmelt and Tg). In “fragile” liquids, the viscosity exhibits a more pronounced slow-down as T approaches Tg. The glass-forming ability is weak in these liquids. Most of the glass-forming metallic liquids belong to this category [38]. Two or more bonding types co-exist in these liquids. Accordingly, various types of atomic motion (which is collectively known as “relaxation”) contribute to the actual, macroscopic shape of η(T). The temperature dependence of atomic-scale translation and rotation displacements represents the background of the actual shape of η(T) [36,37]. The typical behavior of liquids is illustrated in Figure 2.
The temperature dependence of the frequency of elementary displacements depends also on the local chemical environments. At high temperatures (close to the melting temperature) this frequency is typically on the order of 1013–1014 s−1. This frequency is comparable with that of electric fields. Consequently, the elementary steps of displacements can be observed as the change of absorption maxima, which makes it also possible to detect the separation of various types of motions. This means that peaks of the dielectric relaxation frequency can be used for the mapping of the temperature dependence of the frequency of elementary displacements during melt supercooling, as depicted in Figure 3 [39]. While a single relaxation peak is visible only near to the melting point, the peak splits into slow (α) and fast (β) processes as the temperature is lowered.
This increasing separation in (β) and (α) processes is typical in fragile liquids, showing the increasing difference between the characteristic time-scales of elementary relaxation steps. There is experimental and theoretical evidence for the spatial separation of two groups of phenomena [40,41,42], which already represents a clusterized structure.
Hence, two groups of elementary relaxation steps can be distinguished in fragile supercooled liquids, for which the T-dependence is different, probably as the consequence of different local bond strengths between the constituent atoms. When approaching Tg, the role of “long-lived” structures [42] will be pronounced in the global liquid structure, though, the relation between the “fast” and “slow” relaxation events is highly system-dependent [43].
On the analogy of the dynamic phenomena observed in fragile, organic liquids (in which simultaneously two or more bonding types exist between the components), the fragility concept was also extended to transition metal (TM)-metalloid (M) melts.
In contrast to the melts of network and polymer glasses (in which the bonding is covalent), the bonding is predominantly metallic in these melts, but, as mentioned above, some covalent character is introduced by the addition of metalloids (B, Si, P, C). The co-existence of different bonding characters is also reflected in several physical properties of the glassy state [44,45]. The electrical and heat conductivity, as well as the mechanical flexibility, are inherited from the non-periodic nature of the structure, as well as from the common participation of sp as well as d-electrons in the conduction band [46].
The frequency of the elementary steps of atomic motion is high near the melting point (around 10−13 s), and no prolonged residence time (preferential contacts) between hetero-atoms is developed. Thus, component distribution is nearly random.
Chemical short-range order develops at sufficient supercooling [47,48]. As cooling proceeds and approaches ≈ 2/3 Tm, (jump temperature, see Figure 1) [49], the local composition (TM/M ratio) in compound-like associates is close to that in metastable intermetallic compounds and the local bond strength between the hetero-atoms is higher. Hence, the translation mobility is lower within the clusters and the time-scale of relaxation inside these covalent-like environments increases more rapidly than in the remaining volume of the liquid. This type of relaxation is assumed to be (α)-like (see Figure 3). This part of the liquid freezes at higher temperature, forming a “solidified skeleton”. Hence, the essence of cluster formation is the gradual decomposition of the liquid to compound-like aggregates and solid solution-like clusters.
The local composition (TM/M ratio) in the compound-like aggregates is close to that in metastable intermetallic compounds and the local bond strength between the hetero-atoms is higher, so the translation mobility is lower within these clusters. As an example, the scheme of decomposition in Fe-B liquid is the following Scheme 1:
supercooled liquidincreasing supercooling → [(FeT)3 B] + [Fe, T(B)]
As local bonding is weaker, the atomic mobility is higher beyond the compound-like clusters (solid solution-like environment with lower B-content). Such atomic environments are assumed to be the basis of fast (β) processes. Within the “solid solution like” clusters (in which the bonding between the atoms is weaker) some short-range rearrangement is still possible even below Tg. The driving force of this rearrangement is the temperature-dependent stability difference between α- and γ Fe-allotropes. (structural memory effect) The possible transition between fcc and bcc environments is temperature- and concentration-dependent. It is assumed that such short-range displacements can be described by a typical structural scheme in Fe (TM)-based glasses for the relaxation mechanism below Tg according to Scheme 2:
[Fe,T(B)]bcc ↔ [Fe,T(B)]fcc
One should emphasize, however, that such environment does not form a continuous network in the glass, but rather occurs as dispersed centers in the form of spatially isolated clusters, i.e., this type of relaxation centers represents the spatial heterogeneity of relaxation centers.

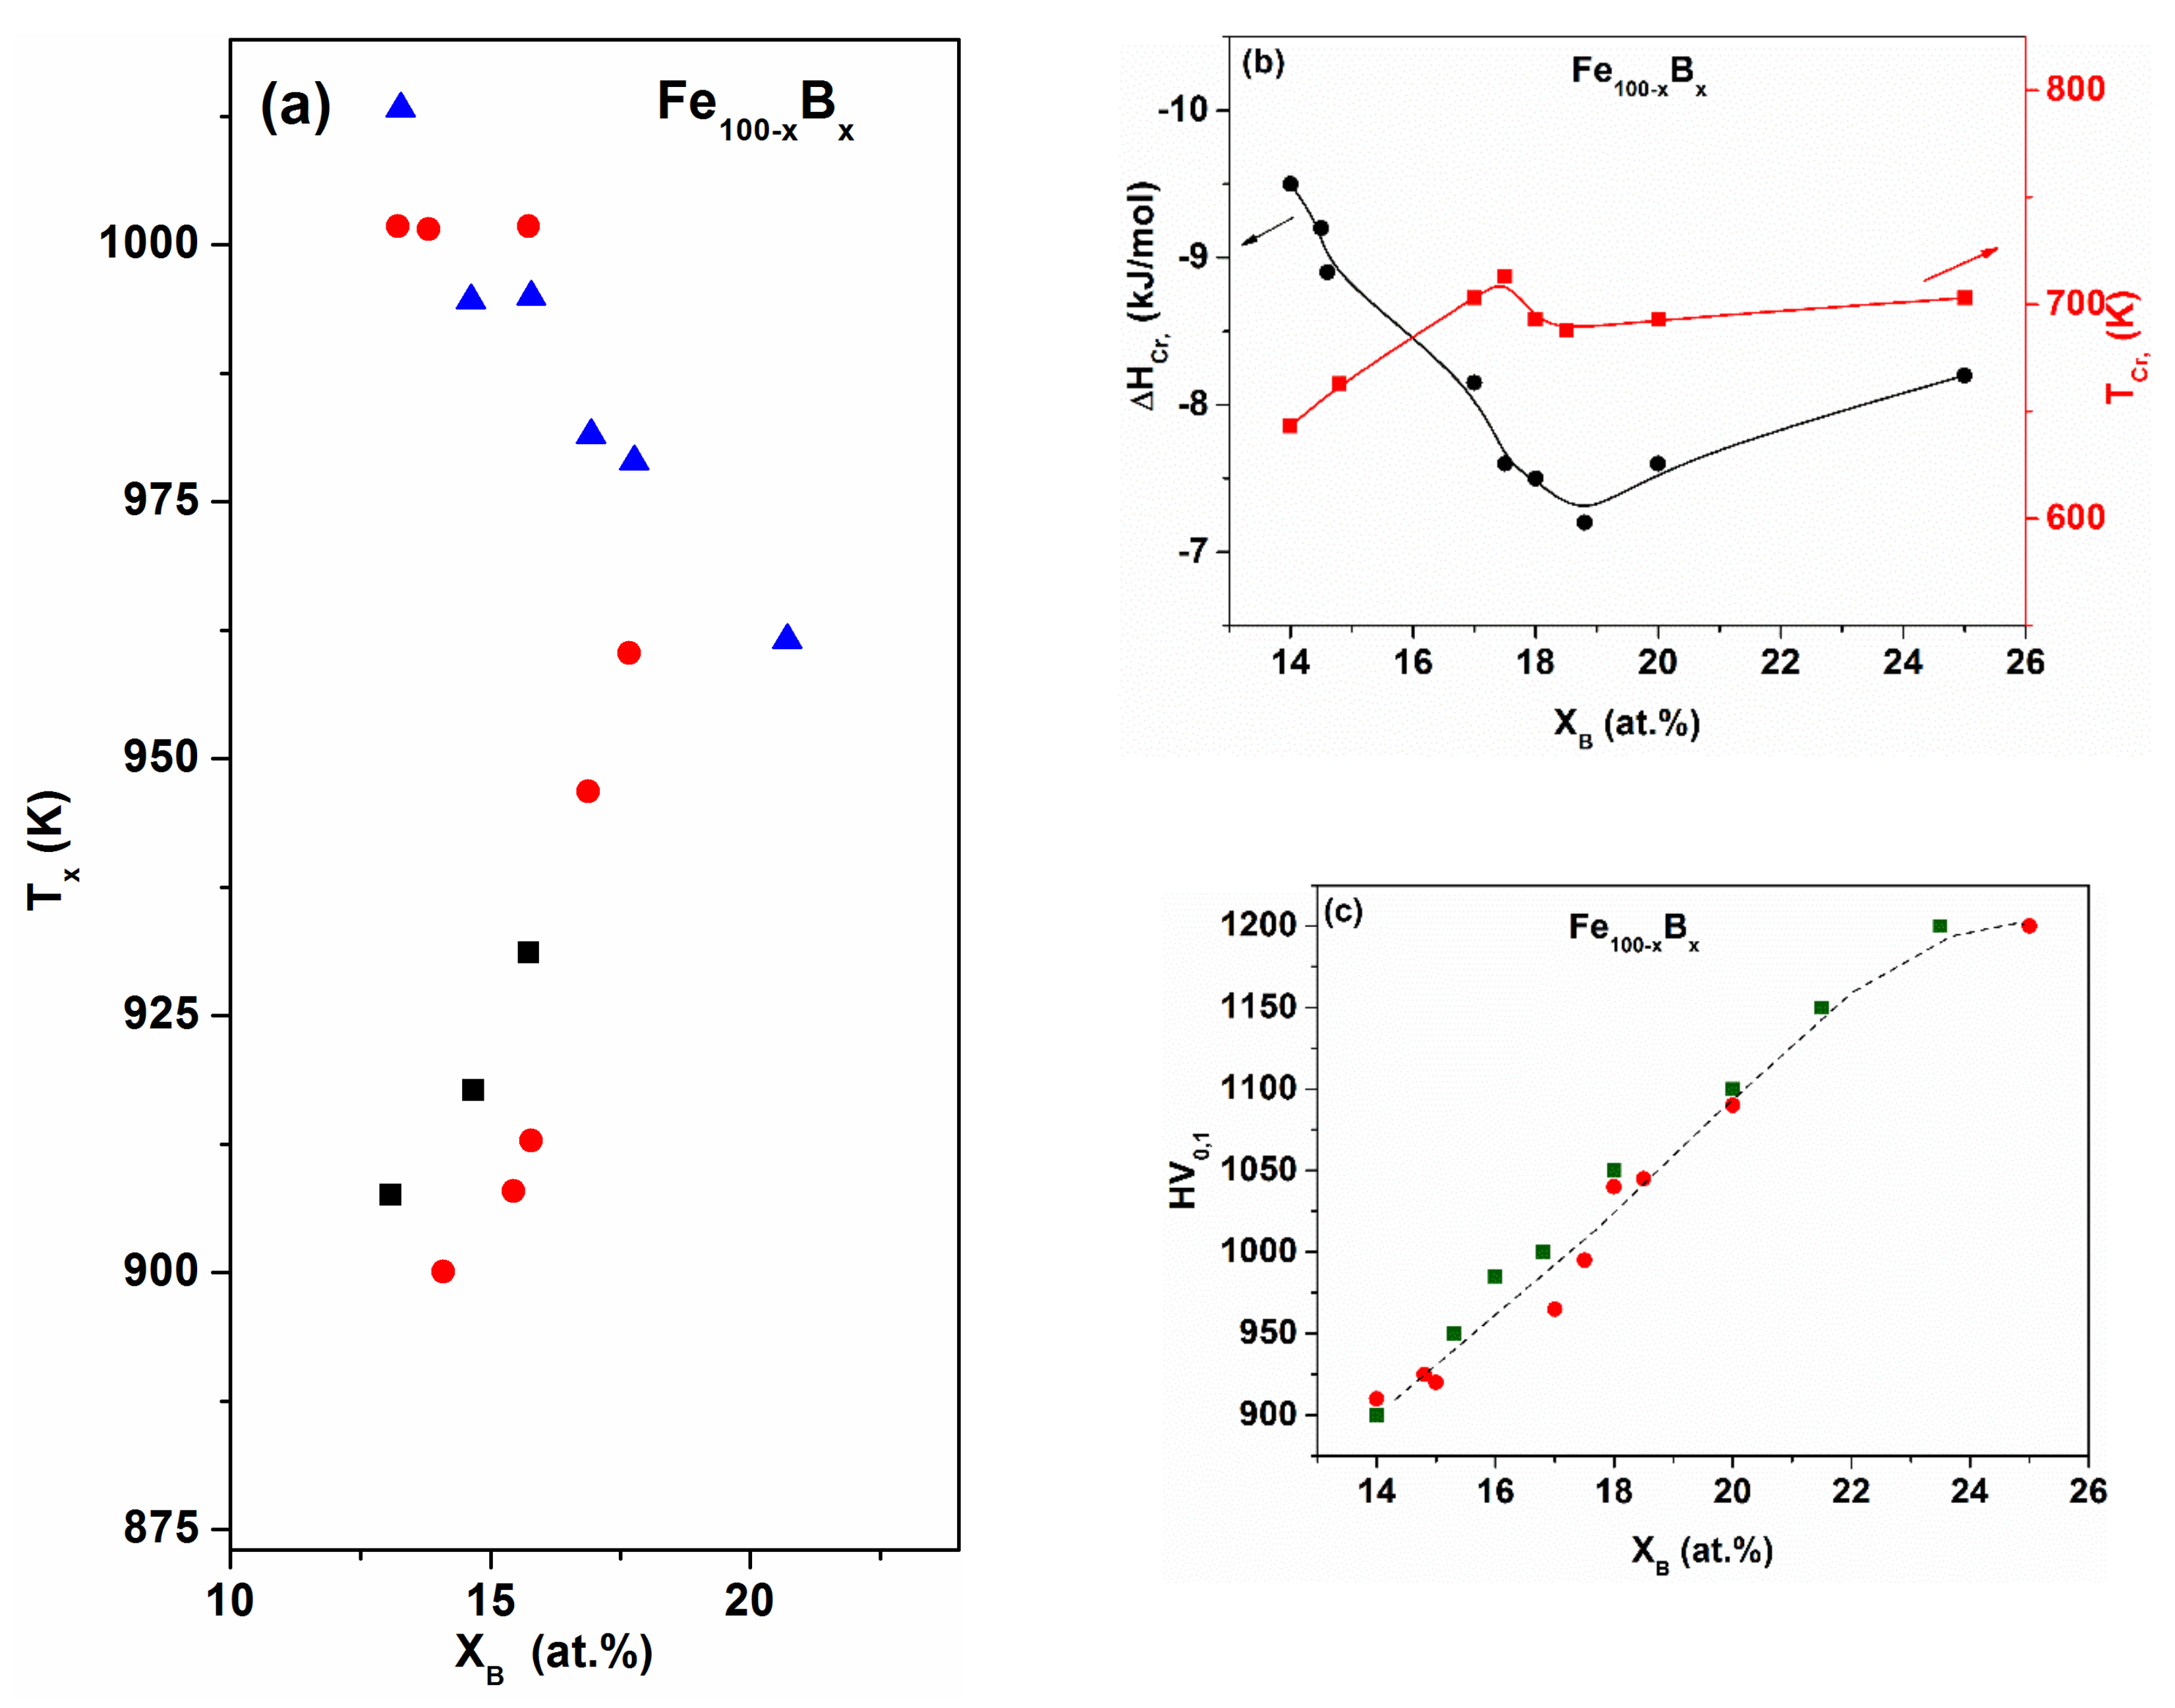
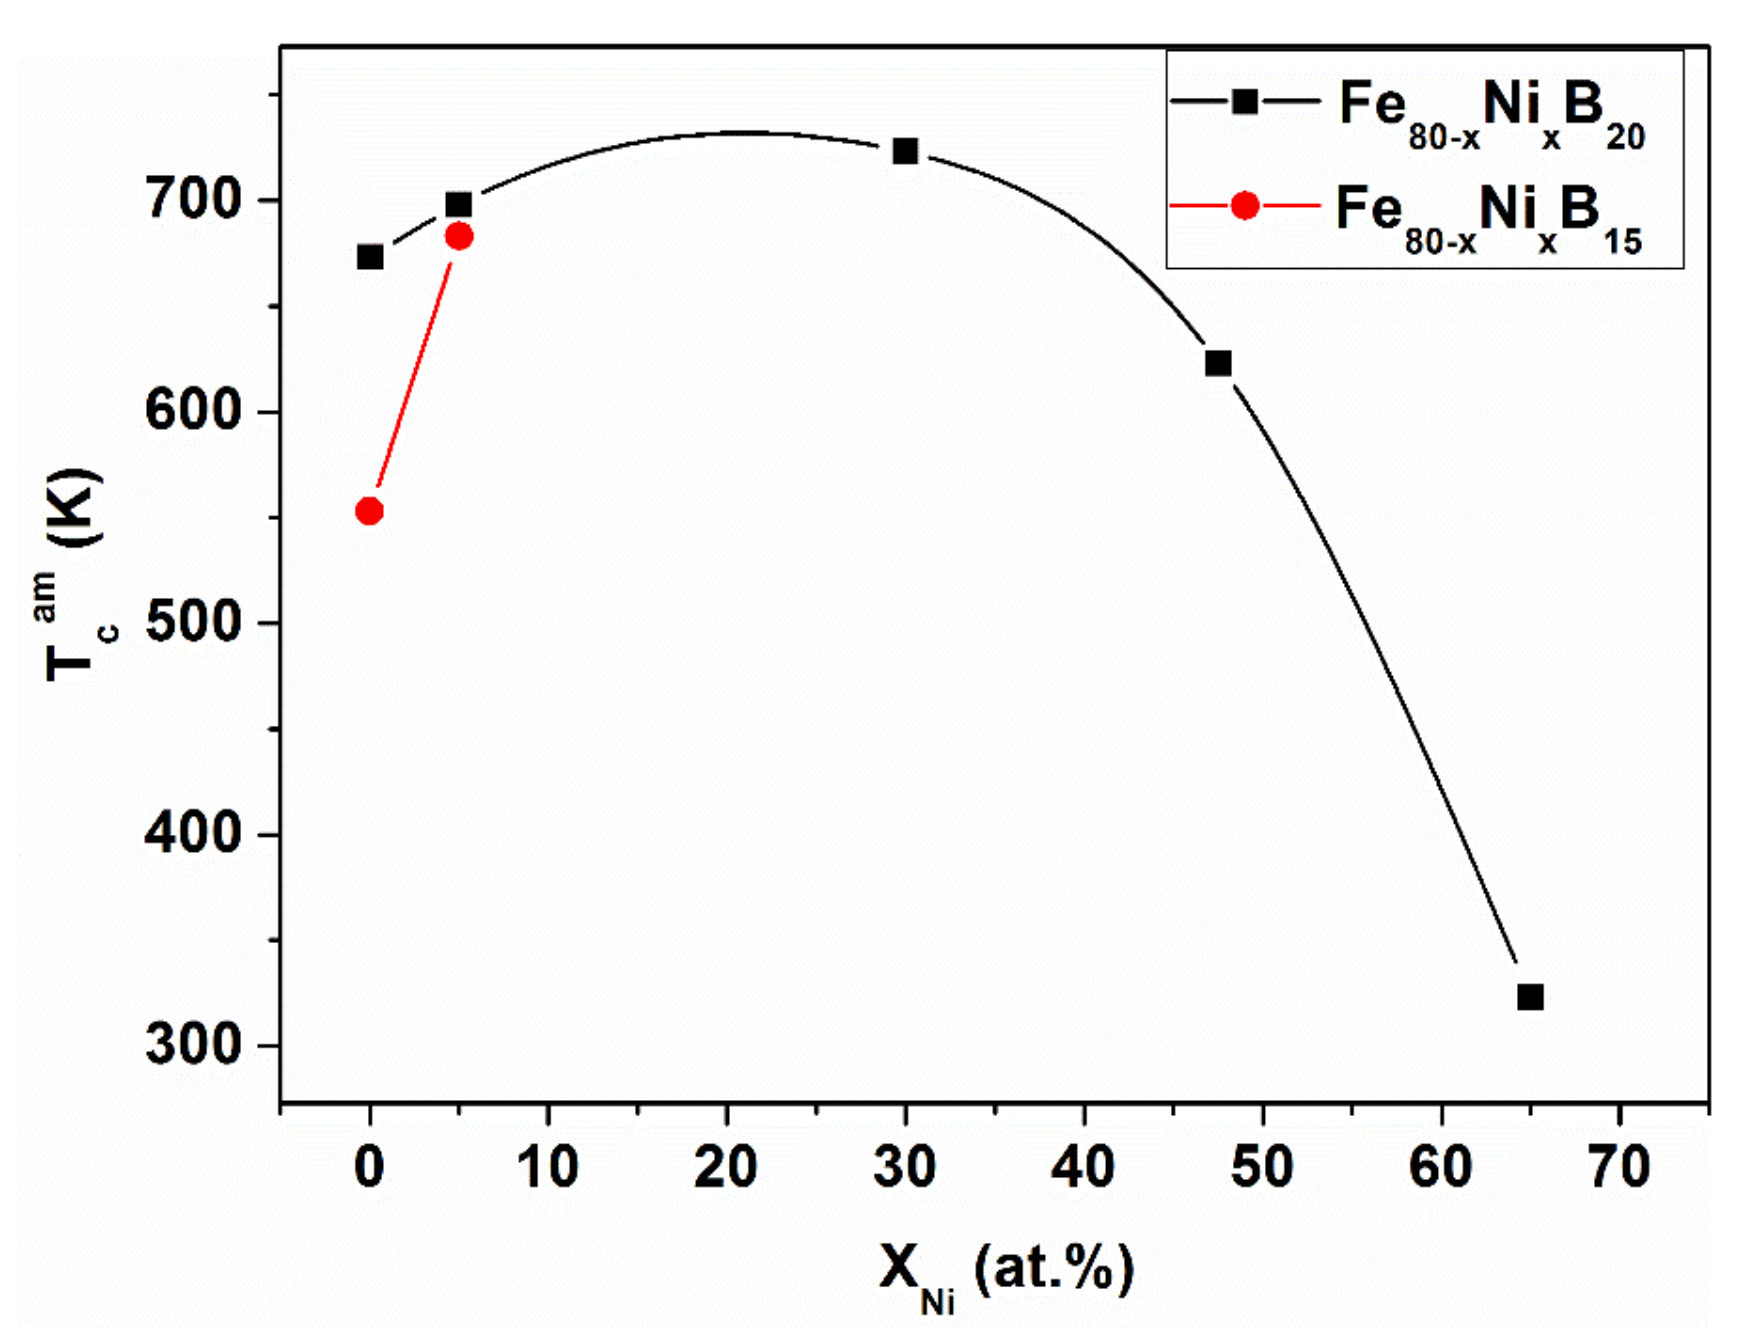
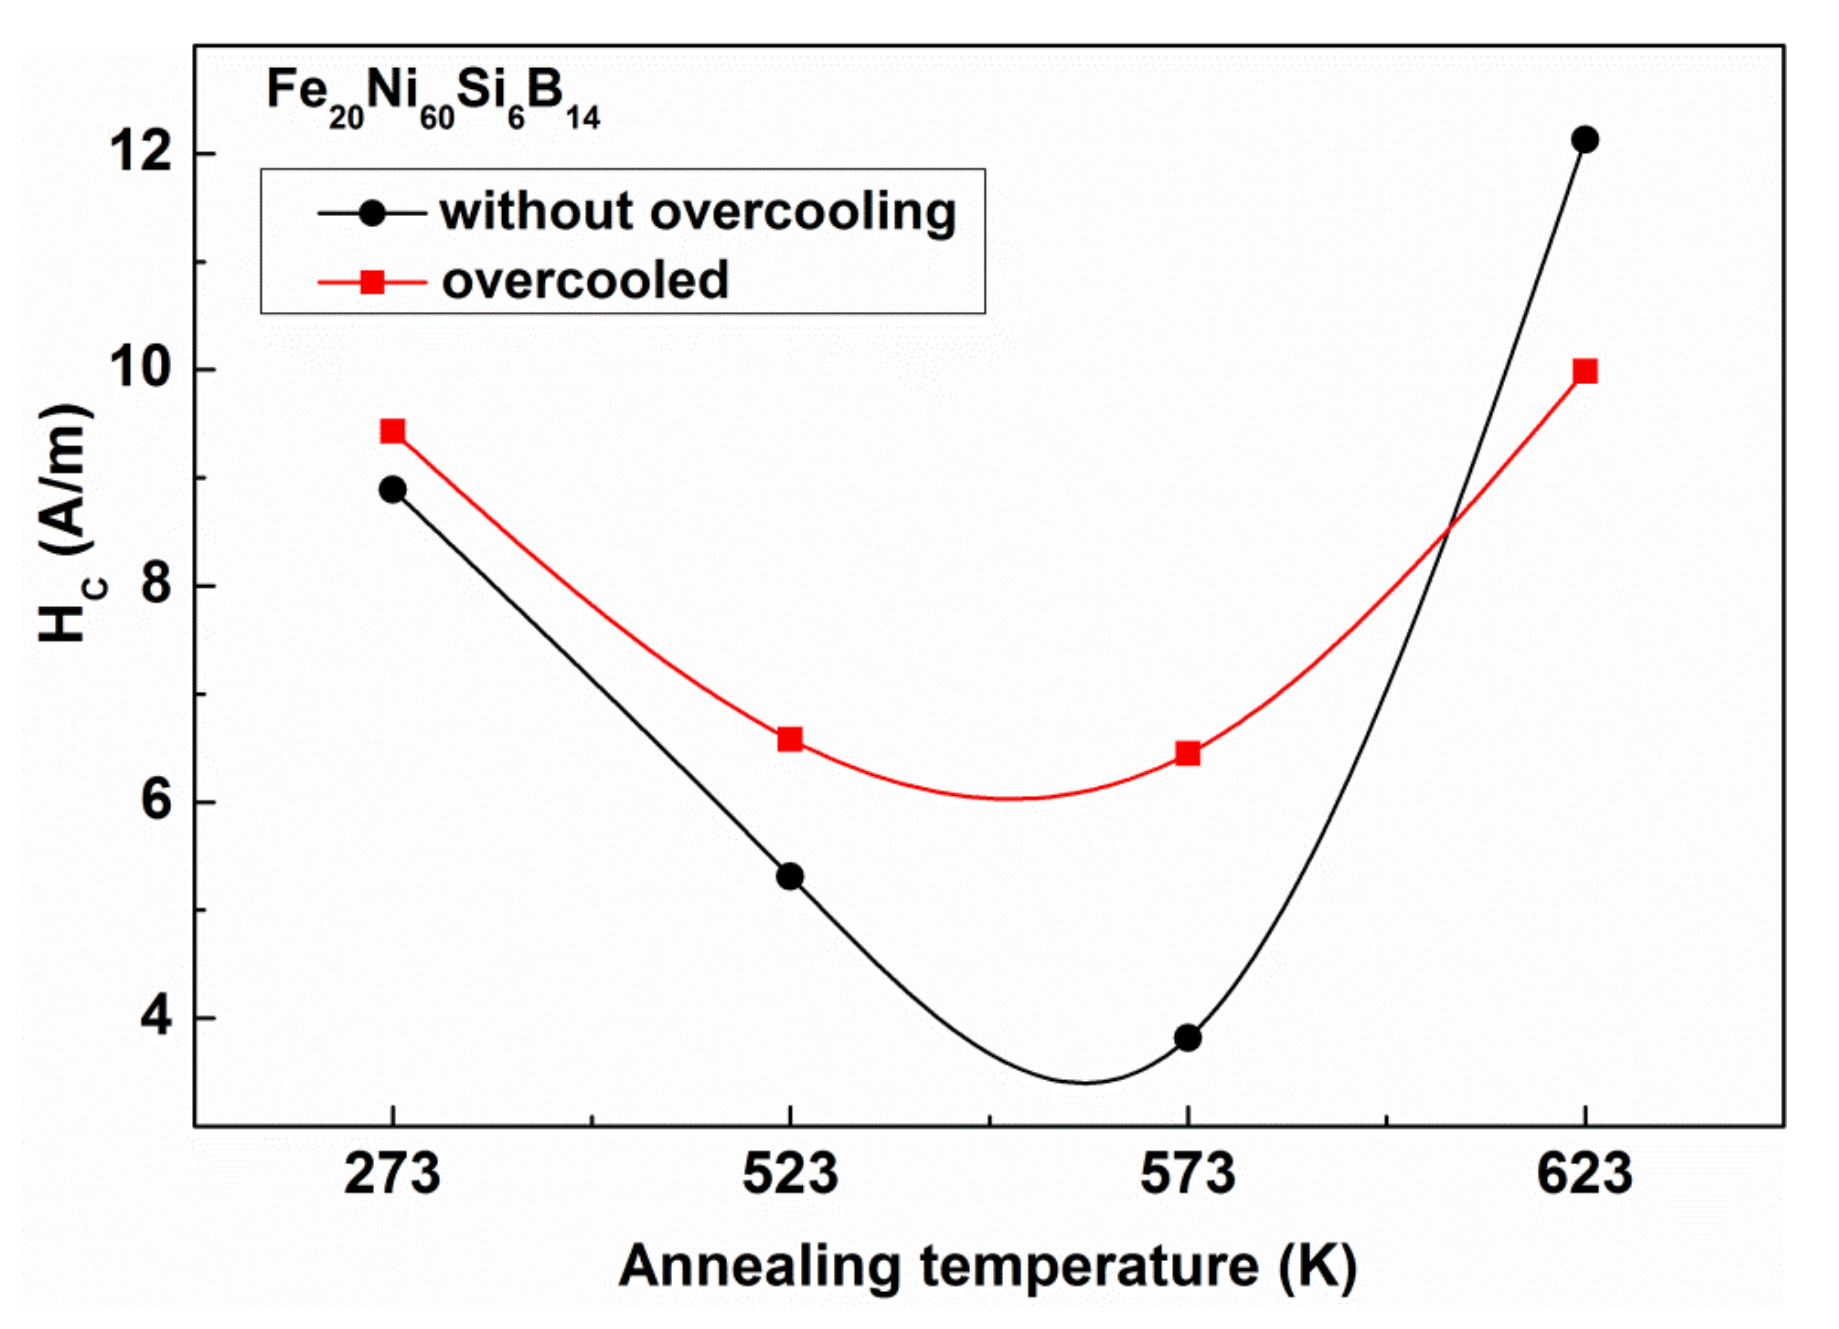
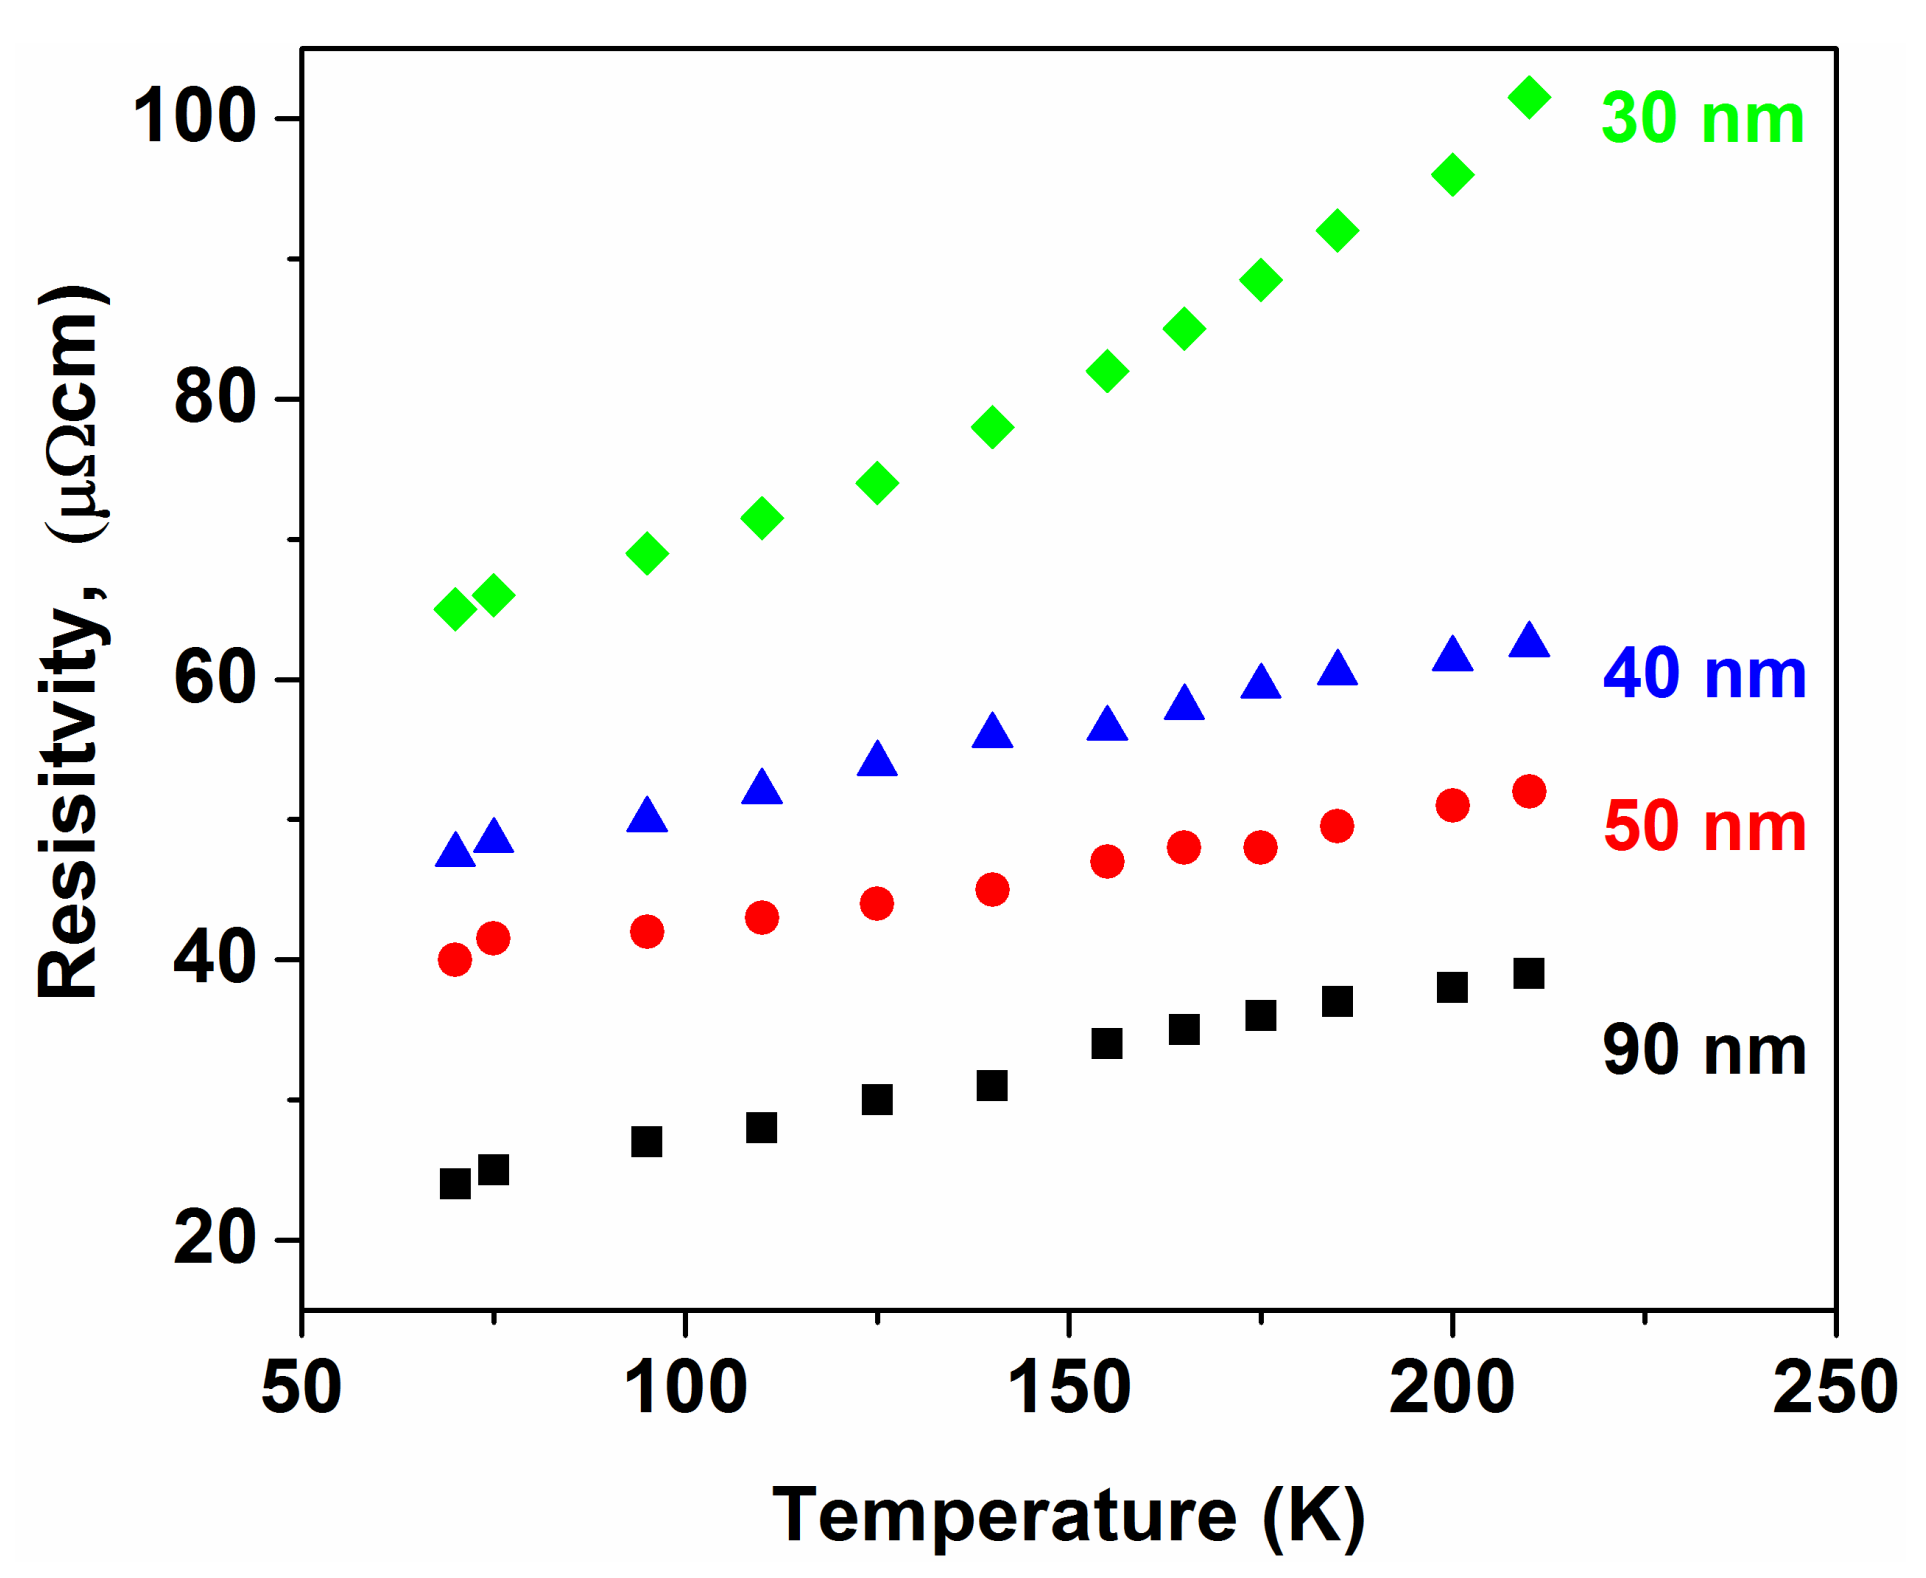
2.4. Compositional Effects as Cluster Manifestation in Thermal and Magnetic Properties of Fe(TM)-B Glasses

The cluster structure cannot be manifested in all physical properties. The hardness, for example, reflects mainly the average bonding type and strength (see, the example, for Fe-B glasses in Figure 4c). As the B content XB increases, the hardness also increases within the whole glass-forming concentration range. The simultaneously increasing brittleness of the glassy state around 25 at.% resembles the mechanical properties of intermetallic compounds. The composition dependence in terms of the B content also indicates the dominant role of covalent bonding character, arising from the glass-former component B.
Similarly, transport properties (electrical conductivity or thermopower) or even traditional structural information (X-ray diffraction) provide information about the bulk continuum character of the material. In contrast, the cluster-level structural organization is supported by high-resolution electron microscopic studies (see [13,14,15,16]). This structure is often assigned as “medium-range order”.
The indirect manifestation of the cluster structure is especially distinct in the thermal and magnetic properties of Fe-B glasses, when the metalloid concentration (B) is altered, as well as when the host metal is partially replaced by second 3d transition elements.
For demonstration, the well-known crystallization mechanism is cited from [51]. Two-step crystallization is typical in the hypo-eutectic region. This mechanism is strongly supported by DSC and thermomagnetic measurements. In spite of intensive research, the details of the mechanism and especially the interpretation are contradictory. The crystallization sequence is the following:
I.
am-FeB → α-Fe + am’-Fe75B25 (composition of the remaining amorphous phase)
II.
am’-Fe75B25 → Fe3B
III.
Fe3B → α-Fe + Fe2B.
The crystallization mechanism can supply (indirect) evidence for the existence of a cluster-level structure. The two-step mechanism in the hypo-eutectic region is similar to the transformation kinetics in hypo-eutectoidal austenitic steels [52].
The difference between the onset temperature of crystallization (I and II steps) increases with decreasing B content (see Figure 4a), i.e., the temperature of α-Fe precipitation (I reaction) gradually shifts to lower temperatures. The remaining amorphous phase decomposes into a metastable (Fe3B) crystalline phase. One should emphasize at the same time that the Fe3B (metastable) phase can be detected during the amorphous phase decomposition only, so it is not included in the equilibrium phase diagram. Reaction III cannot be detected as thermal effect, but it can be recognized by analyzing thermomagnetic curves (combining the thermomagnetic information with the results of XRD measurements) [53] (see Figure 5).
In Figure 5, thermomagnetic curves are plotted for monitoring the decomposition of a hypo-eutectic Fe85B15 glass by measuring the change in magnetization during continuous heating. The curves illustrate the role of the quenching rate on the shape of the M(T) curve. Exceeding the Curie temperature of the sample (Tcam ≈ 620 K), the first upraise of magnetization arises from the α-Fe precipitation and also from the beginning of precipitation of the metastable Fe3B phase, which is still ferromagnetic at this temperature (TcFe3B ≈ 800 K) [55]. The abrupt decrease in M(T) beyond 700 K is the consequence of the reaction III. The remaining magnetization in the high temperature range arises from Fe2B and α-Fe. From the comparison of these two curves, it is clear that the reaction rate of the amorphous-to-crystalline decomposition but especially the reaction III are sensitively influenced by the rate of liquid quenching.
The two-step mechanism can be easily explained assuming the co-existence of two cluster types in the as-quenched hypo-eutectic glassy structure. The amorphous-crystalline decomposition starts with the decomposition and transformation of Fe-rich (solid solution-like) amorphous clusters to the crystalline state. As the bonding is weak inside the clusters, the atomic mobility is high in these regions (Figure 4b). When XB increases (XB approaches the eutectic composition), an overlap occurs between the reactions I and II and only a single peak is visible in the DSC traces.
More direct information can be derived from the XB -dependence of the total crystallization enthalpy ΔHcryst (including steps I and II, c.f. Figure 4b). The total ΔHcryst increases rapidly in the hypo-eutectic range (with decreasing B content), indicating that the contribution of am-[Fe,(B)]-(solid solution-like) clusters is significant in determining the magnitude of “quenched-in” excess enthalpy. As the covalent bonding character increases in the glass, (increasing metalloid content) ΔHcryst is lowered. This suggests that the dominant portion of ΔHexcess (associated with the metastable amorphous state) is localized in the Fe-rich clusters.
This extraordinary concentration dependence can be explained considering the analogy between the mechanism of the outlined two-step crystallization process and the transformation phenomenology of residual austenite in simple carbon steels [56]. Residual austenite is the part of austenite that is not transformed to martensite during aging (rapid cooling). It means that a portion of austenite (in the form of fcc solid solution) is entrapped when rapid cooling (aging) is performed. The volume fraction of residual austenite can be significant (even vol.% = 5% in simple carbons steels) [56]. This residual austenite transforms into stable phases even at low temperatures [57,58]. The quenched-in austenite is metastable compared to the (equilibrium) ferrite and cementite phases at room temperature. In the as quenched state, localized fcc-like clusters with excess energy are entrapped. One can assume that such small clusters with fcc-like symmetry can also be retained during the liquid quench [57], representing stored energy (and behave as quenched-in phase reminiscences), hence contributing to the overall crystallization enthalpy.
The XB-dependence of the Curie temperature (Tcam) and the magnetic moment/atom (μFe) in binary Fe-B glasses presents an even more spectacular anomaly (Figure 6a).
Both TCam and the magnetic moment, (μ) per Fe atom decrease in the hypo-eutectic region (with decreasing XB). This fact also confirms the hidden structure change, i.e., the appearance of such Fe environments, in which local ferromagnetic coupling is weak [59]. The structural change is also supported by density measurements [61]. According to the itinerant electron-structure model [62], such a concentration dependence between TCam and B is not expected. This contradictory behavior can be understood on the basis of fluctuating local atomic volume in the hypo-eutectic glass (Figure 6a,b). This fact hints to the co-existence of anti-ferromagnetic and ferromagnetic coupling between neighboring Fe atoms as a function of local interatomic distances (local change in the packing density). As the number of “dense centers” (“compressed” cluster-types) gradually increases, a continuous drop of TCam and the saturation polarization can be detected. The breakdown of ferromagnetic coupling is in qualitative agreement with the expectation from the Bethe–Slater curve [63]. These phenomena are the kinetic consequence of the entrapped “bcc-like” (γ-phase) retainment (phase-reminiscences) in the as-quenched Fe-B glass.
Figure 6b depicts the local H-induced expansion on the cluster level and the connected change in the exchange integral (J) in the case of pure fcc symmetry Fe-environments (left side of the BS curve) and in Ni-containing fcc symmetries (right side of the BS curve). In Figure 6c, J can increase or decrease locally due to H-absorption, depending on the Fe/Ni ratio. The H-induced changed will be discussed later.

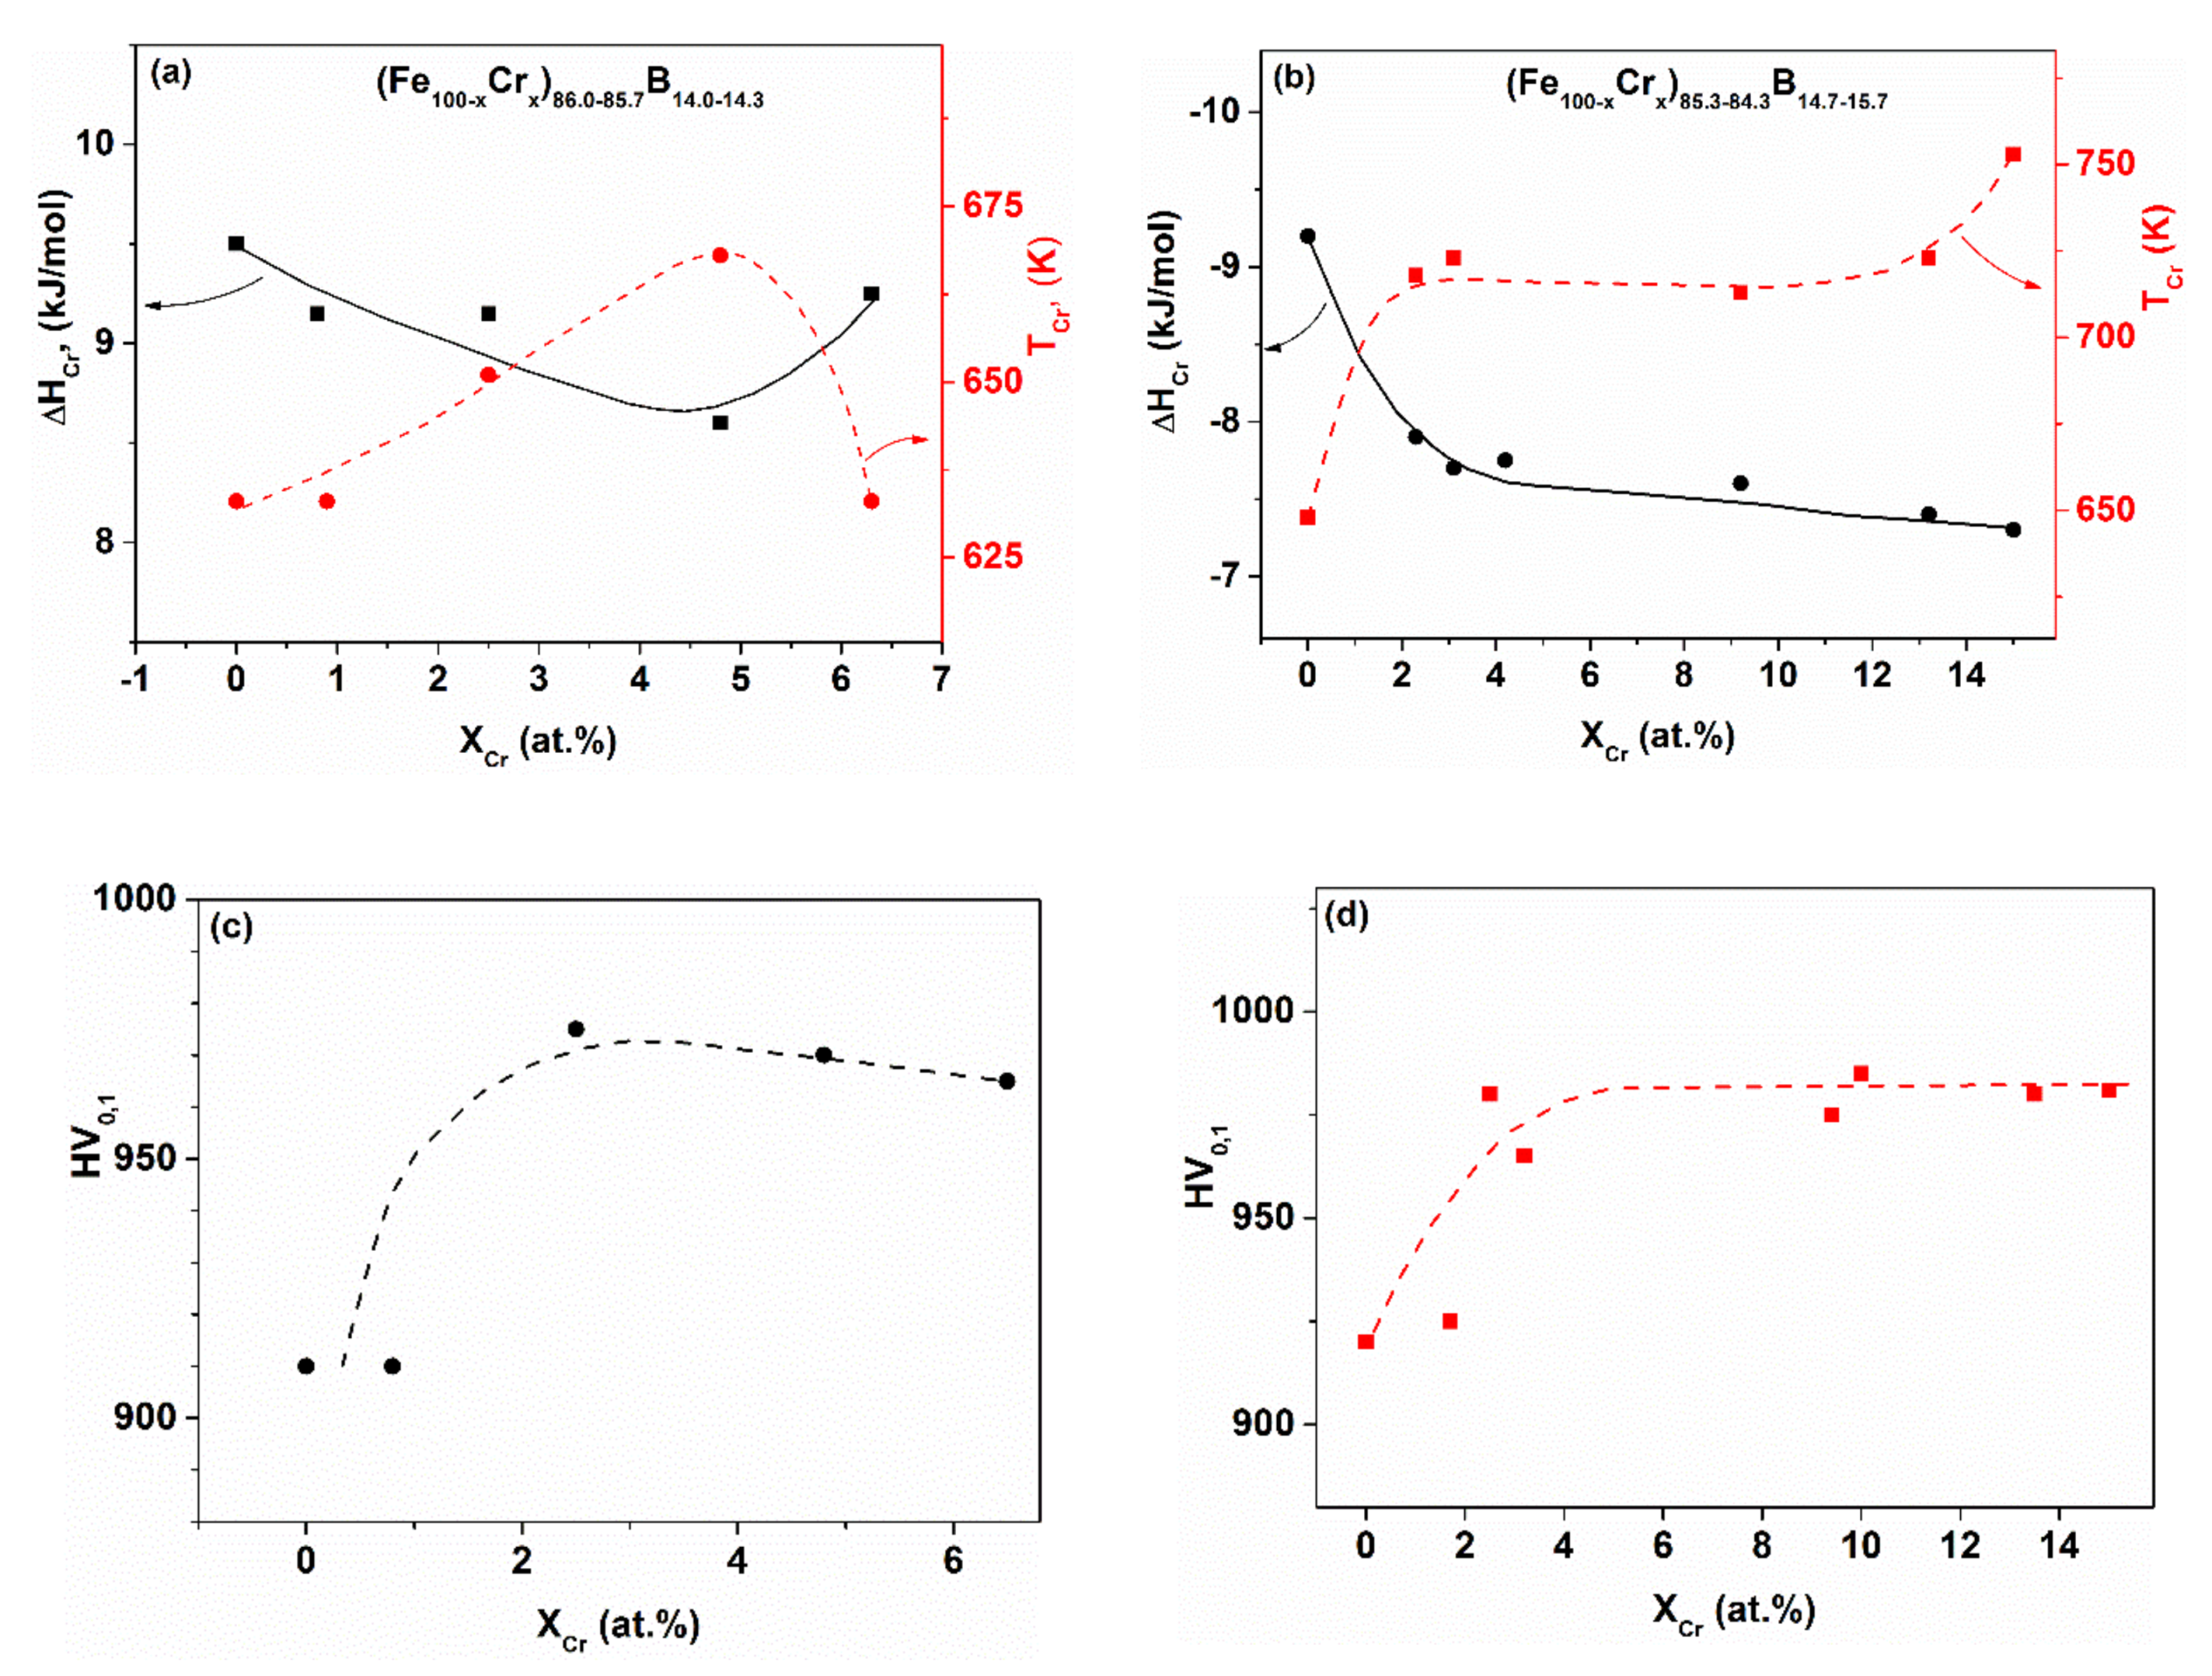
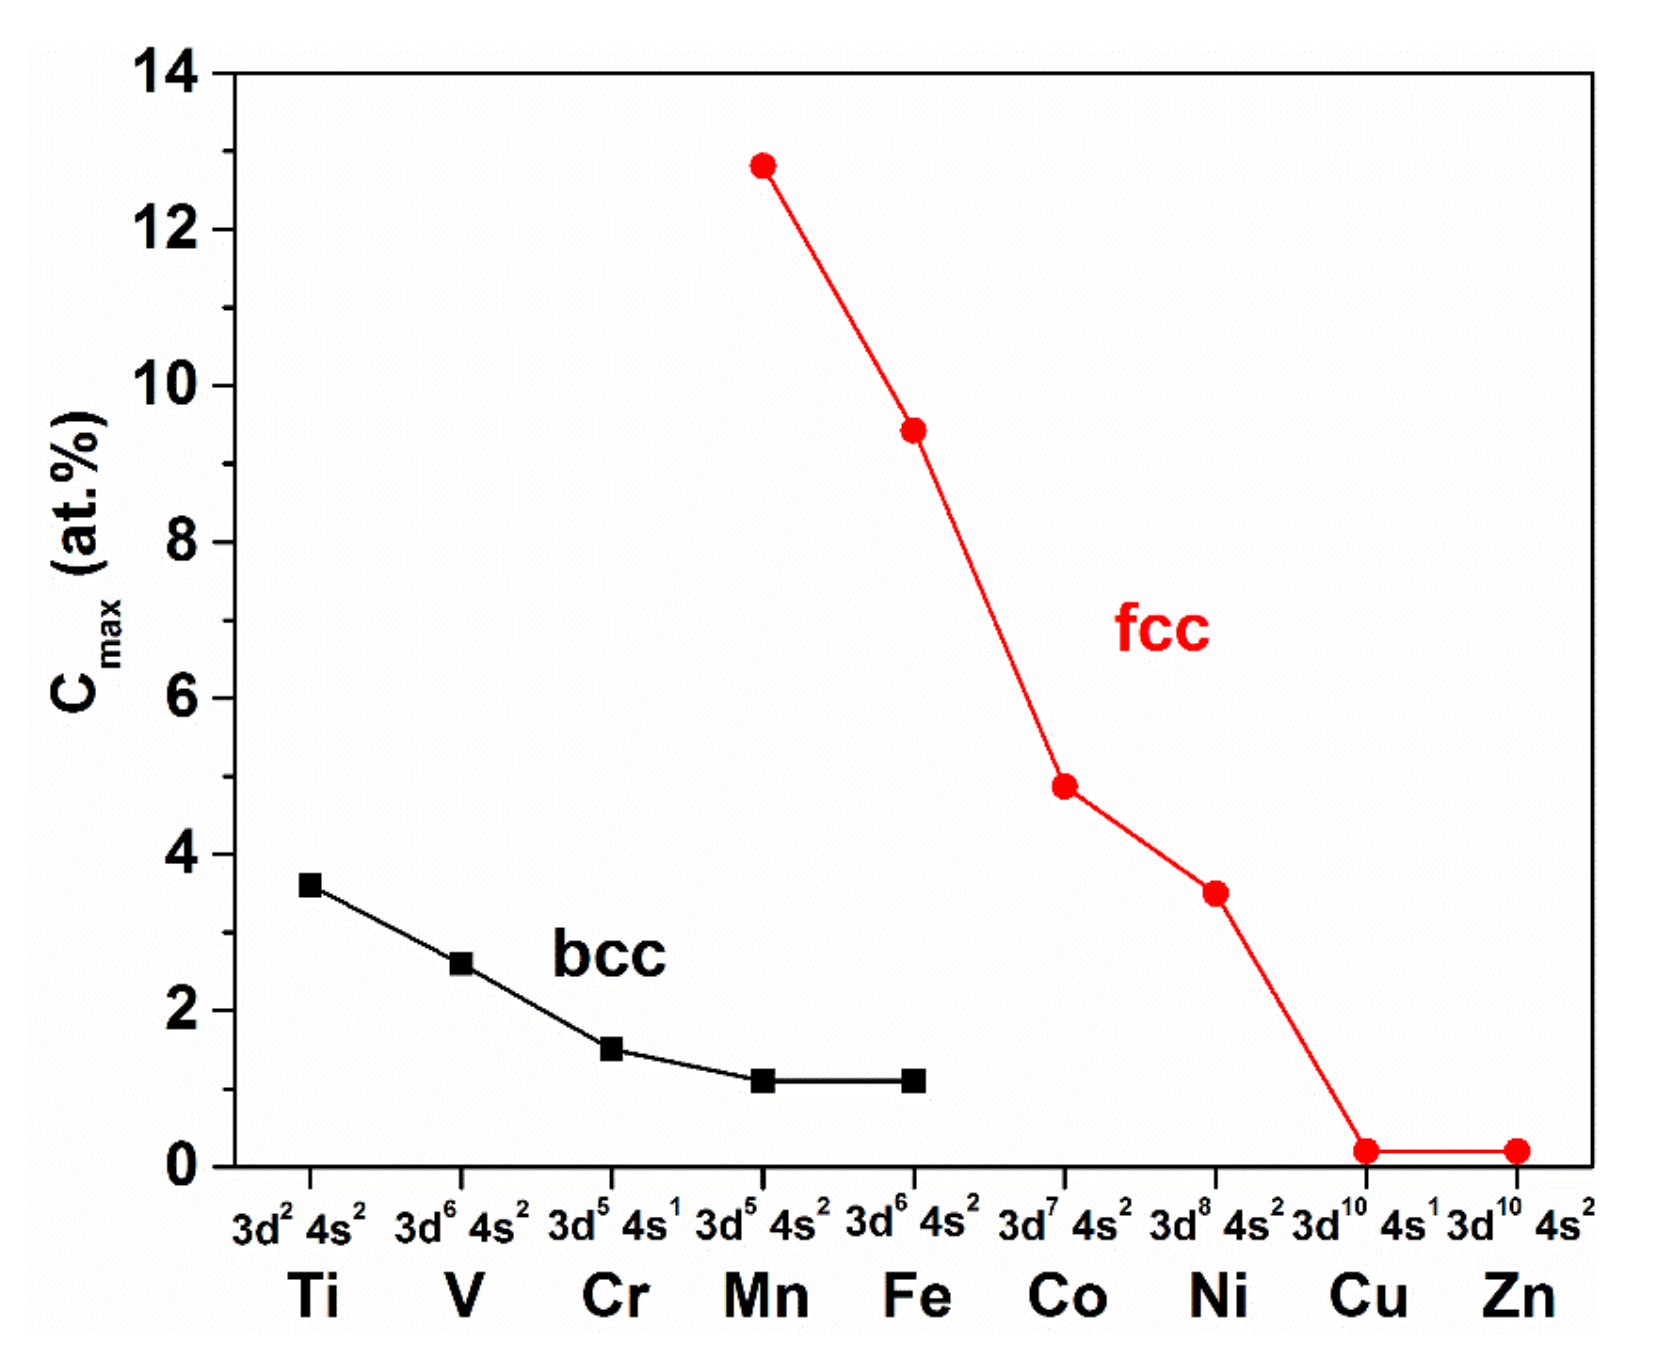
2.5. Cluster Manifestation in the Host Metal Replacement

The effects of alloying have been studied in several hypo-eutectic Fe-B glasses, replacing the Fe host metal by other transition elements (T), at a constant metalloid content [50,64]. The widely accepted, traditional interpretation of alloying effects (replacement of the host metal by other T elements) is based on the change of d electron concentration (ed/a).
The relevant experimental results for Fe-Cr-B glasses can be seen in Figure 7a–d. A characteristic non-linear concentration dependence is detected in several properties as a function of Cr content, in contrast to the expected continuous change. A sharp change is found in (Tcr), and in (ΔHcryst) in the range of low Cr contents (at around 4 at.% Cr content). The inverse relation between Tcr and ΔHcr is also remarkable. This relation is fulfilled even at higher boron contents (Figure 7b). The non-linearity of the hardness change as a function of Cr content is even more surprising. Figure 8 shows TCam and the thermopower (U) for the glassy FeCrx-B16 alloys. These non-linearities are also surprising, as Cr and Fe form a continuous series of solid solutions in the whole concentration range, so that a continuous change in the electronic structure is expected. In contrast, concentration-dependent discontinuities are found in several properties. The presented, remarkable deviation from linearity cannot be explained solely on the basis of d electron concentration changes, resulting from Fe replacement.
Hence, in spite of the basically single-phase nature of the glassy state, the contribution of hidden structural factors is suspected determining the properties of Fe-based glasses. The observed discontinuities point to a co-existence of quenched-in (mixed) γ and α-type cluster assemblies as property determining factors in the present type of glasses [66]. One can summarize the cluster formation tendency during the host metal replacement as follows:
The origin of cluster formation in the liquid state is the co-existence of various bonding types between the components. The third element contribution to the cluster formation is governed by the:
a.
Affinity of T metals to the metalloid (the differences can be inferred from the appropriate heat of formation between the T elements and Fe-borides, respectively);
b.
An additional source of cluster formation is the already discussed entrapment of γ-type phase reminiscences.

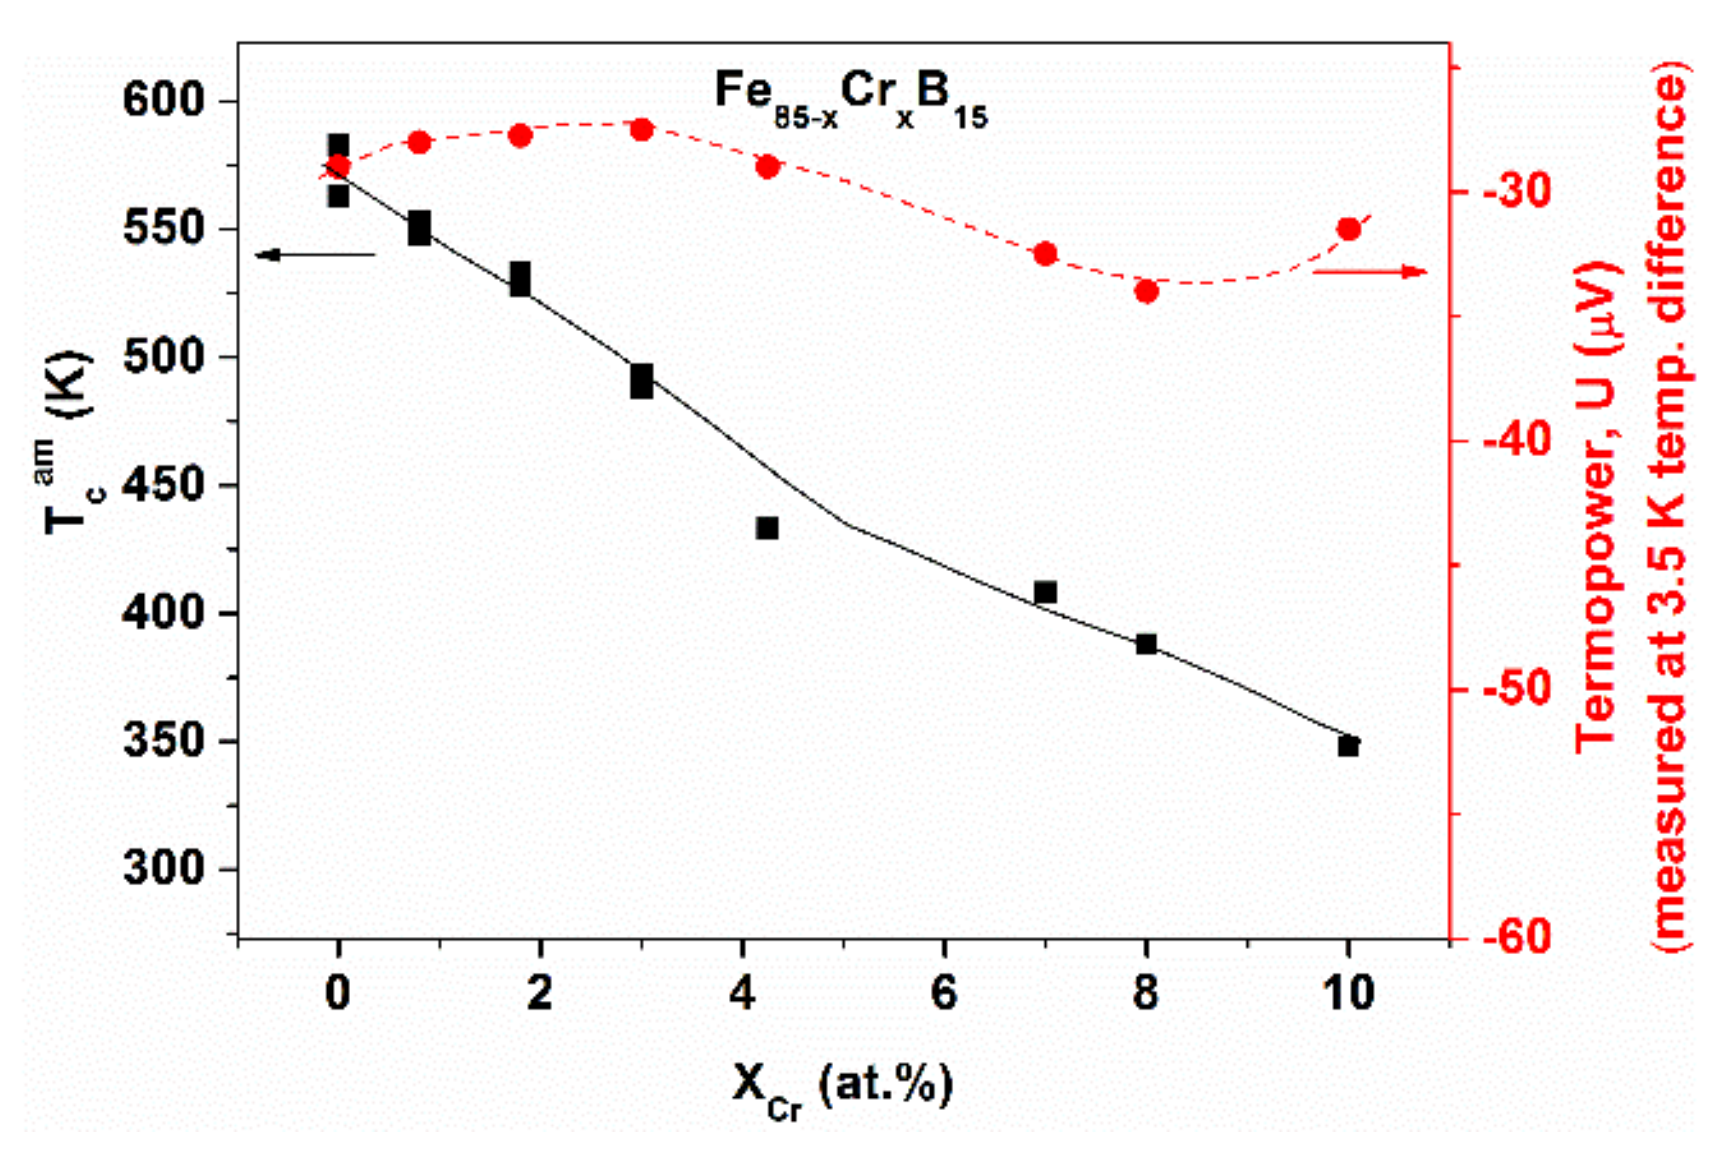
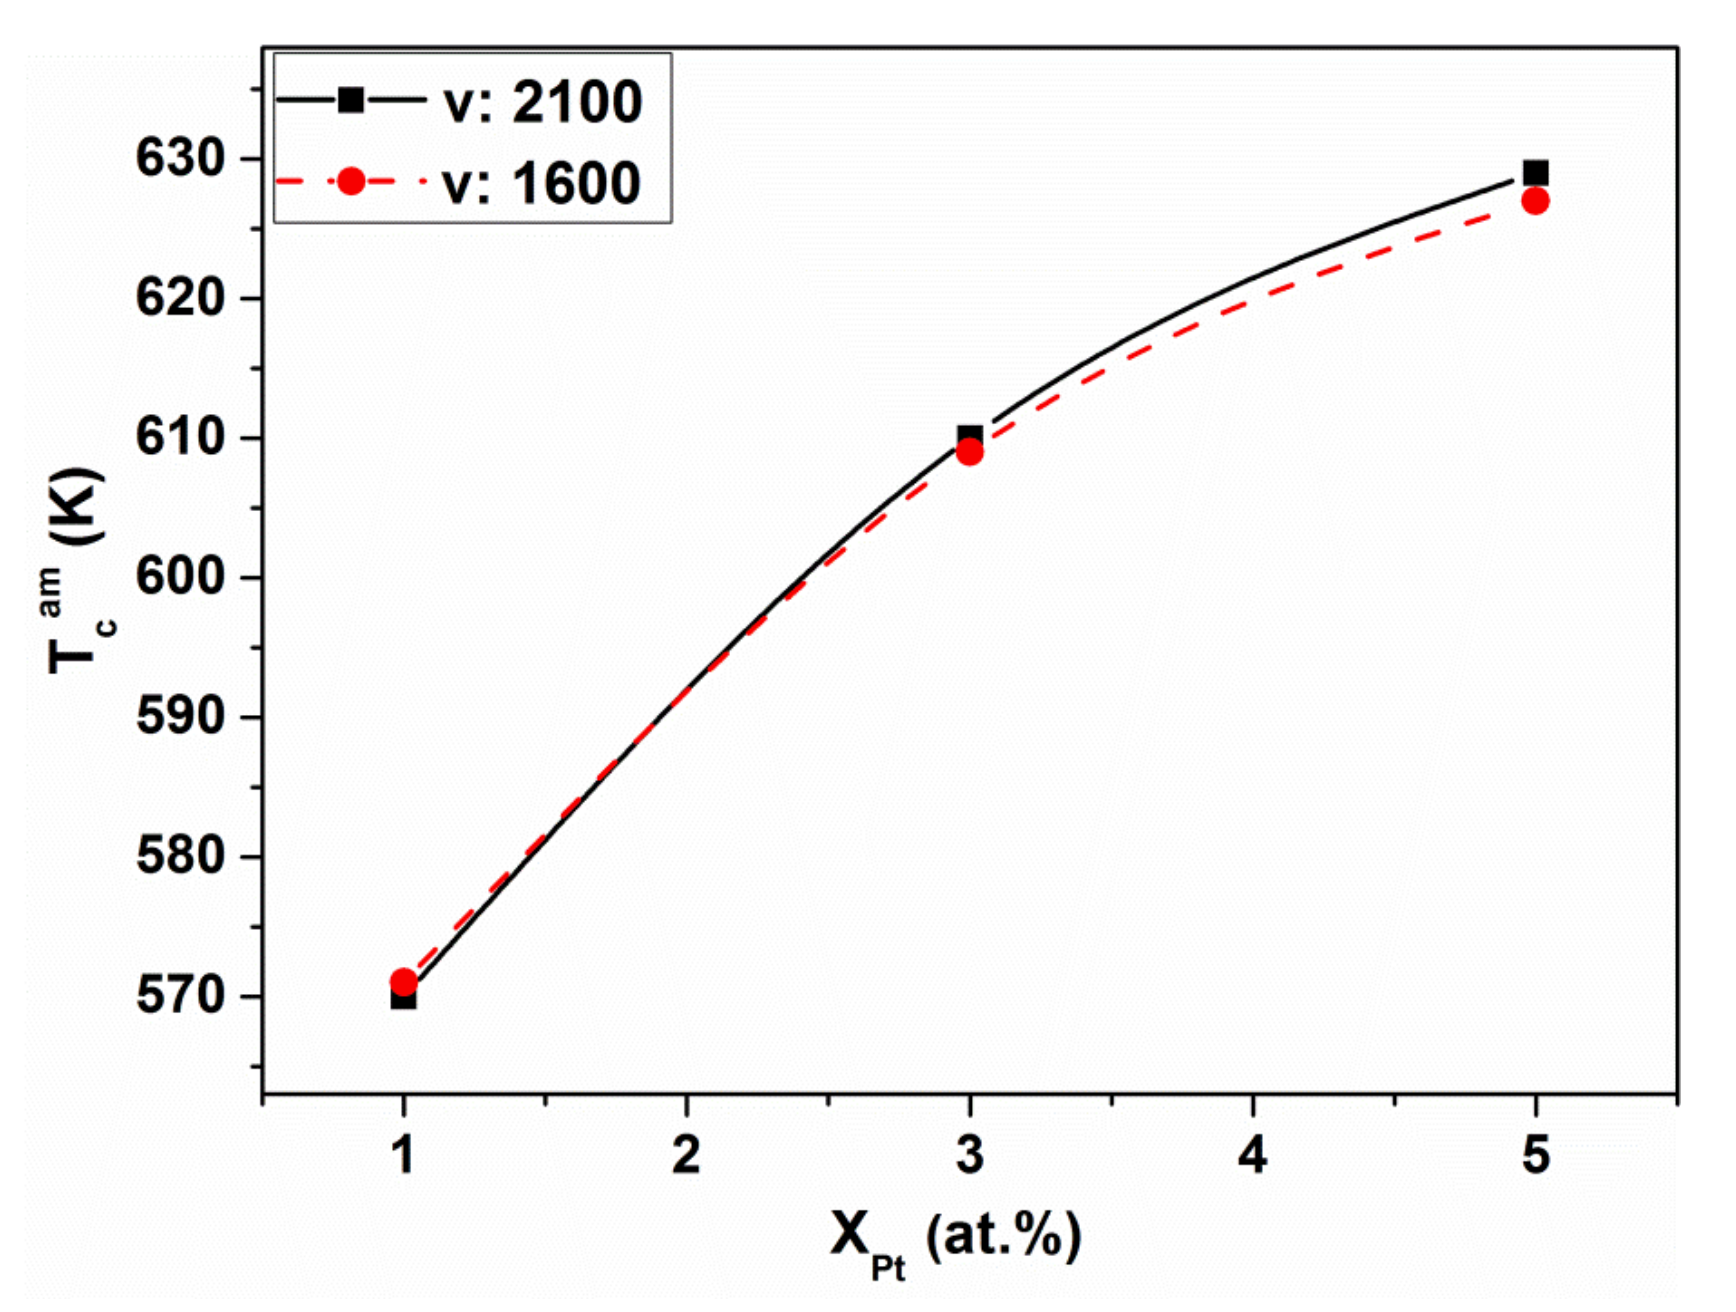
2.6. Fluctuating Exchange Interaction in Fe-B Glasses, Induced by Third Metallic Element Additions

The consequence of the polycluster concept is the inhomogeneous distribution of free volume [67] over the distance of neighboring clusters. Hence, density fluctuations exist over a few inter-atomic distances. As the sign and magnitude of the exchange interaction (J) is influenced by the inter-atomic spacing (combined with the chemical influence of third elements), the resulting J can be strengthened or weakened. This conclusion is similar to Egami’s proposal in which the conception of compressed and stressed atomic environments was postulated [68].
The fluctuating exchange interaction is supported by the rapid (Boron concentration-dependent) TCam increase in hypo-eutectic Fe-B15, when Fe is replaced by Ni or Pt (compare Figure 9 and Figure 10).
The Curie temperature (TCam) of the amorphous Fe-B15 alloys rises when Fe is partially replaced by Ni or Pt. However, this effect is detectable only at low (hypo-eutectic, Fe85B15) B content. In spite of the presence of non-ferromagnetic Pt, the effect of substitution is similar. Consequently, a similar mechanism can be expected in both cases. Both alloying additions (Ni or Pt) tend to reside preferentially in fcc environments, stabilizing them (see the appropriate equilibrium binary phase diagrams) [69,70]. When the Ni atoms are incorporated in fcc-like Fe-clusters, the increase of ferromagnetic interaction is more pronounced, due to the magnetic moment of the Ni atoms. The local incorporation of Pt atoms only causes a “size effect” and, therefore, the resulting TCam increase is small. In summary, ferromagnetic coupling is strengthened by the incorporation of Ni and Pt solute atoms into the solid solution-like clusters. These clusters behave as a “compressed” environment (higher local packing density inside, due to their fcc-like nature). Both the outlined influence of the moment of Ni atoms, as well as the fact that Pt atoms induce local expansion (“size effect”) fit well to the predictions of the Bethe–Slater concept [63].

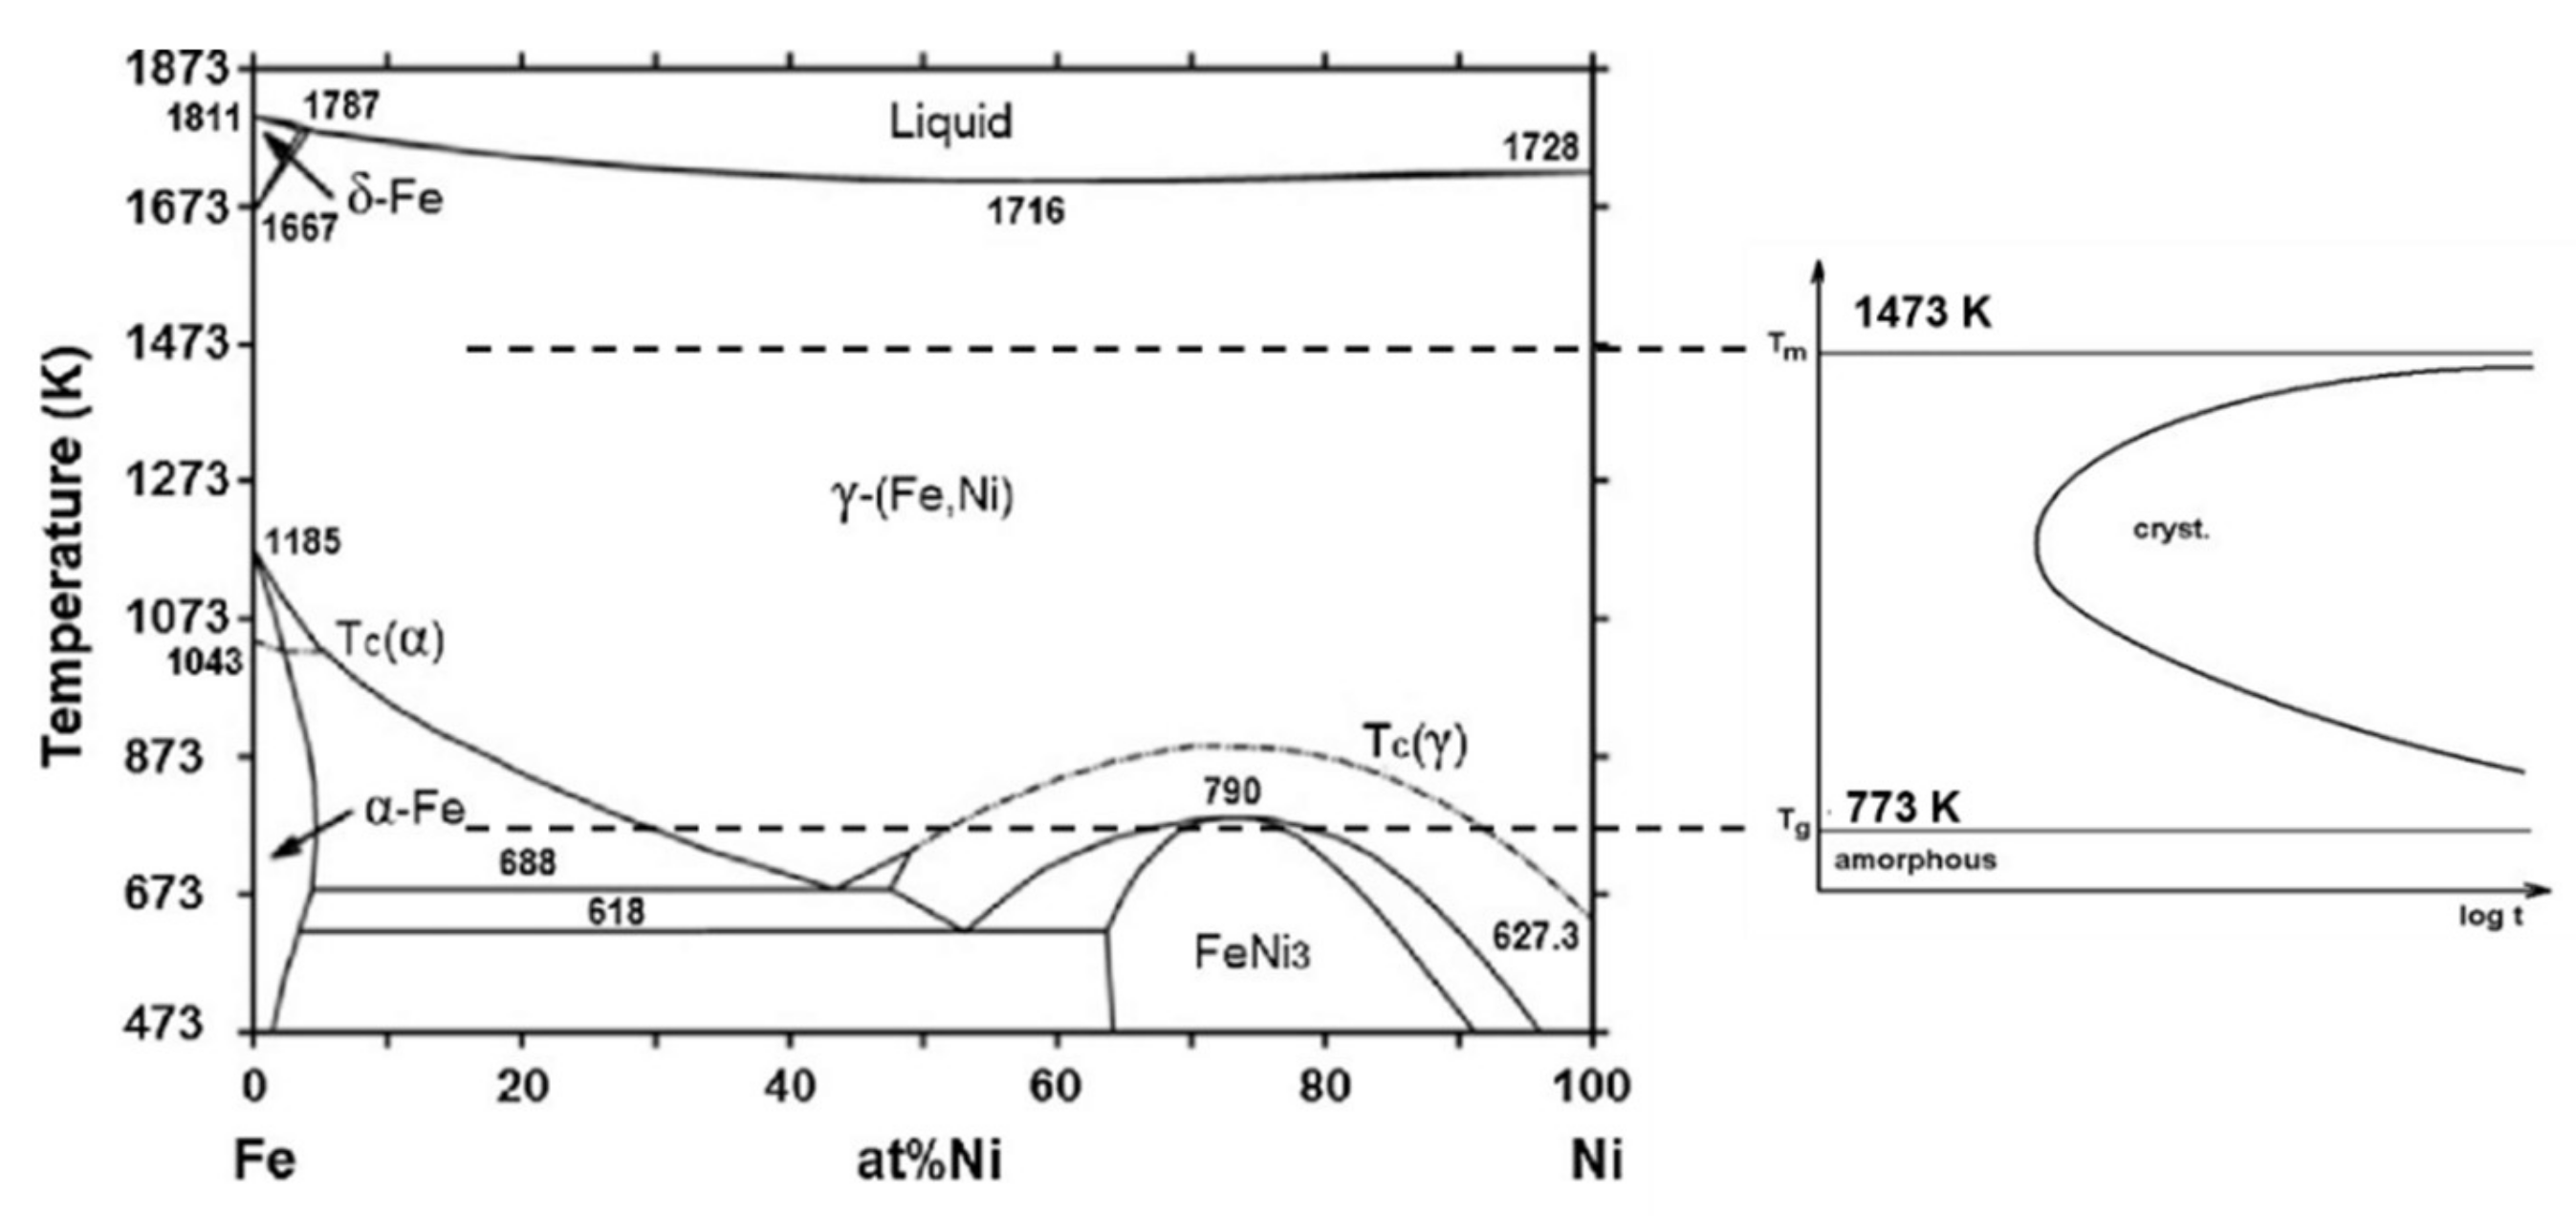
2.7. Cluster Manifestation (as γ-Phase Reminiscence) in the Enthalpy and Curie Temperature Relaxation of Fe- and Fe-Ni-Based Glasses Metallurgical Approach to the Interpretation

In many application-oriented references [71,72,73], “structural relaxation” is directed to the improvement or tailoring of the magnetic properties via appropriate heat treatments in the temperature range of Trelax < Tg.
In general, in thermodynamic considerations, the concept of “relaxation” refers to all processes leading to reach thermodynamic equilibrium, as illustrated in Figure 1, including supercooled liquids and the temperature interval Trelax < Tg. At atomic-scale level, the elementary process can be either diffusive or cooperative [21]. In the present discussion both temperature ranges are involved [74,75]. At low temperatures (Trelax < Tg), relaxation is usually performed at constant temperature (in the amorphous state, below the Tg) but can produce glasses with different relaxed state changing the quenching rate of liquids. In the latter case, the cooling rate is altered mainly between Tm and Tg during liquid quenching. The phenomenological background, as well as the resulting changes in physical properties, are sufficiently documented [71,75]. In spite of this, modeling of the atomic level description of the relevant processes is less successful [76,77]. This is especially true in the case of Curie temperature relaxation. Irreversible and reversible relaxations are distinguished, during which TCam shifts in a reversible or irreversible way [78]. The irreversible shift (ΔΤCam) appears usually in the first period of heat treatments, or during the first measuring run, when the TCam is determined [78]. ΔTCam is predominantly positive in Fe-based glasses in the initial period of heat treatments. It has also been reported that irreversible TCam shifts are coupled with an irreversible free volume decrease (density increase) [75]. An “anomalous” Curie point relaxation was found in Cr-containing amorphous alloys (were TCam decreases in the first period of heat treatments) [79].
The diversity of experimental results together with the variety of alloy compositions hampers the understanding of the micro-mechanism of TCam relaxation. In the following, a new, “metallurgical approach” for the interpretation is proposed, based on the “phase reminiscence” hypothesis. At first, such property changes are explored, which are not directly coupled with “classical heat treatments”, i.e., the role of quenching rate on the enthalpy and TCam relaxation are discussed as cluster phenomena.

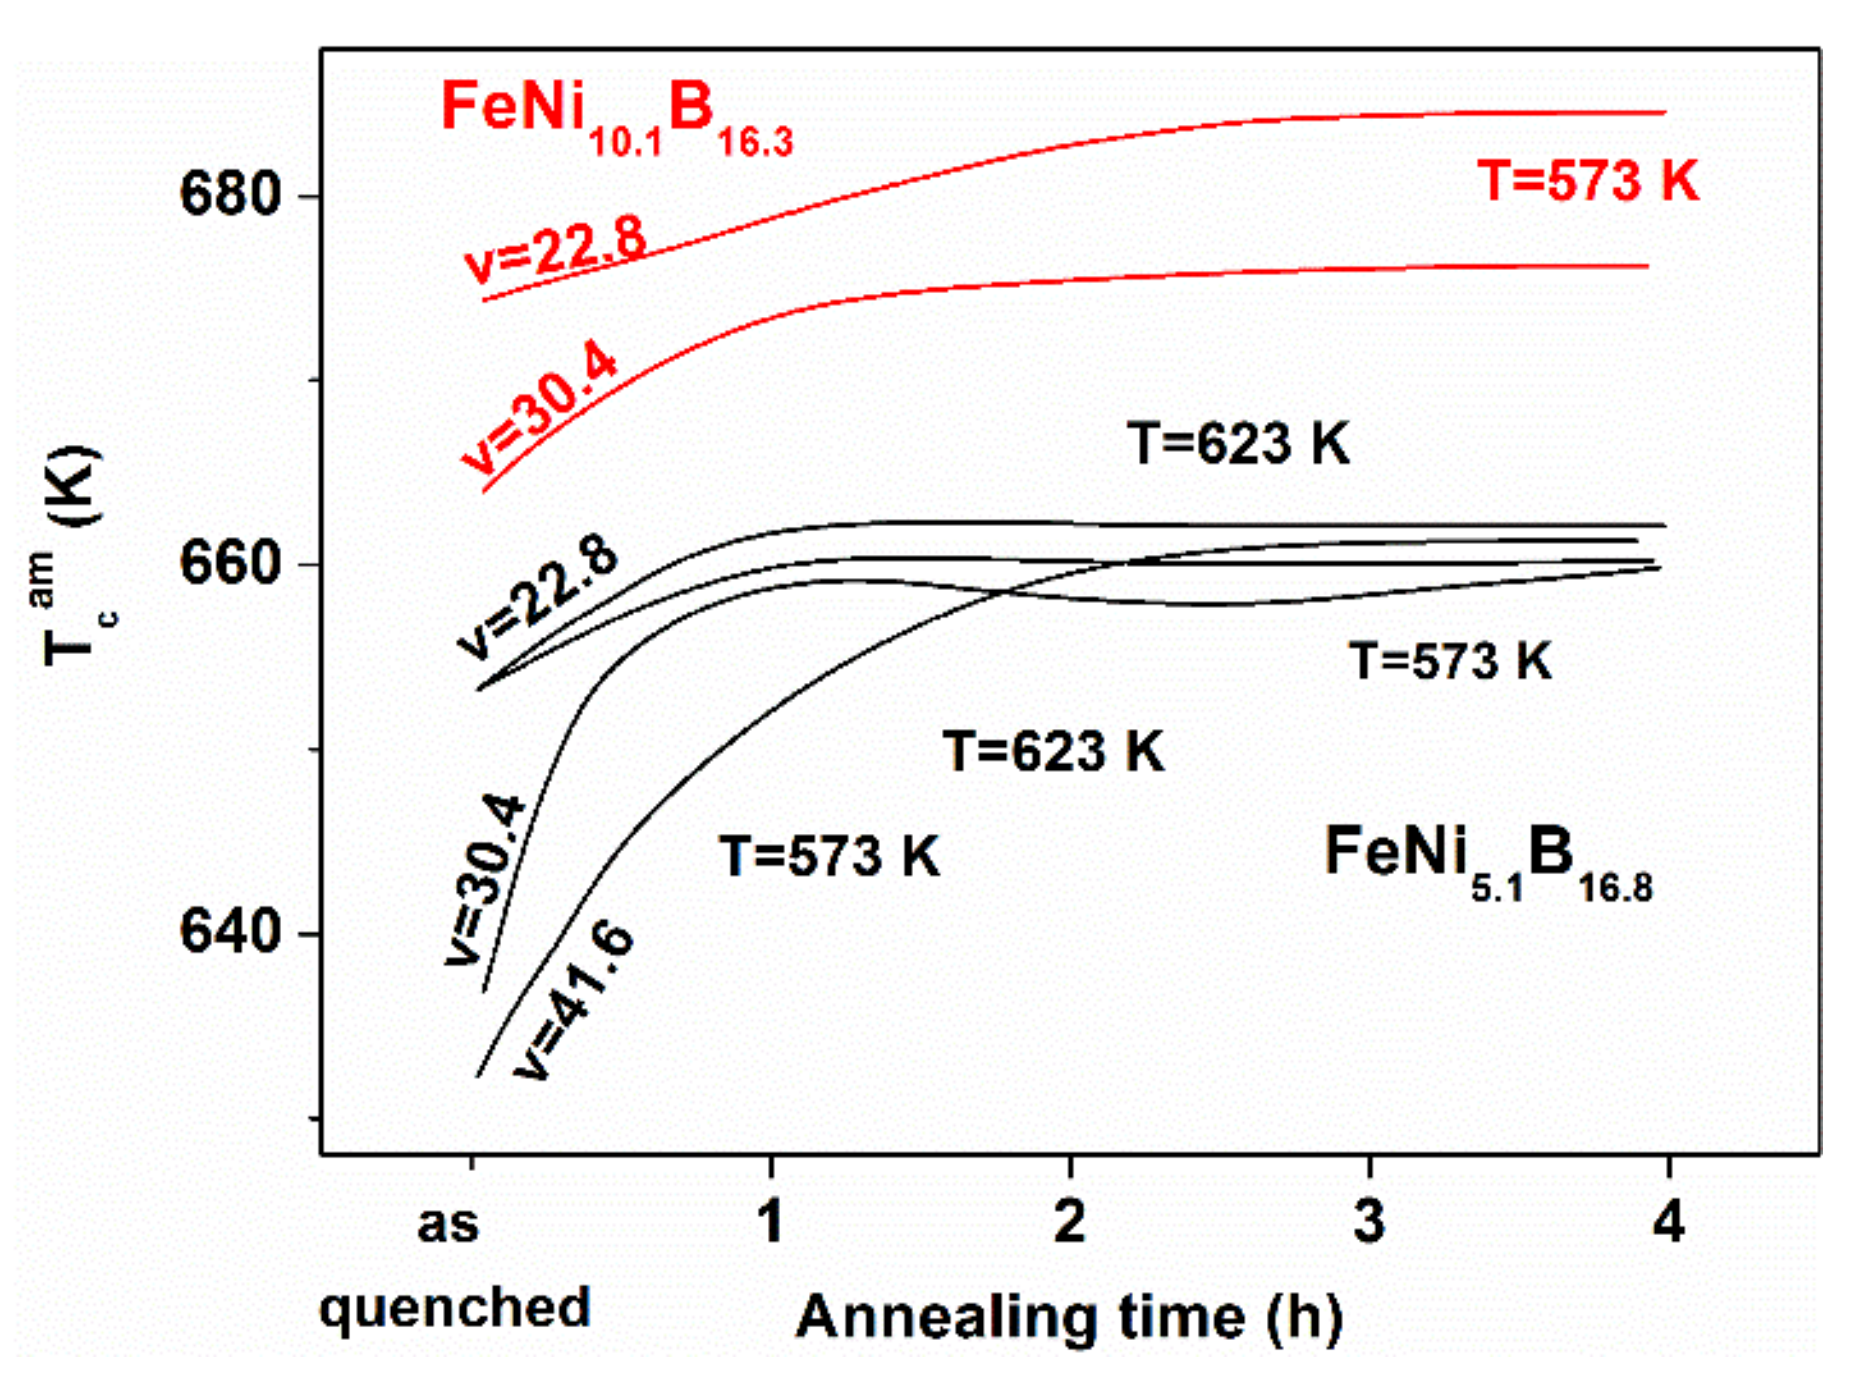
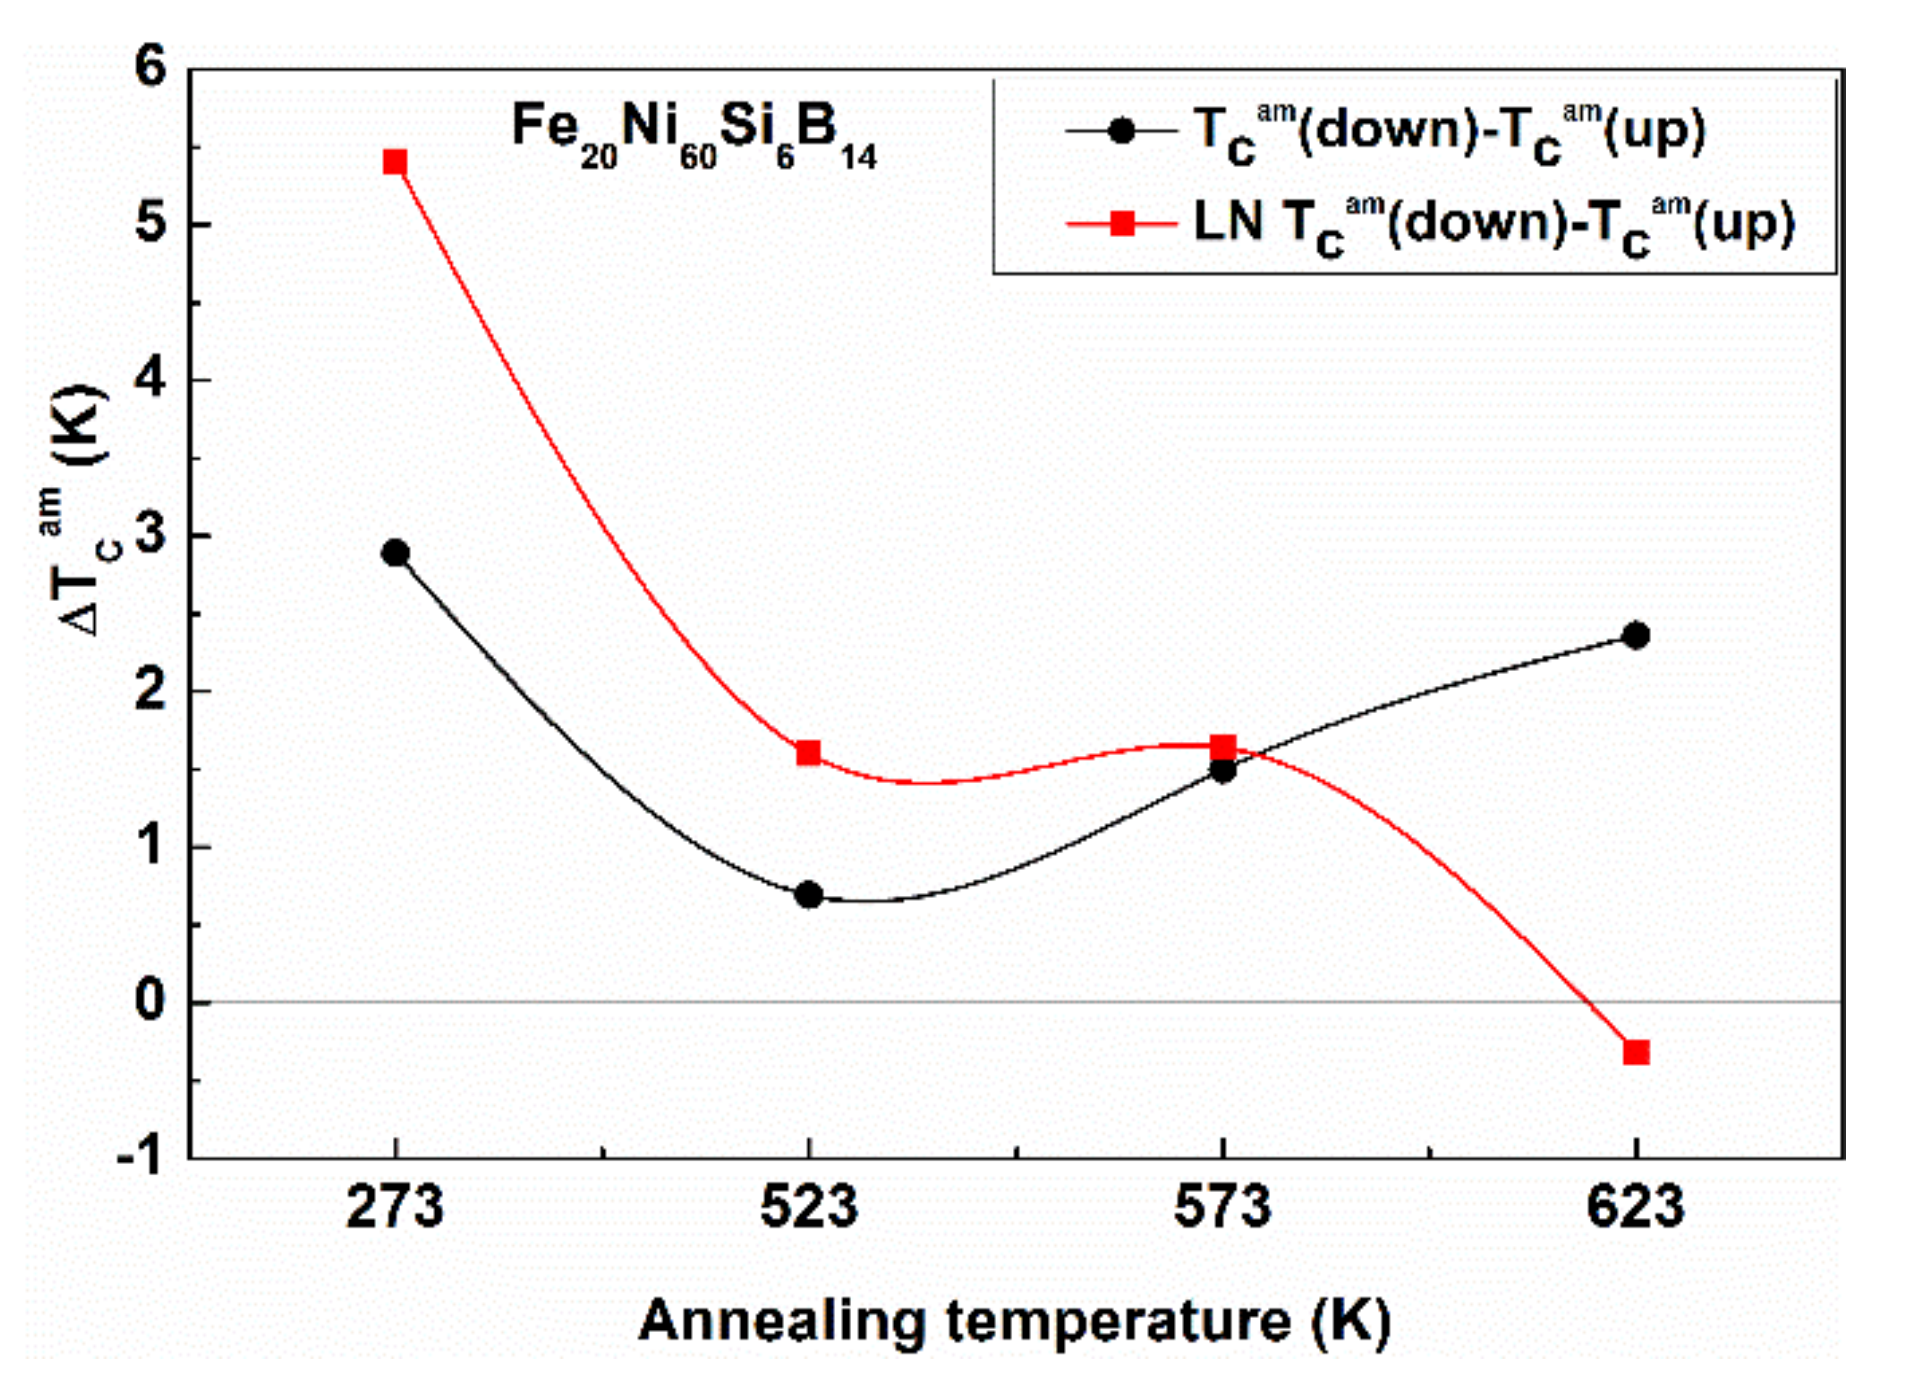
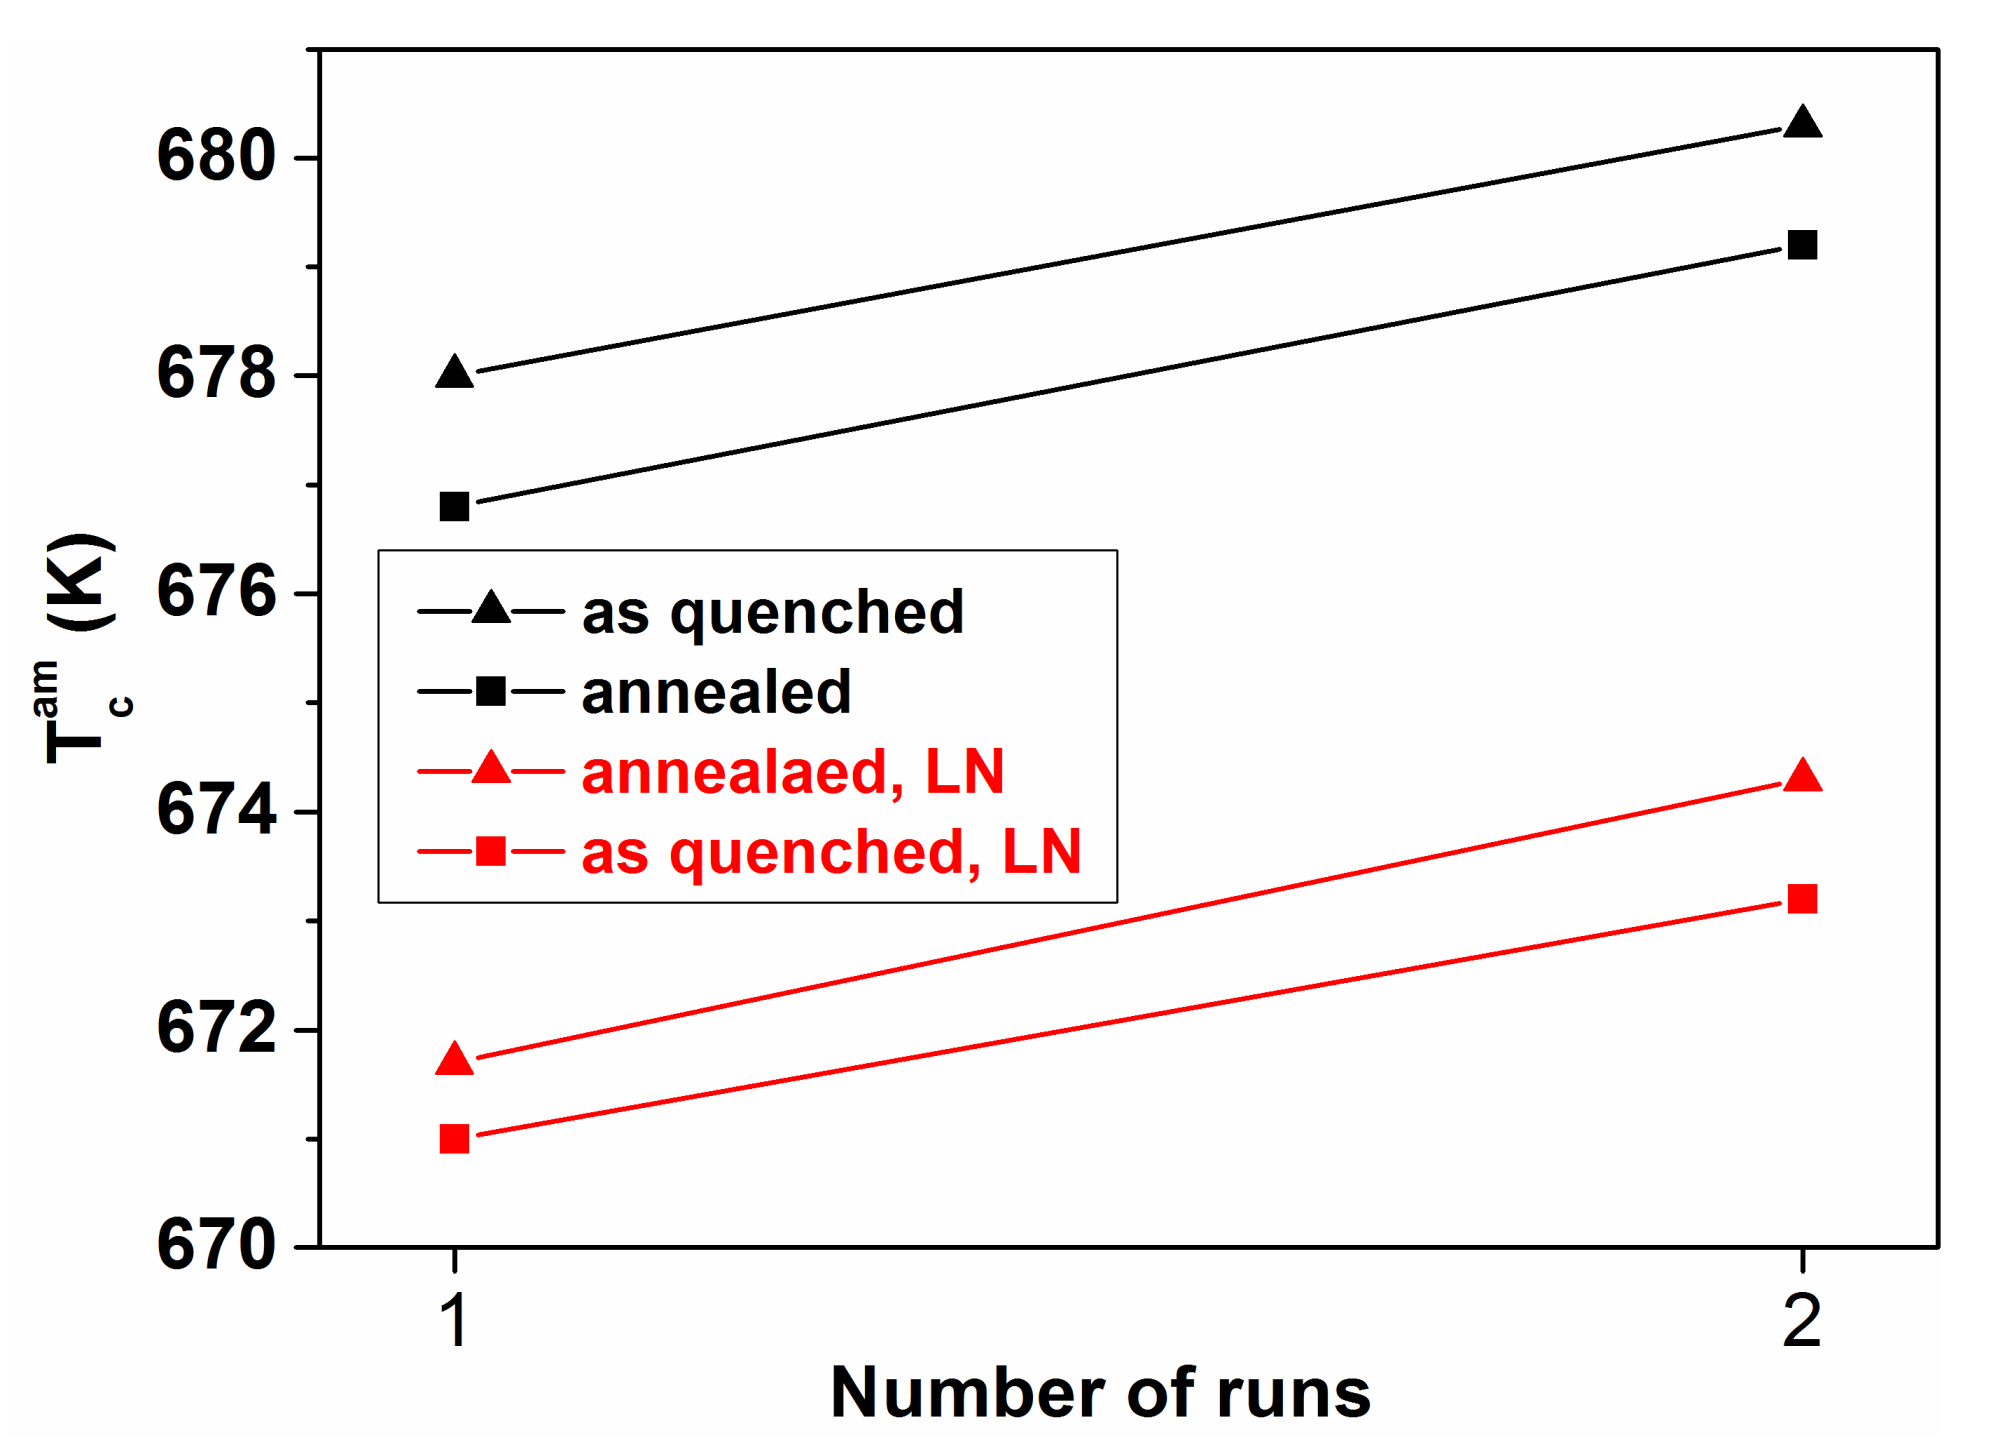
2.8. Irreversible and Reversible Enthalpy and TCam Relaxation

ΔHirr and ΔHrev versus the cooling rate are compared for Fe82.5B17.5 glasses in Figure 11. The difference in magnitude is remarkable. As expected, faster quenched ribbons (i.e., thinner ribbons) are in a less relaxed state. The quenching rate has obviously a dominant influence on the magnitude of ΔHirr. In contrast, the change of ΔHrev is negligible (near to the error bars) [74]. Therefore, ΔHirr and ΔHrev probably originate from different atomic processes. The majority of ΔHirr should arise from the supercooled liquid state (mainly from the temperature range of 2/3 TmeltTg) in which the atomic mobility is still high enough to cause local (mutual) composition changes between co-existing clusters, resulting in partial reordering within the time-scale of the quenching process. This means that the quenched-in chemical short-range environment in rapidly and slowly quenched samples can be different. The variation of the frozen-in cluster assembly leads to a significantly different shape of the thermograms and thermomagnetic curves during the crystallization experiments [53,54,80].
The data shown in Figure 11 is in good agreement with those reported in [81]. Figure 12 shows the total heat of relaxation for Fe25Ni55Si10B10 glasses quenched with varying cooling rates. The irreversible relaxation heat release is even higher than for binary Fe82.5B17.5.
Not only the magnitude, but also the thermal spectra of curves (T-dependence of heat evolution) exhibit a significant difference. The onset of heat release is at much lower temperatures for the thin (less relaxed) samples. The difference is especially pronounced at the low-temperature side, while the curves are roughly identical in the high temperature regime. Interpretation of the different shape of curves (a) and (b) in Figure 12b is possible when the difference in the population density of heat release centers at a given temperature range arising from the various strengths of the frozen atomic bonds which are gradually frozen with increasing supercooling of the melt taken into account. Hence, the thermal activation of elementary relaxation steps is also different. The low temperature part probably arises from atomic bonds with low binding energy. The high temperature side of the spectra is nearly identical for both thick and thin samples, showing that this part may arise from rearrangements of the frozen skeleton, which is nearly the same in both glasses.

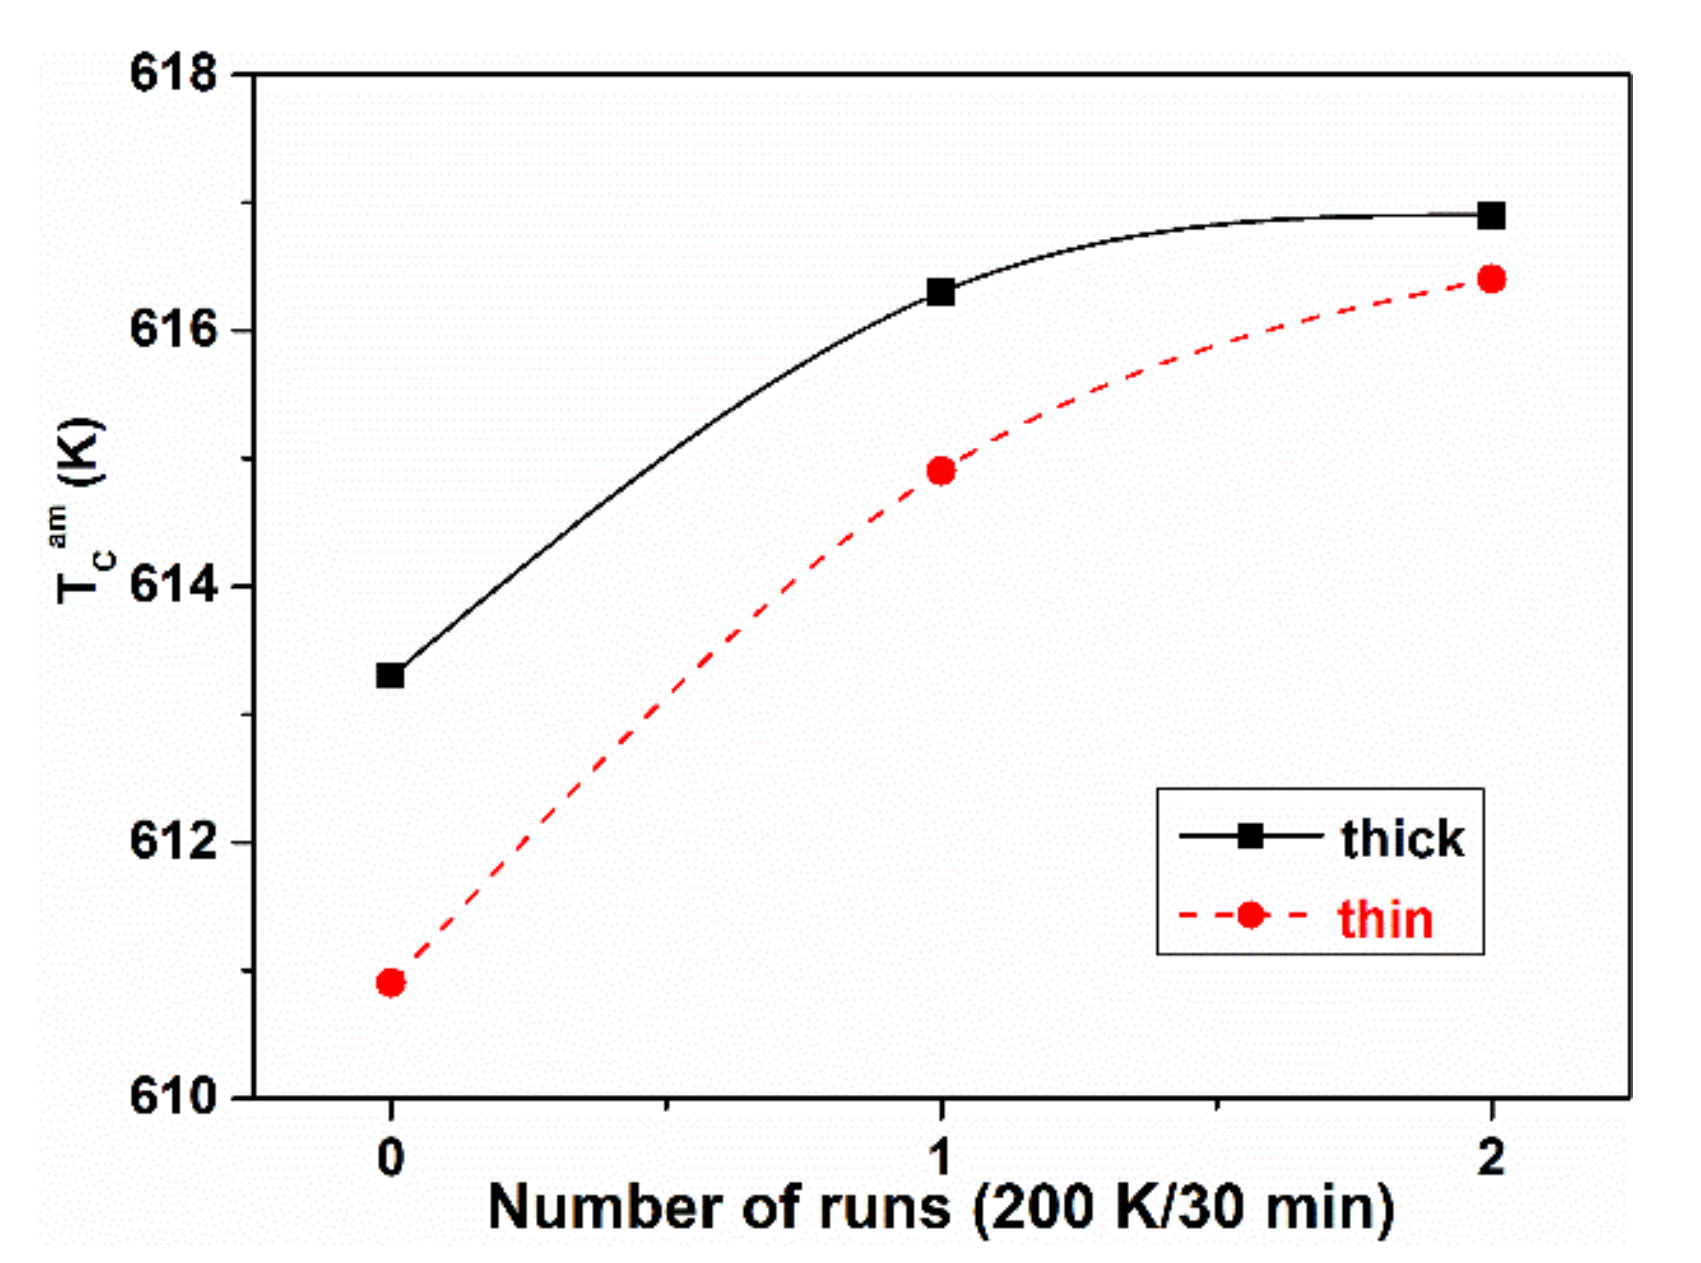
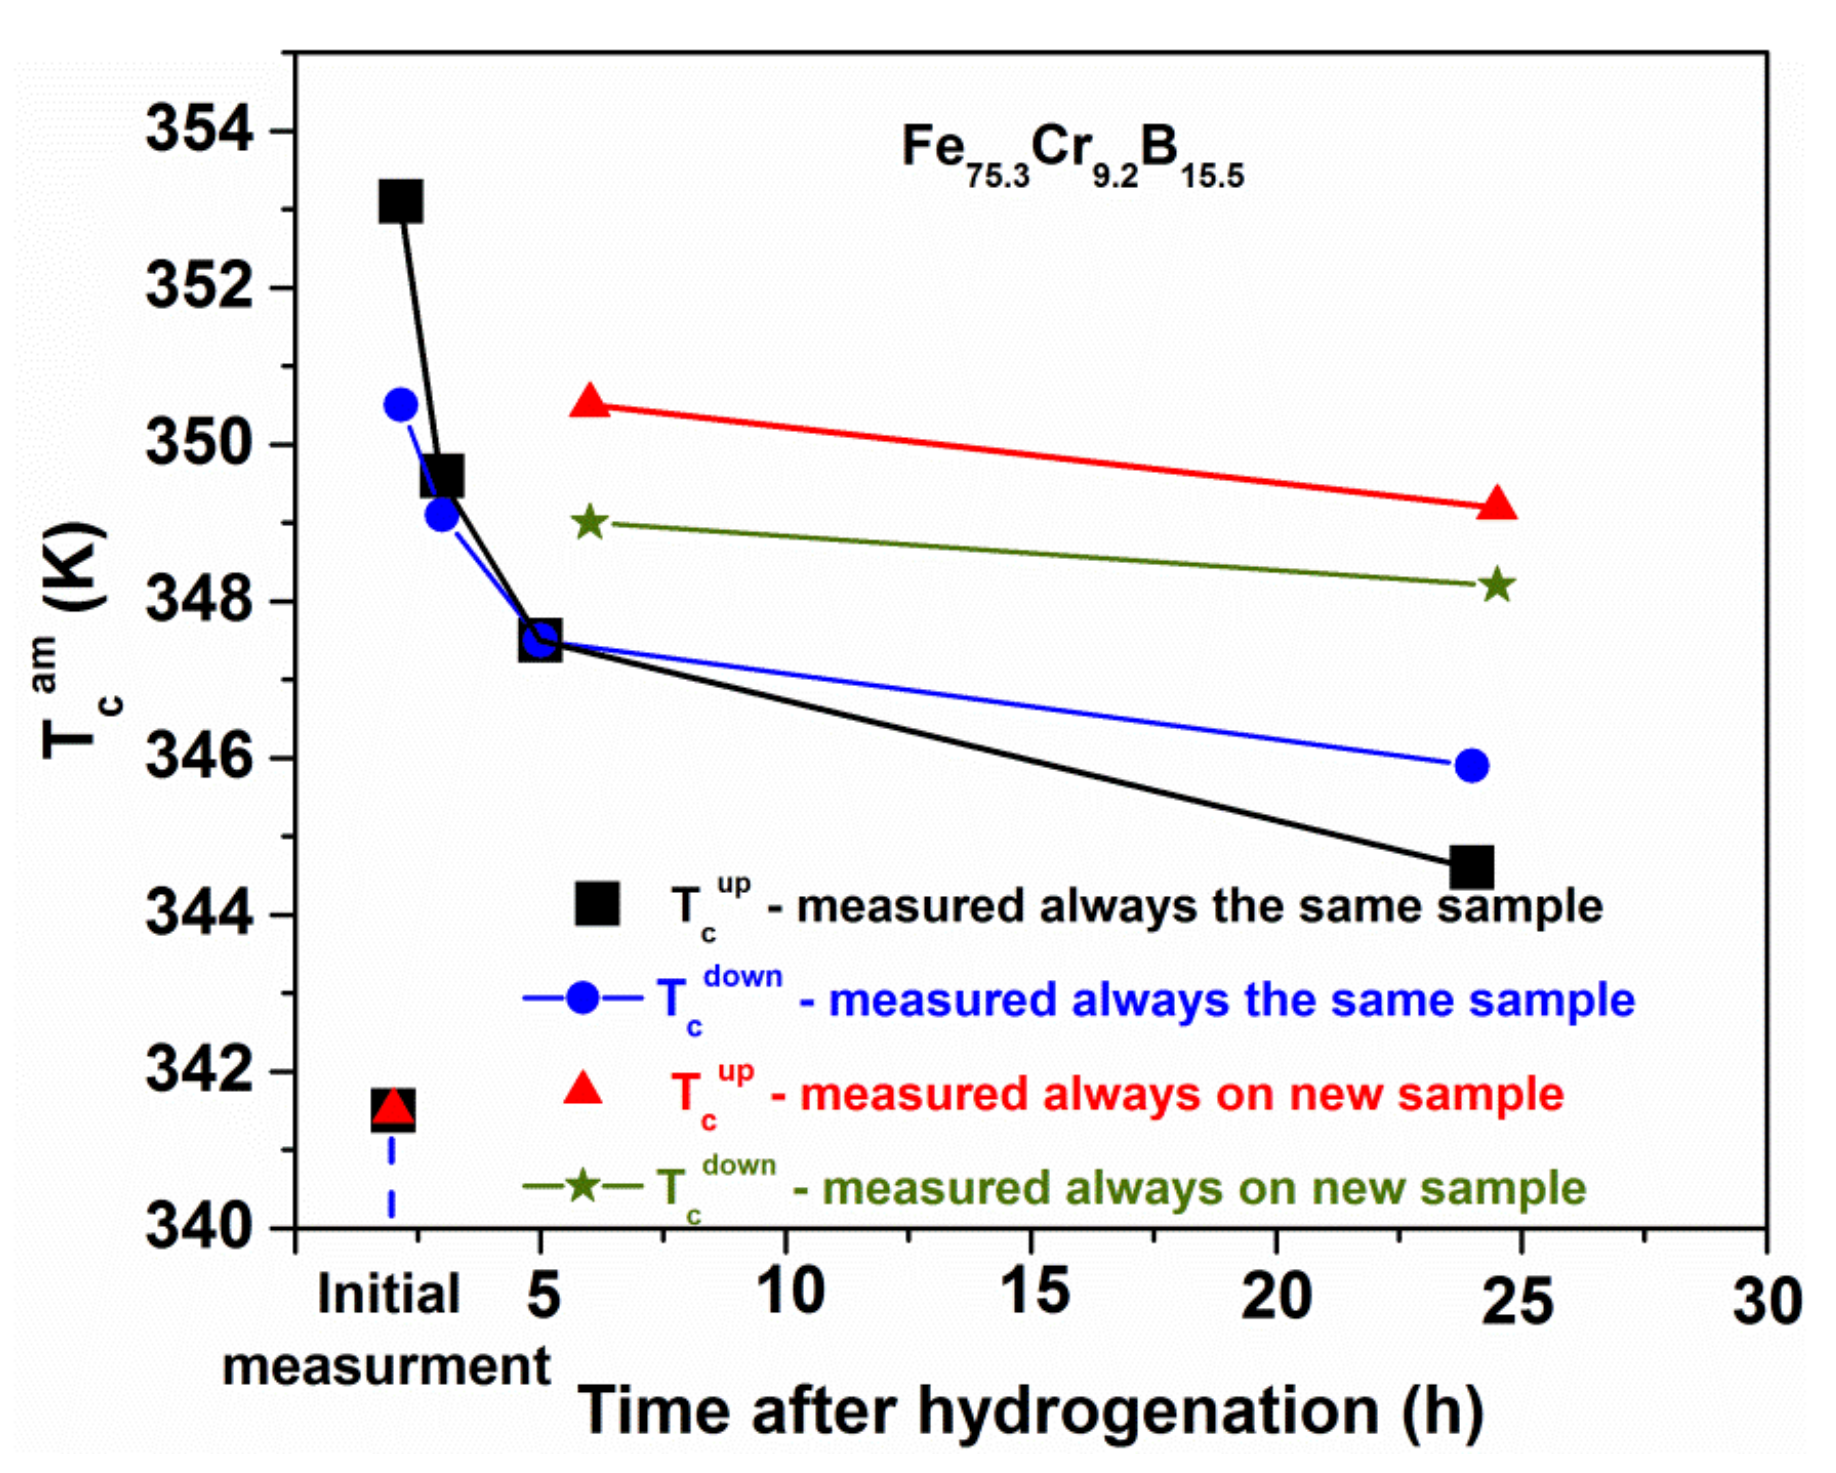
2.9. Irreversible and Reversible TCam Shift

TCam of Fe(Ni)M glasses is not solely composition dependent, but it is also influenced by the whole thermal history (see Figure 13, where both effects are illustrated). For the explanation of the cluster structure development, the sign of the TCam shift (ΔTCam) is especially informative for the understanding of the evolution of the cluster structure.
In [54,80,81], the quenching rate dependence of TCam of Fe81.5B14.5Si4 and Fe(Ni)-based glasses has been reported. The Curie temperature decreases with decreasing ribbon thickness, i.e., TCam is lower for the less relaxed samples. Similar trends are observed in both systems. The results are summarized in Figure 13, Figure 14 and Figure 15. In Figure 13, the evolution of TCam for thin and thick Fe40Ni40(SiB)20 samples is compared during subsequent measurements. The thick samples are more relaxed, so TCam is higher. Between two measurements, the cooling was interrupted at 473 K and heat treatments for 30 min were performed in the equipment and the TCam measurements were repeated (Figure 13). The results are summarized below:
-
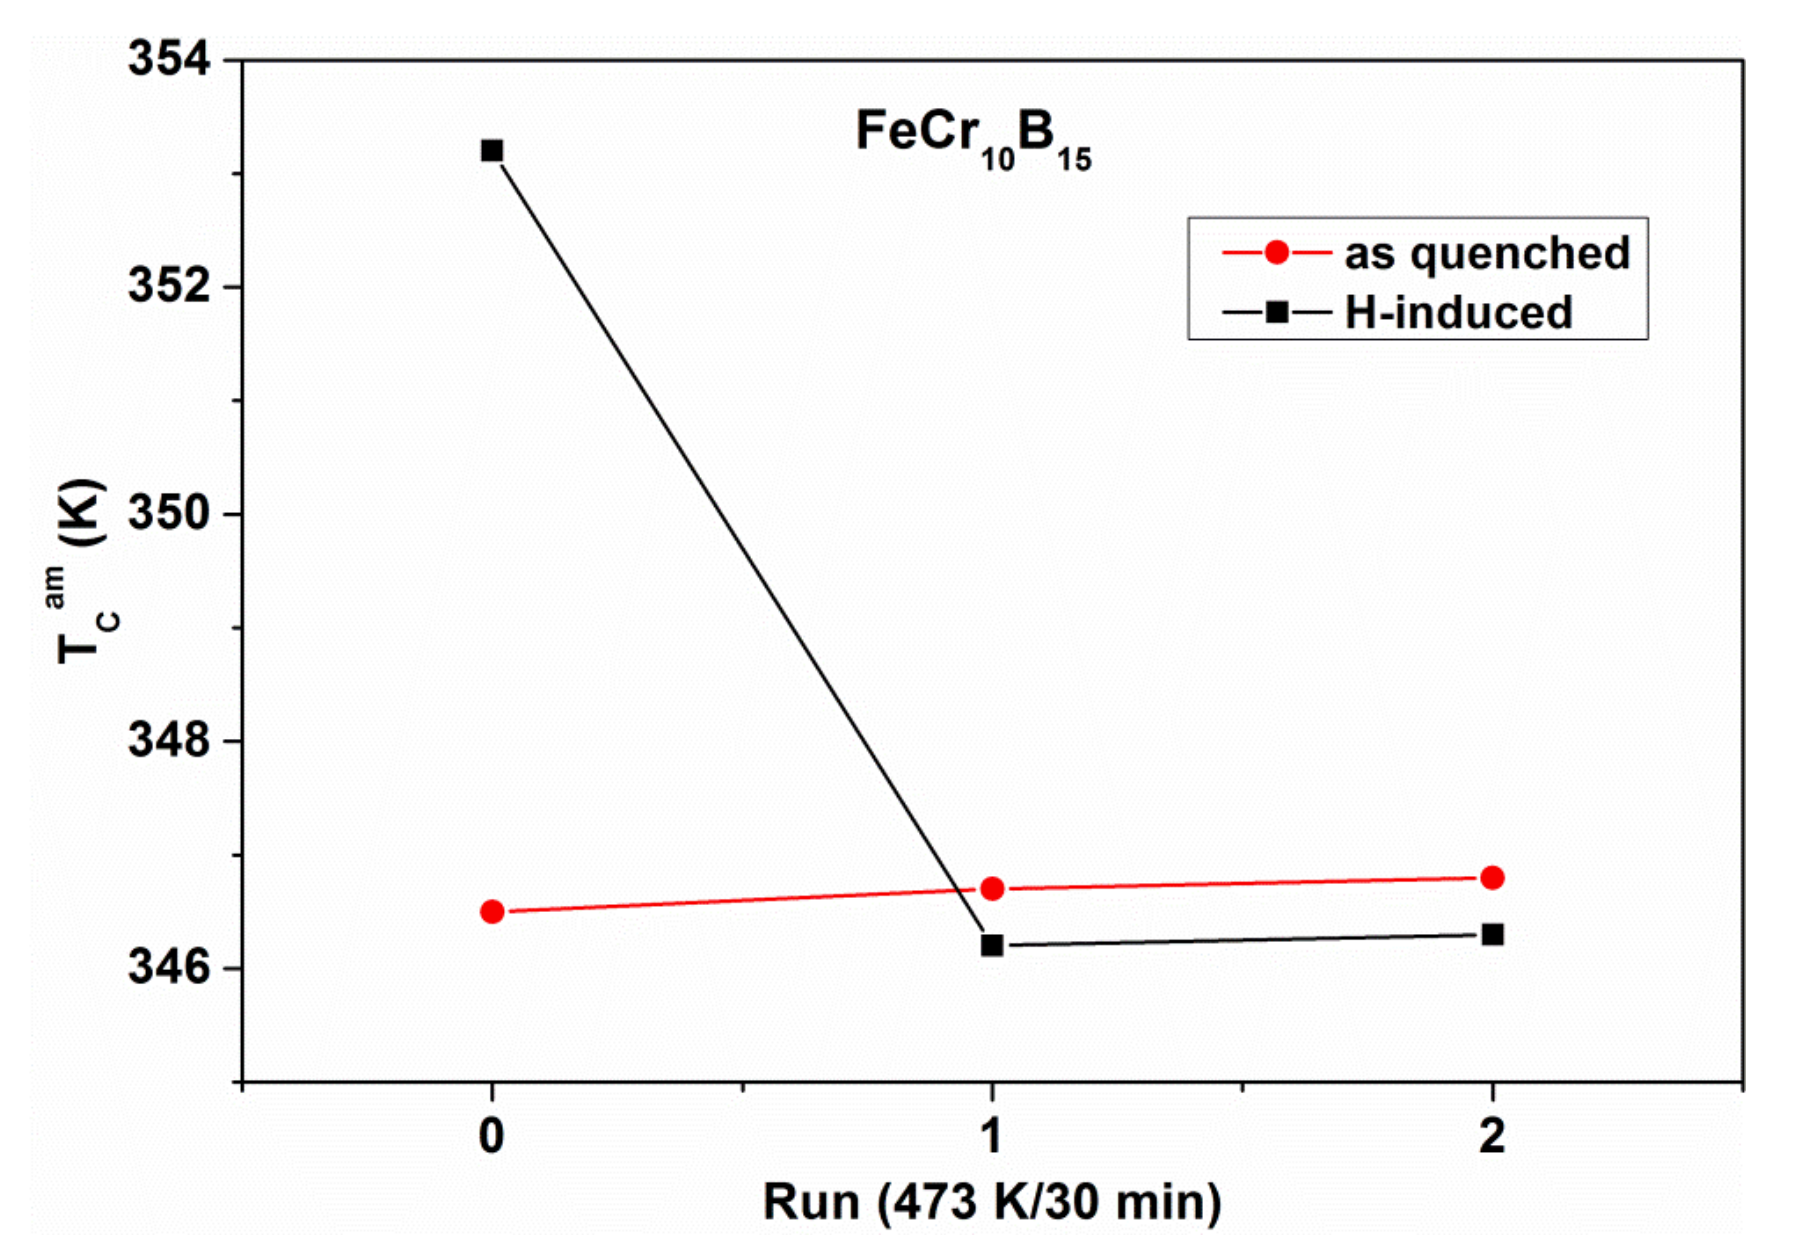
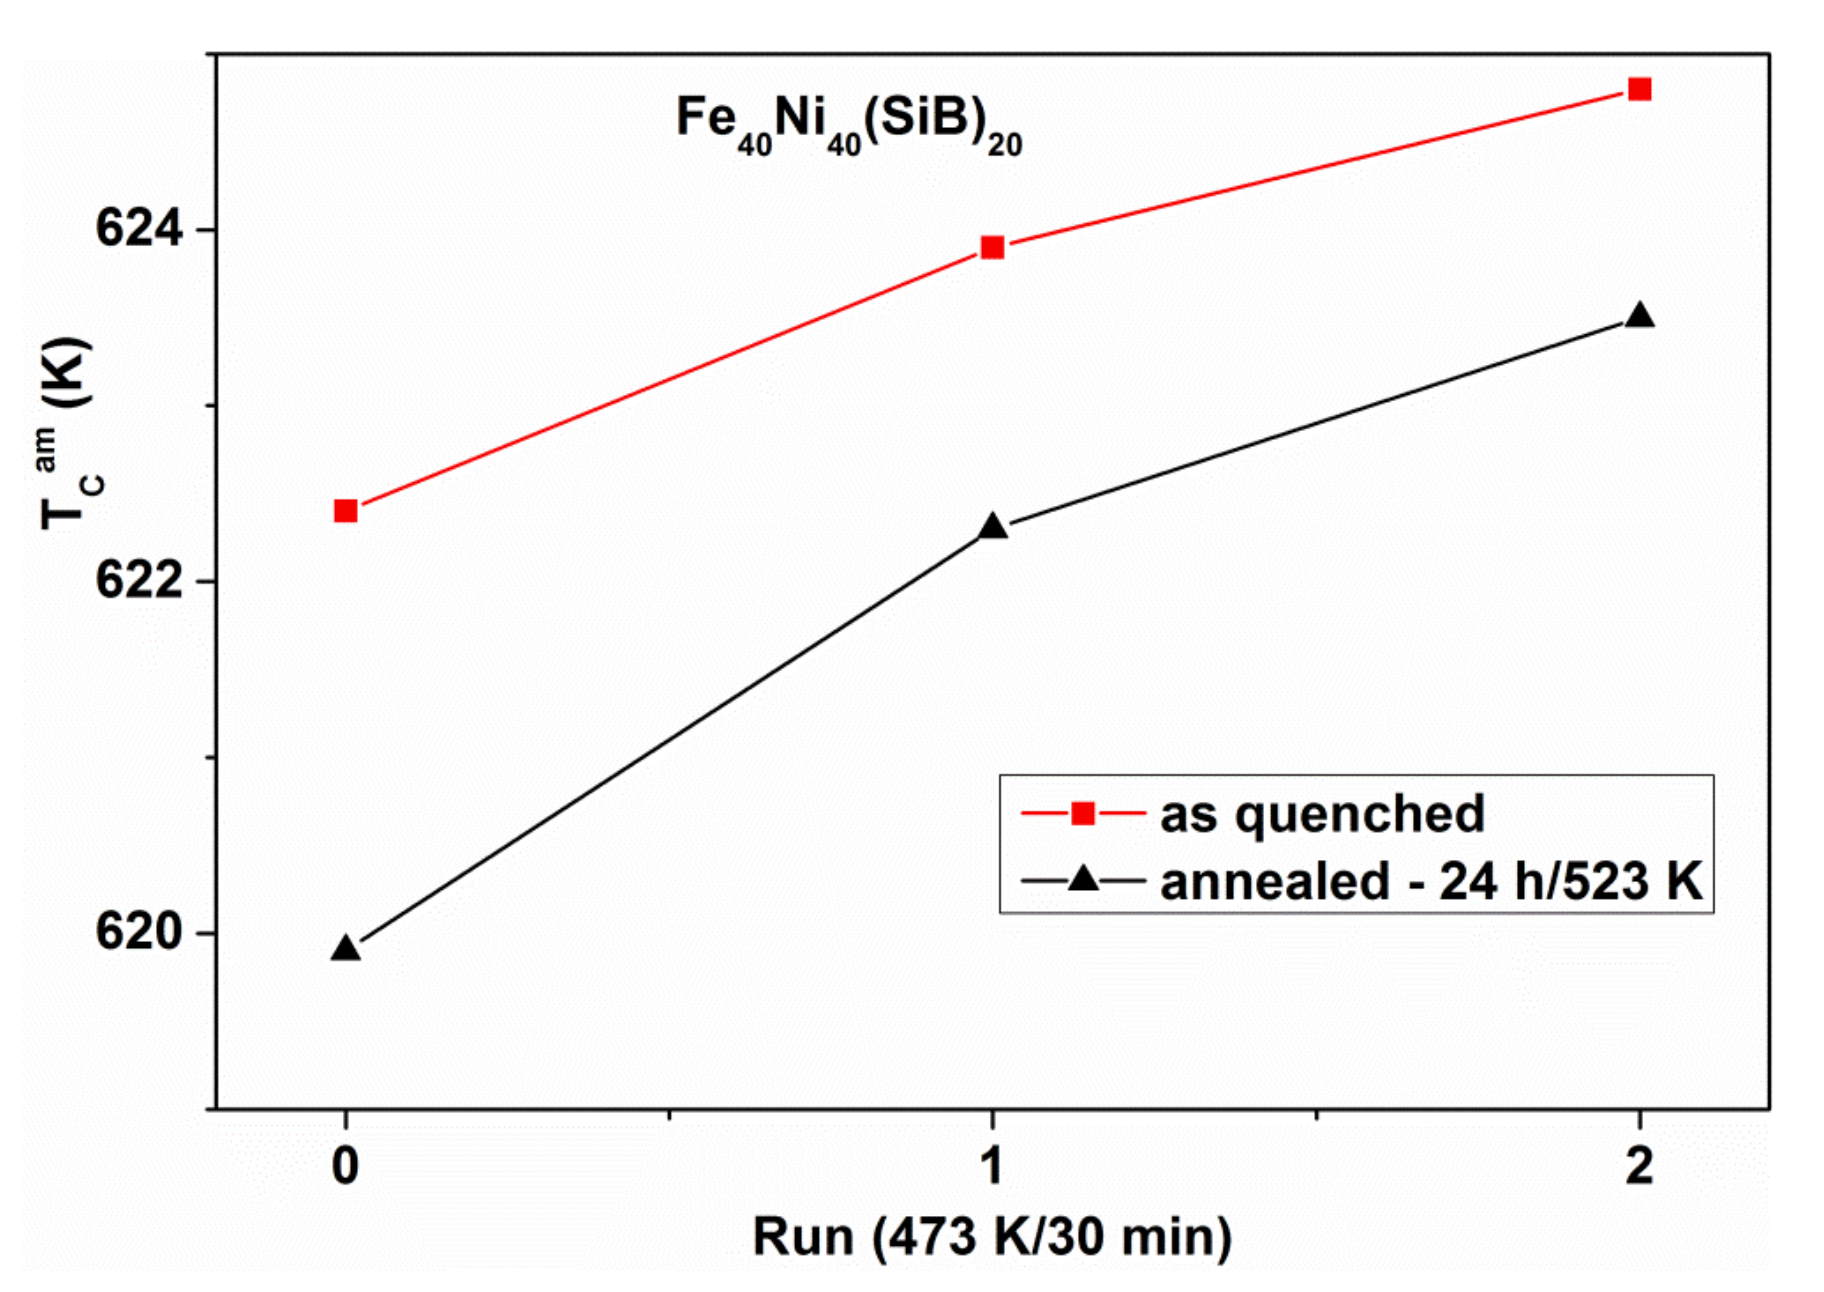
ΔTCam between the thick and thin Fe40Ni40 (SiB)20 samples slowly decreases during the repeated heat treatments and measurements. In the thinner samples, relaxation is more rapid, and an irreversible TCam increase in both types of samples can be detected during the measuring runs.
-
ΔTCam arises partially from the measurement process (an irreversible increase when heating the samples for the TCam determination). This phenomenon is known as “self-relaxation”, which is especially detectable when TCam is high. This is typically the case for the Fe40Ni40(SiB)20 samples.
-
The relation between the quenching rate and TCam is not necessarily monotonic, in contrast to the total relaxation enthalpy (compare Figure 13 and Figure 15, which are measured on glasses with similar composition).
-
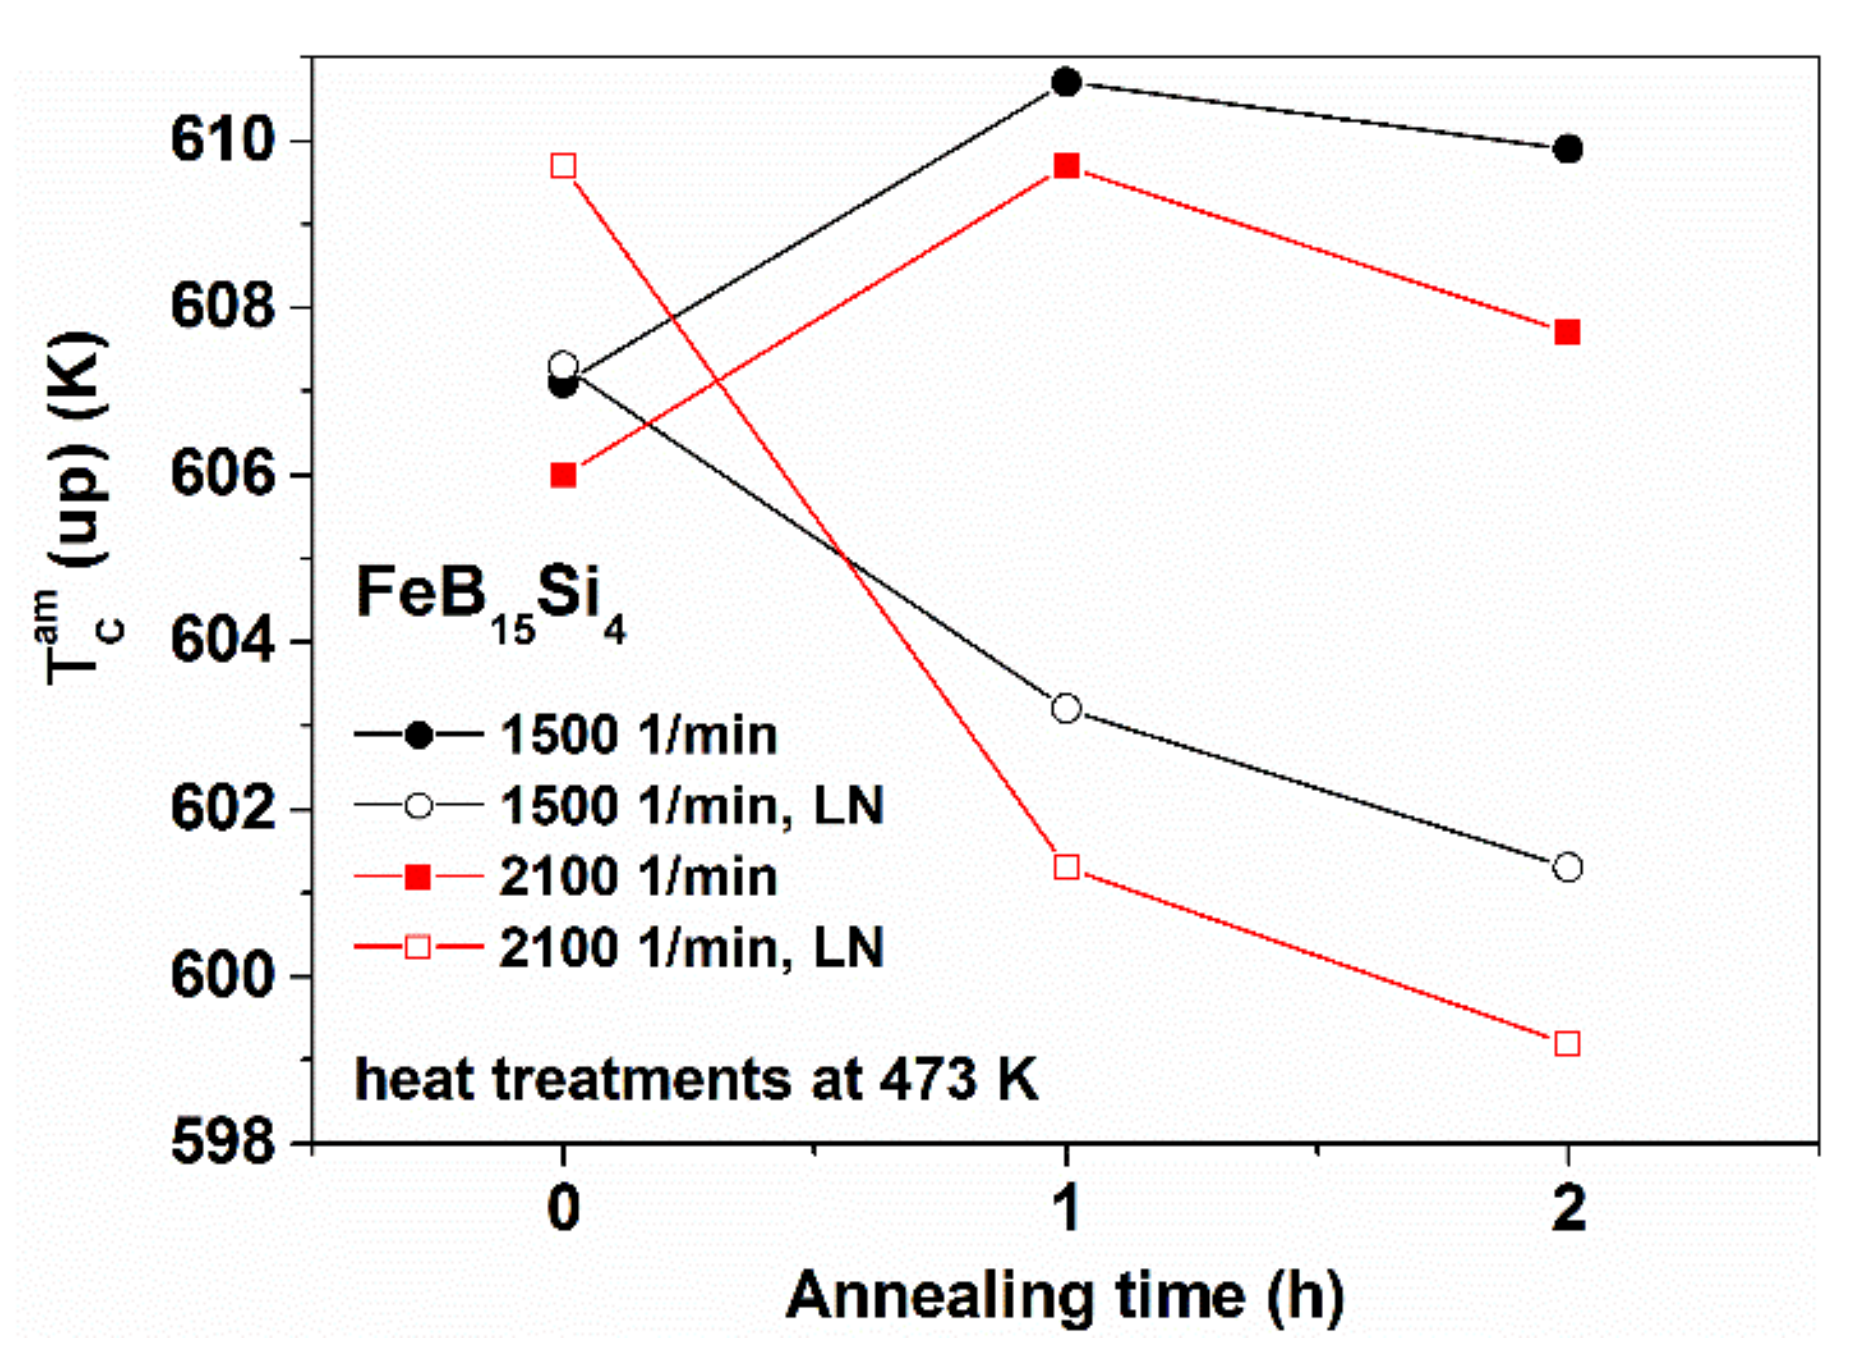
A similar irreversible TCam increase was detected for other FeNiB samples with various Ni-contents during the first measuring run or in the initial period of isothermal heat treatments (see Figure 15).

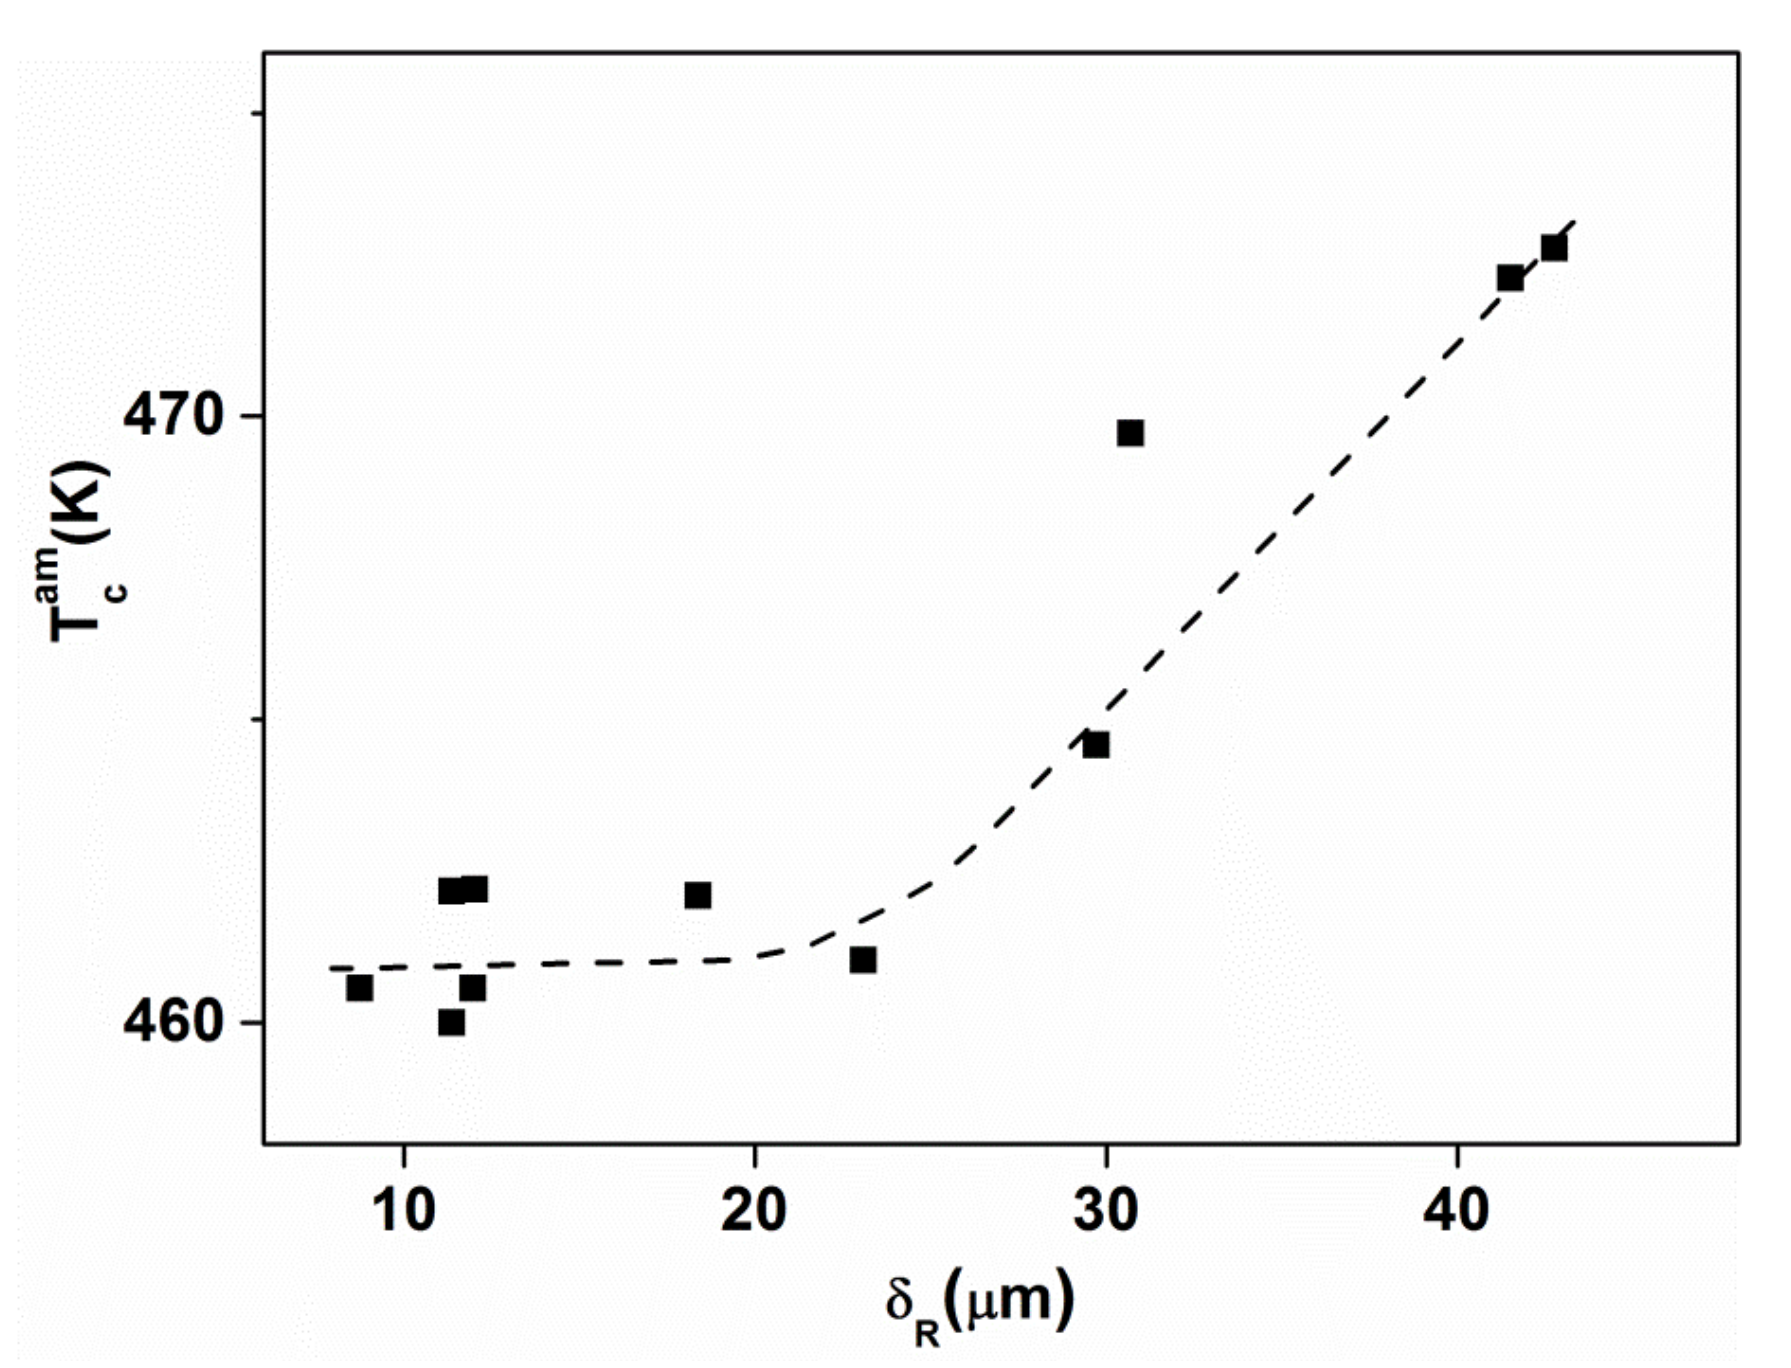
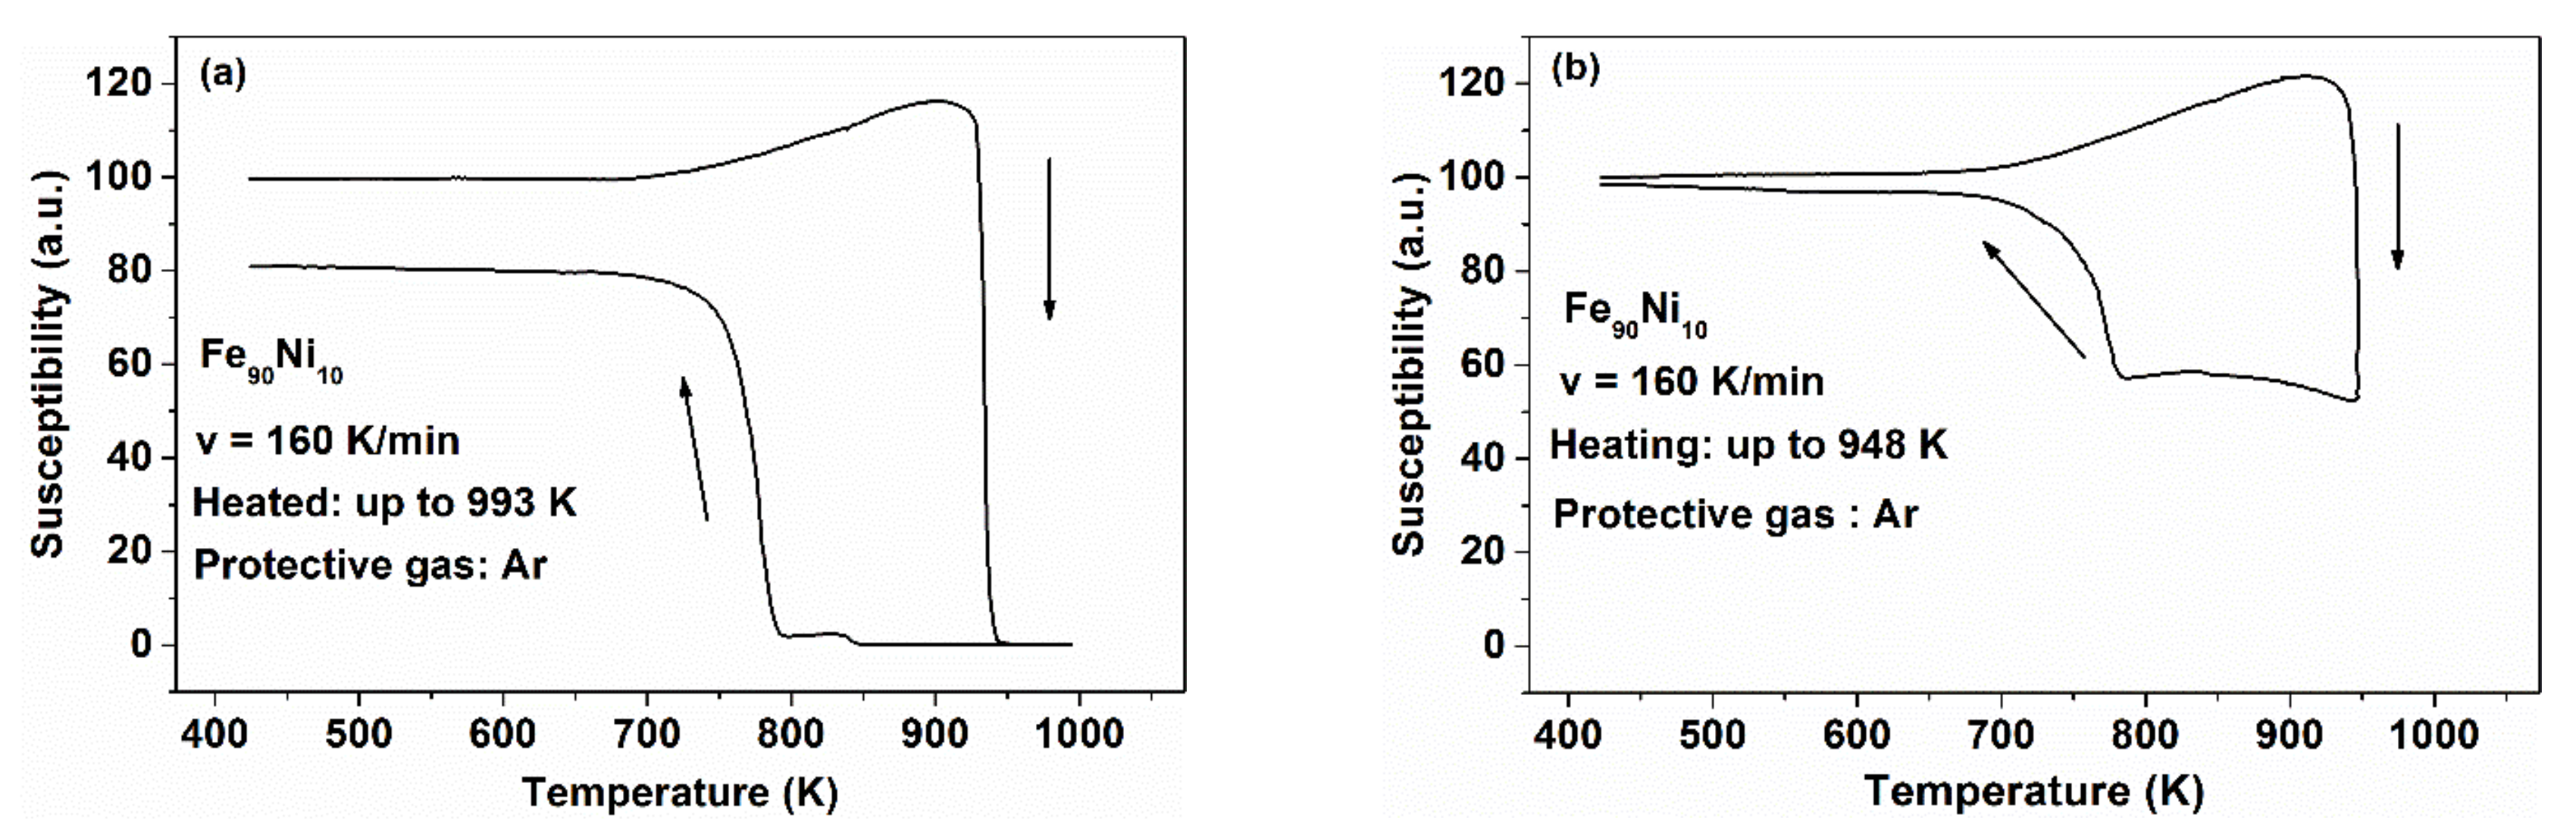
2.10. Imprint of the γ ↔ α Allotropic Transition as Background of the TCam Shift in Fe(Ni) Glasses during Liquid Quenching and Subsequent Isothermal Heat Treatments

The TCam shift originates either from the change of the rate of liquid quenching or it may arise from subsequent heat treatments. It was presented that the TCam shift is especially large when Fe-atoms in hypo-eutectic Fe-B are partially replaced by Ni (Figure 9). In this case it is easier to find the analogy between ΔTCam and the co-existence of quenched-in γ ↔ α-like structural units when the samples are heat treated at different temperatures. The transformation of γ is sluggish even in crystalline FeNi alloys [70,83,84]. This sluggish nature can also be recognized in glassy FeNi-based alloys during the TCam changes, brought about by isothermal heat treatments at various temperatures below Tg or when the glass-forming liquids are prepared at different cooling rates. In other words, the slow transformation between crystalline fcc ↔ bcc arrangements serves as a phenomenological background of “quasi-bistability” which is observed in the form of TCam changes, traditionally known as “reversible” relaxation. As the ferromagnetic coupling is weaker in the fcc phase than in the bcc FeNi structure [85], the incomplete transformations are reflected in the shape of thermomagnetic curves. In order to demonstrate the origin of the “bi-stable” nature of the Tc changes in Fe(Ni)-based glasses, the phenomenon is investigated by the hysteretic behavior of Tc in crystalline Fe90Ni10 alloys [86]. An example is depicted in Figure 16a,b.
At the Curie temperature (Tc) of homogeneous, crystalline, ferromagnetic, single-phase alloys, only spin-disordering is involved, i.e., a hysteresis phenomenon is absent (Tc is identical in the heating and cooling run). This is not true when a crossover between the α ↔ γ transformation and Tc occurs, like in Fe-Ni crystalline alloys near to this concentration (10 at.% Ni).
It is well known that the α ↔ γ first order transformation is accompanied by hysteresis, as has been shown by thermal expansion measurements [86]. The transformation was detected by magnetic measurements as well [83,84]. It was found that on cooling this system, the return to the original state takes place at much lower temperatures.
The crossover is obvious from the fact that Tc measured upon heating or cooling is different (see Figure 16a,b), i.e., Tc depends on the direction of temperature change. A higher value of Tc is obtained during the heating run, as the fraction of α-phase is dominant at this heating period. However, the α → γ transformation is not completed during the run, while spin reordering can easily occur (see Figure 16a,b, Tc up). This means that Tc is apparent only in this experiment. The two-phase nature of the sample is also supported by the difference in the saturation magnetization in the heating and cooling curves.
In the following, the “inverse-like” relation between the quenching rate and TCam will be discussed on the basis of Figure 16a,b.
The α ↔ γ transformation in pure Fe is diffusionless and upon Ni addition it becomes increasingly sluggish with increasing Ni concentration. This transformation turns increasingly non-isothermal and, consequently, it is completed within an increasing temperature range.
Figure 16 reveals that simultaneously with heating the sample up to the Tc determination the α → γ transformation proceeds in the same temperature range. This transformation is completed beyond 943 K. However, this process is not detectable as magnetic phenomena (the sample was heated up to 993 K), i.e., the structural changes cannot be monitored via thermomagnetic measurements. The product phases of this transformation (being stable at high temperature) tend to be supercooled, exhibiting a significantly lower “apparent” Tc at around 793 K. The different saturation magnetization of the ferromagnetic phase formed during the heating and cooling runs clearly shows the structural difference.
The situation is similar during the TCam determination in metallic glasses, especially in such systems, in which the Curie temperature is high (close to Tg), i.e., where thermal activation of short-range atomic displacements cannot be neglected. Such a system is Fe40Ni40Si6B14.
As it was discussed above, the clusters with frozen γ- and α-symmetries co-exist in this glass. Both the inverse-like relation between TCam and Tanneal and the irreversible TCam increase (observed typically in the initial period of an isothermal heat treatment) can be explained by the above-outlined considerations.
The melting temperature of this rapidly quenched alloy is ≈1473 K, and Tg ≈ 773 K, (determined from DSC diagrams) [87].
As can be seen in Figure 1, a significant deviation from complete internal equilibrium in such (fragile) liquids is expected from 2/3 Tmelt ≈ 1023 K during melt supercooling. The distribution of hetero-atoms is not random below this temperature range, but preferential chemical bonds are developed between the host metal and the metalloid atoms leading to the evaluation of local coordination and symmetry (formation of aggregates according to Scheme 1) [27].
The solid solution-like regions are the centers of fast (β)-type relaxation. The driving force of relaxation is the fcc → bcc rearrangement. When this type of rearrangement occurs, the net ferromagnetic coupling increases, and so ΔTc > 0 (Tc increases). Applying a high cooling rate during liquid quenching results in a higher population of fcc centers, and so the resulting TCam is lower. According to the outlined considerations, scheme 1 has a dominant influence on the direction of short-range (cluster-dimension) relaxation in the glass. Consequently, TCam decreases or increases when the quenching rate or Tanneal are altered. It is noteworthy that symmetry competition also exists during the formation of crystal nuclei, when crystal nucleation starts from highly supercooled melts [88]. Near the melting point of the crystalline (precursor) alloy (Tm = 1473 K), the fcc phase is the stable allotrope (Figure 17). Consequently, the fcc-type cluster formation is favored but a gradual reordering of fcc → bcc proceeds as the melt is increasingly supercooled. Hence, two kinds of symmetry are frozen around Tg. This tendency can be seen when the TCam evolution of rapidly and slowly quenched samples is compared (Figure 13). As the temperature is lowered, (α) and fast (β) processes increasingly separate, and the α processes finally disappear (skeleton formation around Tg).
The relative mobile solid solution-like regions are subject to the T-dependent fcc ↔ bcc symmetry changes, which are influenced by the alloy composition (Fe/Ni ratio) and the quenching rate dependent relative fcc and bcc populations. Thus, the direction of symmetry change between the co-existing clusters is also influenced by the rate of liquid quenching, as well as by the temperature of the subsequent heat treatments at a given Fe/Ni ratio (see Scheme 3). From the kinetic point of view, the rate of transformation is influenced by the difference between the transformation temperature and Tg (Scheme 3).
( [ Fe , Ni ( B ) ] bcc [ Fe , Ni ( B ) ] fcc ) T anneal , v quench
According to the previous arguments, the direction and rate of the outlined short-range symmetry changes are influenced by the quenching rate and the temperature of relaxation (heat treatment). Based on Figure 17, one can expect that both types of symmetry participate in the initial population of the cluster assembly, because the binary FeNi crystalline system tends to be two-phase at this temperature and concentration range. At a higher cooling rate, the population of fcc clusters is more dominant, and consequently this ratio will be preferentially frozen in during liquid quenching.

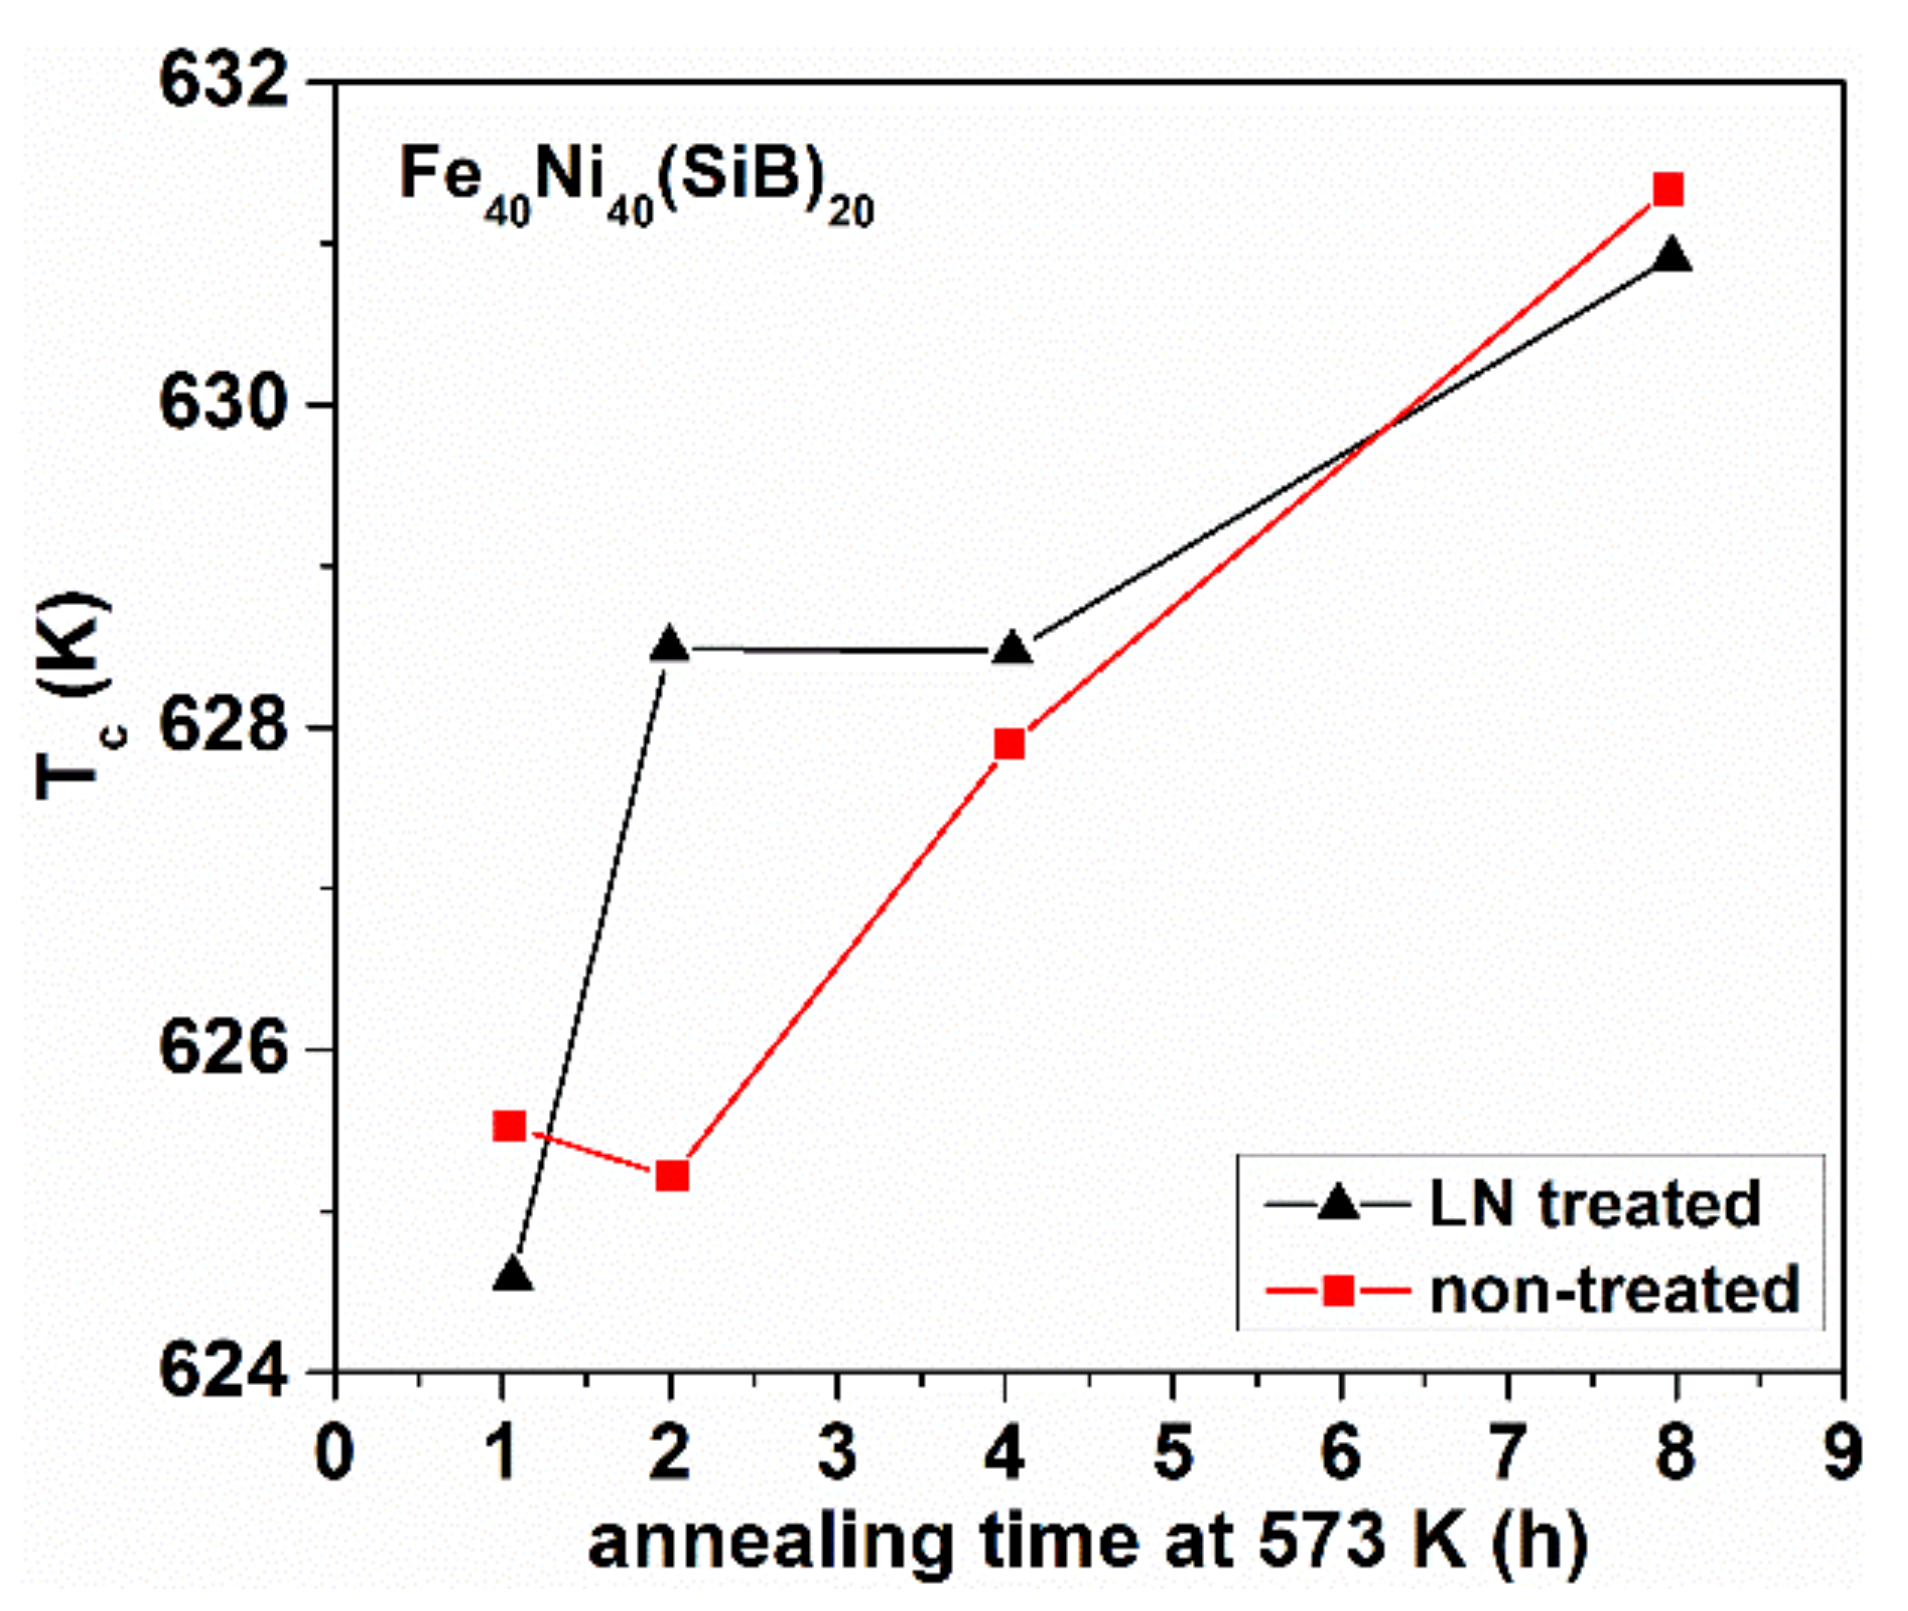
2.11. Irreversible TCam Changes in Fe(Ni)-Based Samples

When the samples are heated during the process of TCam determination, the sample temperature crosses the (low temperature) region where the bcc symmetry is stable (below 623 K). Therefore, γ → α short-range reordering proceeds until temperatures of 573–623 K are exceeded, because energetically this symmetry is favorable and the temperature is already high enough for short-range rearrangements. As a consequence, ferromagnetic coupling is strengthened, and TCam increases until reaching a critical value, at which the α/γ ratio approaches the frozen-in (liquid-quenched) value. At lower temperatures, (T1 ≤ 573 K) α1/γ1 holds as equilibrium value, while α2/γ2 is established at Tg > α/γ, (close to Tg). Therefore, TCam (which is stabilized at low temperature by isothermal heat treatment), is always higher than that stabilized at higher temperature. Based on this consideration, one can predict the sign of possible ΔTCam changes. During self-relaxation, (TCam which is necessary to occur when the sample is heated for the TCam determination) the usual tendency is the decreasing number of frozen γ centers, resulting in an increasing strength of ferromagnetic coupling (Figure 13, Figure 14 and Figure 15). Analogous phenomena occur when the samples are isothermally heat treated at different temperatures (crossover effects) [78,90].

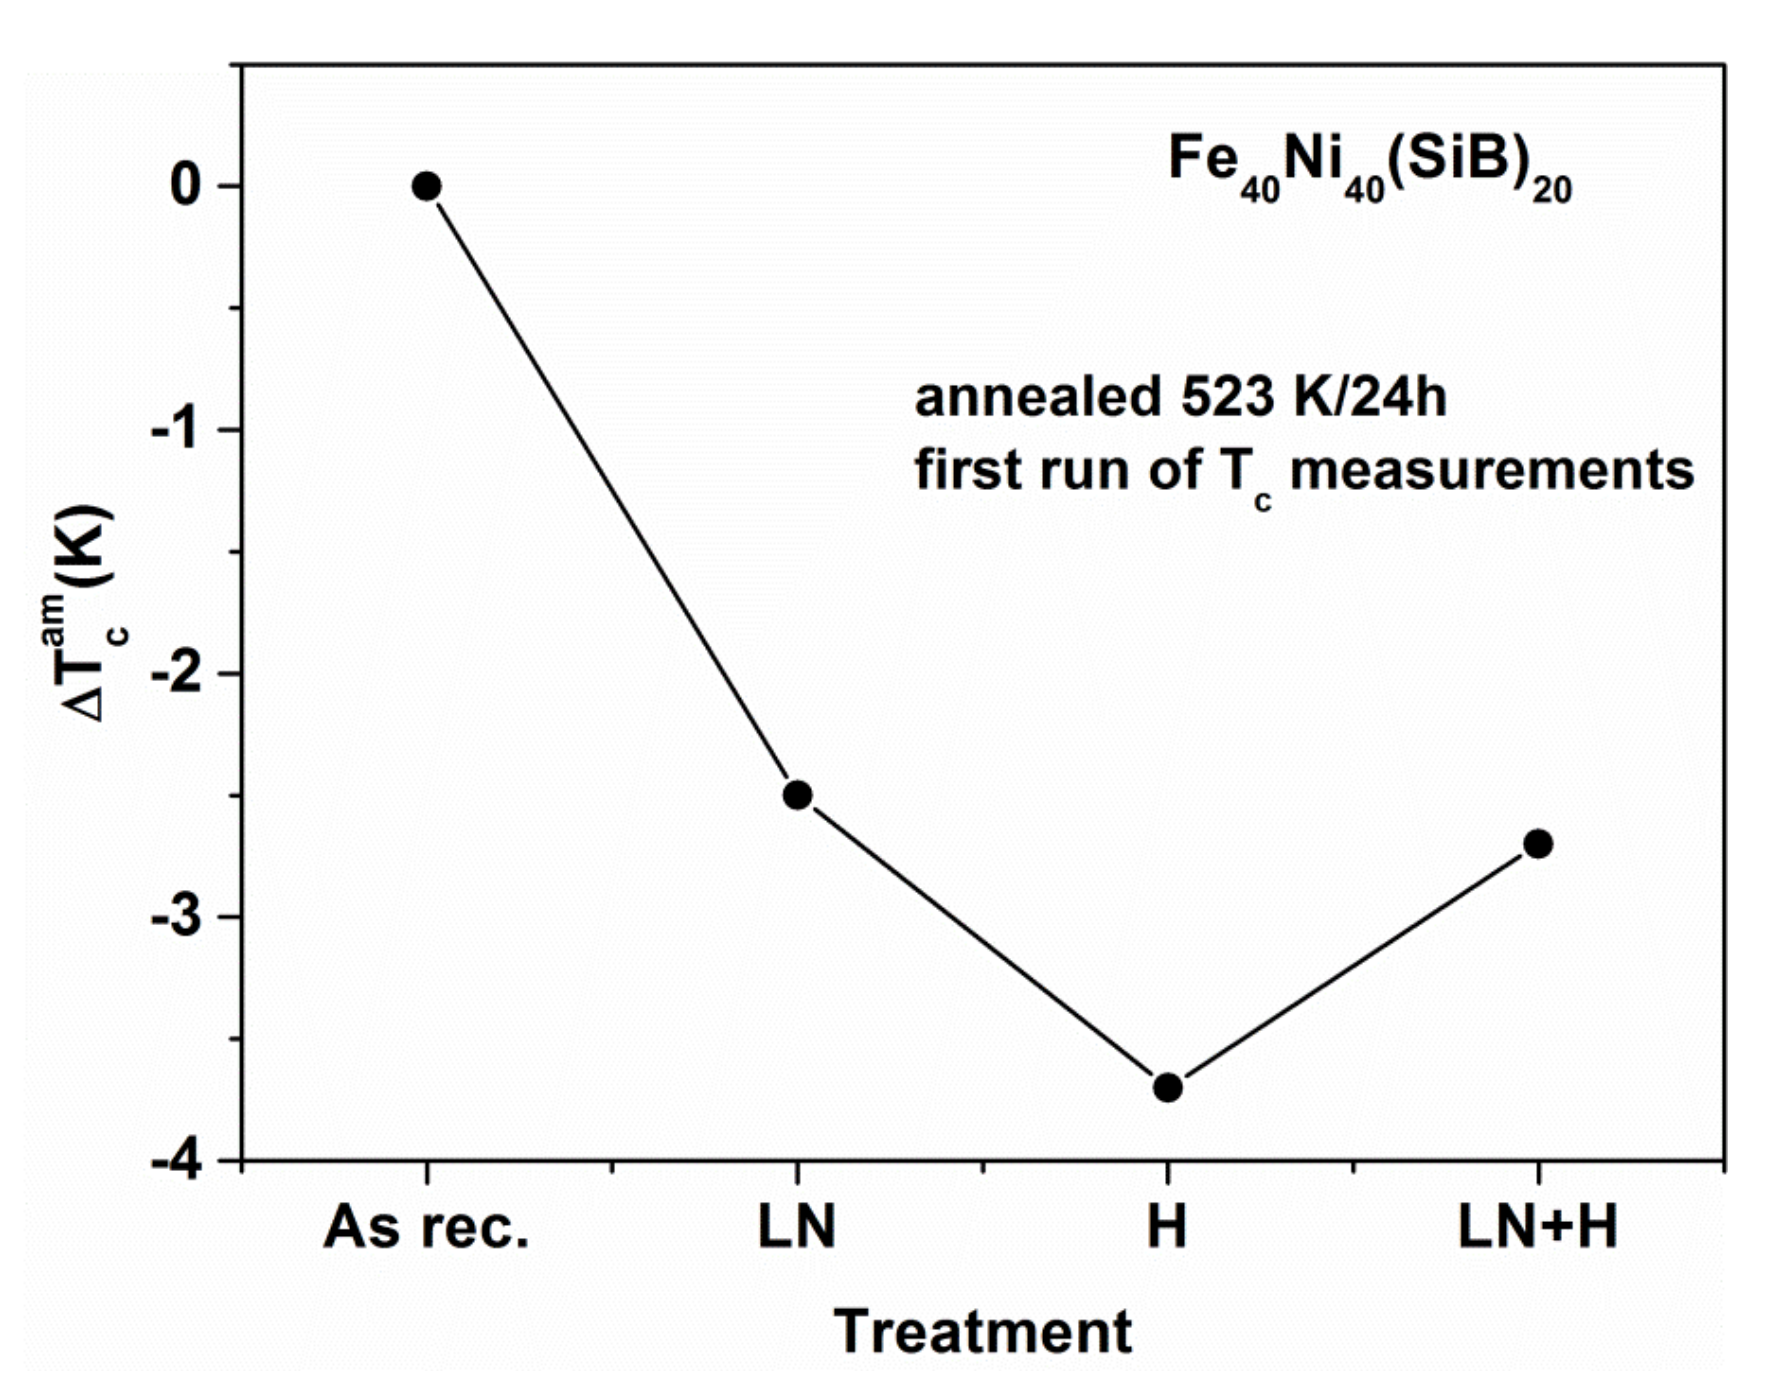
2.12. Curie Temperature Shift Induced by Low Temperature Storage

During the past decade, several observations have been reported on the influence of low temperature treatments (storage in liquid N2, 77 K) on various physical properties of glassy alloys [91,92,93,94,95]. The structural imprint caused by this treatment is surprisingly stable and preserved over several cycles of heating runs as deduced from TCam measurements. From the structural point of view, this phenomenon has a common feature with structural relaxation (stress-induced short-range structural changes including cluster redistribution or decomposition). In order to evaluate the “thermal stability” of structural imprints caused by low temperature storage, repeated TCam measurements were performed on rapidly quenched samples and the values were compared with those for the untreated state. It was found that quite stable structural imprints are formed during the LN treatments. In order to separate the effect of low temperature storage and the “self-relaxation effect” (which is the consequence of the sample heating associated with the measurements itself) TCam were measured both on heating and cooling runs. In Figure 18 and Figure 19, the results of successful separation of the events are demonstrated. These figures show how the TCam values gradually separate when the samples are previously subjected to low temperature treatment.
The ΔTCam values (the difference of the TCam values determined during the heating and cooling runs) are plotted for two independent series of Fe20Ni60Si6B14 samples. Prior to the measurements, one series of the samples was immersed into liquid N2 (77 K for 20 h). Subsequently, TCam was measured during both heating and cooling runs. The shift is positive when TCam increases during the same measuring run. One can also evaluate the degree of relaxation (short-range order rearrangements) caused by the measurement itself. Finally, the trend turns to the opposite when the annealing exceeds a critical temperature, approaching 623 K.
The TCam shift due to LN treatment is a general trend in glassy alloys [91,92] resulting in a stable structure, but the stability of the effects (degree of irreversibility) is strongly composition dependent (compare the Figure 18 and Figure 19).
The LN treatment-induced TCam shift is not restricted to Fe-Ni based glasses. Similar results are presented in Figure 20 and Figure 21 for Fe-Si-B glasses. The Curie temperature change is monitored in these figures during subsequent measurements. The samples were previously treated at 77 K for 20 h and after each measuring cycle, short (30 min or 1 h, 473 K) isothermal heat treatments were performed without removing the sample from the measuring apparatus [96,97].
The effects caused by the LN treatment are stable and preserved during the repeated TCam measurements, in spite of the significant “self-relaxation” associated with these measurements. Nevertheless, the effects do not mean completely irreversible structural changes from the point of view of TCam.

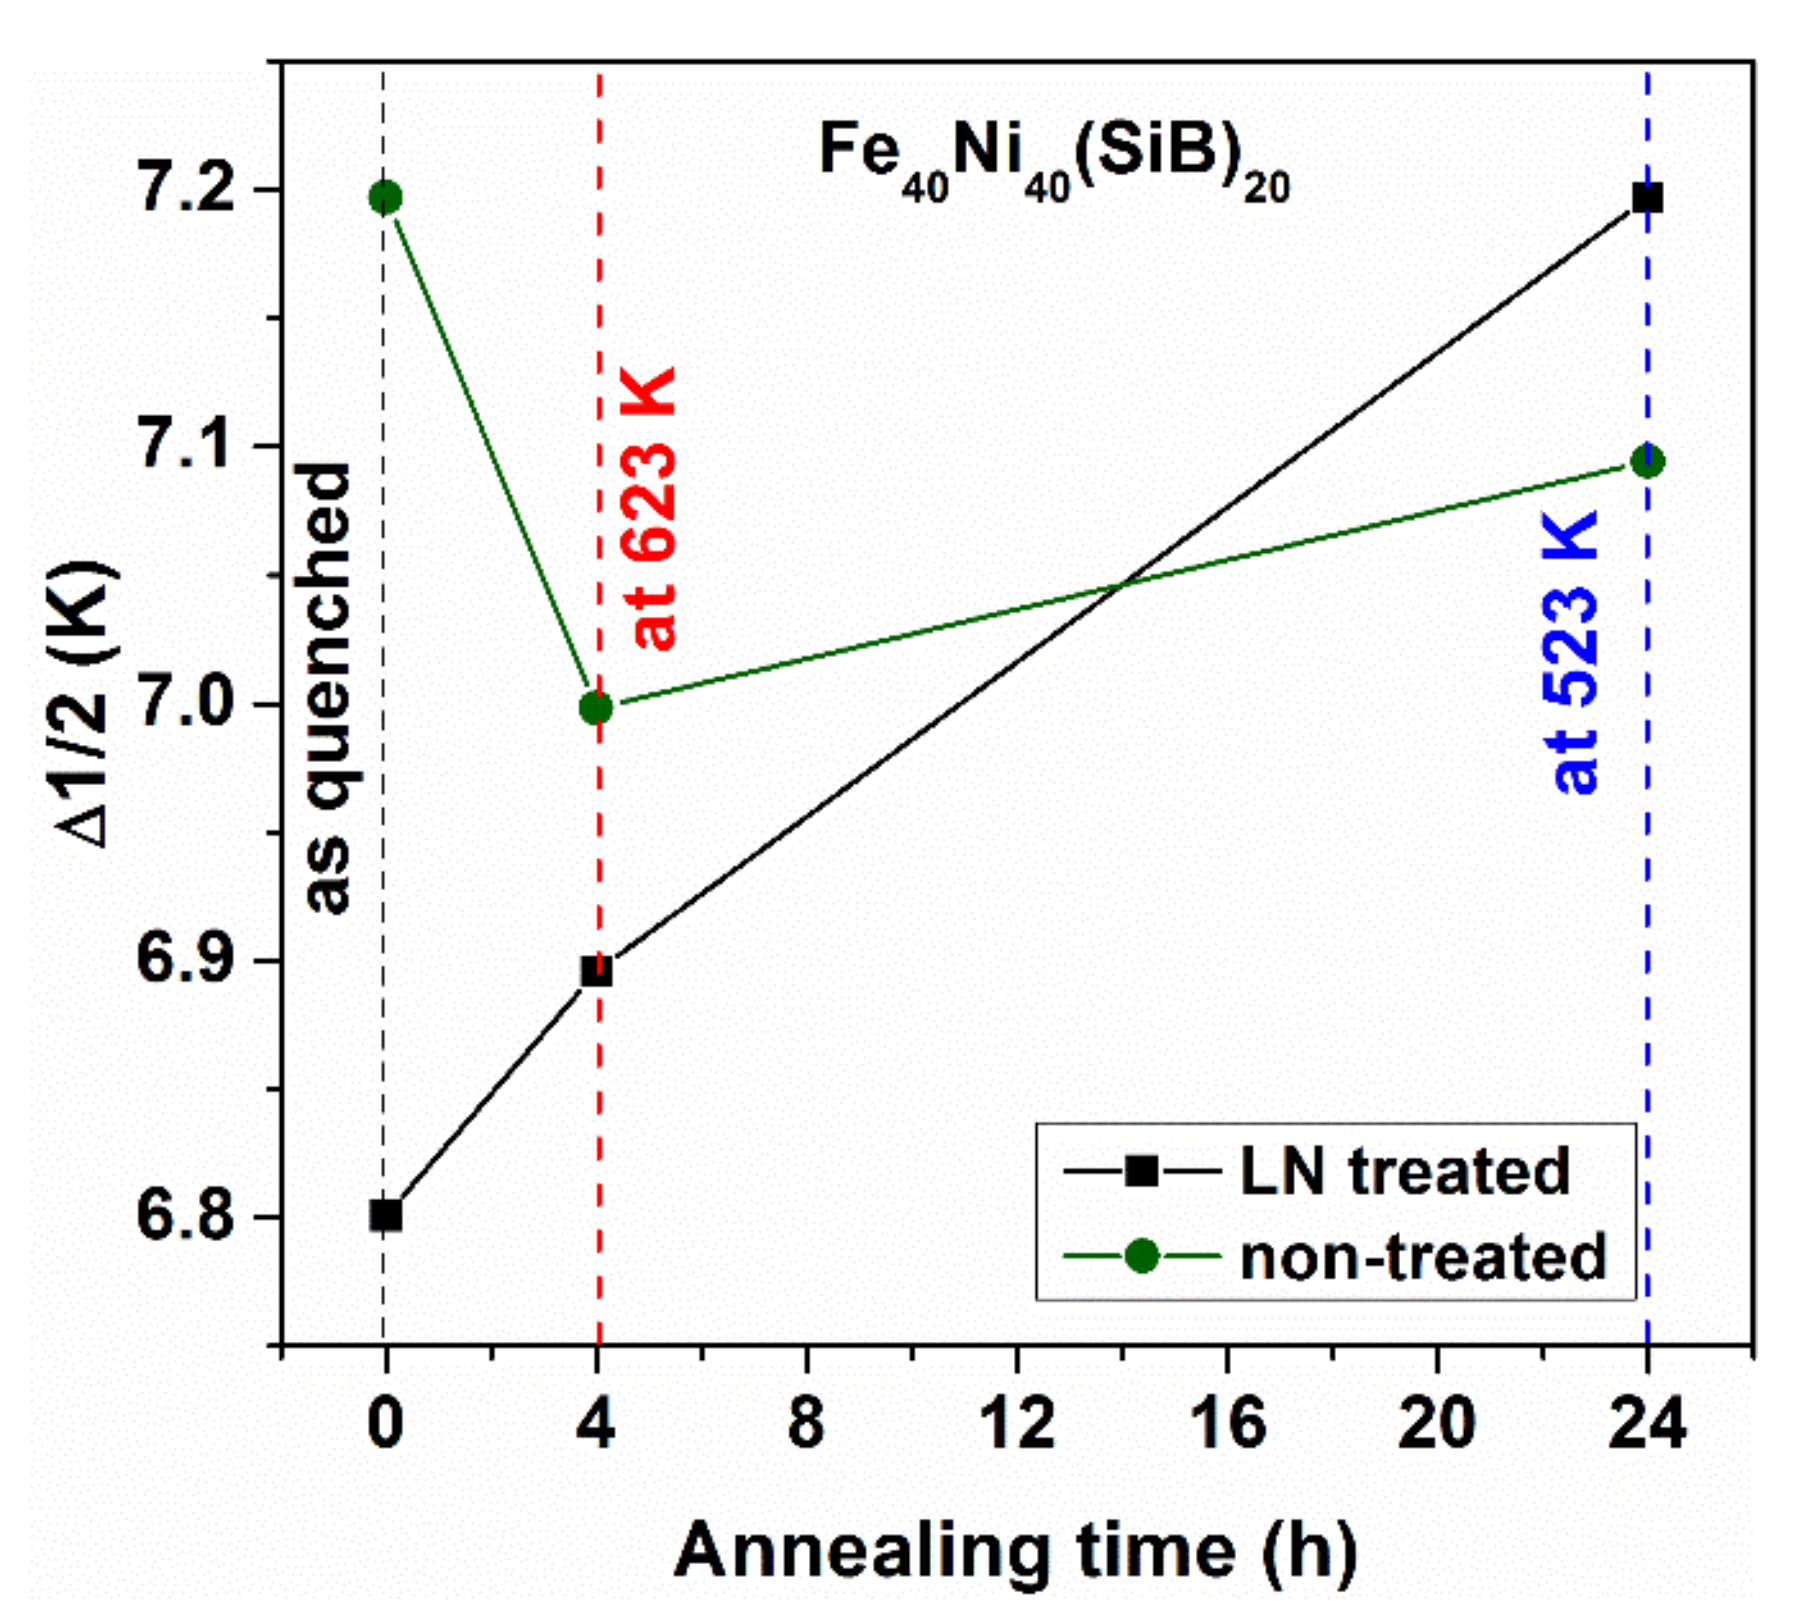
2.13. Stress Level Change during Cryo-Treatments

The decrease of the stress level by applying appropriate heat treatments has basic importance in tailoring the properties of soft magnetic glasses [22]. As stresses originate mainly from the liquid quenching, further, especially dramatic changes are not expected when the samples are stored at low temperatures. It is therefore surprising that the coercivity (Hc) can be influenced by LN treatments, as it is obvious in Figure 22.
This figure illustrates how differently the Hc changes in the samples that underwent different isothermal heat treatments can be, compared to the as-quenched ones. It is remarkable that Hc is influenced only slightly by previous LN treatment. In spite of this, the response of the samples to subsequent relaxation heat treatments is completely different. The differences are present even after significant stress relaxation up to 573 K (see Figure 23).
Changes in the heat capacity and exothermic crystallization caused by the previous LN-treatments are also markedly, as can be seen in Figure 24 and Figure 25.
The following conclusions can be drawn from the LN treatments:
-
Stable structural features are formed in the samples due to low temperature storage. These features also modify the response of the samples during the consecutive heat treatments.
-
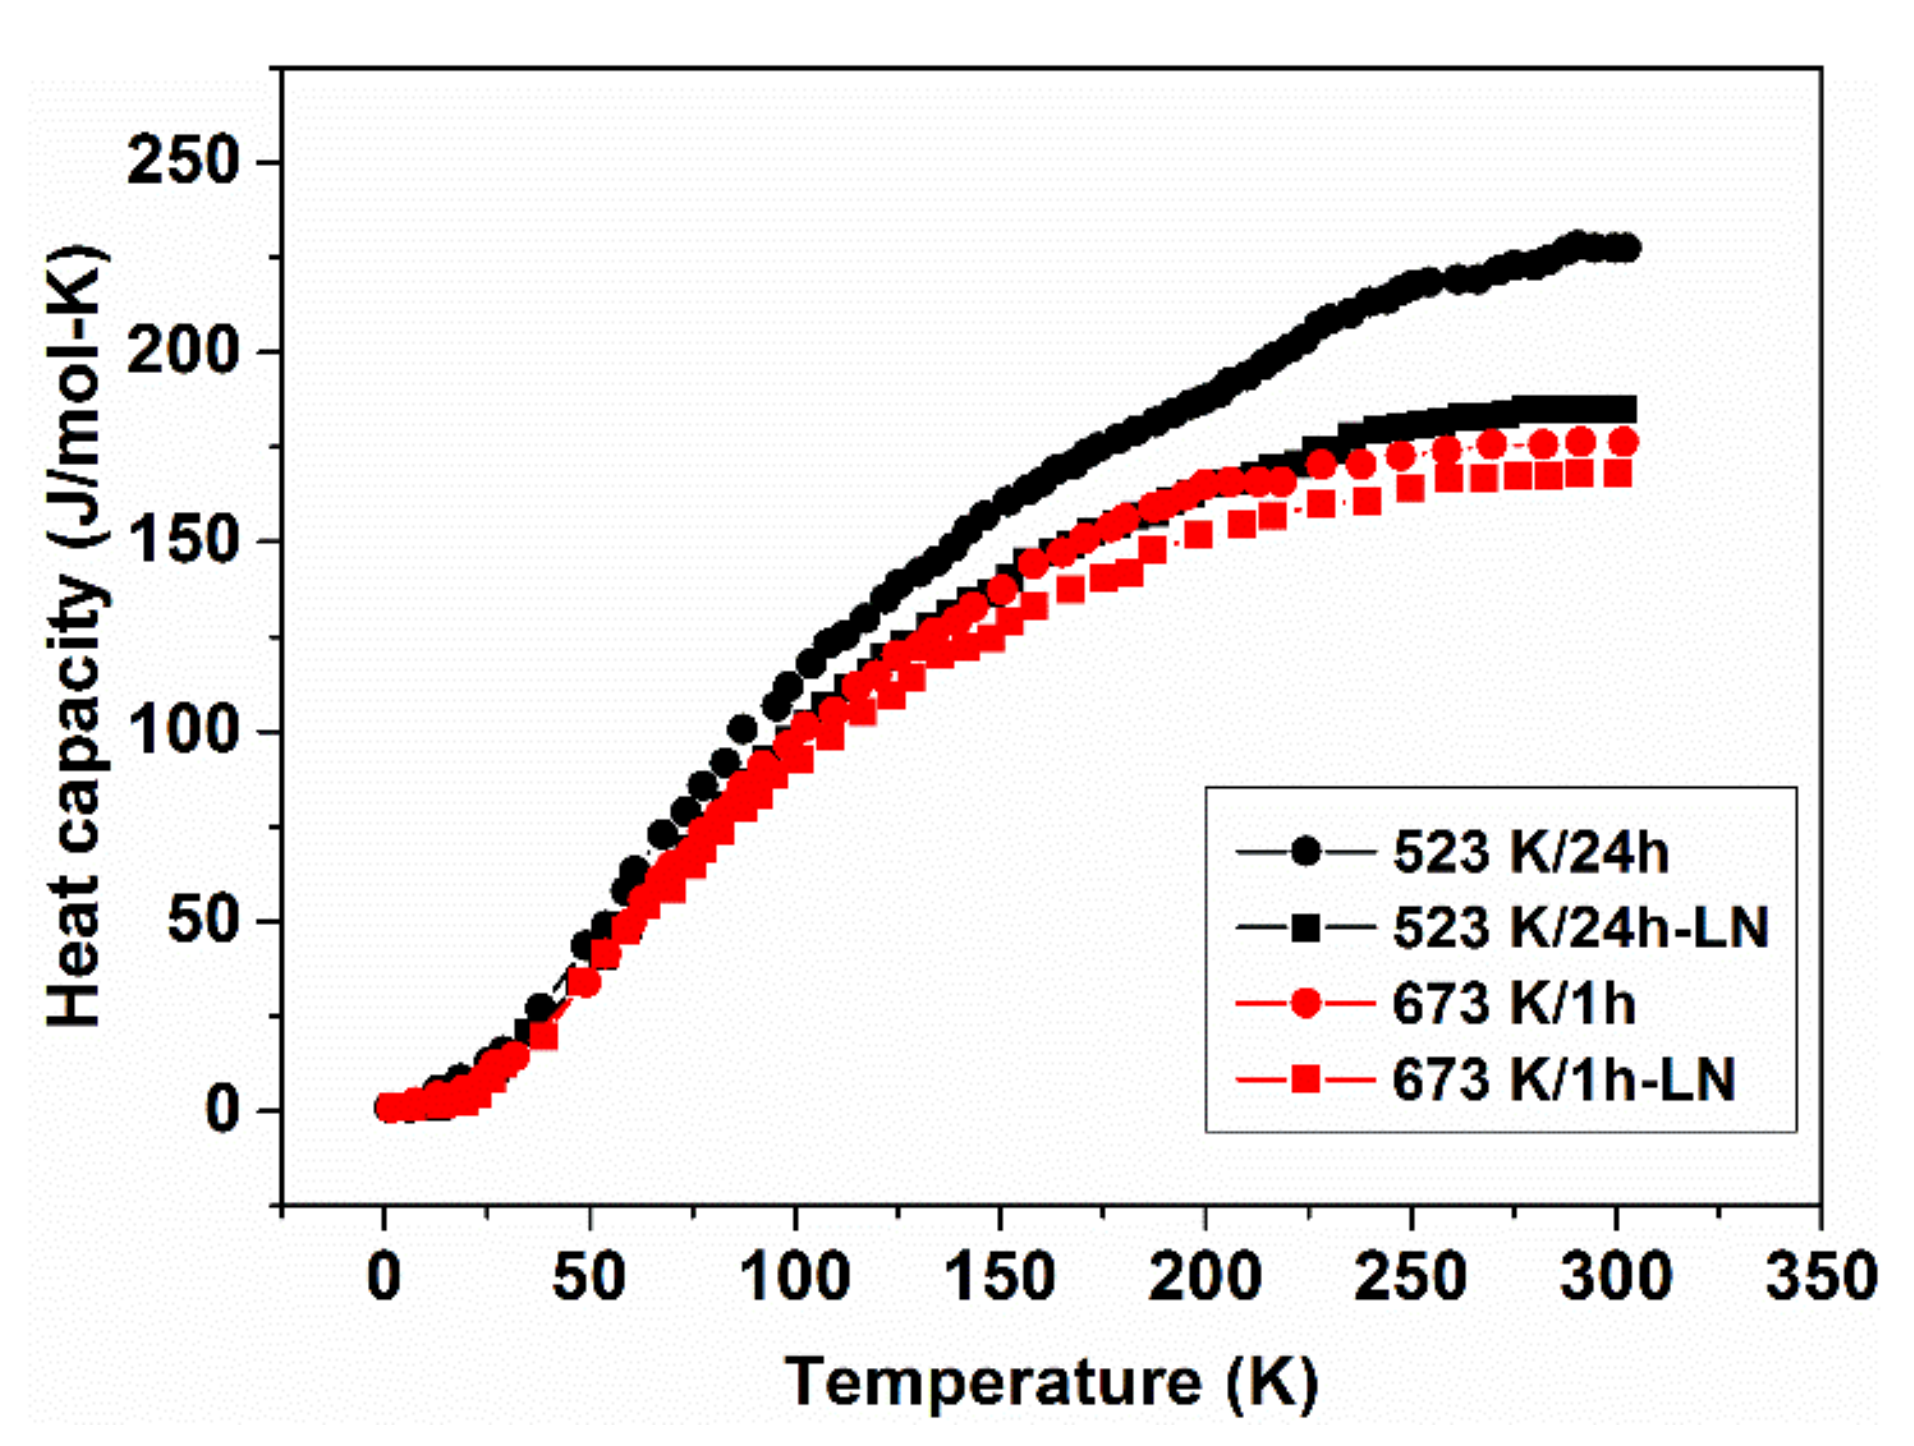
The LN treated samples exhibit much higher atomic mobility during the first period of isothermal heat treatments. The response of the individual physical properties of the samples to the LN treatment is highly composition-dependent.

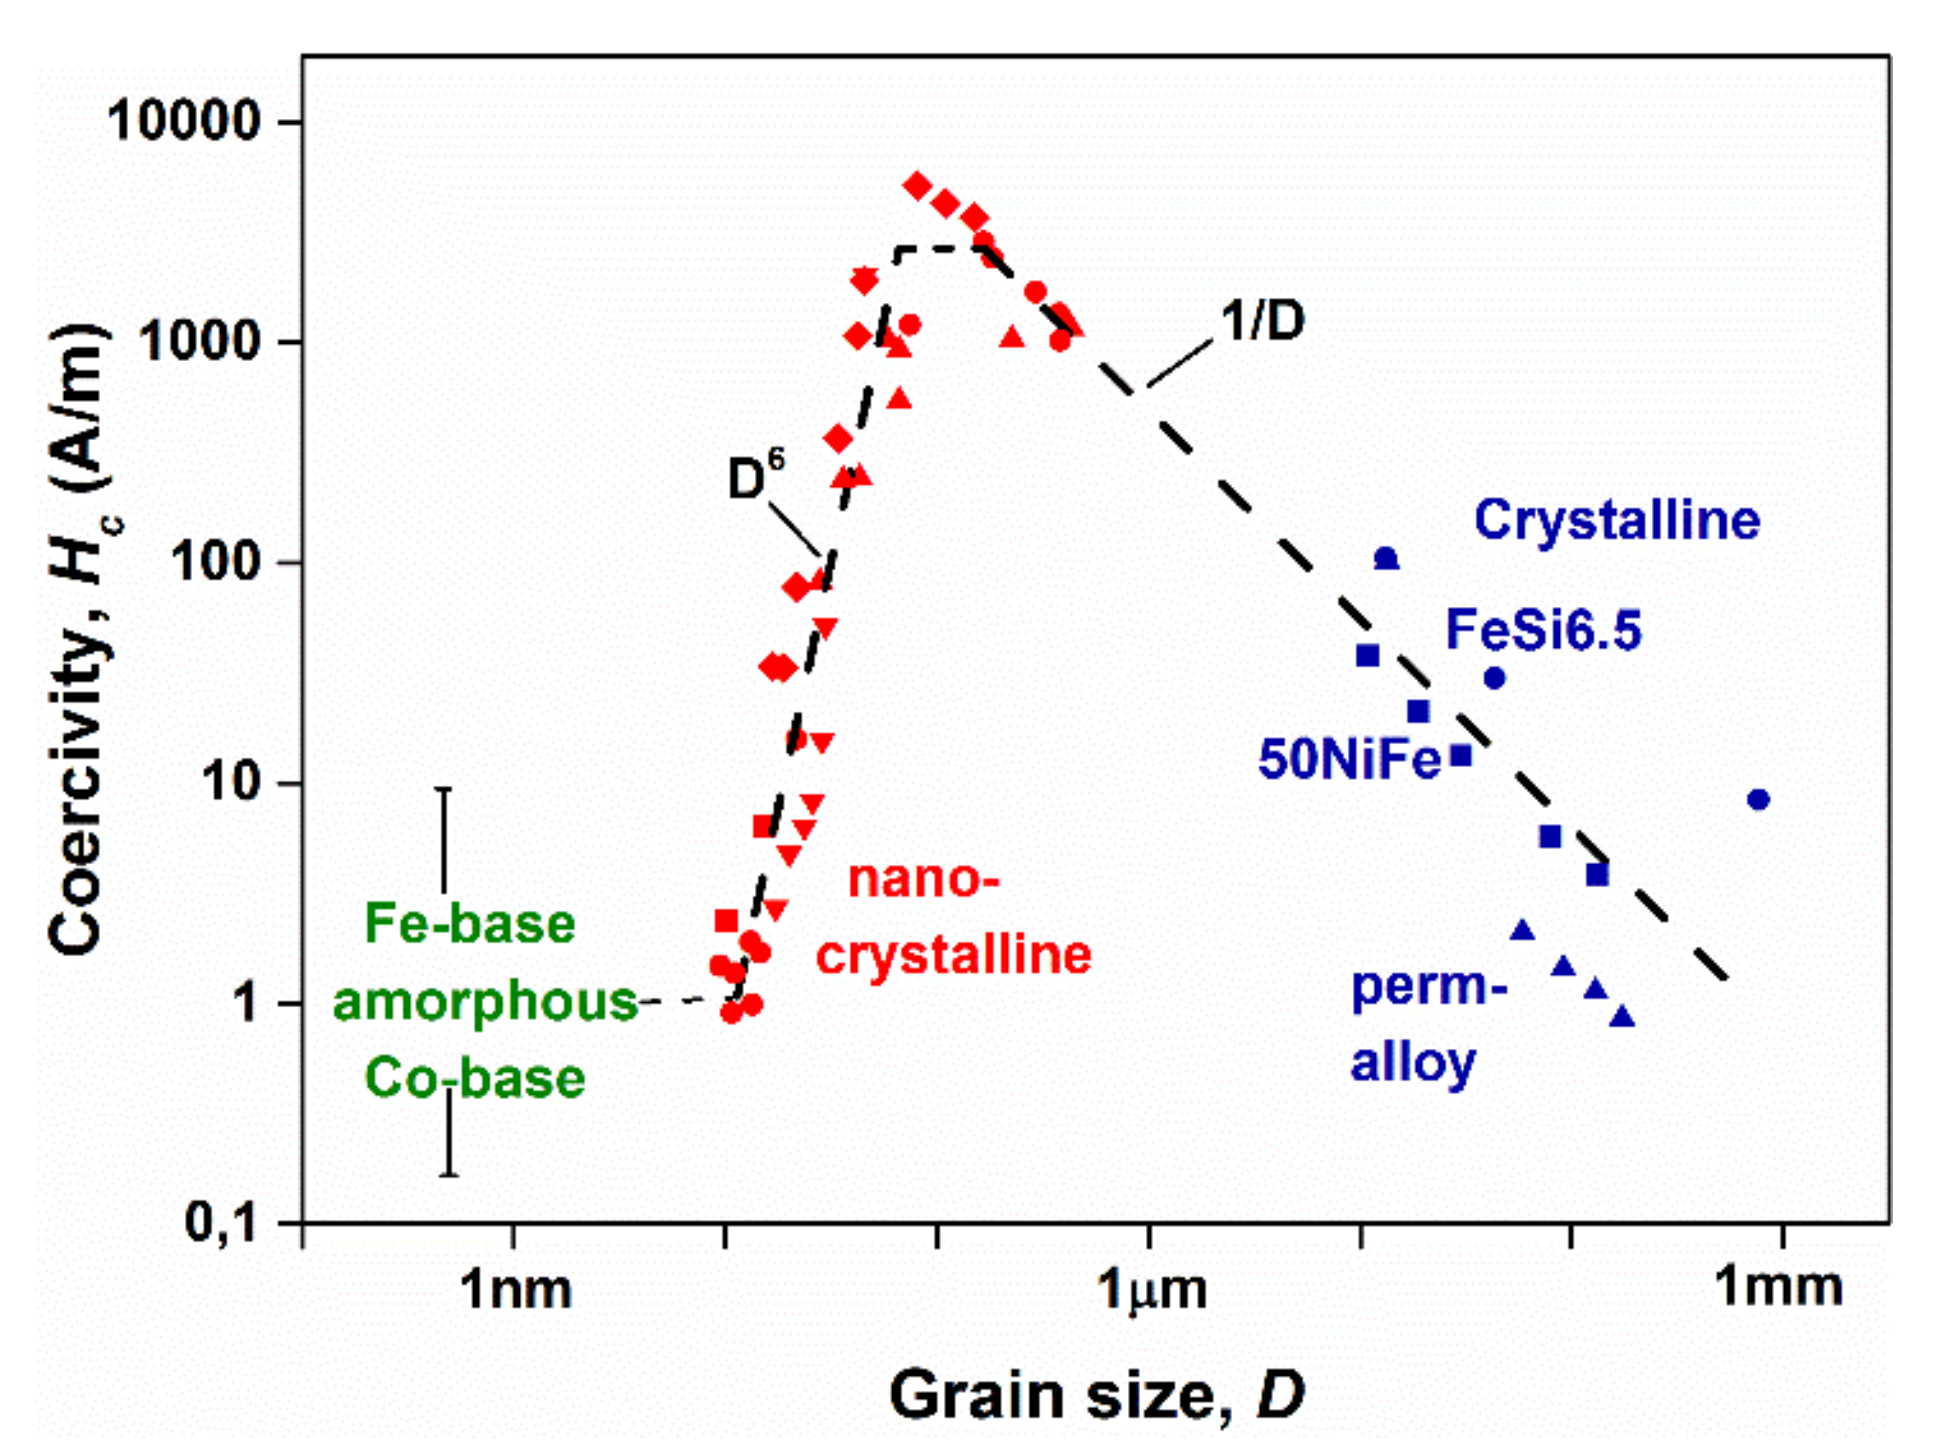
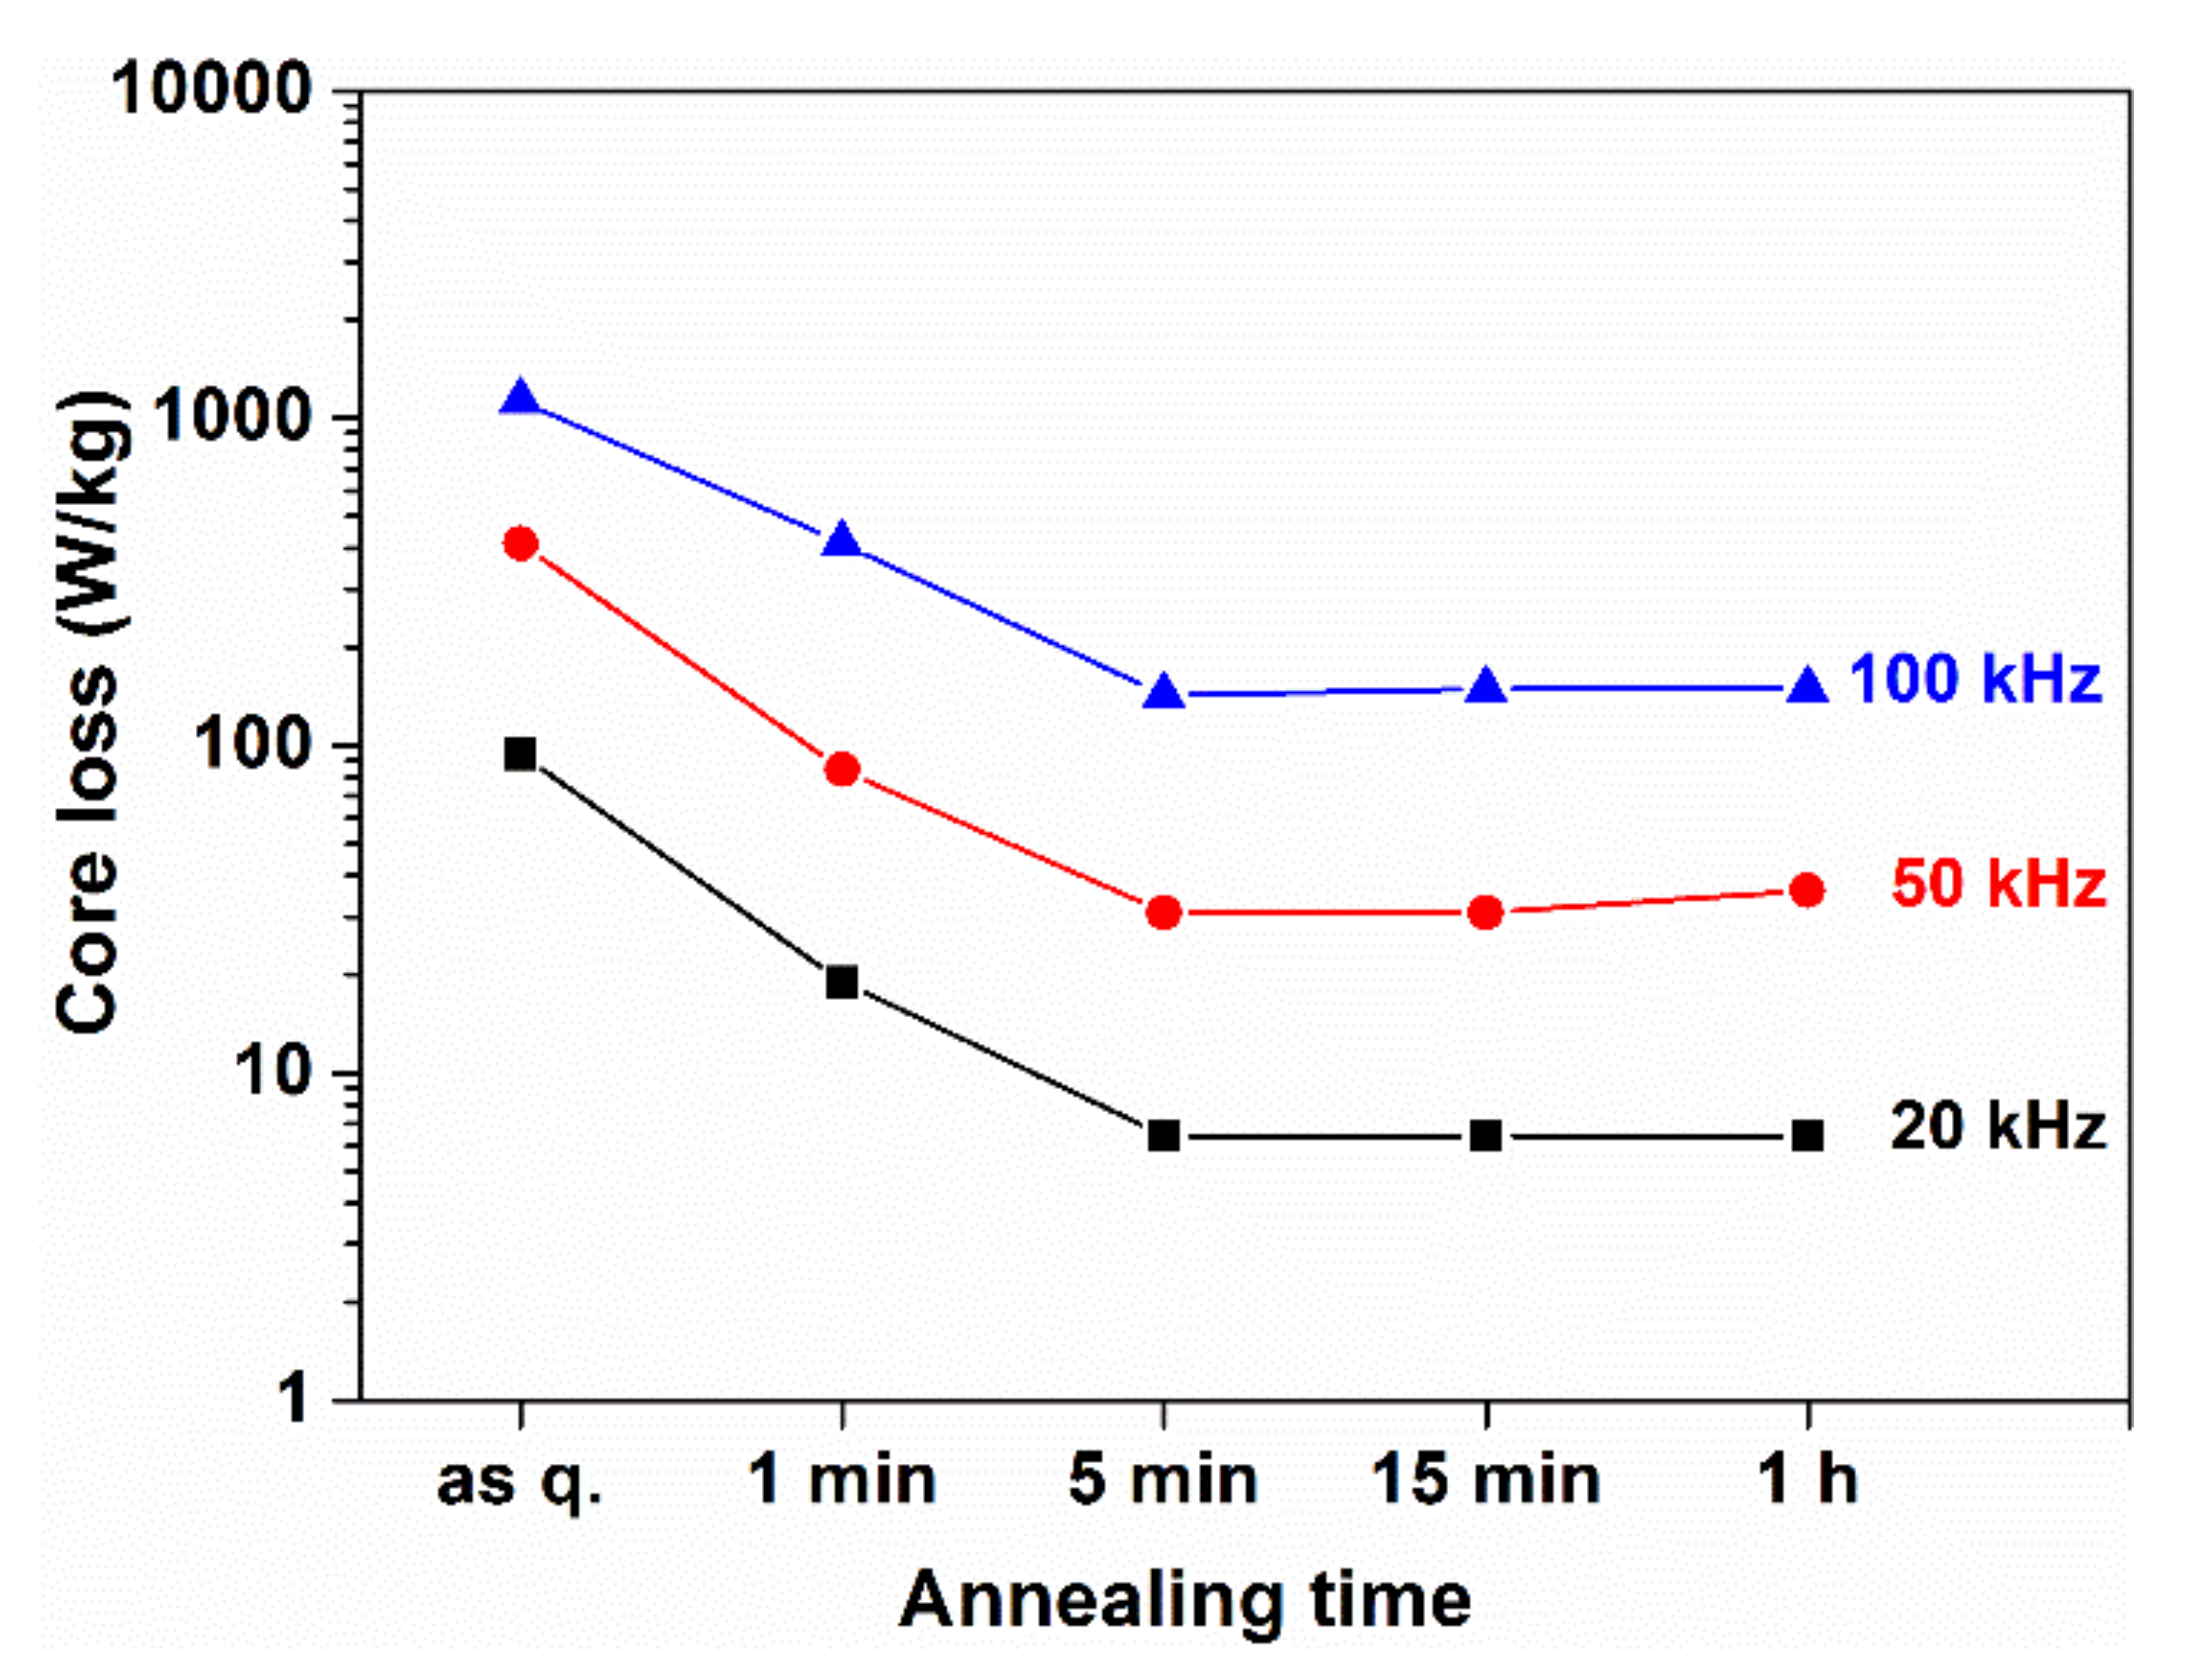
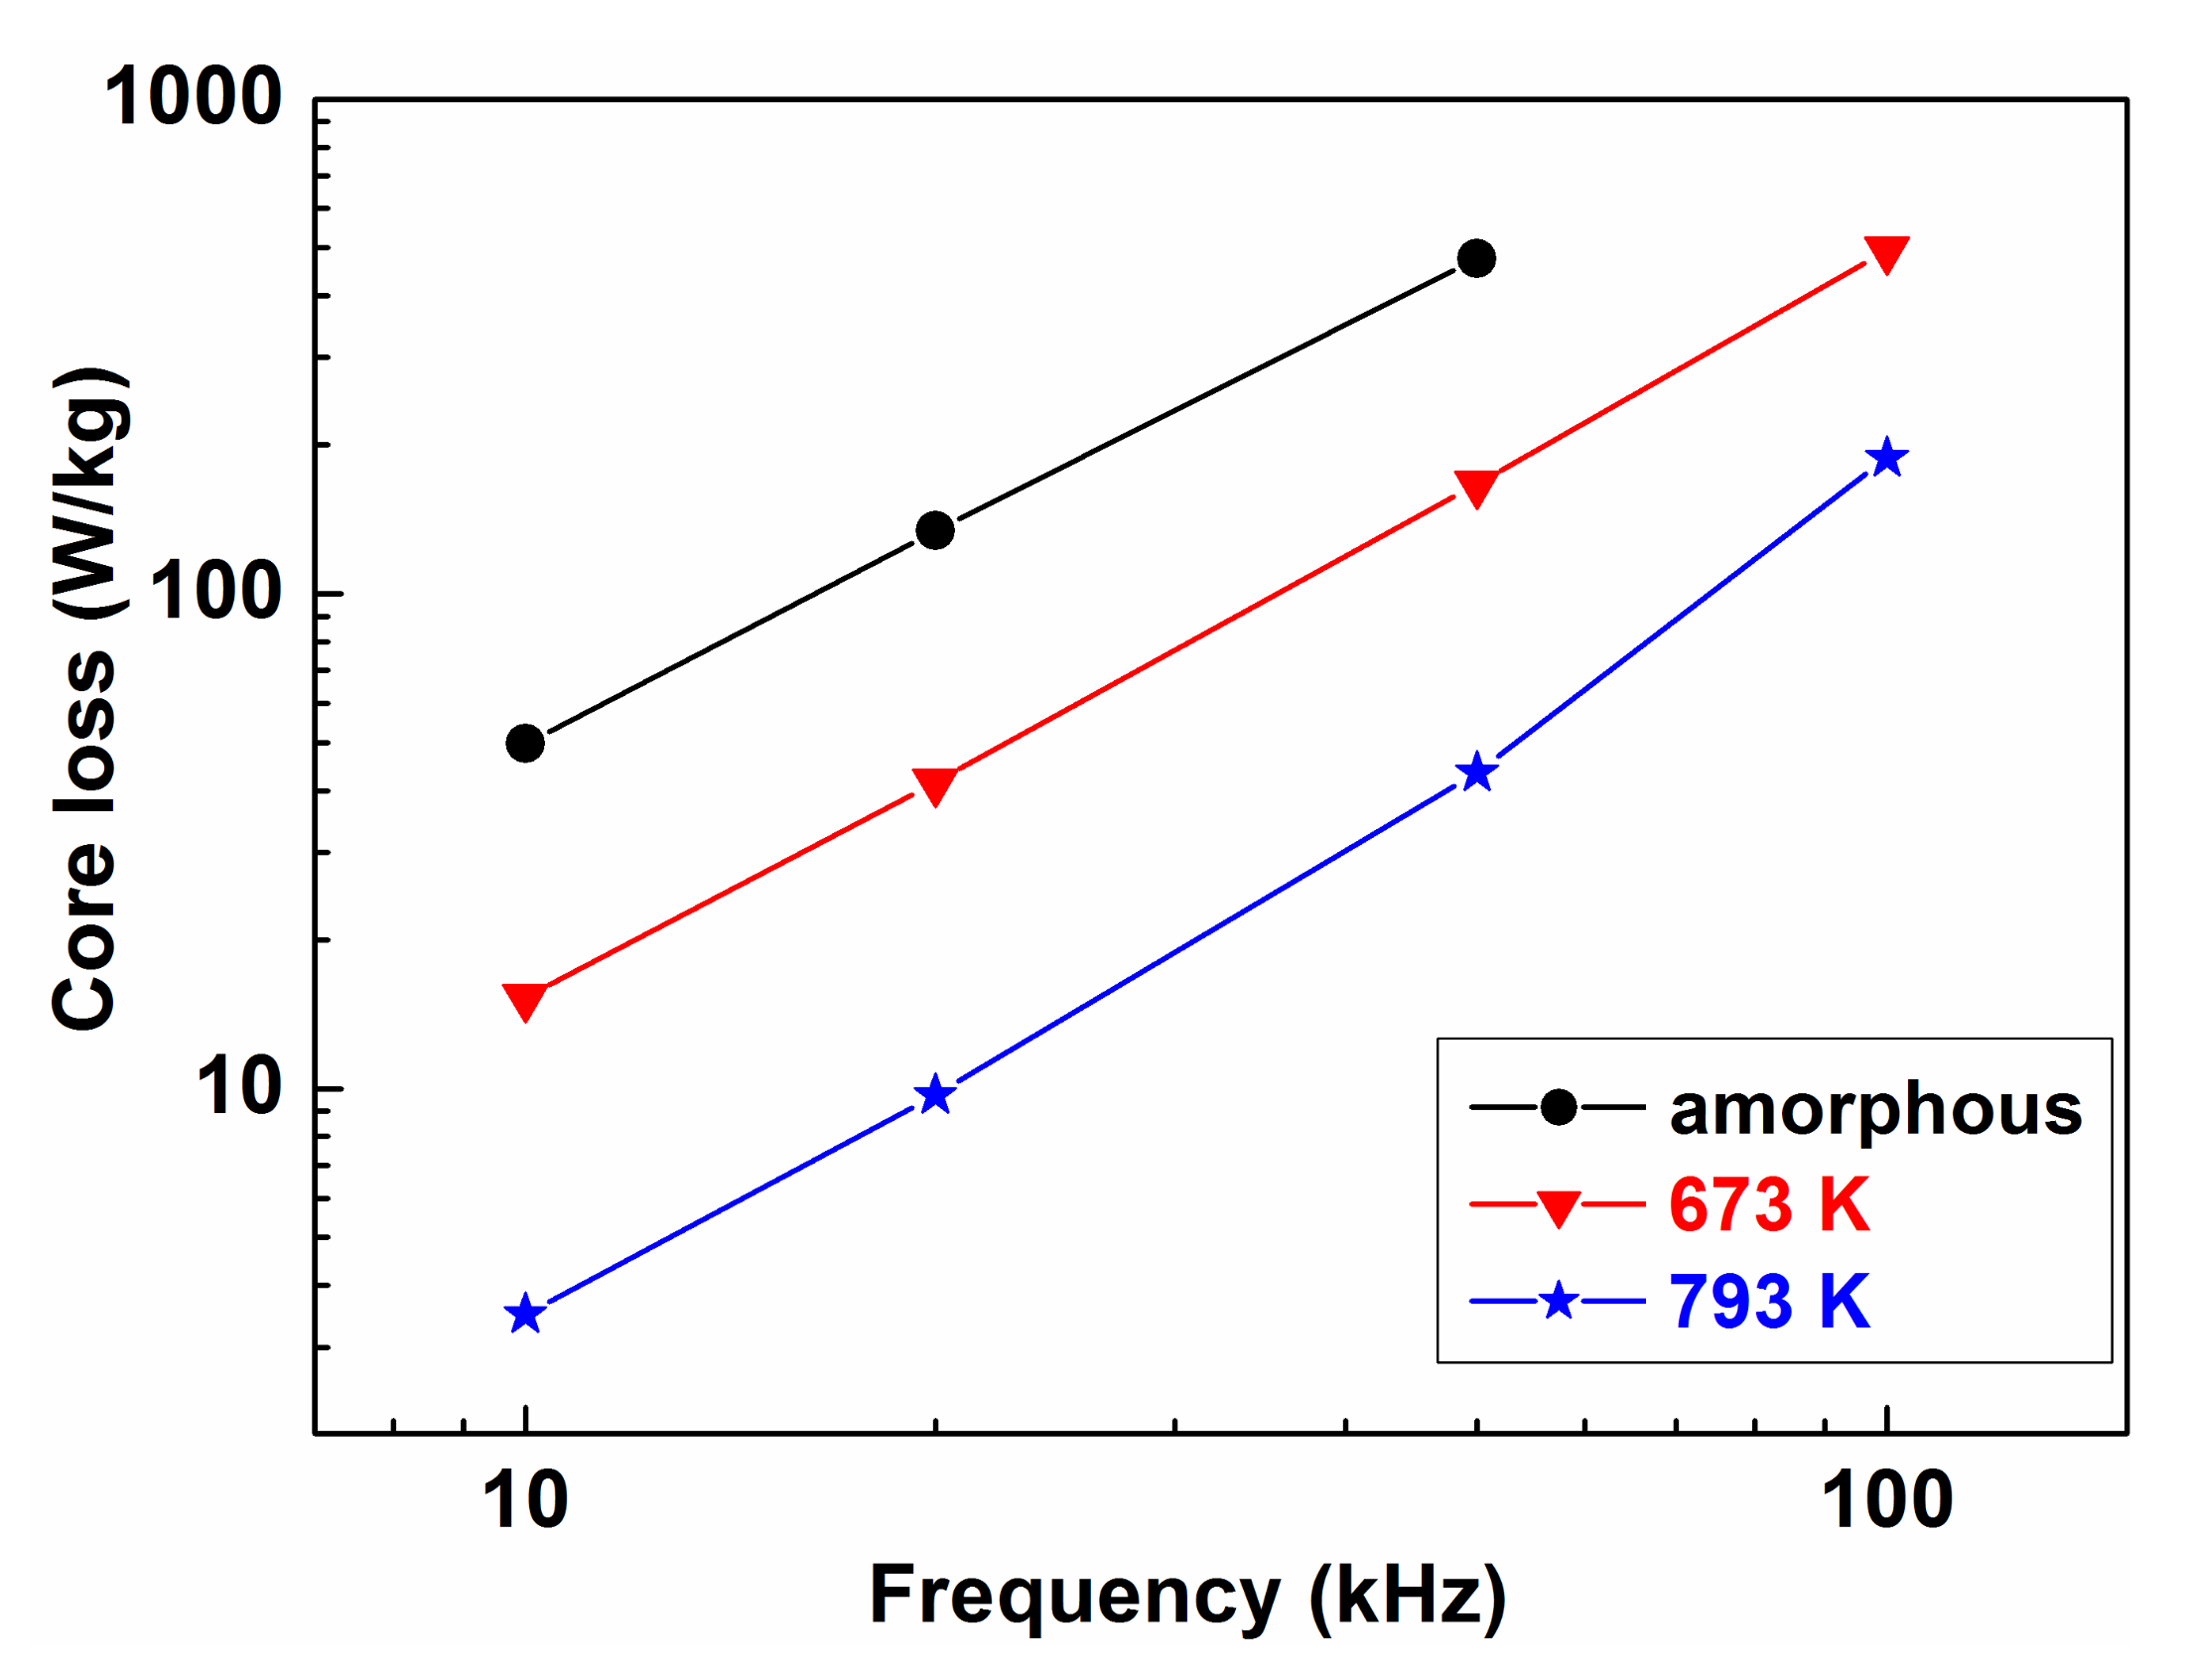
2.14. Cluster-Phenomena in the Mechanism of the Amorphous-Nanocrystalline Transformation

The amorphous-nanocrystalline transformation provides a basic mechanism for production of ultrasoft magnetic tapes via thermal decomposition of amorphous precursors [99]. The grain-size of the crystalline phases formed via the amorphous phase decomposition depends on the temperature, as can be seen in Figure 26 [100]. The minimum grain size is expected to develop when the temperature of crystallization is around 0.5 of the melting point of the alloy in question [101]. However, not all glass-forming systems are equally sensitive to this “0.5 melting point” criterion. FeSiB glasses, for example, exhibit an extremely sharp minimum of the grain size at around 0.5 Tm [101]. It has already been discussed that several physical properties change rapidly in the nanometer-sized dimension. Among others, the grain size dependence of electrical resistivity is remarkable [102] (Figure 27).
Even more spectacular is the dramatic grain-size dependence of coercivity in the nanometer-sized region, as depicted in Figure 28.
An inverse-like relation is fulfilled between the average grain size (D) and the coercivity (Hc) over a wide range of D. Below 100 nm grain diameter, more than three orders of Hc drop are observed between 1–100 nm grain diameters. This phenomenon is attributed to the coincidence between the magnetic correlation length and the grain diameter [103]. The rapid drop is believed to be the consequence of an average-out of crystal anisotropy within the domain wall thickness in these alloys (which is typically 100 nm according to Herzer’s criterion [103]).
Not all types of amorphous-nanocrystalline transformations result in excellent magnetic softness.
Only those nanocrystalline alloys exhibit ultrasoft magnetic behavior which are formed via primary crystallization [101]. In this respect, the crystallization mechanism of hypo-euectic Fe-B alloys is regarded as the master-type for the nanocrystallization in FINEMET-type precursors [104]. The excellent properties of FINEMET (Fe73.5Si13,5B9Nb3Cu1) precursor alloys was reported together with the crystallization mechanism in several references [105,106,107,108]. The addition of nucleating elements has an outstanding significance in this transformation [109,110]. In Figure 29 the influence of Cu as a nucleating element can readily be recognized. The role of Cu addition is not solely to ensure the formation of homogeneous nuclei for the evolution of the nanograin structure, but it also plays an active role in enhancing the peak separation arising from the α-Fe and Fe3B formation [111]. The suppression of Fe3B crystalline phase formation is highly desirable to avoid magnetic hardening.
The sufficient separation of the crystallization steps is necessary for the reproducibility of large-scale (industrial) production (see the thermograms in Figure 29). The temperature of α-Fe nucleation in Fe-B glassy alloys is lowered by Cu (third element) addition [66,112,113]. The essence of the cluster phenomenon includes γ-trapping (γ-retainment), which is enhanced by the Cu solute atoms. The solute atom-induced γ-retainment is a basic phenomenon in steel metallurgy [56]. While the Cu solubility in the austenite phase (γ, fcc) is significant, it is negligible in the ferrite phase (bcc) at around room temperature [114]. Below 1123 K, the γ-Fe(Cu) solid solution decomposes into bcc Fe(Cu) and fcc Cu via a eutectoid reaction (see the phase diagram in Figure 30). As the solubility is very low around 793 K, Cu appears as an independent phase just in the vicinity of ferrite grains. Hence, the basic phenomenon of α-Fe (nanograin) nucleation is the collapse of γ (fcc-like) clusters via the eutectoid mechanism. This conception is experimentally supported by high resolution electron microscopic investigations [109]. Several additional experiments support the significance of properly adjusted nucleation in the improvement of soft magnetic properties, in which the magnetically inactive γ-Fe(Cu) centers are eliminated from the soft magnetic environments [115,116].
Based on Figure 31 and Figure 32, as well as on the data listed in Table 1, we can conclude that the significance of nano-sized grain assembly as a criterion for the development of magnetic ultra-softness is over-estimated in [103].
The magnetic loss (Figure 32) rapidly drops within the first five minutes during isothermal heat treatments at 773 K, indicating that long-range diffusion is not included in the two orders of magnitude decrease of the losses. Rather, the diffusion-less collapse of stress centers should be the reason for the rapid evolution of magnetic softening. Nearly 50% of the loss decrease arises from the initial period of heat treatment, supporting the significance of nucleation events in the development of total magnetic softening in the FINEMET-type nanocrystalline alloys (see heat treatment at 673 K in Figure 32).
It can be concluded that γ like clusters (fcc short-range environments), are stabilized by the solute Cu-atoms in the as-quenched state of the FINEMET precursor alloy. These magnetically inactive clusters have a dominant contribution to the relatively high coercivity and also for the magnetic loss in the as-quenched state. The collapse of these centers via the eutectoid mechanism opens the possibility of rapid magnetic softening already in the initial period of the heat treatment, prior to the final development of a nanograin structure.

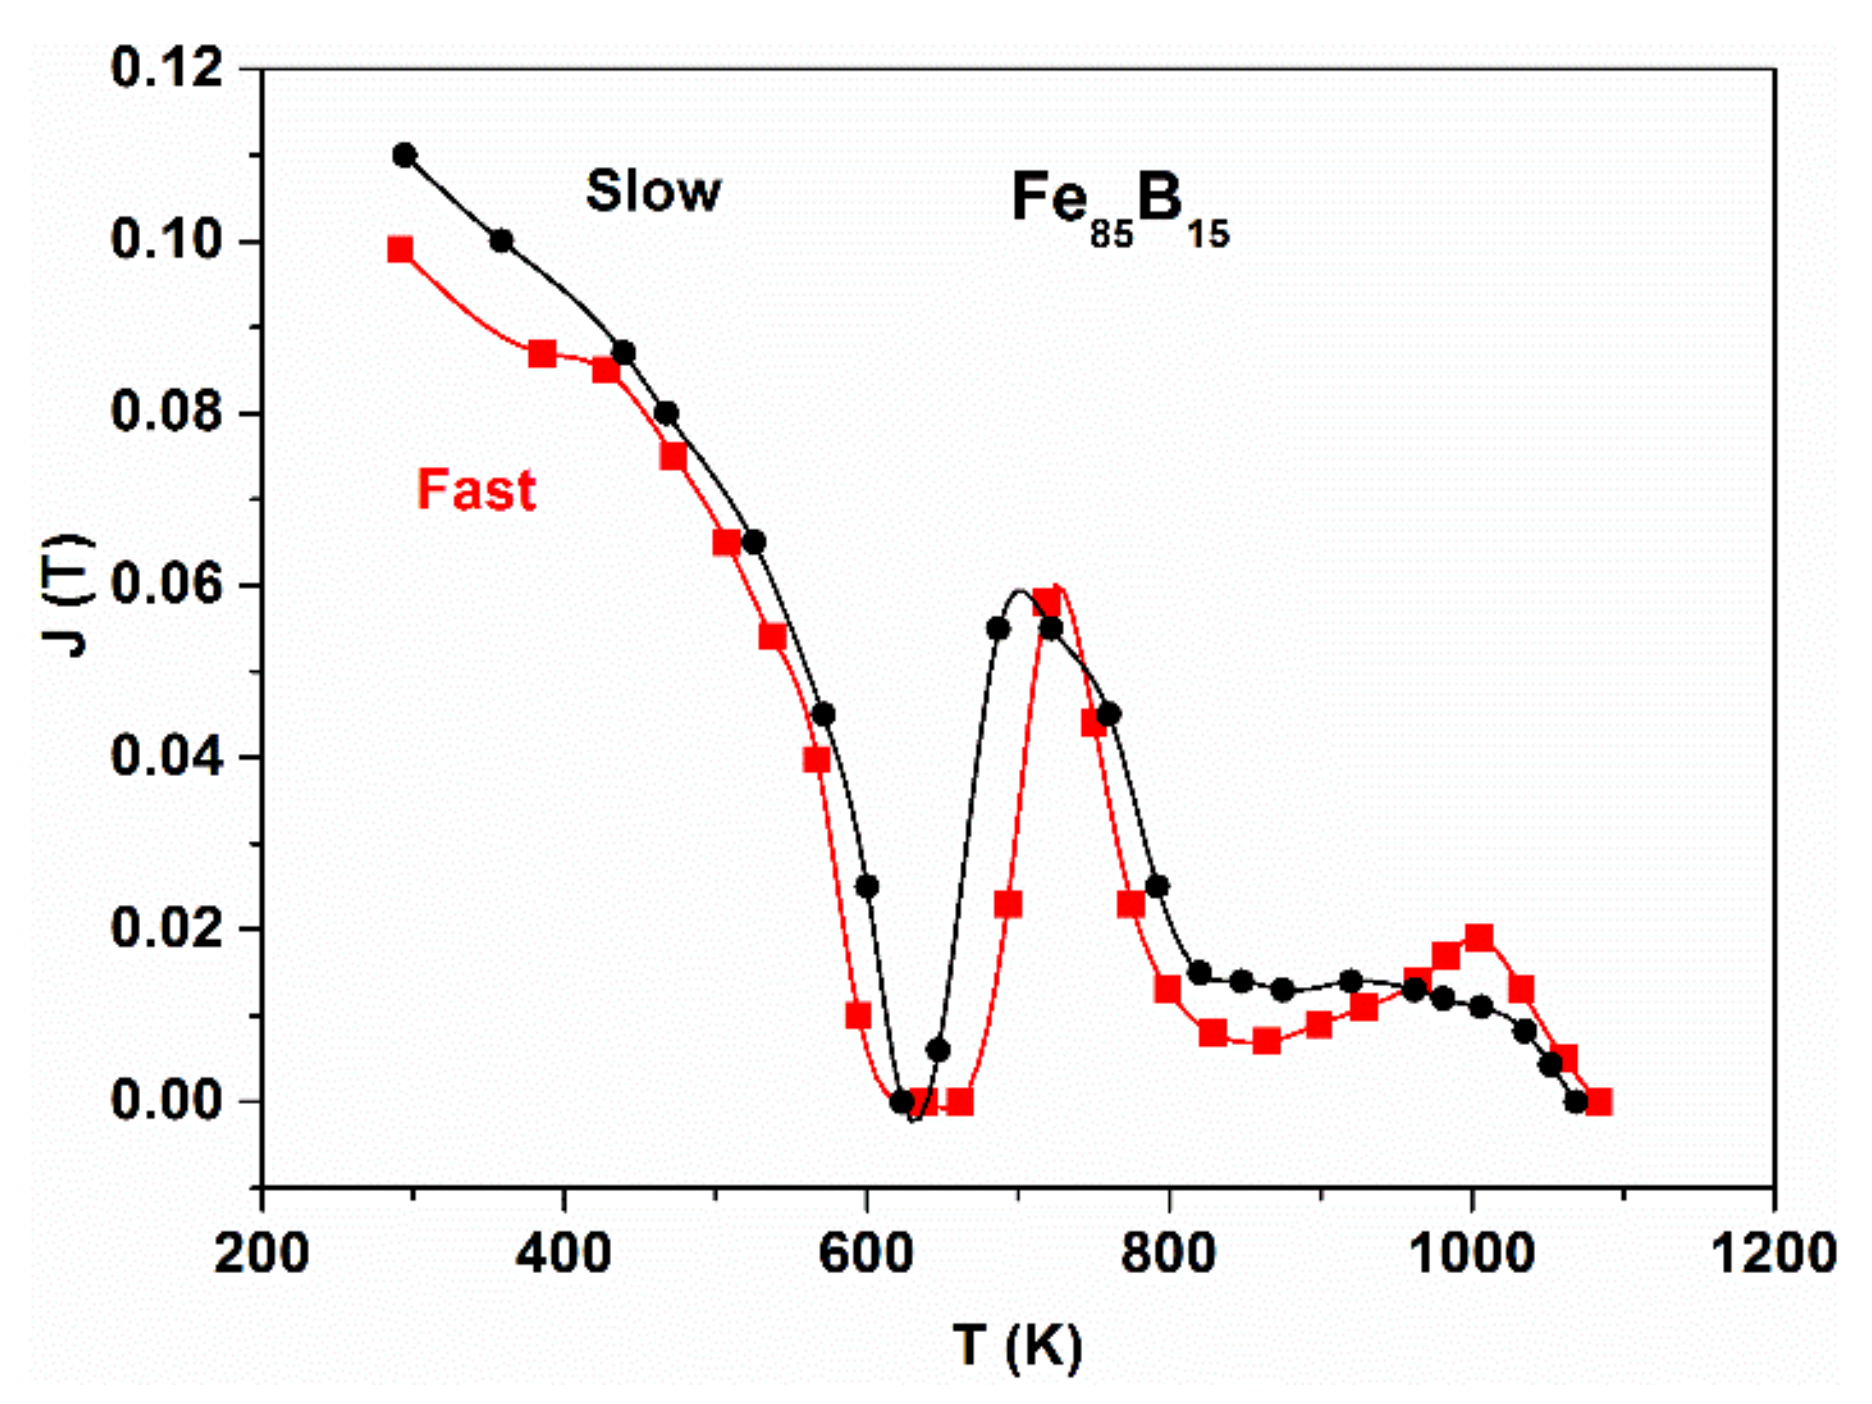
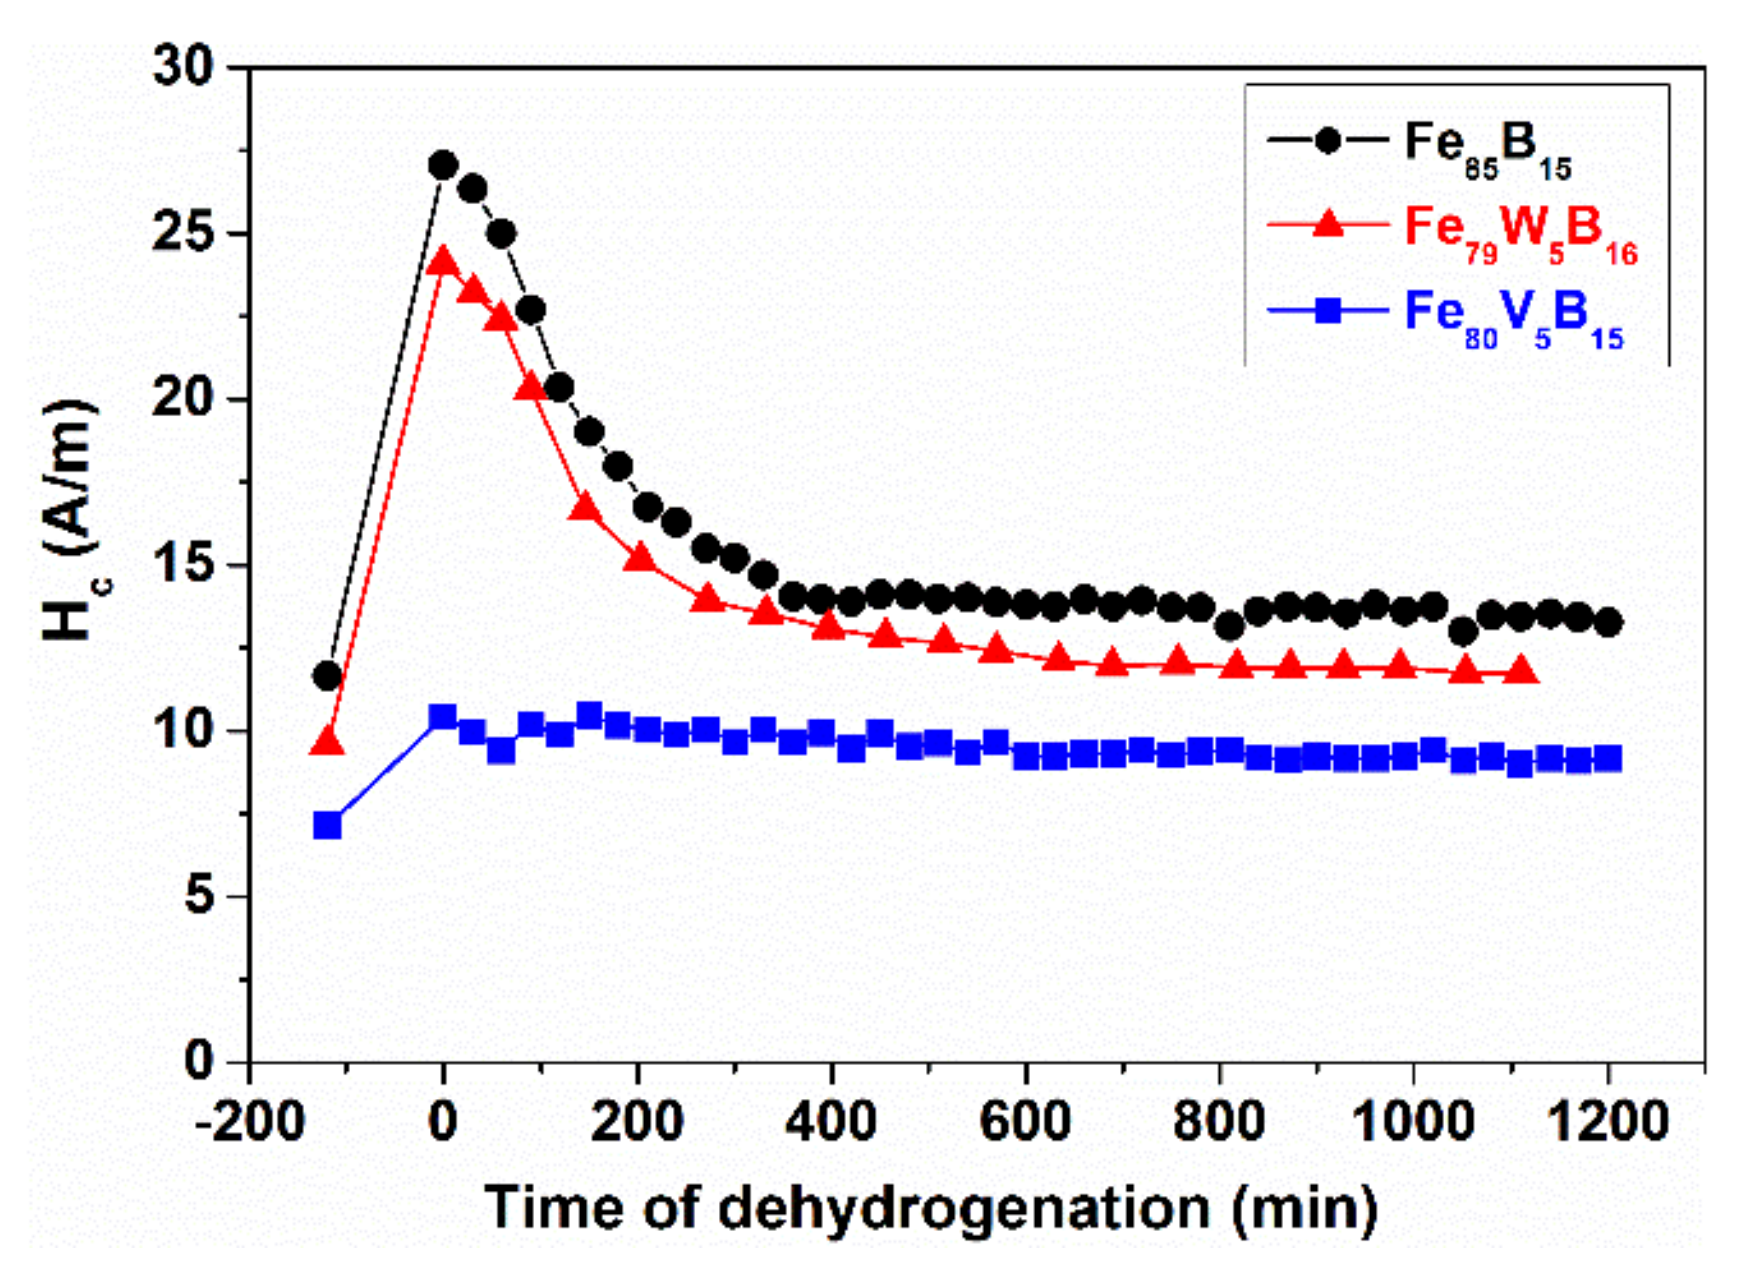
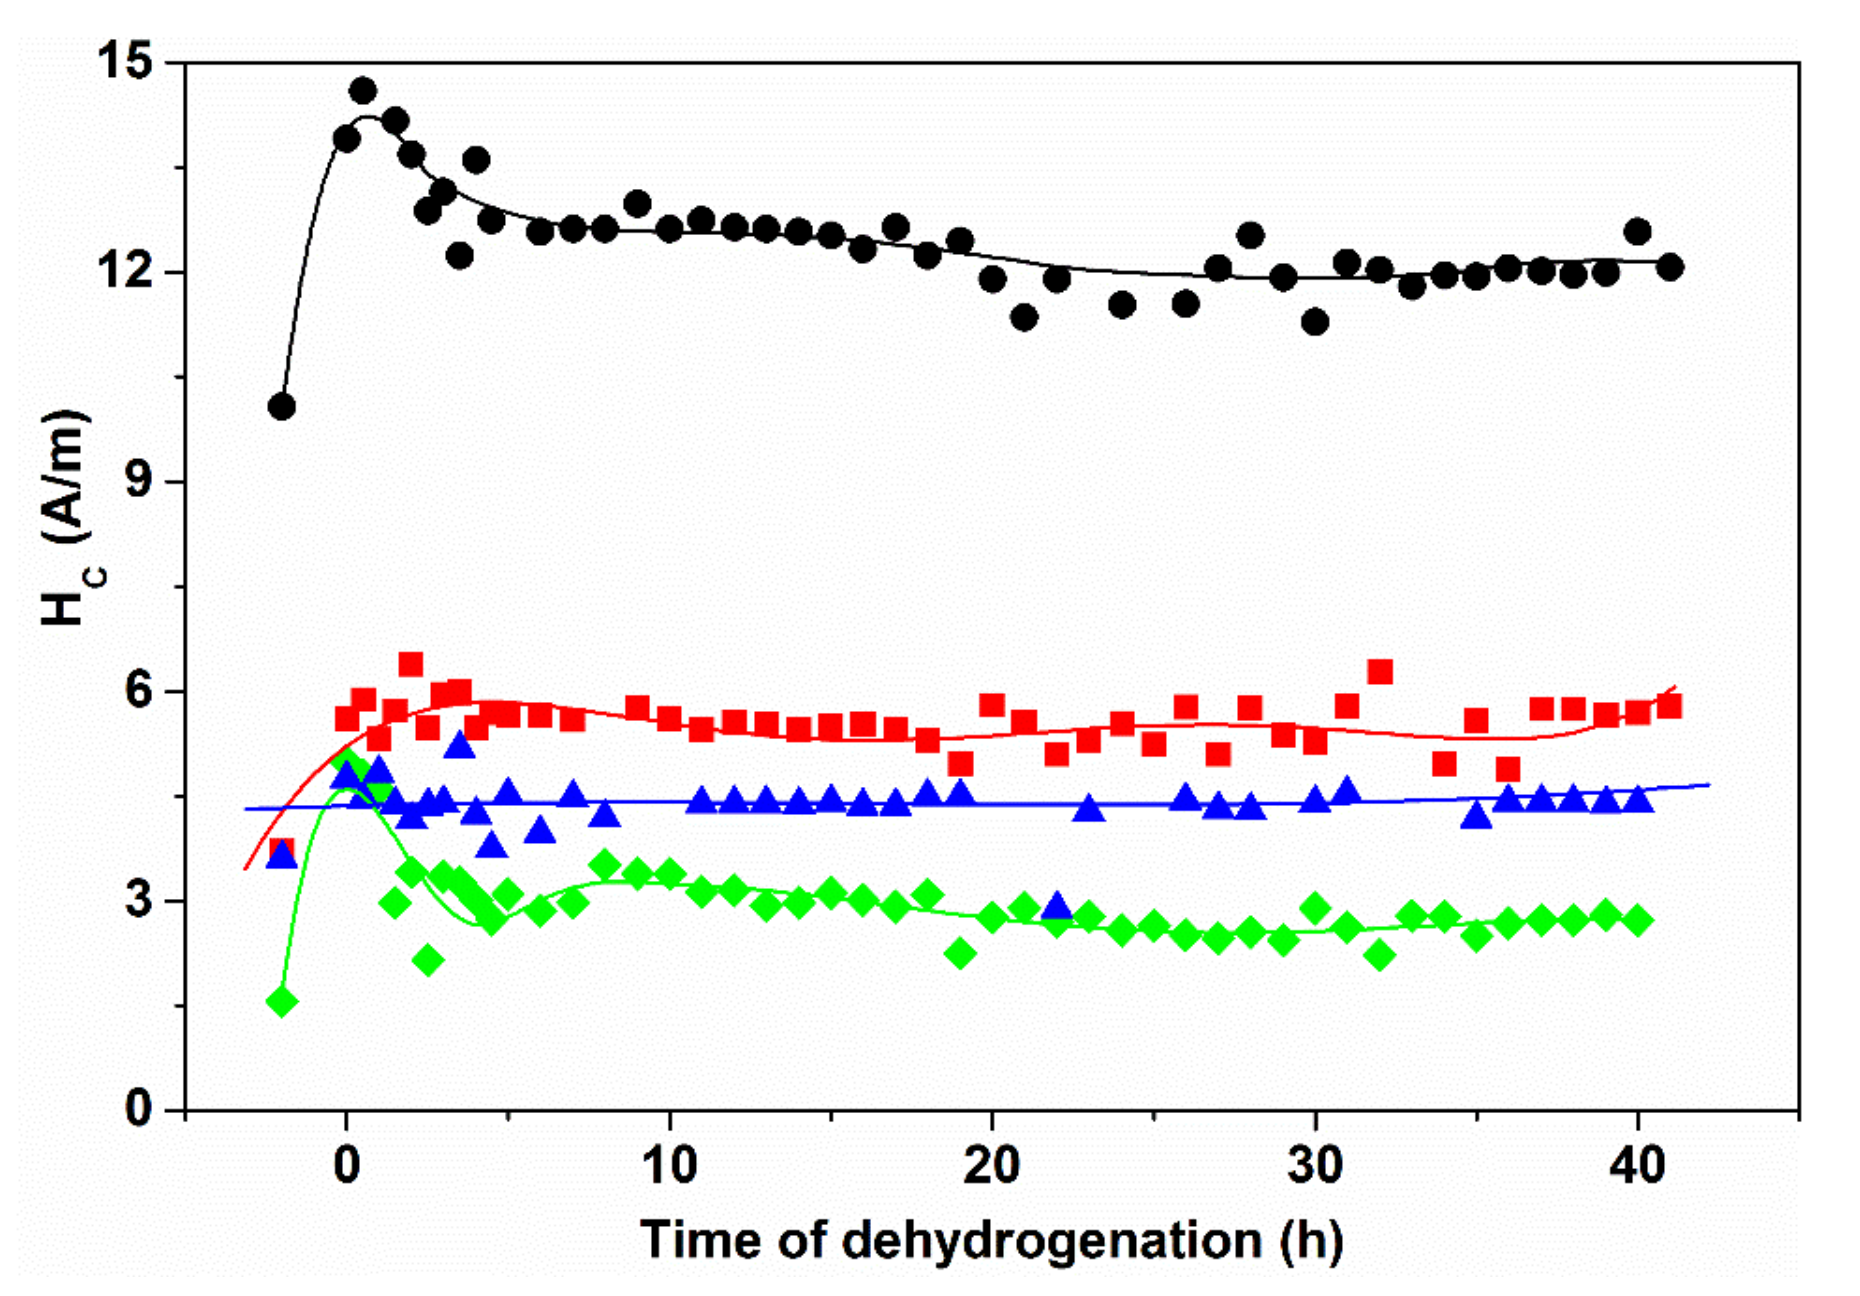
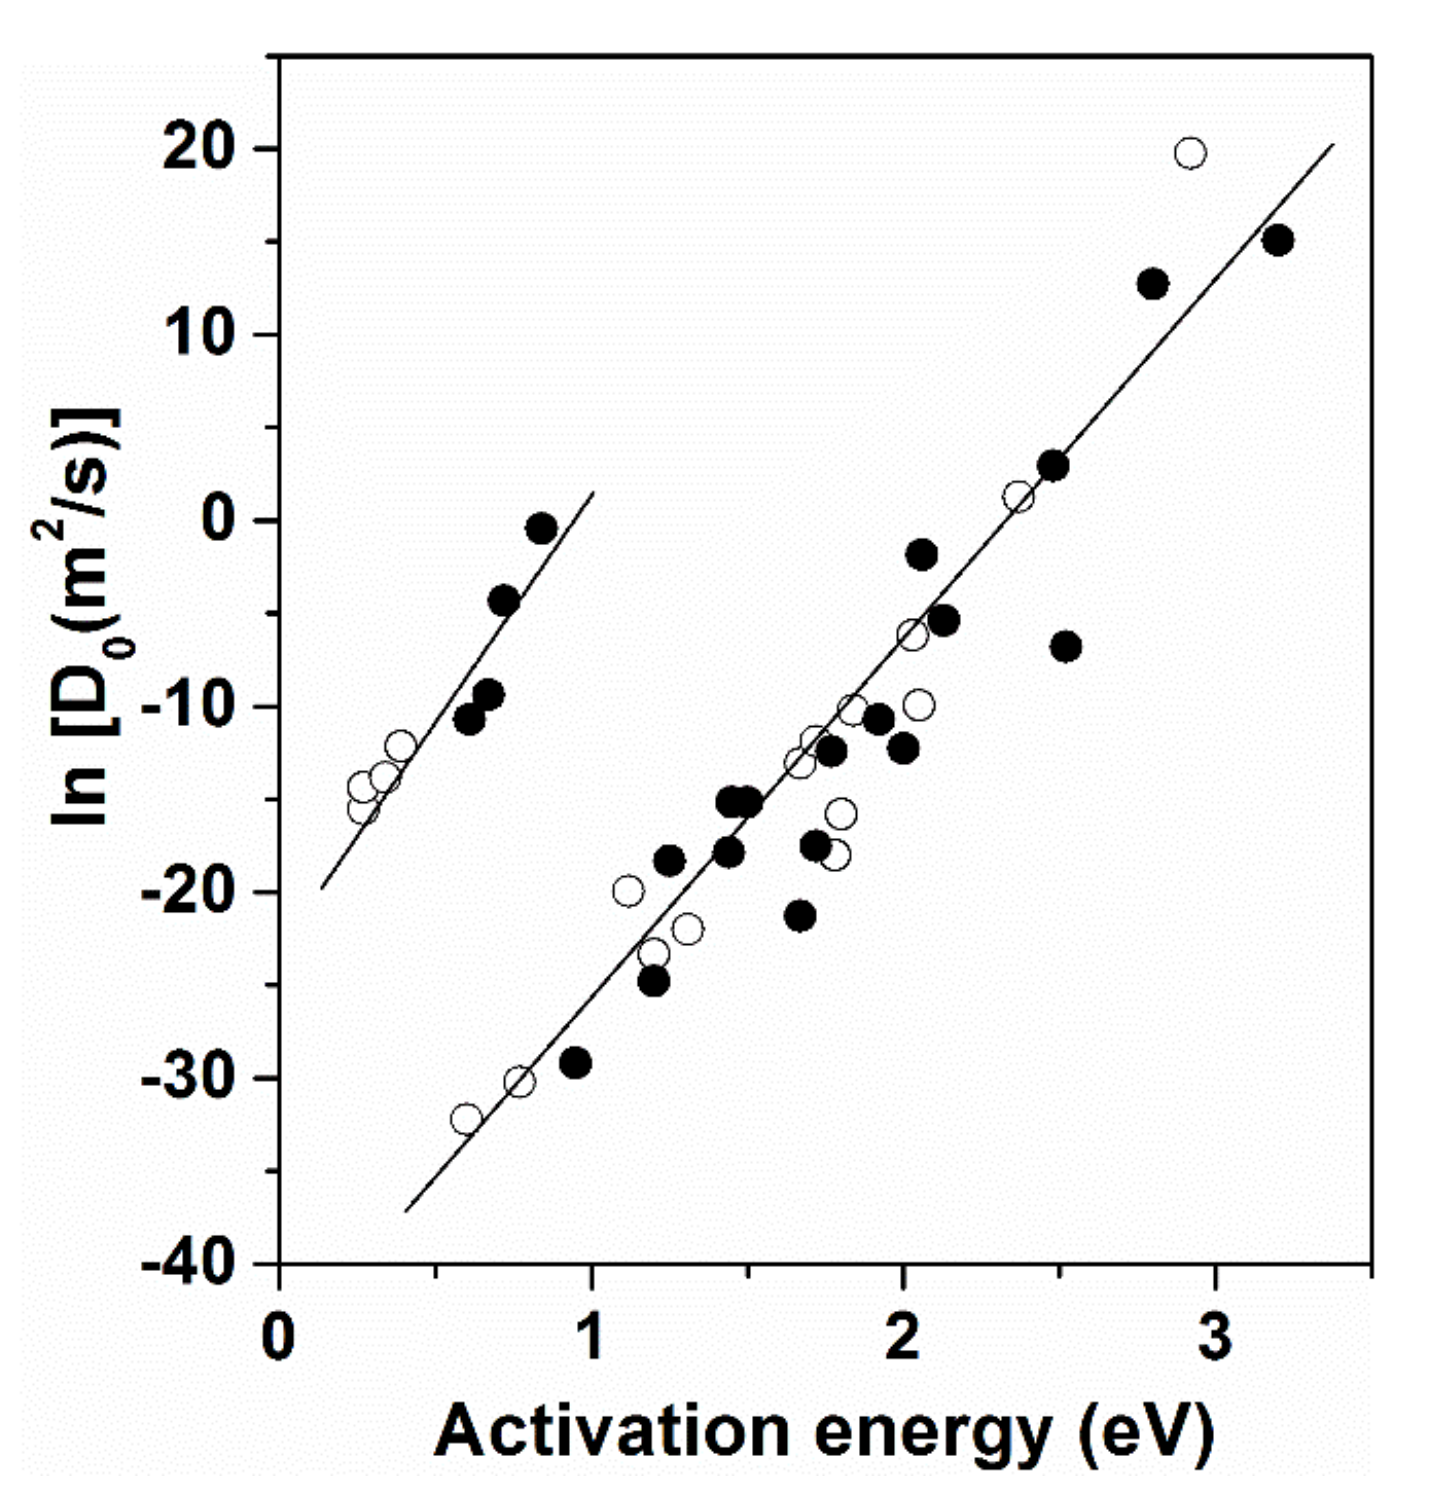
2.15. Mechanism of Hydrogen Absorption and Related Cluster Phenomena in TM-Based Glasses

The characteristics of hydrogen absorption and desorption (temperature and pressure dependence) in metals and alloys are determined by the sign of heat associated with the absorption process, which can be either negative (hydride forming metals, e.g., Zr, Ti, V,) or positive (Fe, Ni, without stable hydride formation at room temperature and atmospheric pressure) [118,119]. Like crystalline alloys, metallic glasses can also absorb hydrogen either from the surrounding atmosphere [120] or from electrolytes [121]. The hydrogen absorption ability is greatly influenced by the specific metallic host. As a consequence, the solubility of hydrogen (formation of interstitial solid solution) is also strongly restricted in glassy alloys by endothermic host metals. In spite of this, indirect effects (possible changes in physical properties) can be large, arising mainly from the resulting change in stress level [121,122] or (mainly in the case of exothermic-type of dissolution) the interaction between the electronic structure of the solvent matrix and solute hydrogen [123].
From the kinetic point of view, H dissolution can also be strongly influenced by the surface conditions of the absorber alloy [124].
Two phenomena are discussed as cluster manifestation:
The manifestation of a H-induced stress state in amorphous, and nanocrystalline alloys, (interaction between the dissolved H-atoms and the quenched-in cluster structure in TM-based glasses).
H-induced micro-phase separation in TM-based metallic glasses.
It was already mentioned above that two types of metallic glasses can be distinguished from the point of view of hydrogen absorption. The net heat of dissolution can be exothermic or endothermic. These main tendencies are the consequence of the chemical nature of the host alloy, representing the dominancy in the chemical properties. The feature of H solution in glassy alloys is also reflected in the tendencies illustrated in Figure 33 (temperature and pressure dependence of the saturation H-content as well as the magnitude of the saturation value inherited from the crystalline host metal, representing the dominancy in the chemical properties). The temperature dependencies of the saturation H content for a few TM elements are shown in Figure 33 [118].
An exothermic heat of dissolution is typical for hydride-forming metals, e.g., Zr, Ti, V, and an endothermic heat of solution is typical for metals and alloys, which do not form stable hydrides around room temperature, like Fe, Ni, etc. [125]. The T dependence of the saturation H content is just opposite for the two groups of d metals. These solution types can also be recognized in the relevant glassy alloys. For the hydride-forming metals, the total saturation H content decreases with temperature, while in the case of endothermic dissolution, the T dependence is just the opposite [125].
Another important difference between the two groups of elements is that the saturation hydrogen content is several orders higher in hydride-forming metals [125]. Among the endothermic systems, the behavior of Fe is especially remarkable: At the temperature of the α → γ transition the solubility increases abruptly in the γ phase region, indicating, that the fcc environment is much favorable for the site occupation of H atoms, i.e., H trapping in the fcc lattice is energetically favorable. The interstitial site occupancy of H atoms is typical for both types of systems.
At a critical hydrogen content, (i.e., when a critical H/M value is exceeded) a substantial structural rearrangement takes place in hydride-forming metals or alloys [119]. Both the chemical short-range order as well as the lattice symmetry is altered at this concentration (hydride formation) [119]. In contrast, no structural change except lattice expansion is observed in endothermic dissolution as the H content increases.
As the chemical character of glassy alloys is inherited from the crystalline host metal, it is expected that in Fe-based glasses (where the net heat of solution is positive) the H solubility is low (see also Figure 33 and Table 2) [120,121,122,123,124,126,127,128].
In some alloys, H dissolution can be enhanced by appropriate electrochemical methods [119,125]. Spontaneous desorption of dissolved hydrogen occurs in such systems when the direct contact between the electrolyte and the absorbent glass is interrupted.

2.16. Possible Model for the Metallurgical Description of the Origin of H Trapping Sites in Fe-Based Glasses

The extended solubility of metalloids (C, H, N) in the fcc (γ)-phase is a general tendency in 3D transition metals (see Figure 34). This figure also points to the responsibility of the electronic structure of the solvent metal for the solubility limit of H. The unfilled d shell also has an impact on the solubility of metalloids, though the fcc environment is generally favorable. In spite of the low H solubility in these metals (see Figure 33), the resulting effects in the soft magnetic properties are considerably large. This influence arises partially from local stresses induced by the H incorporation (magneto-mechanical coupling). Hence, the soft magnetic properties—being sensitive to the stress level—are tolerably influenced by H absorption.
As it was discussed above, local γ-type environments are quenched-in during rapid solidification. These clusters represent potential preferential trapping sites for the H atoms. Such “γ-reminiscences” contribute to the overall total H content during the saturation (though, the fraction is very small, compared to the exothermic types of absorptions) [128].
As the interaction between the H atoms and the surrounding Fe atoms is weak, spontaneous desorption takes place when the hydrogen supply is interrupted. The hydrogenation is performed using an electrolytic method in this case [121]. Such spontaneous dehydrogenation is illustrated in Figure 35 and Figure 36 for various Fe-MB-, and FINEMET-type glasses. The changes in coercivity (as stress sensitive magnetic property) are plotted versus the dehydrogenation time in as-quenched Fe85B15, FeW5B15 and Fe-V-B samples.
The Hc increase due to H absorption is the highest especially in Fe85B15 and FeW5B15 samples. As a consequence of spontaneous H desorption (monitored from t = 0) Hc rapidly decreases again, approaching the initial value, measured prior to the saturation. After sufficiently long “relaxation” time at room temperature, the stress level in the samples is nearly identical to that in the “as-received “state (room temperature). The H-induced Hc increase is small in the V-containing samples and the dehydrogenation time is much longer, probably due to the local interaction (binding) between the dissolved H and the V atoms. This means that the contribution of chemically bonded H atoms is negligible in the evolution of the H-induced stress increase.
In Figure 36, the same type of dehydrogenization process is monitored in FINEMET-type samples. The Hc values are continuously measured during the time period of dehydrogenation, in the as-quenched as well as in heat treated samples. While the heat treatment at T = 713 K for 1 h results structural relaxation only (a nanocrystalline structure is formed at T = 793 K after 1 h), Hc is obviously higher in the “as-quenched” state and it is lowered significantly due to heat treatment. Simultaneously, the susceptibility to H absorption is suppressed both in the structurally relaxed and also in the nanocrystalline samples, indicating that the same mechanism is responsible both for the Hc increase and the H trapping in these alloys.

2.17. Influence of H Absorption on the Curie Temperature: Combined Effects Arising from Simultaneous H Absorption–Desorption and Self-Relaxation during the Tcam Measurement

In the previous discussion, the Fe-based glasses were looked upon as endothermic systems, in which the H solubility increases with temperature. In the following, the role of dissolved H on the Curie temperature (TCam) will be discussed.
It is assumed that preferential H trapping sites (γ-centers)—at least partially—arise from the quenching process, similarly to the quenched-in retained austenite in carbon steels [57,58]. One can ask the question whether the Curie temperature can also be influenced by dissolved H, at least temporarily, when the H atoms are actually present in the trapping sites?
This mechanism can be explained by the local increase of the atomic distance within the (compressed) γ-centers. From Figure 7 it is obvious, that H atoms, which are entrapped in the fcc-like centers quenched-in in the hypo-eutectic Fe-B glasses, cause a local expansion at the cluster level. As the inter-atomic distance between the neighboring Fe-atoms increases due to H-induced local expansion, (interaction between H and the d electrons of Fe is negligible), the exchange interaction locally increases. Based on this supposition, TCam should increase due to dissolved hydrogen in hypo-eutectic Fe-B. Note, when Ni atoms occur within the short-range environment of fcc clusters, the Bethe–Slater (BS) curve predicts a decrease of TCam due to the expected opposite tendency in the BS curve (Figure 6b).
However, there are several difficulties with the detection of temporary effects of dissolved hydrogen. The main problem is the simultaneous “self-relaxation” of samples during the TCam measuring run (especially, when TCam is high, typically beyond 473 K, where the atomic-scale mobility is thermally activated). In order to decrease the above-mentioned relaxation effect, special model samples with sufficiently low TCam were prepared, i.e., TCam was suppressed by appropriate alloying (replacement of Fe by Cr atoms). Another difficulty is that slow heating of the samples is necessary, especially in the vicinity of TCam, which is required for the better reproducibility of the heating and cooling runs. The samples were overheated by 20 K, (Tcup) and then cooled down slowly (Tcdown). When Tcup = Tcdown, no structural relaxation occurs during the measuring run, i.e., the role of dissolved H can be detected.
Another possible difficulty may arise from the high rate of H diffusion compared to the self-diffusion of metallic host-atoms [131]. The difference is several orders of magnitude (Figure 37). In addition, this difference is even more pronounced around room temperature [130].
The successful separation of the above-mentioned effects is demonstrated in Figure 38 and Figure 39. The measurements were performed on two independent samples, for which TCam is nearly the same and low enough to minimize the TCam shift caused by the self-relaxation. The Curie temperature was suppressed by Cr addition. Hence, the initial (as-quenched) state of Tcam < 373 K. Moreover, the high Cr content simultaneously ensures a high thermal stability of the glassy state [50].
Prior to electrolytic H saturation, TCam was measured using a vibrating sample magnetometer (VSM) (the first point in Figure 38 at a time of 2 h). Two independent measurement runs are depicted in this figure. The first run was performed on the same sample. The second series was always obtained on independent samples after increasing the resting time between the saturation and the measurements (Figure 38).
TCam is measured both on the heating and cooling runs. As expected, no Curie temperature shift can be observed for the as-quenched sample, indicating that no measurable relaxation occurs due to heating the sample up to TCam (341 + 20 K).
A TCam increase of ΔTc ≈ 10 K was observed for the H-saturated sample. ΔTc decreases during the subsequent measuring runs, which is in agreement with the expectation of spontaneous H desorption.
This finding is just opposite to what is observed when solely thermally activated relaxation is involved in the measuring runs. An irreversible increase of TCam is observed in the first period of heat treatments (γ-center annihilation). In this case, TCam suddenly increases, obviously due to the absorbed H atoms, in agreements with the Slater–Pauling conception: (transient J increase, c.f. Figure 38), but it drops rapidly again during the repeated measuring runs. It is also remarkable that ΔTCam (Tcup-Tcdown) > 0, i.e., the decreasing TCam shows that this effect cannot simply arise from “thermal relaxation”. The gradual decrease arises from the rapid desorption of H atoms from the glassy matrix due to H diffusion, which is several orders higher compared to the matrix atoms. It is also noteworthy that a definite crossover appears between the trends related to Tcup and Tcdown (the sign of ΔTCam turns opposite during the repeated measuring cycles). This fact points again to the extremely different rate constants of the simultaneous processes. The outlined tendency is further supported by the second series of measurements (see also Figure 38). These measurements were performed on independent samples with a longer time-period between H saturation and TCam measurements.
The same effect (the role of transient incorporation of H atoms) is found for Fe75Cr10B15 glassy alloys (the Cr content is slightly different (Figure 39)). The TCam measurements were performed on the heating run only, and the subsequent measurements were separated by heat treatments (473 K, for 30 min). The resulting thermal activation was sufficient for the rapid desorption of dissolved H from the glassy absorbent, so TCam of the as-quenched state is restored (absence of thermal activated relaxation).

2.18. The Role of H Absorption in Ni-Containing Glasses (Combined Compositional Effects)

As predicted by the Bethe–Slater (BS) correlation, the sign of the H-induced TCam shift (sign of ΔTCam) is also influenced by third metallic components of the absorber matrix. The results in Figure 40 are in contrast to previously reported observations [60,132]. TCam obviously decreases due to previous H-saturation.
This effect can be explained by the participation of Ni atoms in the fcc-like environments. The local, H-induced expansion can decrease the exchange interaction and lower TCam (Figure 40). An additional remarkable observation is the increasing stability of those H-induced structural features in the Ni-containing samples: the trend is present even during the subsequent measuring runs.
Another spectacular illustration of the combined effects is illustrated in Figure 41, comparing the TCam relaxation of differently treated Fe40Ni40Si6B14 samples. The samples were previously stabilized by a long-time heat treatment at 523 K for 24 h. In this case, a significant TCam reduction is detected after H-saturation, probably, due to the dominant participation of Ni atoms in the fcc environments (the exchange interaction decreases with increasing local atomic distances; H-induced local expansion). A similar lowering of TCam occurs during cryo-treatment as well (increasing number of fcc environments attributed to the completion of glass transformations).

2.19. Micro-Phase Separation in the Amorphous State

The tendency for micro-phase separation, deduced from high resolution electron microscopic observations and thermodynamic considerations, was already reported in [12,13,14,15,16] for several metallic glasses. Such cluster types are spatially more extended than the previously discussed structural units and easy to identify by high resolution electron microscopy. The development of extended clusters is governed by the chemical composition, but the final dimensions of the cluster structure are also influenced by the complete thermal history of the glass (including the variation of quenching rate and subsequent heat treatments). Such a tendency for micro-phase separation can also be manifested in certain bulk physical properties, like the appearance of two-stage embrittlement or reversible-irreversible length changes during structural relaxation [134,135].
An example for the two-phase nature of the Fe40Ni40Si6B14 amorphous alloy is shown in Figure 42, where the temperature dependencies of viscosity and thermal expansion are plotted.
The discontinuous change of the viscosity clearly hints to a spatially heterogeneous thermal activation of translation mobility of the constituent atoms in the glass, which develops in the supercooled liquid state [136].
Micro-phase separation is also often observed in other glassy alloys, especially in those which are composed of two or three transition metals, exhibiting different chemical affinity to hydrogen (endothermic and exothermic type of dissolution). In these micro-phase separated systems the diffraction contrast arises from a distinct difference in the composition of neighboring clusters [137,138]. The reason of chemically-induced cluster formation is the different chemical affinity between the alloy components and hydrogen [118,119]. NiZr and ternary Ni61-xZr33Cux glassy systems are spectacular examples for H-induced micro-phase separation. The respective hydride formation enthalpies for the components are −163, +17 and +21 kJ/mol for Zr, Ni and Cu, respectively [125]. The energy of Zr-H bonds decreases with the addition of Ni and Cu [125].
The mechanism and the kinetics of absorption–desorption are different in crystalline and amorphous alloys. The main difference is the absence of an isothermal plateau in the case of amorphous systems. The characteristic plateau observed for crystalline alloys is the consequence of stoichiometric hydride formation [139]. In the hydride compound phase, the H/M ratio is constant. Because of the absence of long-range periodicity in glassy alloys, the site energy for H-atoms is not constant, but rather characterized by a distribution function [139,140] (Figure 43).
During cyclic absorption–desorption processes, phase separation at the 10-20 nanometer scale is often detected in various systems (Figure 44).
The gradually developed, few nanometer-sized amorphous clusters (micro-phase separation) exhibit local enrichments of components, in which the individual affinity of the components to H can be recognized, as it is detected by selected area electron diffraction (SAD) measurements [138].
The outlined chemically induced local enrichment of specific components in the clusters can be understood only if one accepts the existence of the individual, atomic-level chemical affinity of alloy components to H atoms. This atomic level affinity is maintained in spite of the collective, delocalized metallic electronic structure, being simultaneously responsible for such typical metallic behavior as electric conductivity. According to the Miedema concept [140], H absorption in exothermic (hydride forming) systems leads to preferential contact formation between the exothermic alloying partner (hydride forming components) and the H atoms (Figure 45).
The outlined regrouping of components leads gradually to micro-phase separation. Short-range diffusion of metallic components is also involved in this process, and the co-existing clusters develop during a few absorption–desorption cycles. Such absorption-desorption cycling is shown in Figure 46, in which the time-dependence of the relative resistance change is plotted.
The illustrated atomic coordination change becomes more and more pronounced during the cyclic H absorption. Simultaneously, repulsion between B-H atoms develops, leading to gradual separation of B atoms outside A-H-rich clusters. As the diffusion rate of H atoms is higher than that of the matrix metals by orders of magnitude, the dissolved H causes an irreversible structural rearrangement in the absorber alloy, which is preserved for a long time, even after the desorption process. Such H-induced irreversible reordering may also lead to poisoning of the H-absorber alloy, in which the general mechanism includes a gradually increasing fraction of irreversible A-H contacts (stable hydride formation). This irreversible part of the H absorption process is also reflected in resistance measurements [141,142], as illustrated in Figure 46.

3. Summary

While the absence of long-range periodicity originates from the liquid state, various degrees of atomic ordering are inherited from the cooling process reflecting partially the significance of the cooling rate, as well as some details of equilibrium phase diagrams. Especially the local symmetry or composition of the phases that are stable at high temperatures appears as “phase reminiscence” in various properties of TM (mainly Fe-based)-based glassy alloys.
Other types of clusters are the consequences of H dissolution in TM-based glasses. The local ordering can differ, either in dimension or from the point of view of its origin, but commonly they are considered as clusters. The local atomic ordering in certain cases comprises few tens of atoms only; other clusters extend possibly far beyond the first neighbor atomic distance (few tens of nanometers) and, hence, they can be identified by diffraction methods (electron or neutron diffraction).
In the present article we attempted to summarize indirect cluster manifestations in various physical properties and transformations. It is assumed that an analogy exists between the mechanism and tendency of cluster formation in fragile molecular and metallic glass-forming liquids (in molecular glass formers, the difference between the strength of inter- and intra-molecular forces; in transition metal–metalloid melts, the co-existence of metal–metalloid metal–metal bonds are the basis of cluster separation). Hence, the background of cluster formation is the co-existence of different bonds (covalent and metallic) between the constituent atoms. As a consequence, locally different, temperature-dependent atomic mobility, coupled with concentration fluctuations, develops during supercooling. These non-equilibrium atom contacts act as local obstacles of atomic displacements. Hence, they contribute to a slow-down of diffusion, so that the formation of crystalline nuclei is hindered.
Two types of clusters gradually develop in transition metal-metalloid melts at around 2/3 of the melting point during supercooling: (i) compound-like clusters, in which the local composition resembles metastable intermetallic compounds (typically Fe3B in binary Fe-B melts) representing “long-lived” structures, which freeze to a skeleton around Tg. (ii) In the remaining part of the liquid (typically a rather small volume fraction compared with the rigid skeleton), the atomic mobility is still preserved allowing short-range rearrangements. The driving force of such relaxations is the competition between fcc-bcc environments.
Several anomalies in physical properties were explained by assuming the outlined cluster structure in Fe(Ni)-based glasses:
-
An extraordinary concentration dependence of TCam and μFe in binary Fe-B glasses: in contrast to the expected increase of TCam and μFe with decreasing metalloid content, an opposite tendency is observed in binary Fe-B glasses, which hints to an increasing fraction of quenched-in fcc environments in the as-quenched samples. This is the consequence of a local decrease of interatomic distances between Fe-Fe atoms, which can be inferred from the Bethe–Slater correlation. As a consequence, TCam increases during the first period of structural relaxation due to the fcc → bcc rearrangements on a short-range order scale. When Fe is partially replaced by Ni (5 at.%) in hypo-eutectic FeB, this tendency is modified by the magnetic moment of the Ni atoms.
-
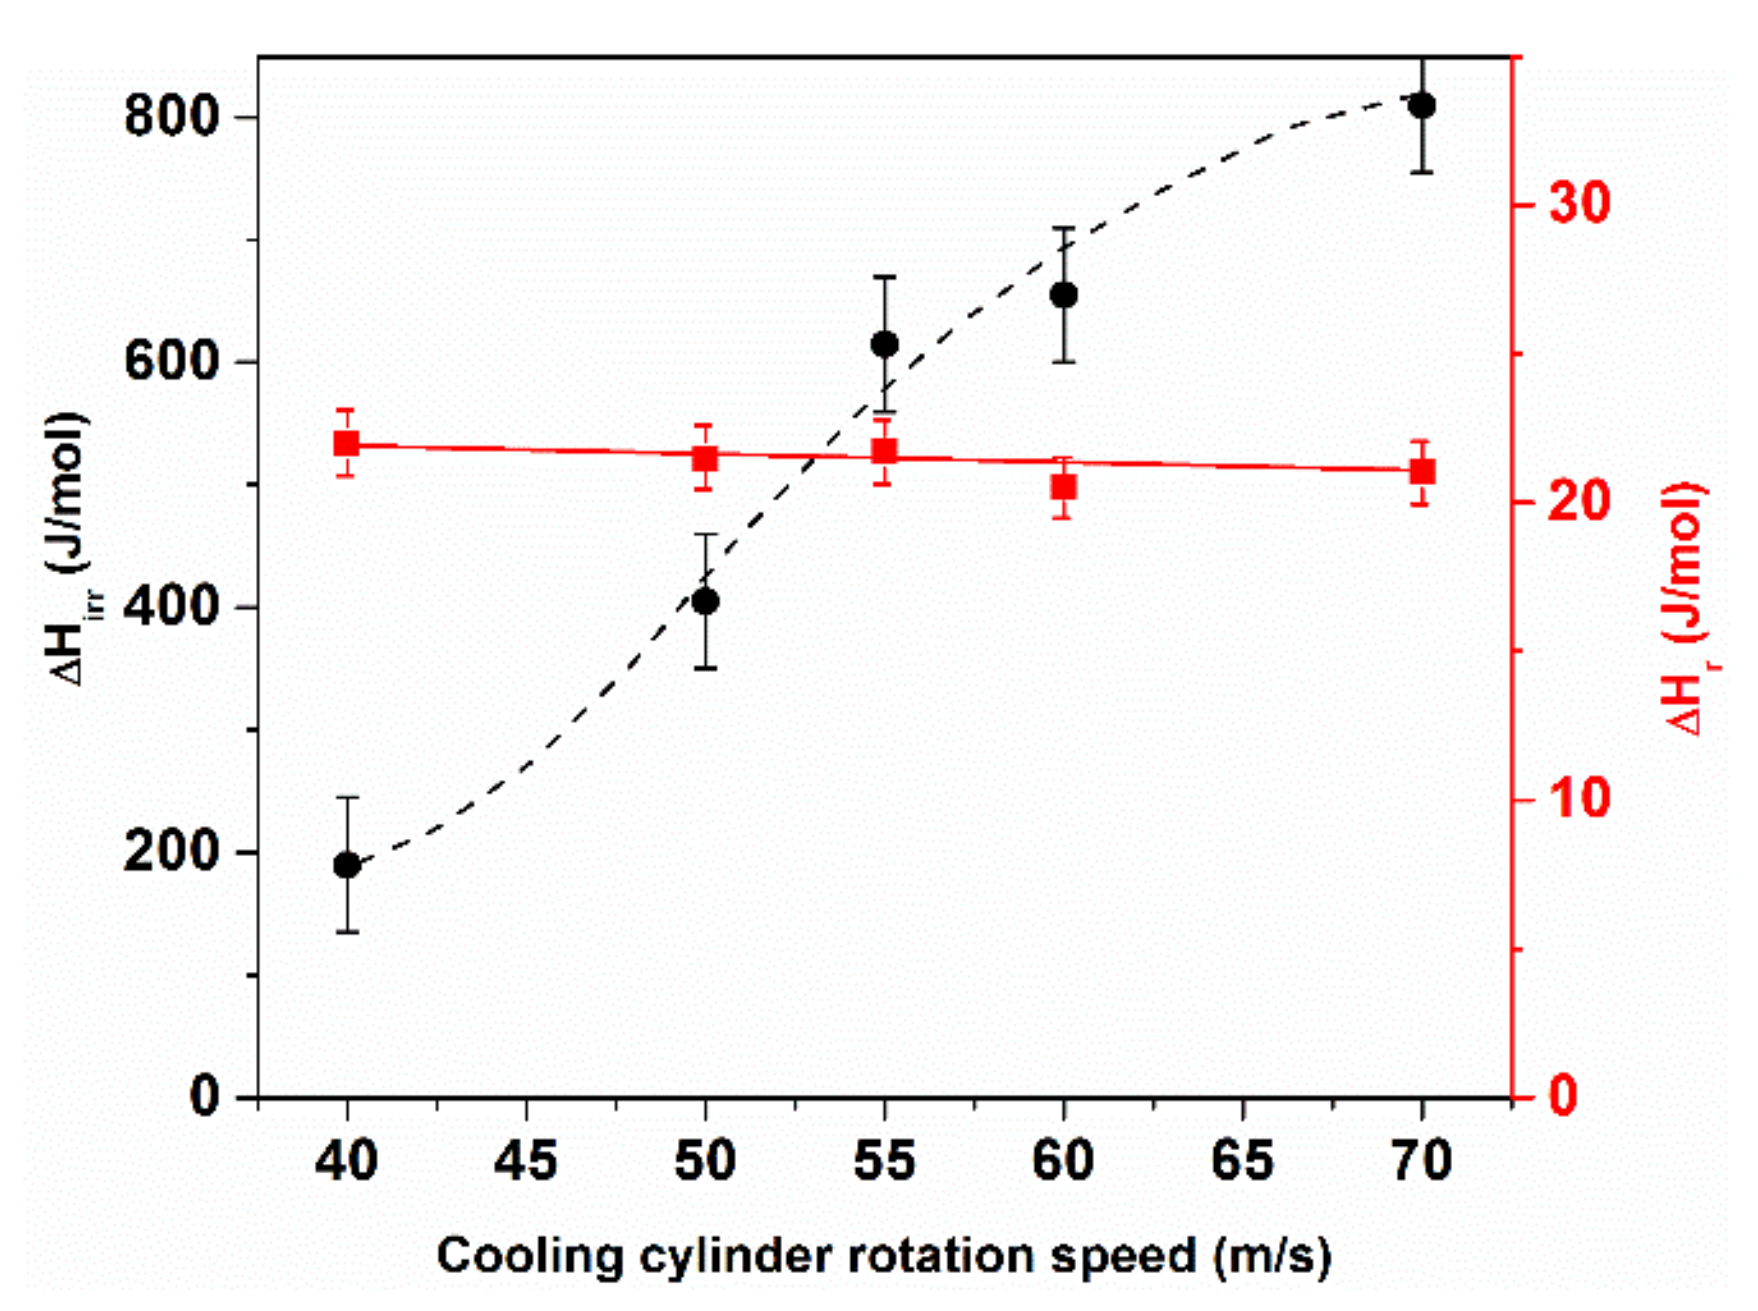
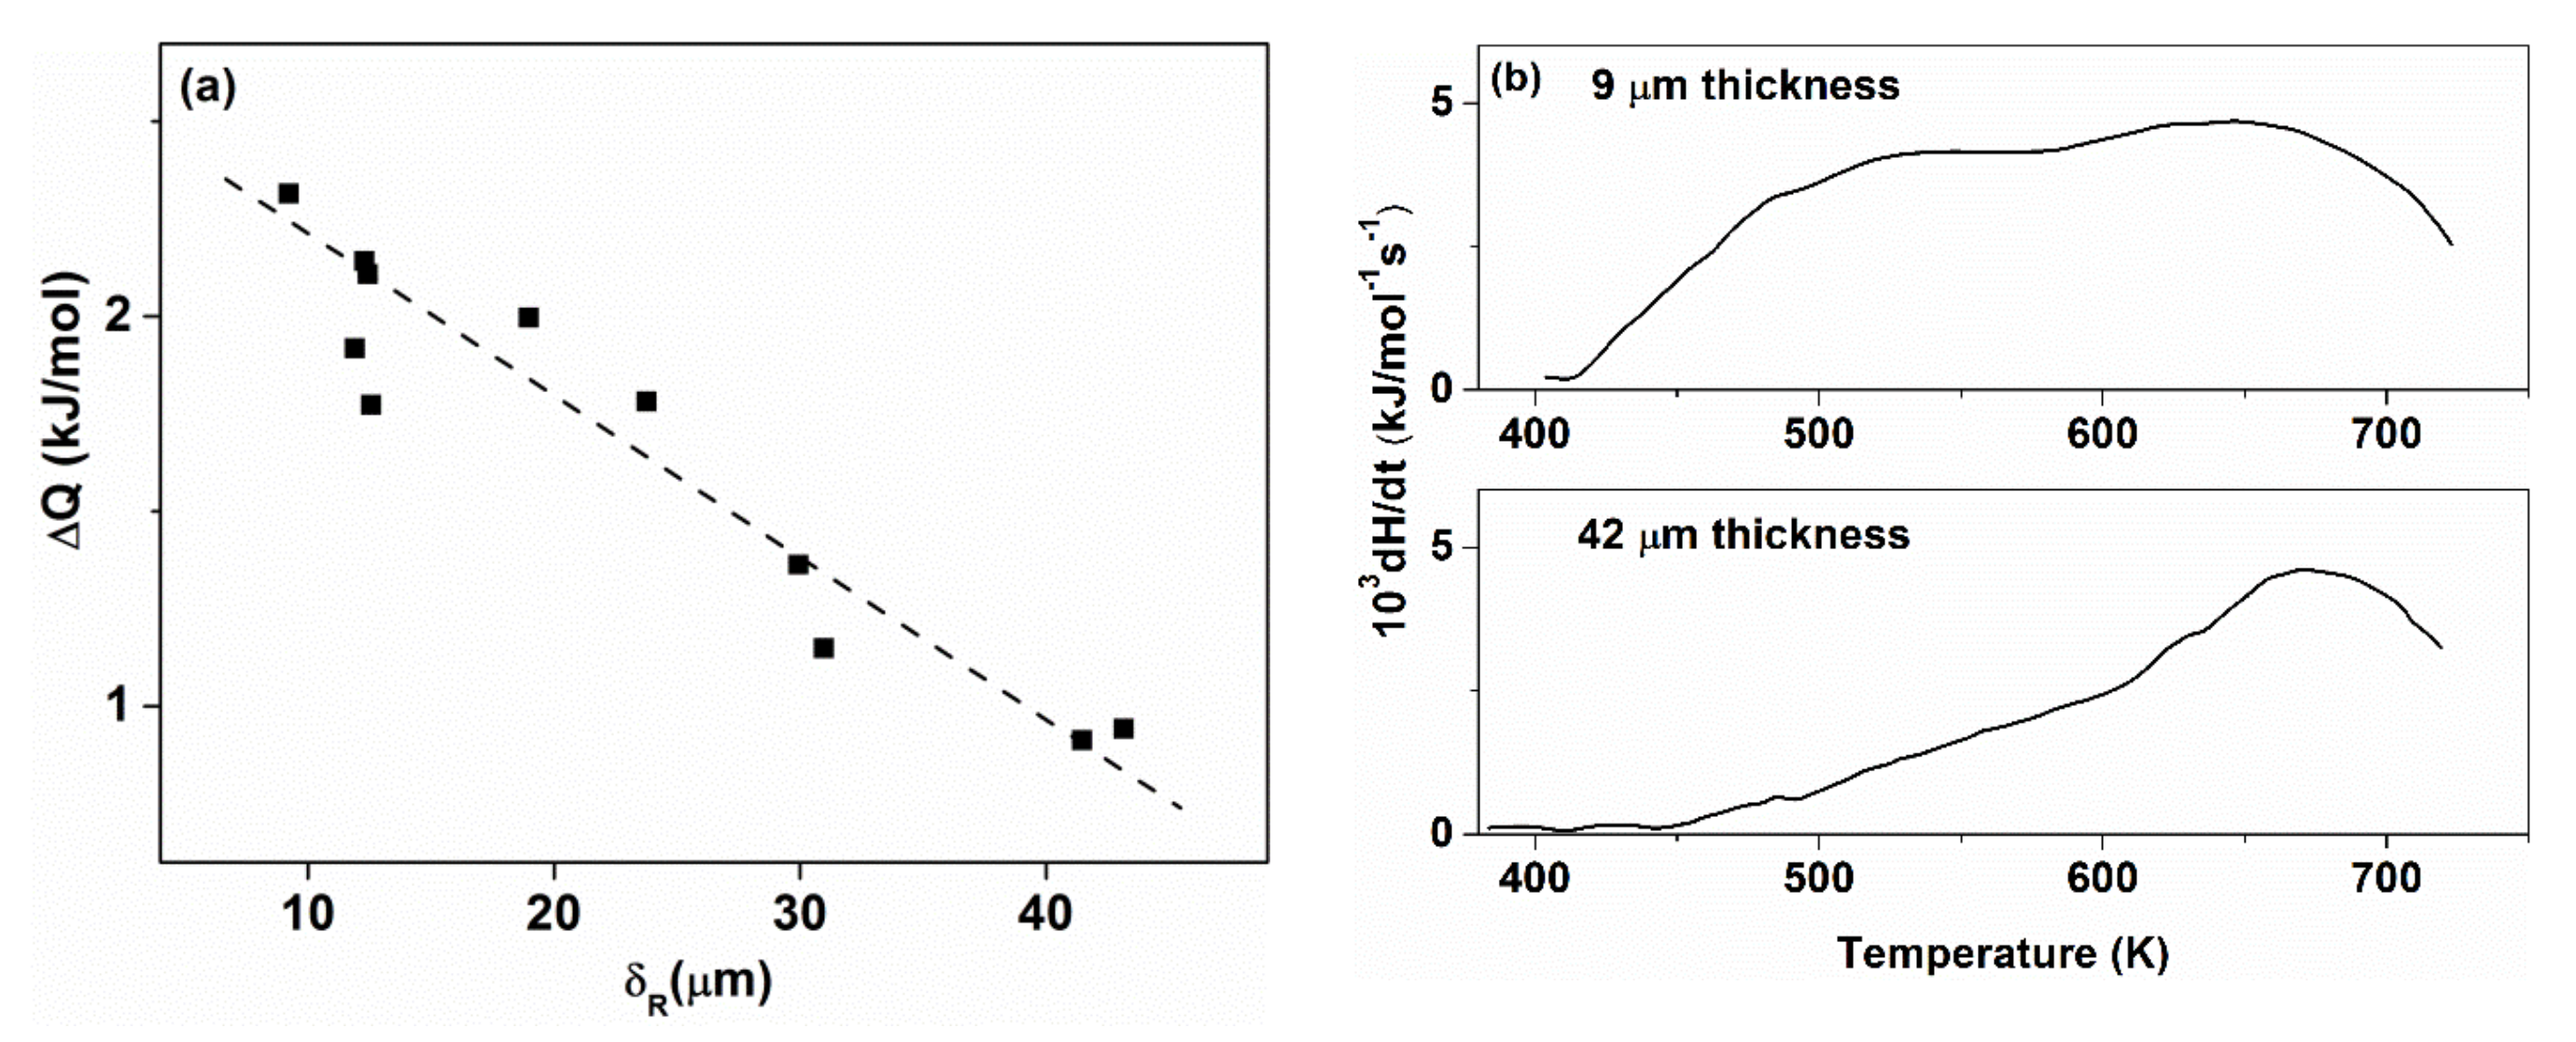
The quenched-in fcc-like environments (γ-reminiscence) give a significant contribution to the relaxation and crystallization enthalpy (ΔHcryst). An increasing contribution to the total crystallization enthalpy (ΔHcryst) can be detected in the hypo-eutectic concentration range of Fe-B glasses, which is supported by the quenching-rate dependence of the irreversible heat of relaxation and the crystallization enthalpy (ΔHcryst).
-
The tendency of γ (fcc) entrapment is even more pronounced for TCam, and the enthalpy relaxation of various Fe(Ni)-based glasses (quenching-rate dependence of TCam) indicates that less-relaxed structures contain an increasing number of fcc-like clusters with decreasing strength of the net ferromagnetic coupling in the as-quenched state.
-
Other well-known relaxation types are a reversible TCam shift (inverse relation between the temperature of TCam in FeNi-based systems) and the role of cryogenic treatment on the direction of the TCam shift. These observations were successfully explained assuming the co-existence of fcc and bcc cluster types in Fe(Ni)- based glasses.
-
Low temperature treatments at 77 K result in stable structural features in the samples, which can be explained by a non-diffusive mechanism, similar as is it well known for residual austenite formation in steel metallurgy. It can be regarded as completion of glass transition, whereby additional fcc clusters are formed via non-diffusive, stress-induced, cluster-level transformations, in which cooperative atomic displacements are involved.
-
The significance of cluster phenomena is proposed in the mechanism of the initial (nucleation) stage of the amorphous-nanocrystalline transformation in FINEMET-type precursors. It is demonstrated that not solely nanocrystalline grain dimensions but also the special nucleation process plays a significant role in the development of magnetic ultrasoftness in this alloy. Eutectoid decomposition (annihilation) of γ (fcc-like) clusters leads to α-Fe (nanograin) nucleation. The separation of Cu atoms outside the α-Fe grains is the consequence of the insolubility of Cu atoms in the bcc α-Fe nuclei.
-
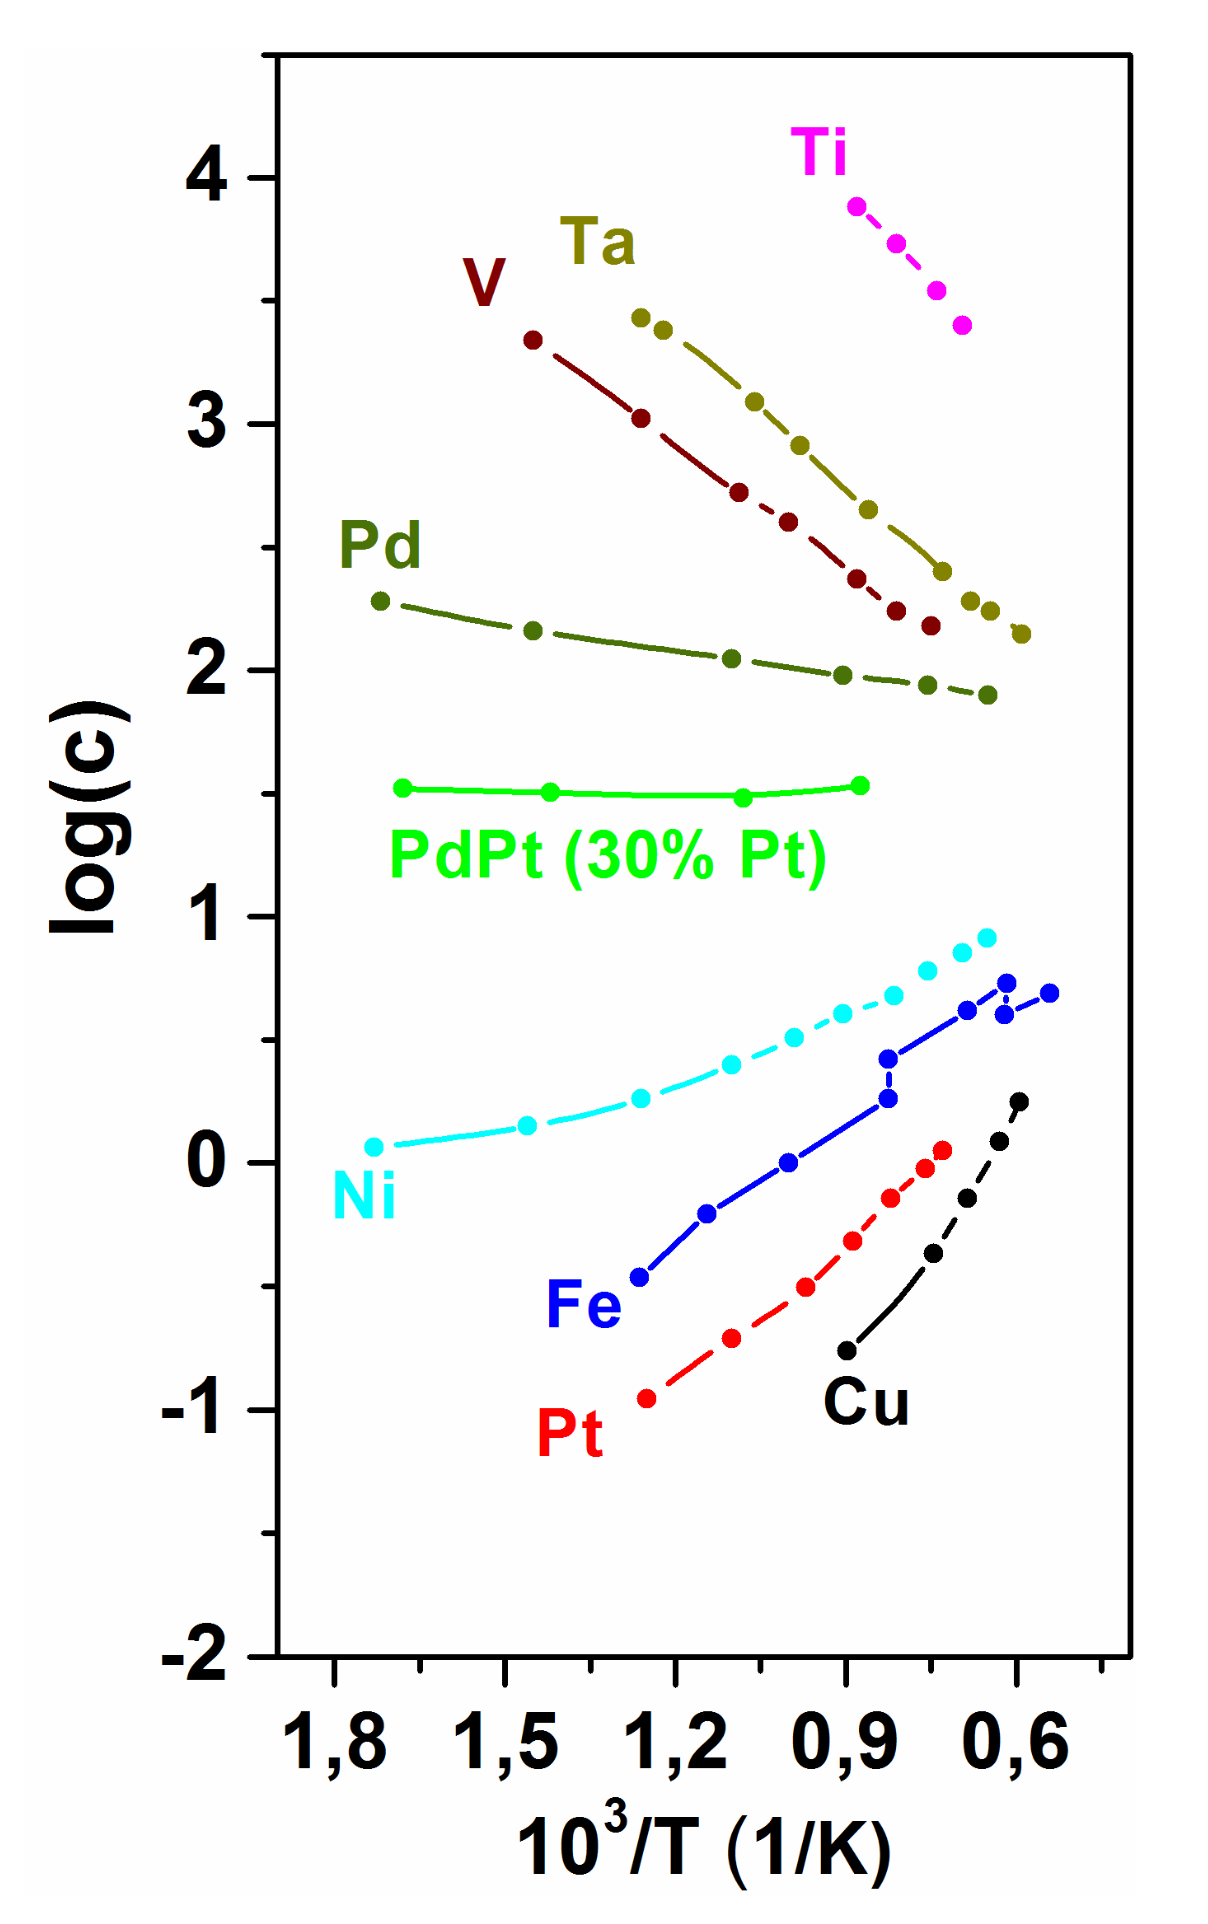
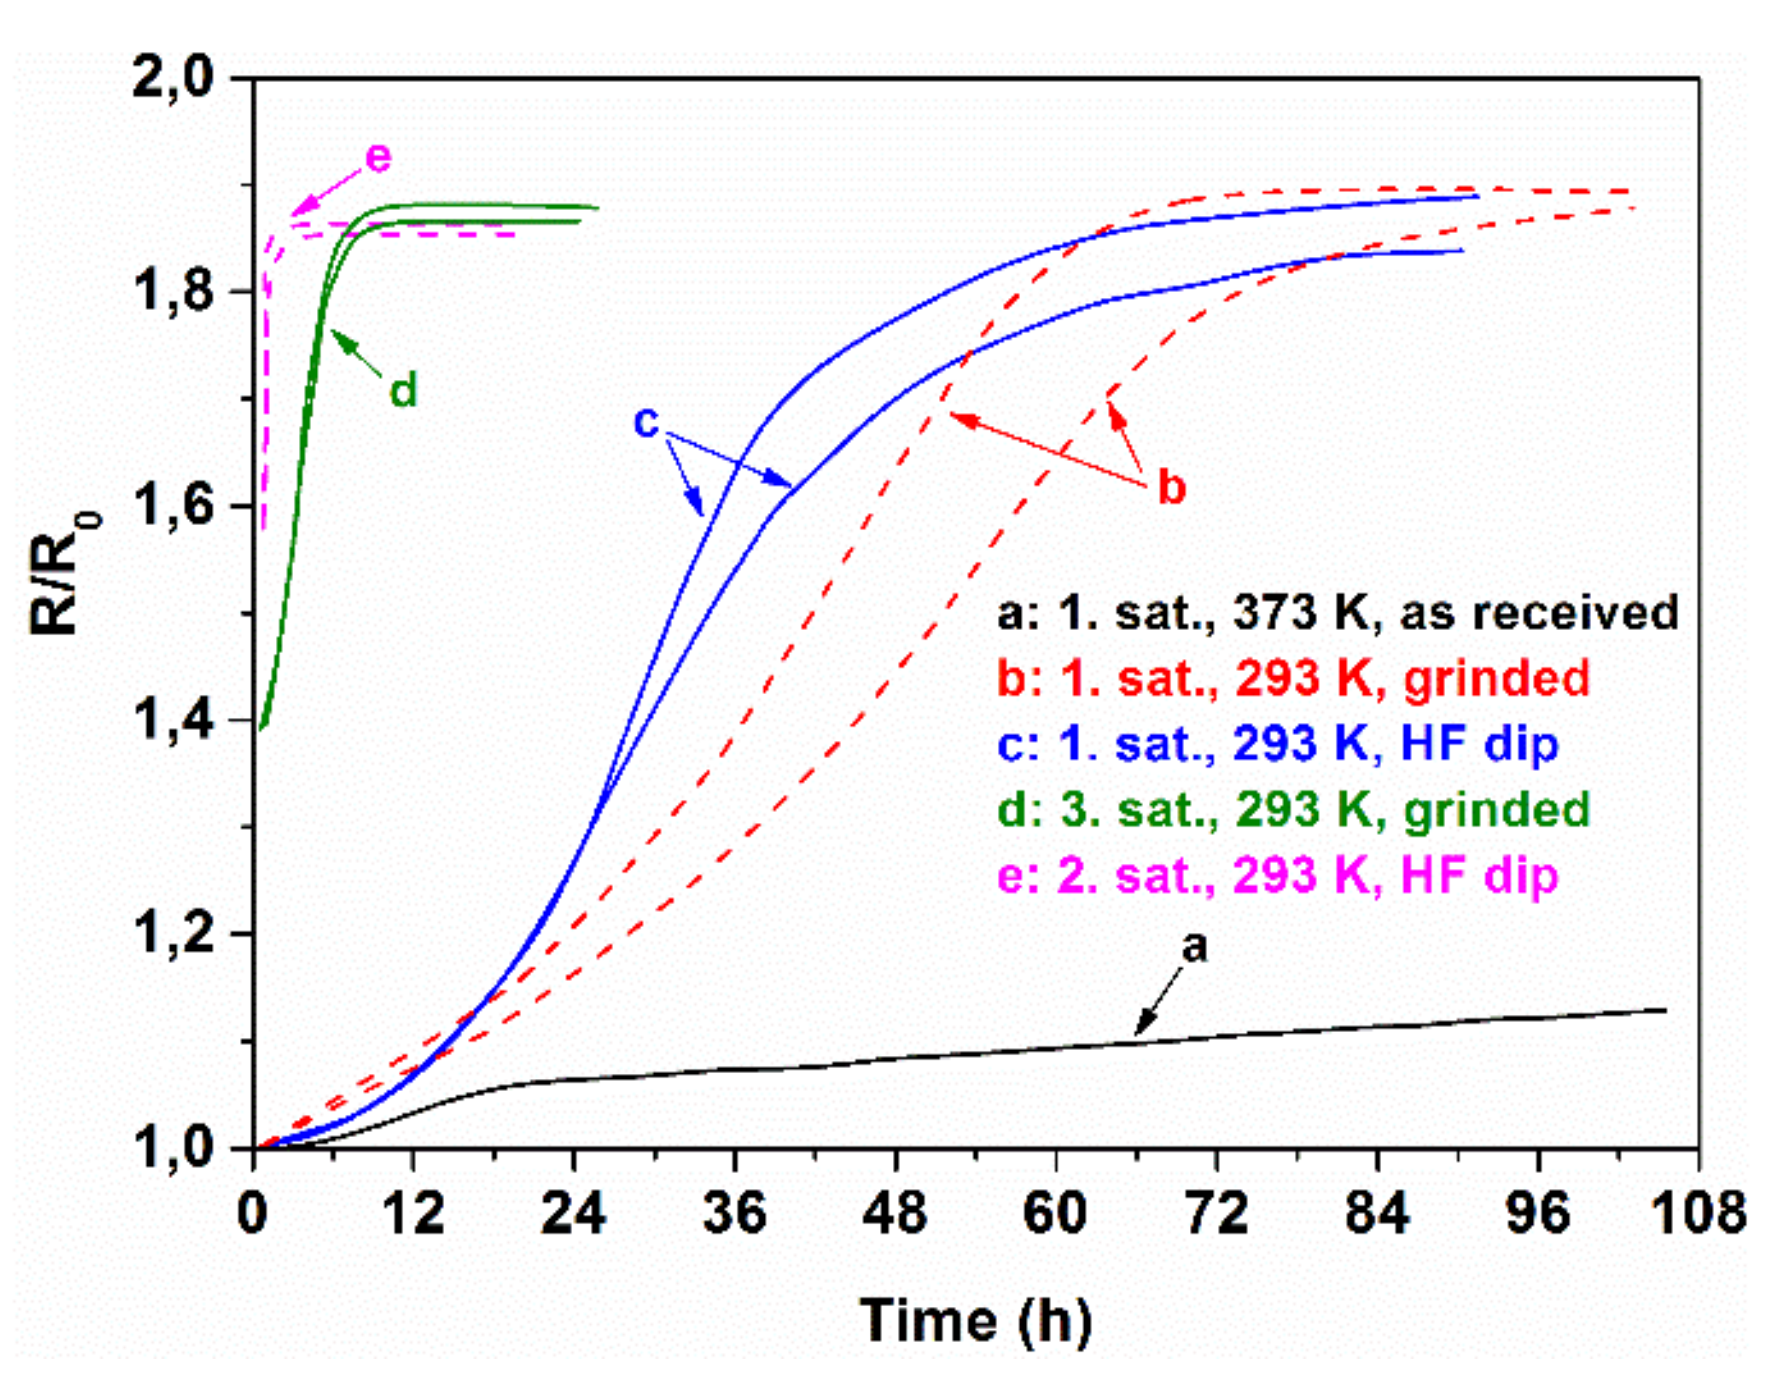
The interaction between the glassy matrix and dissolved hydrogen has been studied during absorption–desorption cycles. The H-induced cluster formation tendency depends on the thermodynamic driving force for H dissolution. Like several chemical properties of metallic glasses, the ability of hydrogen absorption is also inherited from the metallic host. As a result, the solubility of hydrogen is strongly restricted in endothermic types of dissolution reactions. In spite of this, indirect effects (the change in physical properties) can be large, arising mainly from the resulting change in the stress level. Consequently, stress-sensitive properties like coercivity (Hc), permeability (μr) saturation magnetostriction (λs) or the anisotropy (K) change significantly during H charging or discharging. This effect is mostly restricted to the residence time of H atoms in the glassy matrix, i.e., the property changes are reversible. The presence of fcc-type clusters contributes to the activity of hydrogen. When these clusters are eliminated by heat treatment, the properties will be insensitive to H dissolution, i.e., the preferential H trapping sites in the as-quenched Fe-based glasses are coupled with the quenched-in fcc clusters.
-
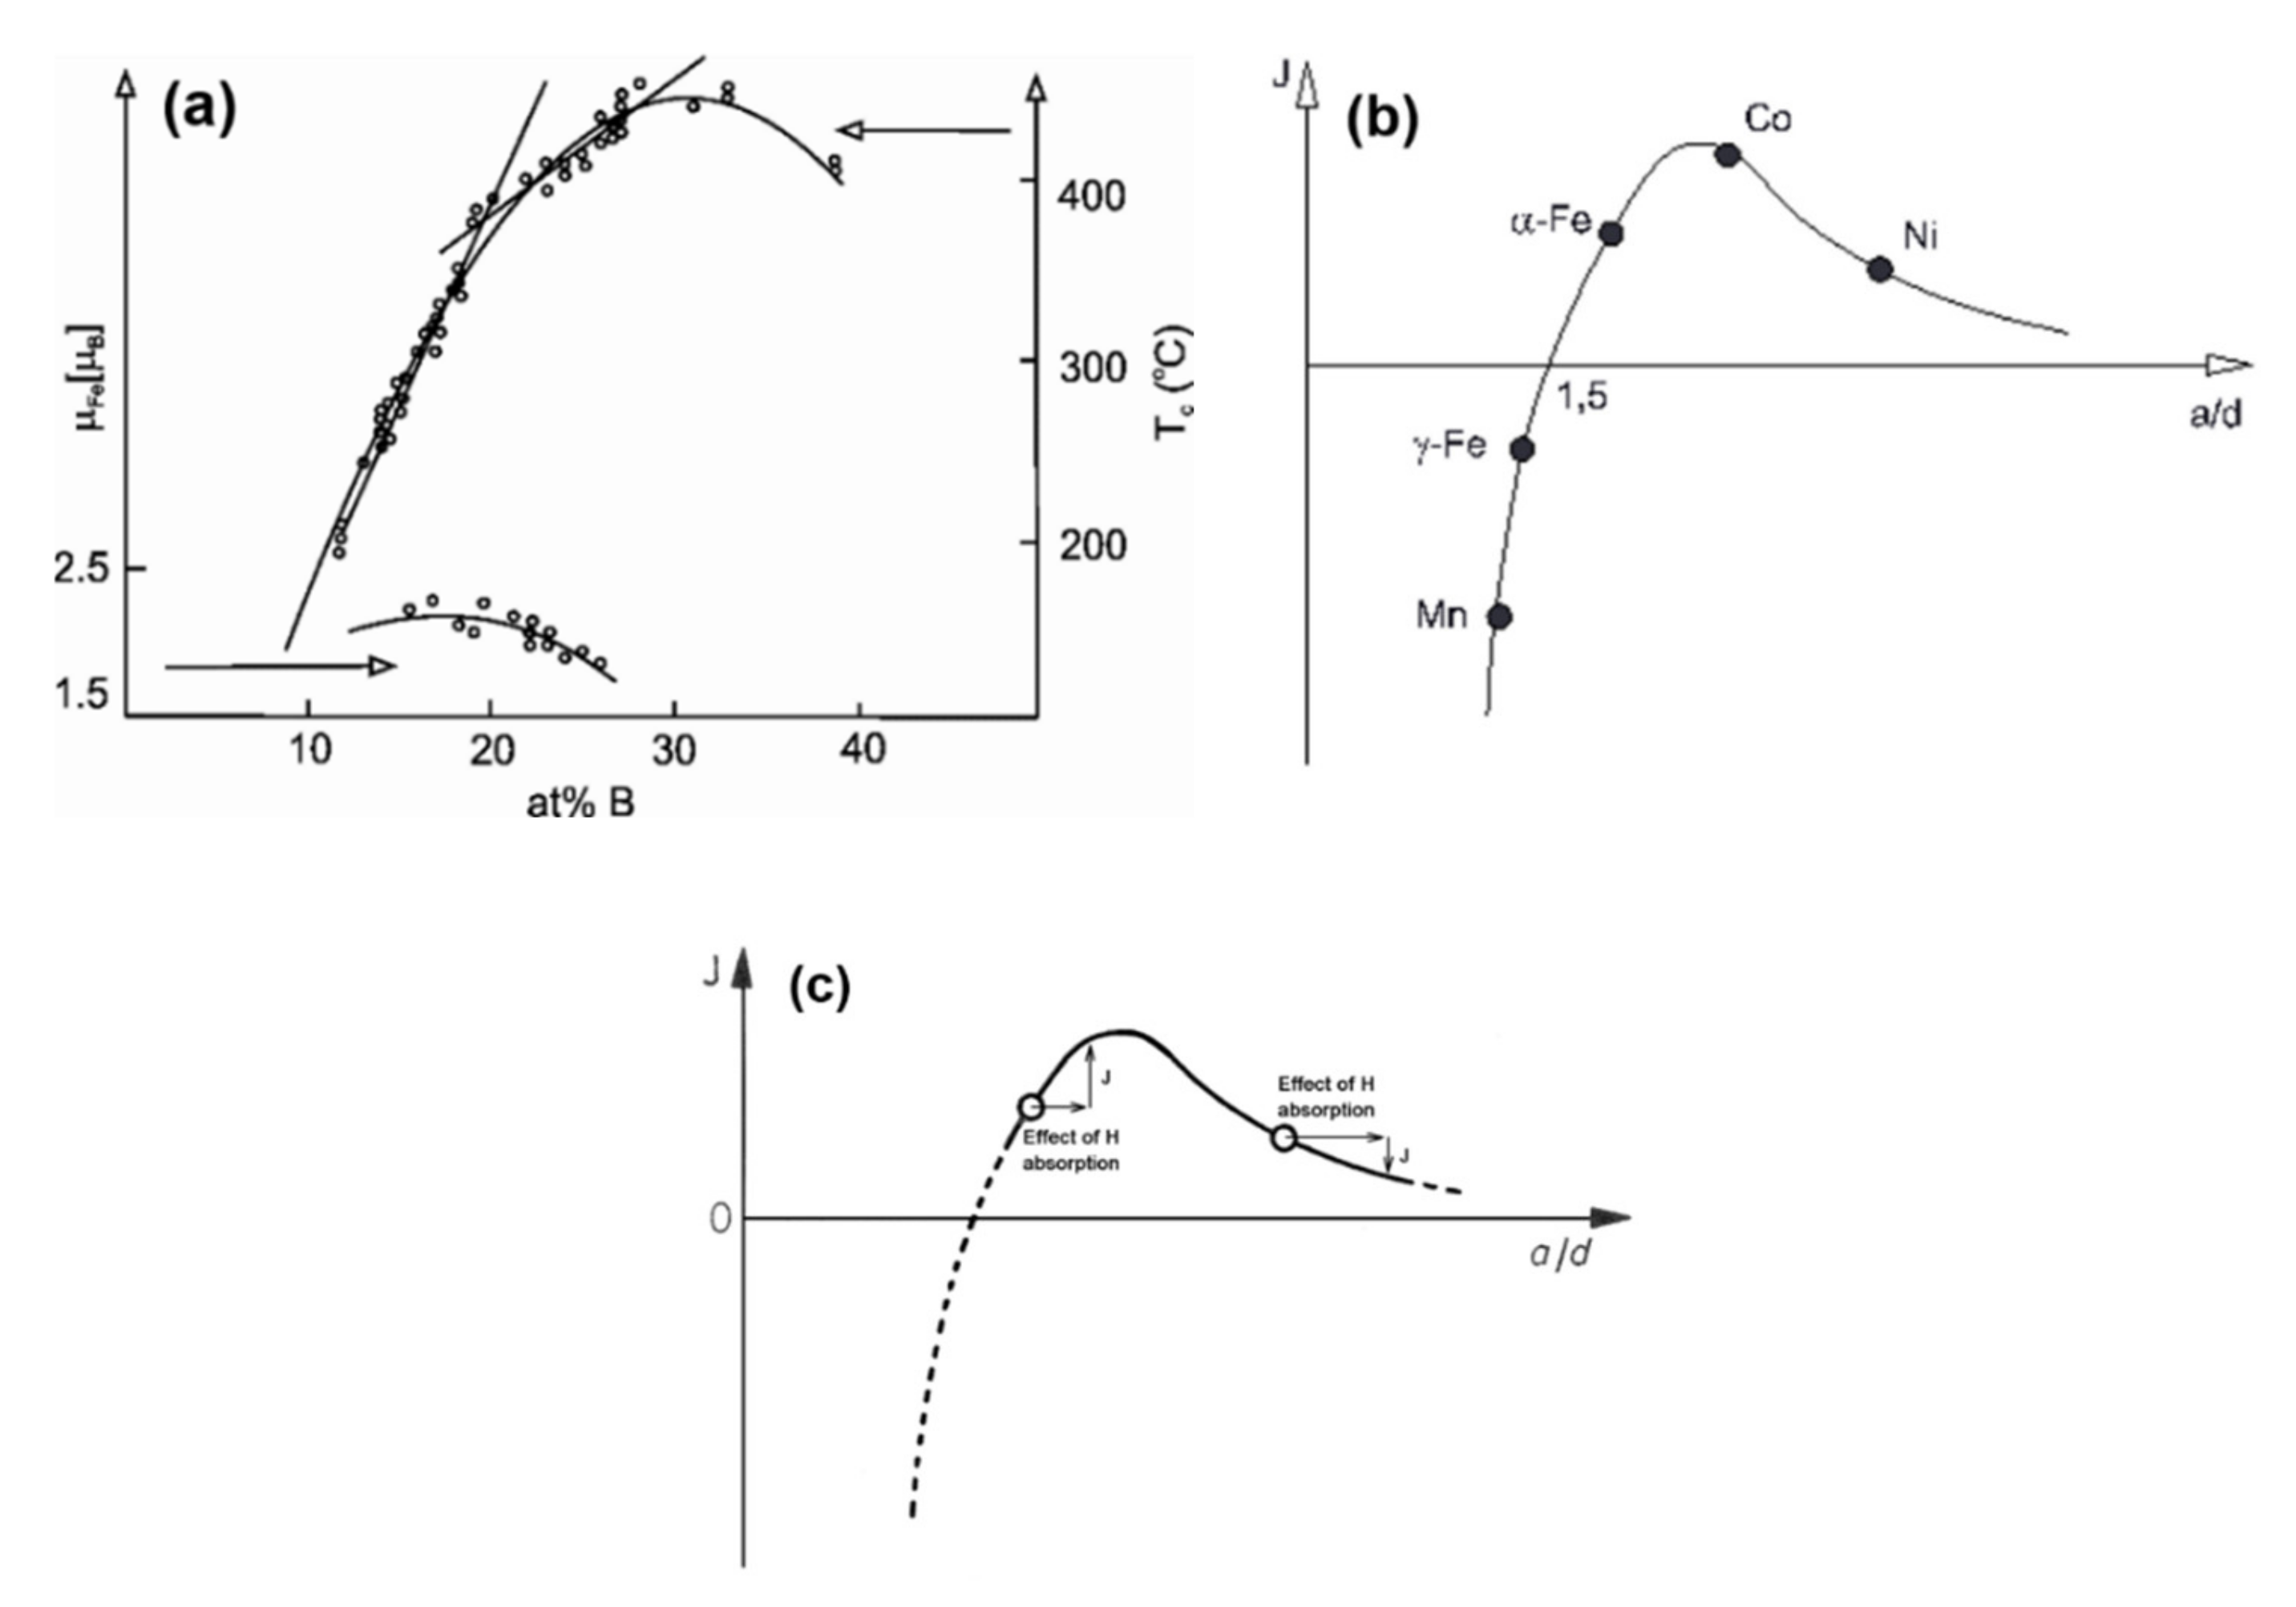
We revealed the role of absorbed H atoms on the sign of ΔTCam in Fe-based glasses. The interpretation of the results is based on the Bethe–Slater concept, which was originally developed for understanding the correlation between atomic distances and the strength, as well as the sign of exchange interaction in 3d transition metals.
-
H-induced micro-phase separation as a sterically extended form of cluster formation has been detected in several metallic glasses, which consist of metallic components exhibiting exothermic and endothermic dissolution enthalpies during H dissolution. In such (ternary) alloys, repeated absorption–desorption cycles result in micro-phase separation in the amorphous state, whereby local concentration fluctuations of the components develop as a consequence of the relative hydride phase stability of the individual components (described by the hydride phase Ellingham diagram) in the crystalline phases.
-
In-situ resistivity measurements show that such phase separations are irreversible, which also suggests that this atomic mechanism may be related to poisoning and deterioration of the H storage capacity of these alloys. The same process is considered to be responsible for the volume activation in several H storage absorber alloys.

Author Contributions

Conceptualization, A.L. and L.N.; methodology, A.L.; formal analysis, A.S.; investigation, A.S. and J.K.; resources, J.K. and L.N.; data curation, J.K.; writing—original draft preparation, A.L. and A.S.; writing—review and editing, P.R. and J.E.; supervision, A.L.; project administration, L.N.; funding acquisition, J.E. and L.N. All authors have read and agreed to the published version of the manuscript.

Funding

We thank Maria Kovalakova from the Department of Physics, Technical University of Košice, for useful discussions. The research presented in this paper was carried out as part of the EFOP-3.6.2-16-2017-00016 and EFOP-3.6.1-16-2016-00003 project in the framework of the New Széchenyi Plan. The completion of this project is funded by the European Union and co-financed by the European Social Fund. J.K. and L.N. gratefully acknowledge the support through VEGA projects of the Ministry of Education of the Slovak Republic Nos. 1/0413/15 and 1/0861/12. P.R. and J.E. gratefully acknowledge additional support through the European Research Council under the Advanced Grant “INTELHYB—Next Generation of Complex Metallic Materials in Intelligent Hybrid Structures” (Grant ERC-2013-ADG-340025). J.E. gratefully acknowledges the financial support of the Ministry of Science and Higher Education of the Russian Federation in the framework of Increase Competitiveness Program of NUST «MISiS» (No. K2-2020-020)”.

Conflicts of Interest

The authors declare no conflict of interest.

References

  1. Andres, R.; Averback, R.S.; Brown, W.; Brus, L.; Goddard, W.; Kaldor, A.; Louie, S.; Moscovits, M.; Peercy, P.; Riley, S. Research opportunities on clusters and cluster-assembled materials-A Department of Energy, Council on Materials Science Panel Report. J. Mater. Res. 1989, 4, 704–736. [Google Scholar] [CrossRef]
  2. Siegel, R.W. Cluster Assembly of Nanophase Materials. In Materials Science and Technology; Cahn, R.W., Haasen, P., Kramer, E.J., Eds.; VCH Verlag GmbH: Weinheim, Germany, 1991; pp. 585–627. [Google Scholar]
  3. Gleiter, H. Nanostructured materials: Basic concepts and microstructure. Acta Mater. 2000, 48, 1–29. [Google Scholar] [CrossRef] [Green Version]
  4. Siegel, R.W. Nanostructured materials -mind over matter. Nanostruct. Mater. 1993, 3, 1–18. [Google Scholar] [CrossRef]
  5. Kappes, M.M.; Schumacher, E.J. Metal Clusters: Between the Individual and Collectivity. Z. Phys. Chem. 1988, 156, 23–40. [Google Scholar] [CrossRef]
  6. Goldstein, A.; Echer, C.; Alivisatos, A. Melting in Semiconductor Nanocrystals. Science 1992, 256, 1425–1427. [Google Scholar] [CrossRef]
  7. Gates, B.C.; Guczi, L.; Knözinger, H. Metal Clusters in Catalysis; Elsevier Science Publisher: Amsterdam, The Netherlands, 1986. [Google Scholar]
  8. Veprek, S.; Jilek, M. Super- and ultrahard nanacomposite coatings: Generic concept for their preparation, properties and industrial applications. Vacuum 2002, 67, 443–449. [Google Scholar] [CrossRef]
  9. Siegel, R.W.; Eastman, J.A. Synthesis, Characterization, and Properties of Nanophase Ceramics. In Material Research Society Symposia Proceedings; McCandlish, L.E., Polk, D.E., Siegel, R.W., Kear, B.H., Eds.; Cambridge University Press: San Diego, CA, USA, 1989; pp. 3–14. [Google Scholar]
  10. Turnbull, D. Metastable structures in metallurgy. Metall. Trans. B 1981, 12, 217–230. [Google Scholar] [CrossRef]
  11. Kauzmann, W. The Nature of the Glassy State and the Behavior of Liquids at Low Temperatures. Chem. Rev. 1948, 43, 219–256. [Google Scholar] [CrossRef]
  12. Bakai, A.S. The polycluster concept of amorphous solids. In Glassy Metals III: Amorphization Techniques, Catalysis, Electronic and Ionic Structure; Beck, H.G.H.J., Ed.; Springer: Berlin/Heidelberg, Germany, 1994; pp. 209–255. [Google Scholar]
  13. Noskova, N.I.; Vildanova, N.F.; Potapov, A.P.; Glazer, A.A. The structure and properties of Fe-Co-Si-B and Fe-Si-B amorphous alloys. In Proceedings of the 12th European Crystallographic Meeting, Sverdlovsk, Russia, 20–29 August 1989; pp. 301–309. [Google Scholar]
  14. Hirotsu, Y.; Uehara, M.; Ueno, M. Microcrystalline domains in amorphous Pd77.5Cu6Si16.5 alloys studied by high-resolution electron microscopy. J. Appl. Phys. 1986, 59, 3081–3086. [Google Scholar] [CrossRef]
  15. Gaskell, P.H. High resolution electron microscopy of amorphous alloys. In Proceedings of the 4th International Conference on Rapidly Quenched Metals, Sendai, Japan, 24–28 August 1981; Gakkai, N.K., Ed.; Japan Institute of Metals: Sendai, Japan, 1981; pp. 439–442. [Google Scholar]
  16. Piller, J.; Haasen, P. Atom probe field ion microscopy of a FeNiB glass. Acta Metall. 1982, 30, 1–8. [Google Scholar] [CrossRef]
  17. Greer, A.L. Thermodynamics of undercooled liquids. J. Less Common Met. 1988, 145, 131–144. [Google Scholar] [CrossRef]
  18. Battezzati, L.; Garrone, E. On the approximation of the free energy of undercooled glass-forming metallic melts. Z. Metallkd. 1984, 75, 305–310. [Google Scholar]
  19. Dubey, K.; Ramachandrarao, P. On the free energy change accompanying crystallisation of undercooled melts. Acta Metall. 1984, 32, 91–96. [Google Scholar] [CrossRef]
  20. Jones, D.; Chadwick, G. The experimental determination of the kinetics of solid-liquid interfaces in transparent materials using temperature-gradient zone migration. Philos. Mag. A 1971, 24, 1327–1345. [Google Scholar] [CrossRef]
  21. Angell, C.A.; Ngai, K.L.; McKenna, G.B.; McMillan, P.F.; Martin, S.W. Relaxation in glassforming liquids and amorphous solids. J. Appl. Phys. 2000, 88, 3113–3157. [Google Scholar] [CrossRef] [Green Version]
  22. Luborsky, F.E. Applications-oriented magnetic properties. In Amorphous Metallic Alloys; Luborsky, F.E., Ed.; Butterworth-Heinemann: London, UK, 1983; pp. 360–380. [Google Scholar]
  23. Krebs, H. Electrical conductivity and chemical bonding in crystalline, glassy and liquid phases. J. Non-Cryst. Solids 1969, 1, 455–473. [Google Scholar] [CrossRef]
  24. Zielinski, P.G.; Matyja, H. Influence of liquid structure on glass forming tendency. In Proceedings of the 2nd International Conference on Rapidly Quenched Metals, Cambridge, MA, USA, 17–19 November 1975; Grant, N.J., Giessen, B.C., Eds.; Massachusetts Institute of Technology: Cambridge, MA, USA, 1975; pp. 237–248. [Google Scholar]
  25. Sommer, F. Association model for the description of the thermodynamic functions of liquid alloys. I.-Basic concepts. Z. Metallkd. 1982, 73, 72–76. [Google Scholar]
  26. Inoue, A. Bulk amorphous alloys. In Non-Equilibrium Processing of Materials; Suryanarayana, C., Ed.; Pergamon Materials: New York, NY, USA, 1999; pp. 375–415. [Google Scholar]
  27. Predel, B. Thermodynamic Stability of Amorphous Alloys. Key Eng. Mater. 1990, 40, 17–38. [Google Scholar] [CrossRef]
  28. Finney, J. Random packings and the structure of simple liquids. I. The geometry of random close packing. Proc. R. Soc. A Math. Phys. Sci. 1970, 319, 479–493. [Google Scholar]
  29. Pauling, L. The Nature of the Chemical Bond; Cornell University Press Ithaca: New York, NY, USA, 1960. [Google Scholar]
  30. Miedema, A.R.; De Boer, F.R.; De Chatel, P.F. Empirical description of the role of electronegativity in alloy formation. J. Phys. F Met. Phys. 1973, 3, 1558–1576. [Google Scholar] [CrossRef]
  31. Hermann, H.; Mattern, N.; Matz, W. Magnetic and structural properties of rapidly quenched iron–boron metallic glasses. Phys. Stat. Sol. B 1987, 140, 581–588. [Google Scholar] [CrossRef]
  32. Dubois, J.-M. Topological instability of metallic lattices and glass formation. J. Less Common Met. 1988, 145, 309–326. [Google Scholar] [CrossRef]
  33. Frank, F.C. Supercooling of liquids. Proc. R. Soc. A Math. Phys. Sci. 1952, 215, 43–46. [Google Scholar]
  34. Angell, C.A. Structural instability and relaxation in liquid and glassy phases near the fragile liquid limit. J. Non-Cryst. Solids 1988, 102, 205–221. [Google Scholar] [CrossRef]
  35. Kholodenko, A.L.; Douglas, J.F. Generalized Stokes-Einstein equation for spherical particle suspensions. Phys. Rev. E 1995, 51, 1081. [Google Scholar] [CrossRef]
  36. DeBenedetti, P.G.; Stillinger, F.H. Supercooled liquids and the glass transition. Nature 2001, 410, 259. [Google Scholar] [CrossRef]
  37. Debenedetti, P.G. Metastable Liquids: Concepts and Principles; Princeton University Press: Princeton, NJ, USA, 1996. [Google Scholar]
  38. Köster, U.; Janlewing, R. Fragility parameter and nanocrystallization of metallic glasses. Mater. Sci. Eng. A 2004, 375, 223–226. [Google Scholar] [CrossRef]
  39. Johari, G.P. Intrinsic mobility of molecular glasses. J. Chem. Phys. 1973, 58, 1766–1770. [Google Scholar] [CrossRef]
  40. Ediger, M.D. Spatially heterogeneous dynamics in supercooled liquids. Annu. Rev. Phys. Chem. 2000, 51, 99–128. [Google Scholar] [CrossRef] [Green Version]
  41. Popel, P.; Sidorov, V. Microheterogeneity of liquid metallic solutions and its influence on the structure and properties of rapidly quenched alloys. Mater. Sci. Eng. A 1997, 226, 237–244. [Google Scholar] [CrossRef]
  42. Mel’Cuk, A.I.; Ramos, R.A.; Gould, H.; Klein, W.; Mountain, R.D. Long-Lived Structures in Fragile Glass-Forming Liquids. Phys. Rev. Lett. 1995, 75, 2522–2525. [Google Scholar] [CrossRef]
  43. Casalini, R.; Ngai, K.L. Structural dependence of fast relaxation in glass-forming substances and correlation with the stretch exponent of the slow structural α-relaxation. J. Non-Cryst. Solids 2001, 293, 318–326. [Google Scholar] [CrossRef]
  44. Teoh, W.; Teoh, N.; Arajs, S. Electrical Resistivity and Crystallization of Amorphous Metglas 2826 and Metglas 2826A. In Amorphous Magnetism II; Levy, R.A., Hasegawa, R., Eds.; Springer: Boston, MA, USA, 1977; pp. 327–333. [Google Scholar]
  45. Rao, K.V. Electrical transport properties. In Amorphous Metallic Alloys; Luborsky, F.E., Ed.; Butterworth-Heinemann: London, UK, 1983; pp. 401–431. [Google Scholar]
  46. Mizutani, U. Electronic structure and electron transport properties of liquid metals, amorphous metals and quasicrystals. In Introduction to the Electron Theory of Metals; Cambridge University Press: Cambridge, UK, 2001; pp. 451–515. [Google Scholar]
  47. Vincze, I.; Boudreaux, D.; Tegze, M. Short-range order in Fe-B metallic glass alloys. Phys. Rev. B 1979, 19, 4896–4900. [Google Scholar] [CrossRef]
  48. Gaskell, P.H. Similarities and differences between dense-random-packed, stereochemically defined and polytetrahedral models for amorphous alloys. In Proceedings of the 4th International Conference on Rapidly Quenched Metals, Sendai, Japan, 24–28 August 1981; Japan Institute of Metals: Sendai, Japan, 1981; pp. 247–252. [Google Scholar]
  49. Dimitrov, V. Theory of fluidity of liquids, glass transition, and melting. J. Non-Cryst. Solids 2006, 352, 216–231. [Google Scholar] [CrossRef]
  50. Lovas, A.; Kiss, L.; Sommer, F. Hardness and thermal stability of Fe-Cr-metalloid glasses. J. Non-Cryst. Solids 1995, 192, 608–611. [Google Scholar] [CrossRef]
  51. Kemény, T.; Vincze, I.; Fogarassy, B.; Arajs, S. Structure and crystallization of Fe-B metallic glasses. Phys. Rev. B 1979, 20, 476–488. [Google Scholar] [CrossRef]
  52. Totten, G.E.; Colas, R. Encyclopedia of Iron, Steel, and Their Alloys; CRC Press: London, UK, 2016. [Google Scholar]
  53. Potocky, L.; Novak, L.; Kisdi, K.E.; Lovas, A.; Takacs, J. Temperature dependence of the coercive force of amorphous Fe-B alloys. Acta Phys. Slov. 1979, 29, 281–287. [Google Scholar]
  54. Lovas, A.; Kisdi-Koszo, E.; Potocký, L.; Novak, L. Effect of processing conditions on physical properties of transition metal-metalloid metallic glasses. J. Mater. Sci. 1987, 22, 1535–1546. [Google Scholar] [CrossRef]
  55. O’Handley, R.C. Fundamental magnetic properties. In Amorphous Metallic Alloys; Luborsky, F.E., Ed.; Butterworth-Heinemann: London, UK, 1983; pp. 257–282. [Google Scholar]
  56. Leslie, W.C.; Hornbogen, E. Physical metallurgy of steels. In Physical Metallurgy, 4th ed.; Cahn, R.W., Haasen, P., Eds.; North-Holland: Oxford, UK, 1996; pp. 1555–1620. [Google Scholar]
  57. Kokosza, A.; Pacyna, J. Effect of retained austenite on the fracture toughness of tempered tool steel. Arch. Mater. Sci. Eng. 2008, 31, 87–92. [Google Scholar]
  58. Rzepski, J.; Quivy, A.; Calvayrac, Y.; Bigot, J.; Chevalier, J.P. Retained γFe in nominality amorphous ferrous soft magnetic glasses. J. Non-Cryst. Solids 1984, 63, 419–423. [Google Scholar] [CrossRef]
  59. Lovas, A.; Kisdi-Koszó, É.; Varga, L.; Kovác, J. Structural memory effects in rapidly quenched iron-boron-based glassy alloys. Key Eng. Mater. 1993, 81, 607–612. [Google Scholar] [CrossRef]
  60. Bán, K.; Kováč, J.; Novák, L. The study of Curie point shifts in Fe (Ni)-based glasses induced by hydrogen absorption and low temperature storage. In Proceedings of the 13th International Conference on Rapidly Quenched and Metastable Materials, Dresden, Germany, 24–29 August 2008; p. 012013. [Google Scholar]
  61. Hasegawa, R.; Ray, R. Iron-boron metallic glasses. J. Appl. Phys. 1978, 49, 4174–4179. [Google Scholar] [CrossRef]
  62. Wohlfarth, E.P. Itinerant electron model of magnetic properties. In Amorphous Metallic Alloys; Luborsky, F.E., Ed.; Butterworth-Heinemann: London, UK, 1983; pp. 283–299. [Google Scholar]
  63. Jiles, D. Introduction to magnetism and magnetic materials; CRC Press: New York, NY, USA, 2015. [Google Scholar]
  64. Konczos, G.; Kisdi-Koszó, É.; Lovas, A.; Kajcsos, Z.; Potocký, L.; Daniel-Szabó, J.; Kováč, J.; Novák, L. Correlation between magnetic properties and density of Fe-TB (T= W, Cr) glassy alloys. J. Magn. Magn. Mater. 1984, 41, 121–124. [Google Scholar] [CrossRef]
  65. Lovas, A. New approach to the phenomenology of amorphous curie-point relaxation. Acta Phys. Pol. A 2010, 118, 770. [Google Scholar] [CrossRef]
  66. Lovas, A.; Kisdi-Koszó, É.; Konczos, G.; Potocký, L.; Vértesy, G. Casting of ferromagnetic amorphous ribbons for electronic and electrotechnical applications. Philos. Mag. B 1990, 61, 549–565. [Google Scholar] [CrossRef]
  67. Cohen, M.H.; Grest, G. Liquid-glass transition, a free-volume approach. Phys. Rev. B 1979, 20, 1077–1098. [Google Scholar] [CrossRef]
  68. Egami, T. Magnetic amorphous alloys: Physics and technological applications. Rep. Prog. Phys. 1984, 47, 1601–1640. [Google Scholar] [CrossRef]
  69. Von Goldbeck, O.K. Iron—Platinum Fe—Pt. In IRON—Binary Phase Diagrams; Springer: Berlin/Heidelberg, Germany, 1982; pp. 91–94. [Google Scholar]
  70. Swartzendruber, L.; Itkin, V.; Alcock, C. The Fe-Ni (iron-nickel) system. J. Phase Equilib. 1991, 12, 288–312. [Google Scholar] [CrossRef]
  71. Greer, A.L. Structural relaxation and atomic transport in amorphous alloys. In Rapidly Solidified Alloys: Processes-Structures-Properties-Applications; Liebermann, H.H., Ed.; Marcel Dekker, Inc.: New York, NY, USA, 1993; p. 269. [Google Scholar]
  72. Hasegawa, R.; O’Handley, R. Soft magnetic properties of metallic glasses—Recent developments. J. Appl. Phys. 1979, 50, 1551–1556. [Google Scholar] [CrossRef]
  73. Hasegawa, R. Soft magnetic properties of metallic glasses. J. Magn. Magn. Mater. 1984, 41, 79–85. [Google Scholar] [CrossRef]
  74. Ström-Olsen, J.; Brüning, R.; Altounian, Z.; Ryan, D. Structural relaxation in metallic glasses. J. Less Common. Met. 1988, 145, 327–338. [Google Scholar] [CrossRef]
  75. Van den Beukel, A. On the kinetics of structural relaxation in metallic glasses. Key Eng. Mater. 1993, 81, 3–16. [Google Scholar] [CrossRef]
  76. Sun, Y.; Peng, S.-X.; Yang, Q.; Zhang, F.; Yang, M.-H.; Wang, C.-Z.; Ho, K.-M.; Yu, H.-B. Predicting Complex Relaxation Processes in Metallic Glass. Phys. Rev. Lett. 2019, 123, 105701. [Google Scholar] [CrossRef] [Green Version]
  77. Berthier, L.; Biroli, G. Theoretical perspective on the glass transition and amorphous materials. Rev. Mod. Phys. 2011, 83, 587–645. [Google Scholar] [CrossRef]
  78. Egami, T. Structural relaxation in amorphous alloys-compositional short range ordering. Mater. Res. Bull. 1978, 13, 557–562. [Google Scholar] [CrossRef]
  79. Tarnoczi, T. Effect of antiferromagnetically coupled species on Curie temperature during relaxation of metallic glasses. Mater. Sci. Eng. A 1991, 133, 200–203. [Google Scholar] [CrossRef]
  80. Greer, A. Effect of quench rate on the structural relaxation of a metallic glass. J. Mater. Sci. 1982, 17, 1117–1124. [Google Scholar] [CrossRef]
  81. Gránásy, L.; Lovas, A. The influence of technological conditions on the Curie point relaxation of Fe25Ni55B10Si10 metallic glasses. J. Magn. Magn. Mater. 1984, 41, 113–115. [Google Scholar] [CrossRef]
  82. Bán, K.; Lovas, A.; Kovác, J.; Novák, L. Cluster manifestations in Fe and Fe-Ni based glassy alloys during their Curie tempera ture relaxation. In Proceedings of the 23rd International Colloquium of Advanced Manufacturing and Repair Technologies in Vehicle Industry, Kollm, Germany, 10–12 May 2006; pp. 67–72. [Google Scholar]
  83. Pickles, A.; Sucksmith, W. A magnetic study of the two-phase iron-nickel alloys. Proc. R. Soc. Lond. Ser. A Math. Phys. Sci. 1940, 175, 331–344. [Google Scholar]
  84. Kaufman, L.; Cohen, M. The martensitic transformation in the iron-nickel system. JOM 1956, 8, 1393–1401. [Google Scholar] [CrossRef]
  85. Lagarec, K.; Rancourt, D.; Bose, S.; Sanyal, B.; Dunlap, R. Observation of a composition-controlled high-moment/low-moment transition in the face centered cubic Fe–Ni system: Invar effect is an expansion, not a contraction. J. Magn. Magn. Mater. 2001, 236, 107–130. [Google Scholar] [CrossRef]
  86. Varga, B.; Kovac, J. Study of alpha-gamma transformation in two-phase iron-nickel alloys by thermomagnetic measurements. Mater. Sci. Forum 2001, 373, 285–288. [Google Scholar] [CrossRef]
  87. Lovas, A.; Novák, L.; Kovac, J.; Balla, S. Similarities and differences between the glass forming mechanism in polymers and metallic liquids. Open Macromol. J. 2010, 4, 37–43. [Google Scholar]
  88. Herlach, D.M. Solidification from undercooled melts. Mater. Sci. Eng. A 1997, 226, 348–356. [Google Scholar] [CrossRef]
  89. Cacciamani, G.; De Keyzer, J.; Ferro, R.; Klotz, U.E.; Lacaze, J.; Wollants, P. Critical evaluation of the Fe–Ni, Fe–Ti and Fe–Ni–Ti alloy systems. Intermetallics 2006, 14, 1312–1325. [Google Scholar] [CrossRef] [Green Version]
  90. Bán, K.; Kovac, J.; Novak, L.; Lovas, A. New effects in amorphous Curie-temperature relaxation. Acta Electron. Inform. 2002, 38, 248–251. [Google Scholar]
  91. Zaichenko, S.; Roth, S.; Glezer, A. Influence of the internal stresses relaxation on magnetic properties of Finemet-type amorphous alloy. J. Magn. Magn. Mater. 2003, 258, 571–573. [Google Scholar] [CrossRef]
  92. Zaichenko, S.; Perov, N.; Glezer, A.; Gan’shina, E.; Kachalov, V.; Calvo-Dalborg, M.; Dalborg, U. Low-temperature irreversible structural relaxation of amorphous metallic alloys. J. Magn. Magn. Mater. 2000, 215, 297–299. [Google Scholar] [CrossRef]
  93. Chen, H. Kinetics of low temperature structural relaxation in two (Fe-Ni)-based metallic glasses. J. Appl. Phys. 1981, 52, 1868–1870. [Google Scholar] [CrossRef]
  94. Ramamurty, U.; Lee, M.; Basu, J.; Li, Y. Embrittlement of a bulk metallic glass due to low-temperature annealing. Scripta Mater. 2002, 47, 107–111. [Google Scholar] [CrossRef] [Green Version]
  95. Ketov, S.; Sun, Y.; Nachum, S.; Lu, Z.; Checchi, A.; Beraldin, A.; Bai, H.; Wang, W.; Louzguine-Luzgin, D.; Carpenter, M. Rejuvenation of metallic glasses by non-affine thermal strain. Nature 2015, 524, 200–203. [Google Scholar] [CrossRef] [Green Version]
  96. Lovas, A.; Bán, K.; Kováč, J.; Zagyi, B. New effects and interpretation of amorphous Curie point relaxation in FeNi-based metallic glasses. Czech. J. Phys. 2004, 54, 89–92. [Google Scholar] [CrossRef]
  97. Bán, K.; Lovas, A.; Kováč, J. Cryogenic effects in the amorphous Curie temperature shift of Fe-based glassy alloys. Czech. J. Phys. 2004, 54, 141–144. [Google Scholar] [CrossRef]
  98. Kovac, J.; Vehovszky, B.; Novak, L.; Lovas, A. Viscous phenomena in magnetic and thermal properties of Fe-Ni-based glasses induced by cryo-treatments. IEEE Trans. Magn. 2010, 46, 353–356. [Google Scholar] [CrossRef]
  99. Makino, A.; Inoue, A.; Masumoto, T. Nanocrystalline soft magnetic Fe–M–B (M=Zr, Hf, Nb) alloys produced by crystallization of amorphous phase. Mater. Trans. JIM 1995, 36, 924–938. [Google Scholar] [CrossRef] [Green Version]
  100. Lu, K. Nanocrystalline metals crystallized from amorphous solids: Nanocrystallization, structure, and properties. Mater. Sci. Eng. R 1996, 16, 161–221. [Google Scholar] [CrossRef]
  101. Scott, M.G. Crystallization. In Amorphous Metallic Alloys; Luborsky, F.E., Ed.; Butterworth-Heinemann: Oxford, UK, 1983; pp. 144–168. [Google Scholar]
  102. Lu, K.; Wang, Y.Z.; Wei, W.D.; Li, Y.Y. Electrical resistivity of nanocrystalline Ni-P alloys. In Advances in Cryogenic Materials; Fickett, F.R., Reed, R.P., Eds.; Plenum Press: New York, NY, USA, 1992; Volume 38, pp. 285–292. [Google Scholar]
  103. Herzer, G. Nanocrystalline soft magnetic alloys. In Handbook of Magnetic Materials; Buschow, K.H.J., Ed.; Elsevier: London, UK, 1997; Volume 10, pp. 415–462. [Google Scholar]
  104. Lovas, A.; Kiss, L.; Varga, B.; Kamasa, P.; Balogh, I.; Bakonyi, I. Survey of magnetic properties during and after amorphous-nanocrystalline transformation. J. Phys. IV France 1998, 8, 291–298. [Google Scholar] [CrossRef]
  105. Yamauchi, K.; Yoshizawa, Y. Recent development of nanocrystalline soft magnetic alloys. Nanostruct. Mater. 1995, 6, 247–254. [Google Scholar] [CrossRef]
  106. Yoshizawa, Y.; Yamauchi, K. Effects of magnetic field annealing on magnetic properties in ultrafine crystalline Fe-Cu-Nb-Si-B alloys. IEEE Trans. Magn. 1989, 25. [Google Scholar] [CrossRef]
  107. Ayers, J.; Harris, V.; Sprague, J.; Elam, W.; Jones, H. A model for nucleation of nanocrystals in the soft magnetic alloy Fe73. 5Nb3Cu1Si13. 5B9. Nanostruct. Mater. 1997, 9, 391–396. [Google Scholar] [CrossRef]
  108. Müller, M.; Mattern, N.; Illgen, L. The Influence of the Si/B content on the microstructure and on the magnetic properties of magnetically soft nanocrystalline FeBSi--CuNb alloys. Z. Metallkd. 1991, 82, 895–901. [Google Scholar]
  109. Hono, K.; Zhang, Y.; Inoue, A.; Sakurai, T. Atom probe studies of nanocrystalline microstructural evolution in some amorphous alloys. Mater. Trans. JIM 1995, 36, 909–917. [Google Scholar] [CrossRef] [Green Version]
  110. Hono, K.; Hiraga, K.; Wang, Q.; Inoue, A.; Sakurai, T. The microstructure evolution of a Fe73.5Si13.5B9Nb3Cu1 nanocrystalline soft magnetic material. Acta Metall. Mater. 1992, 40, 2137–2147. [Google Scholar] [CrossRef]
  111. Dai, J.; Wang, Y.G.; Yang, L.; Xia, G.T.; Zeng, Q.S.; Lou, H.B. Thermal dependence of structural and magnetic properties in an amorphous Fe-Si-B-Cu alloy. J. Alloys Compd. 2017, 695, 1266–1270. [Google Scholar] [CrossRef]
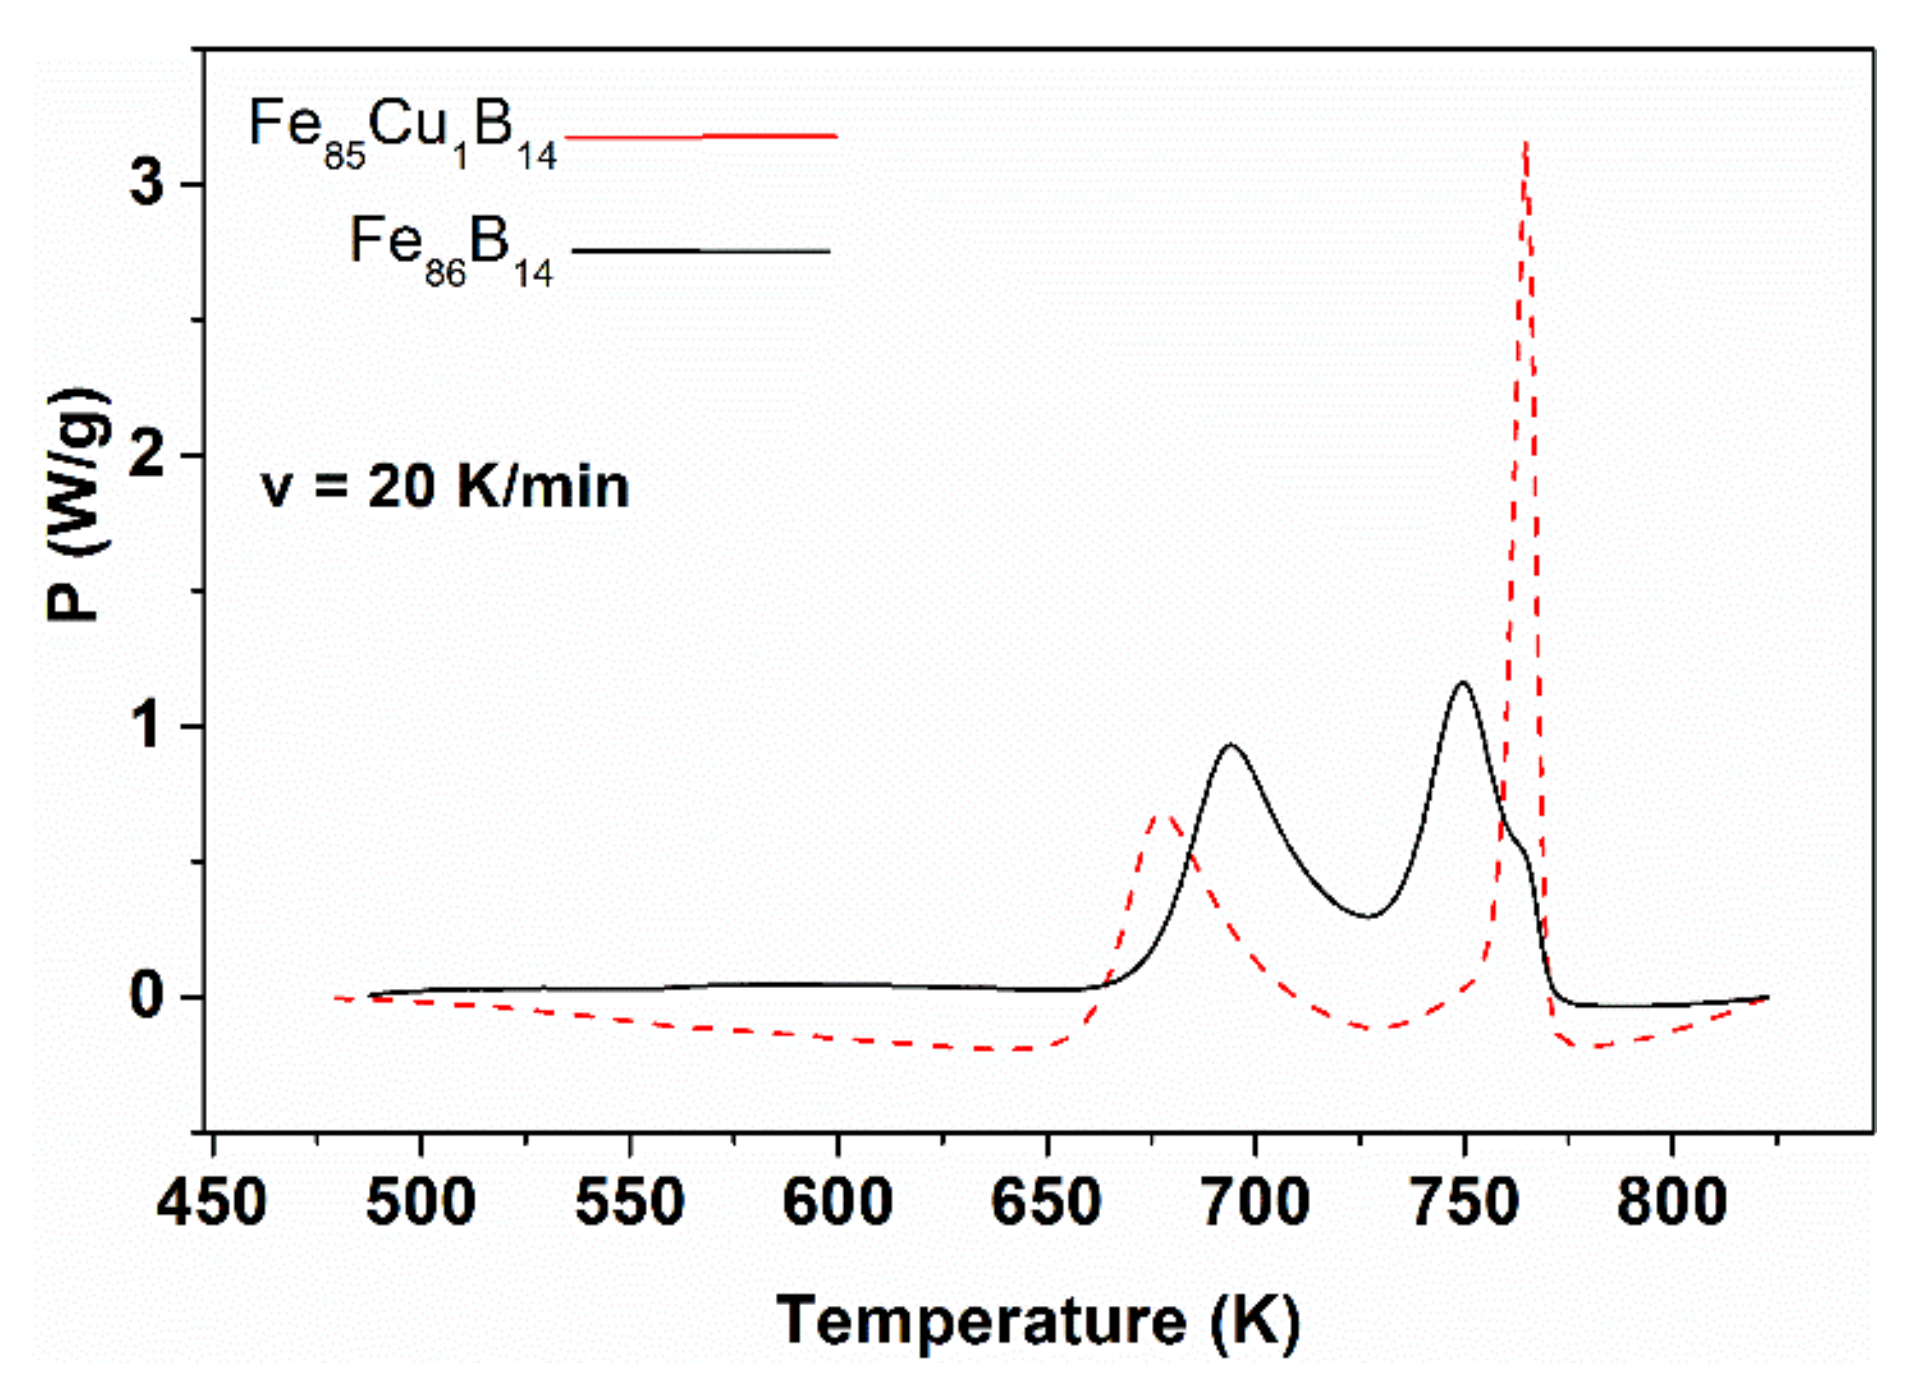
  112. Varga, B.; Lovas, A.; Ye, F.; Gu, X.; Lu, K. Pressure dependence of nanocrystallization in amorphous Fe86B14 and Fe85Cu1B14 alloys. Mater. Sci. Eng. A 2000, 286, 193–196. [Google Scholar] [CrossRef]
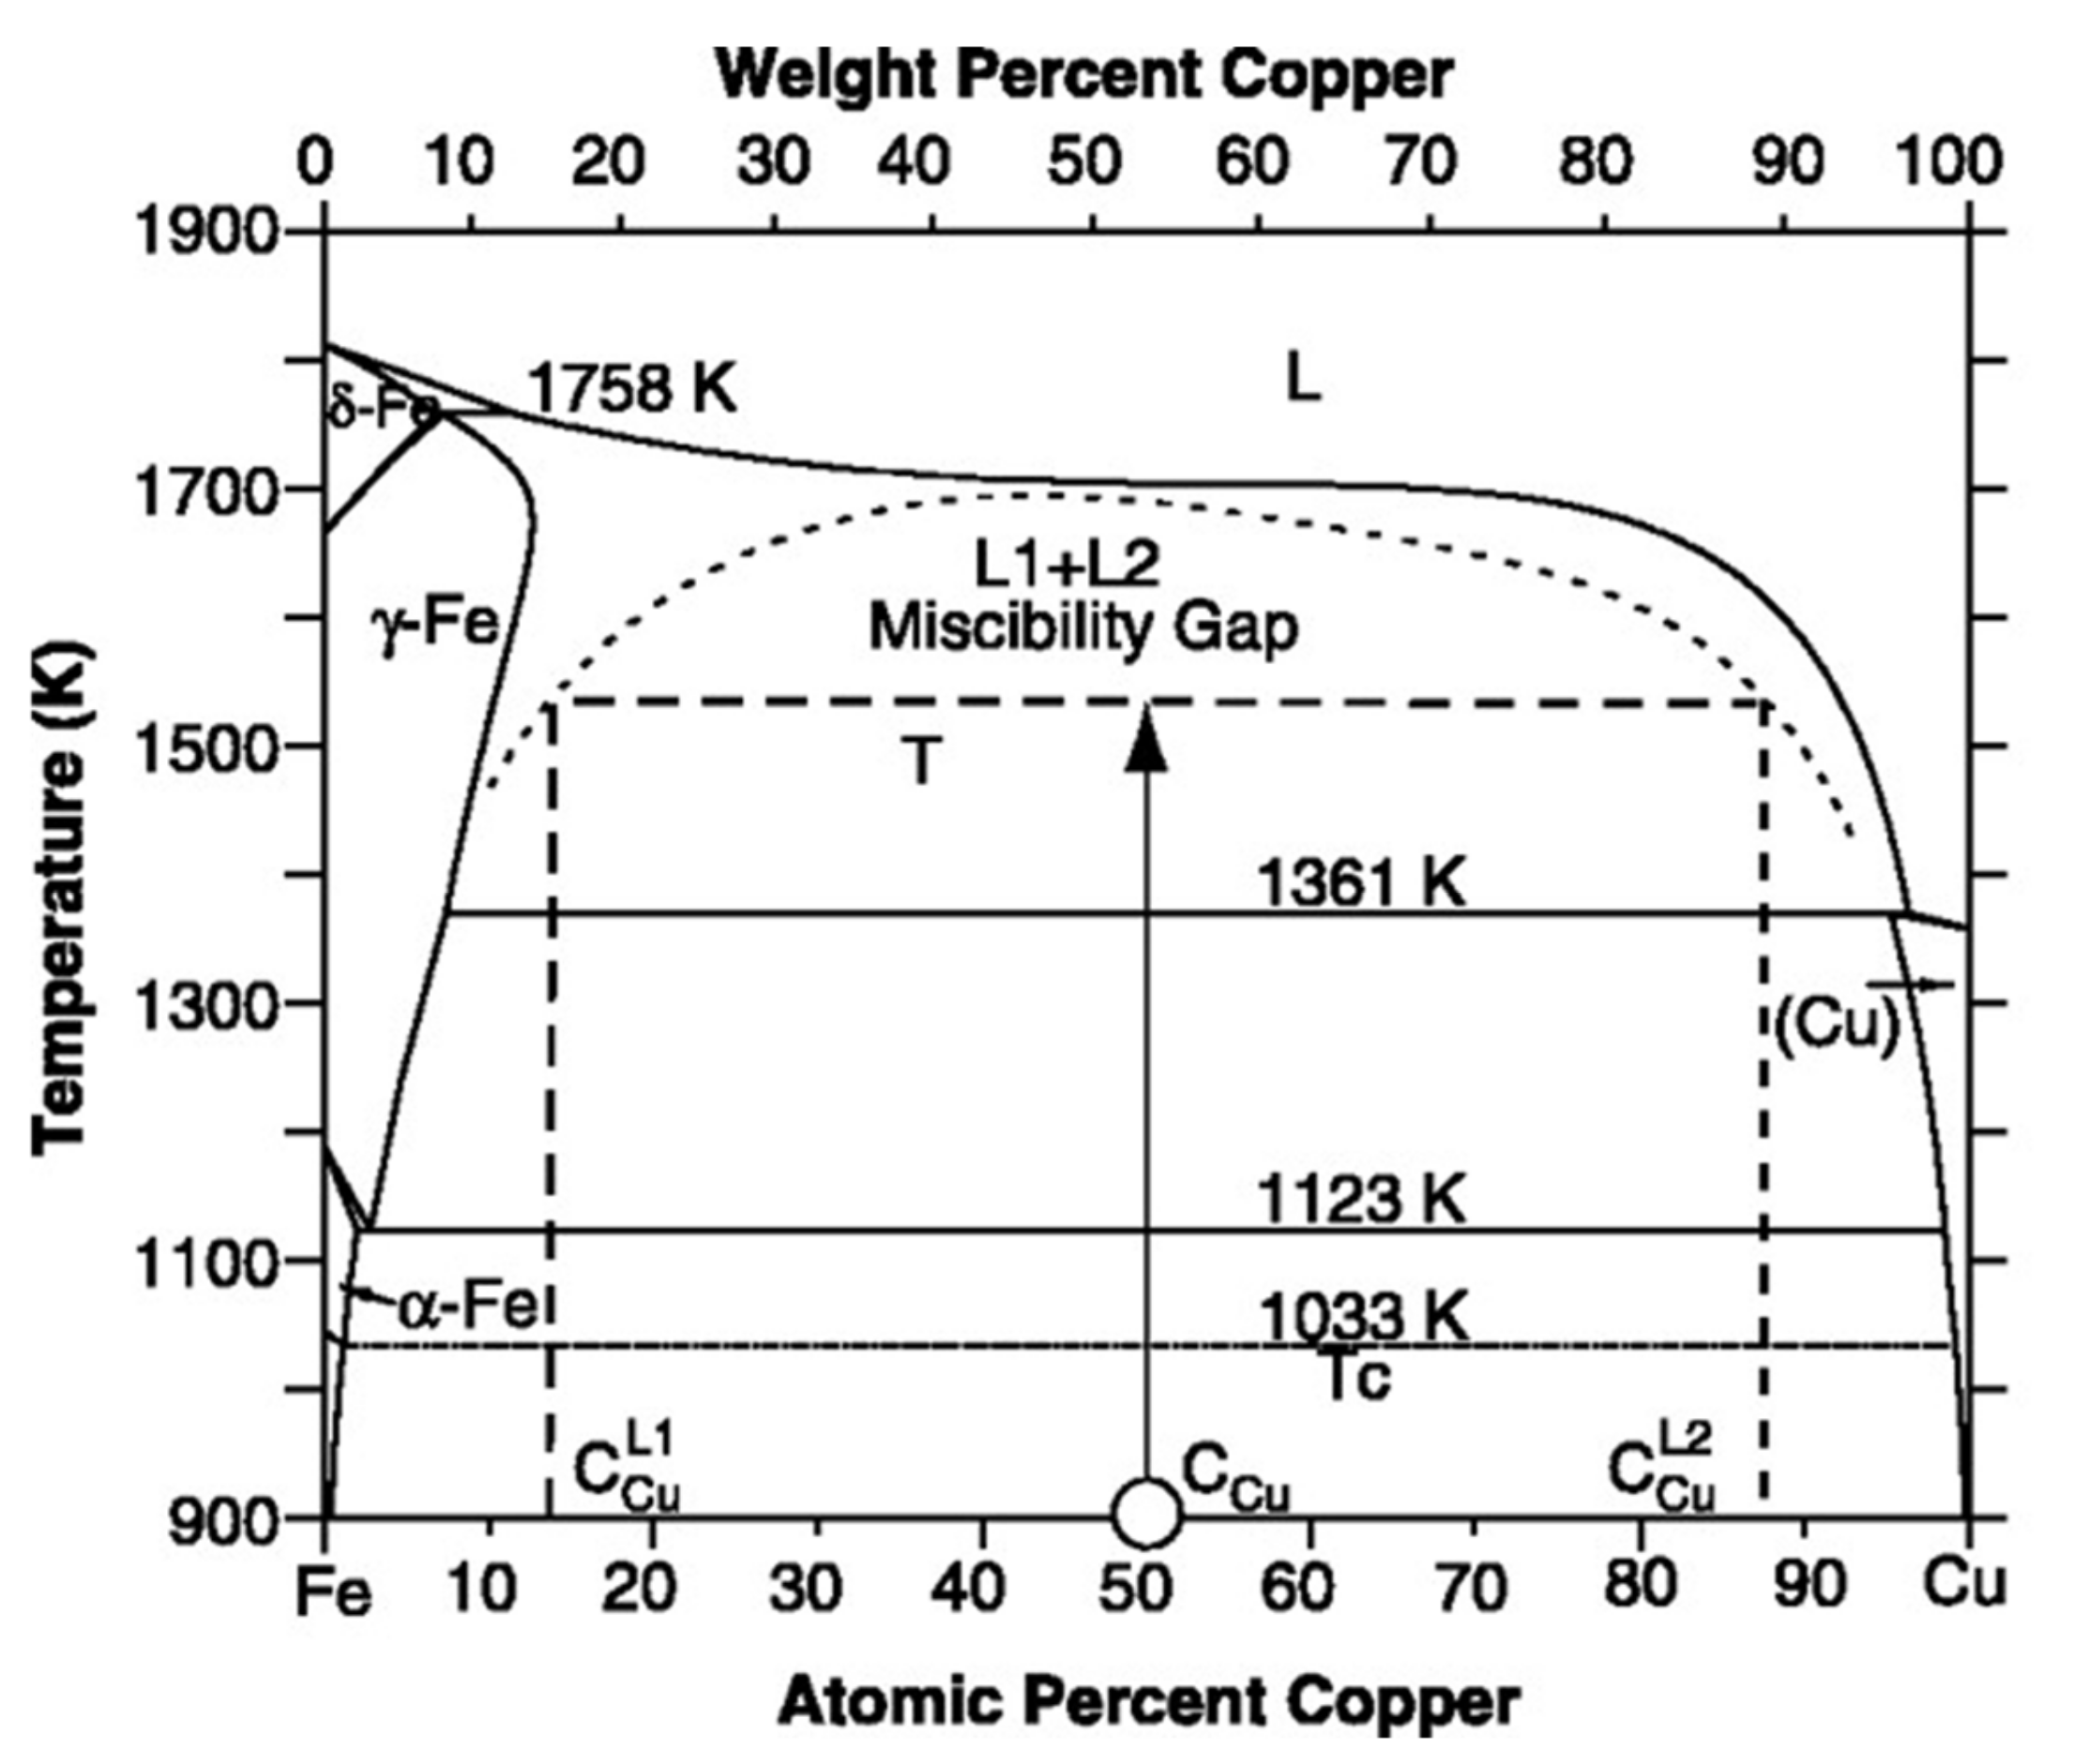
  113. Kisdi-Koszó, É.; Lovas, A. Clustering in amorphous alloys and Its connection with the nanocrystalline state. Key Eng. Mater. 1993, 81, 209–214. [Google Scholar] [CrossRef]
  114. Chen, Y.; Liu, F.; Yang, G.; Xu, X.Q.; Zhou, Y.H. Rapid solidification of bulk undercooled hypoperitectic Fe–Cu alloy. J. Alloys Compd. 2007, 427, L1–L5. [Google Scholar] [CrossRef]
  115. Hoselitz, K. The saturation magnetization of some substituted Fe-Si-B metallic glasses. J. Magn. Magn. Mater. 1982, 26, 106–108. [Google Scholar] [CrossRef]
  116. Lovas, A.; Kiss, L.; Balogh, I. Saturation magnetization and amorphous Curie point changes during the early stage of amorphous–nanocrystalline transformation of a FINEMET-type alloy. J. Magn. Magn. Mater. 2000, 215, 463–465. [Google Scholar] [CrossRef]
  117. Lovas, A.; Varga, B.; Kiss, L.F.; Nakonechna, L.; Kalincsák, Z. The evolution of soft magnetic properties and the related density change during amorphous–nanocrystalline transformation. J. Magn. Magn. Mater. 2003, 254–255, 489–491. [Google Scholar] [CrossRef]
  118. Fast, J.D. Thermodynamics and phase relations. In Interaction of Metals and Gases Philips Technical Library; Eichenauer, W., Ed.; Red Globe Press: London, UK, 1965; Volume 1. [Google Scholar]
  119. Fukai, Y. Hydrogen in alloys. In The Metal-Hydrogen System; Fukai, Y., Ed.; Springer: Berlin, Germany, 2005; Volume 21, pp. 55–90. [Google Scholar]
  120. Aoki, K.; Kamachi, M.; Masumoto, T. Thermodynamics of hydrogen absorption in amorphous Zr-Ni alloys. J. Non-Cryst. Solids 1984, 61, 679–684. [Google Scholar] [CrossRef]
  121. Novák, L.; Lovas, A.; Kiss, L. Change in soft magnetic properties of Fe-based metallic glasses during hydrogen absorption and desorption. J. Appl. Phys. 2005, 98, 043904–043905. [Google Scholar] [CrossRef]
  122. Novák, L.; Kisdi-Koszó, E.; Duhaj, P. Influence of hydrogenation-dehydrogenation on the magnetic properties of amorphous and nanocrystalline FINEMET alloys. In Proceedings of the 9th International Conference on Rapidly Quenched and Metastable Materials, Bratislava, Slovakia, 25–30 August 1996; pp. 216–219. [Google Scholar]
  123. Zehringer, R.; Oelhafen, P.; Güntherodt, H.-J.; Yamada, Y.; Mizutani, U. Electronic structure of hydrogenated amorphous Ni-Zr alloys. Mater. Sci. Eng. 1988, 99, 253–256. [Google Scholar] [CrossRef]
  124. Manchester, F.; Khatamian, D. Mechanisms for activation of intermetallic hydrogen absorbers. Mater. Sci. Forum 1988, 31, 261–296. [Google Scholar] [CrossRef]
  125. Völkl, J.; Alefeld, G. Diffusion of hydrogen in metals. In Hydrogen in Metals I- Basic Properties; Völkl, G.A., Ed.; Springer: Berlin, Germany, 1978; Volume 28, pp. 321–348. [Google Scholar]
  126. Novák, L.; Ziman, J.; Kovalaková, M.; Kladivová, M. Hydrogen diffusion in amorphous FeCrB ribbons. Acta Electrotech. Inform. 2012, 12, 72–75. [Google Scholar] [CrossRef]
  127. Kladivová, M.; Ziman, J.; Novák, L.; Kovalaková, M. Hydrogen diffusion and strain distribution in amorphous Fe-based ribbons. Acta Electrotech. Inform. 2013, 13, 65–69. [Google Scholar] [CrossRef]
  128. Koval’aková, M.; Novák, L.; Lovas, A.; Kováč, J. Study of influence of chromium admixture on hydrogenation and dehydrogenation of FeB amorphous ribbons. Czech. J. Phys. 2004, 54, 149–152. [Google Scholar] [CrossRef]
  129. Garaguly, J. Investigation of Hydrogen Absorption-Desorption in Amorphous Alloys via In-Situ Resistance Measurements. Ph.D. Thesis, BME Faculty of Transportation Engineering, MTA Institute for solid State Physics and Optics, Budapest University of Technology and Economics, Budapest, Hungary, 1998. [Google Scholar]
  130. Novák, L.; Stančáková, A.; Lovas, A.; Bán, K. Hydrogen induced changes of magnetic properties during amorphous-nanocrystalline transformation. Czech. J. Phys. 2004, 54, 201–204. [Google Scholar] [CrossRef]
  131. Sharma, S.; Banerjee, S.; Jain, A.K. Some correlations for diffusion in amorphous alloys. J. Mater. Res. 1989, 4, 603–606. [Google Scholar] [CrossRef]
  132. Novák, L.; Bán, K.; Kováč, J.; Lovas, A. Curie temperature changes of Fe-based glassy alloys, induced by electrochemical hydrogen-charging and subsequent discharging. J. Magn. Magn. Mater. 2006, 304, e669–e671. [Google Scholar] [CrossRef]
  133. Pál, Z.; Lovas, A. Anomalous concentration dependence of amorphous curie temperature and the thermopower in ternary Fe-Cr-B glasses. Acta Phys. Pol. A 2008, 113, 139–142. [Google Scholar] [CrossRef]
  134. Gerling, R.; Schimansky, F.; Wagner, R. Two-stage embrittlement of amorphous Fe40Ni40P20 resulting from a loss of free volume and phase separation. Acta Metall. 1988, 36, 575–583. [Google Scholar] [CrossRef]
  135. Huizer, E.; Van Den Beukel, A. Reversible and irreversible length changes in amorphous Fe40Ni40B20 during structural relaxation. Acta Metall. 1987, 35, 2843–2850. [Google Scholar] [CrossRef]
  136. Russew, K.; Stojanova, L.; Lovas, A.; Konzcos, G. Viscous flow, thermal expansion and phase separation of Fe40Ni40Si6B14 amorphous alloy. Mater. Sci. Eng. A 1991, 133, 532–534. [Google Scholar] [CrossRef]
  137. Nagy, I.; Bakonyi, I.; Lovas, A.; Tóth-Kádár, E.; Tompa, K.; Hossó, M.; Cziraki, A.; Fogarassy, B. Hydrogen sorption and hydrogen-induced phase separation in a nearly equiatomic Ni-Zr amorphous alloy. J. Less Common. Met. 1991, 167, 283–303. [Google Scholar] [CrossRef]
  138. Garaguly, J.; Lovas, A.; Cziráki, Á.; Reybold, M.; Takács, J.; Wetzig, K. Reversible and irreversible hydrogen absorption in Ni67- xCuxZr33 glasses monitored by in situ resistivity measurements. Mater. Sci. Eng. A 1997, 226, 938–942. [Google Scholar] [CrossRef]
  139. Harris, J.; Curtin, W.; Tenhover, M. Universal features of hydrogen absorption in amorphous transition-metal alloys. Phys. Rev. B 1987, 36, 5784–5797. [Google Scholar] [CrossRef]
  140. Buschow, K.; Bouten, P.; Miedema, A. Hydrides formed from intermetallic compounds of two transition metals: A special class of ternary alloys. Rep. Prog. Phys. 1982, 45, 937–1039. [Google Scholar] [CrossRef]
  141. Yamada, Y.; Tanaka, K. Electrical resistivity change during hydrogen charging and subsequent heating in Zr–Ni alloy glasses. Trans. JIM 1986, 27, 409–415. [Google Scholar] [CrossRef] [Green Version]
  142. Tóth, J.; Garaguly, J.; Tompa, K.; Lovas, A.; Varga, L. Hydrogen uptake monitored by resistance change in amorphous Zr33Ni67 alloy. Int. J. Hydrogen Energy 1996, 21, 1039–1040. [Google Scholar] [CrossRef]
Figure 1. Illustration of relaxation phenomena in the supercooled melt during glass formation. A: the system is in internal equilibrium; B: relaxation during the experiment; C: the system is totally frozen. Adopted from [21], with permission from AIP Publishing LLC, 2000.
Metals 10 01025 g001
Figure 2. Comparison of η(T) for “strong” and “fragile” glass-forming liquids. Adopted from [37], with permission from Elsevier, 1988.
Metals 10 01025 g002
Figure 3. Temperature dependence of the peak of the dielectric relaxation frequency of a glass-forming mixture of chlorobenzene/cis-decalin. The α–process exhibits a non-Arrhenius temperature dependence and vanishes at Tg. Adopted from [39], with permission from AIP Publishing LLC, 1973.
Metals 10 01025 g003
Figure 4. Binary Fe100−xBx glasses. Boron content vs. (a) onset of the crystallization temperature (Tx) as derived from differential scanning calorimetry (DSC) measurements; (b) crystallization enthalpy (ΔHcryst) and temperature (Tcr) and (c) micro hardness (HV). Adapted from [50], with permission from Elsevier, 1995.
Metals 10 01025 g004
Figure 5. Thermomagnetic curves, (M(T)), for Fe85B15 glass, prepared by fast and slow cooling. Adopted from [54], with permission from Springer Nature, 1969.
Metals 10 01025 g005
Figure 6. (a) Concentration dependence of the Curie temperature (TCam) and the magnetic moment (µFe) in glassy Fe-B alloys (adopted from [59], with permission from Trans Tech Publications, 1982). (b) Bethe–Slater curve representing the variation of the exchange integral J with interatomic spacing a and radius d of the unfilled d shell (adopted from [60], with permission from IOP publishing, 2009); (c) Bethe–Slater curve representing the variation of the exchange integral J with interatomic spacing a and radius d of the unfilled d shell (adopted from [60], with permission from IOP publishing, 2009).
Metals 10 01025 g006
Figure 7. Crystallization enthalpies (ΔHcryst) and temperatures, (Tcryst) versus Cr content in two independent series of hypo-eutectic Fe-Cr-B glasses (a,b), and the corresponding change of micro-hardness (HV) (c,d). Adopted from [50], with permission from Elsevier, 1995.
Metals 10 01025 g007
Figure 8. Change of Curie temperature (TCam) and thermopower (U) versus Cr content in (Fe85-xCrx)B15 glasses (adopted from [65], with permission from the Institute of Physics of the Polish Academy of Sciences, 2010).
Metals 10 01025 g008
Figure 9. Curie temperature TCam for Fe85-xNixB15 and Fe80-x-NixB20 glassy alloys versus Ni content. Adopted from [65], with permission from the Institute of Physics of the Polish Academy of Sciences, 2010.
Metals 10 01025 g009
Figure 10. Curie temperature TCam for Fe85-x-PtxB15 glassy alloys versus Pt-content. Adopted from [65], with permission from the Institute of Physics of the Polish Academy of Sciences, 2010.
Metals 10 01025 g010
Figure 11. Comparison of irreversible (ΔHirr.) and reversible (ΔHr.) enthalpy relaxation (for ΔHrev. the samples were annealed at 500 K for 60 min). Adopted from [74], with permission from Elsevier, 1988.
Metals 10 01025 g011
Figure 12. (a). Relaxation energy as a function of ribbon thickness and (b) typical heat release curves for 9 and 42 μm thick ribbons. Adopted from [81], with permission from Elsevier, 1984.
Metals 10 01025 g012
Figure 13. Curie temperature TCam for slowly and rapidly cooled (thick and thin) Fe40Ni40(SiB)20 ribbons and the change during cyclic reheating to the Curie temperature (between two measurements isothermal heat treatments at 473 K for 30 min were applied) adapted from [82], with permission from author, 2006.
Metals 10 01025 g013
Figure 14. Curie temperature TCam in the as-quenched state for Fe25Ni55 B10 Si10 samples as a function of ribbon thickness. Adopted from [81], with permission from Elsevier, 1984.
Metals 10 01025 g014
Figure 15. Evolution of the Curie temperature TCam for various (FeNi)83B17 samples in as-quenched state and during the different isothermal heat treatments.
Metals 10 01025 g015
Figure 16. Hysteretic phenomena in the thermomagnetic curves for Fe90Ni10 samples upon heating and cooling up to different maximum temperatures. (a) 993 K, and (b) 948 K measured at a heating and cooling rate of 160 K/min. Adopted from [86], with permission from Trans Tech Publication, 1984.
Metals 10 01025 g016
Figure 17. Equilibrium phase diagram of the Fe-Ni system together with the expected cluster formation in the supercooled melt, and a schematic TTT diagram for crystal growth from the supercooled FeNiSiB melt. The temperature range of the Tg line is approximately 773 K in this alloy. Adopted from [89], with permission from Elsevier, 2006.
Metals 10 01025 g017
Figure 18. Evolution of the difference in Curie temperature ΔTCam in Fe20Ni60Si6B14 samples after 1 h isothermal heat treatment at various temperatures. One series of samples was immersed into liquid N2 (77 K) for 20 h before the heat treatment. Adopted from [96], with permission from Springer Nature, 1969.
Metals 10 01025 g018
Figure 19. Curie temperature TCam of Fe78Ni5B16 samples in as-quenched state and after heat treatment during two subsequent measuring runs. Both kinds of samples were previously treated at liquid nitrogen (LN) temperature (77 K) (superposition of different thermal history). Adopted from [60], with permission from IOP publishing, 2009.
Metals 10 01025 g019
Figure 20. Curie temperature TCam of FeSi2B15 samples during subsequent measuring runs between which the sample was heat treated at 473 K. Adopted from [97], with permission from Springer Nature, 2004.
Metals 10 01025 g020
Figure 21. Change of the Curie temperature TCam for FeSi4B15 samples during a series of measuring runs. Adapted from [97], with permission from Springer Nature, 2004.
Metals 10 01025 g021
Figure 22. Comparison of the coercivity (Hc) for LN treated and as-received samples after isothermal relaxation caused by heat treatments lasting 1 h at various temperatures. Adopted from [96], with permission from Springer Nature, 1969.
Metals 10 01025 g022
Figure 23. Change of the Curie temperature TCam after isothermal heat treatment at 573 K for LN treated and non-treated samples. Adopted from [98], with permission from IEEE, 2010.
Metals 10 01025 g023
Figure 24. Heat capacity of Fe40Ni40Si6B14 glassy samples with and without LN treatments. The samples were previously subjected to isothermal heat treatments at 523 or 673 K, respectively. Adopted from [98], with permission from IEEE, 2010.
Metals 10 01025 g024
Figure 25. Change of the half width of the exothermic crystallization peak for Fe40Ni40Si6B14 samples after various thermal treatments. Adopted from [98], with permission from IEEE, 2010.
Metals 10 01025 g025
Figure 26. Grain size versus the normalized temperature (T/Tm) for various glass-forming metallic systems (T: onset temperature of crystallization, Tm: experimentally determined melting point of the alloy and grain size arises from experiments.) Adapted from [100], with permission from Elsevier, 1996.
Metals 10 01025 g026
Figure 27. Temperature dependence of the specific resistance for Ni-P nanocrystalline alloys with different average grain size. Adapted from [100], with permission from Elsevier, 1996.
Metals 10 01025 g027
Figure 28. The change of coercivity (Hc) versus the average grain size (D) in several crystalline alloys. Adopted from [103], with permission from Elsevier, 1997.
Metals 10 01025 g028
Figure 29. DSC thermograms for the decomposition of hypo-eutectic FeB14 and FeB14Cu1 glasses measured at a constant heating rate of 20 K/min. Adopted from [112], with permission from Elsevier, 2000.
Metals 10 01025 g029
Figure 30. Fe-Cu phase diagram, showing the extended solubility of Cu in γ-Fe, and the narrow solubility limit of Cu in α-Fe, as well as the eutectoid decomposition mechanism of γ-Fe(Cu) solid solution → α-Fe + Cu. Adopted from [114], with permission from Elsevier, 2007.
Metals 10 01025 g030
Figure 31. Change of magnetic loss at different frequencies versus the time of heat treatment at 793 K. Adopted from [117], with permission from Elsevier, 2003.
Metals 10 01025 g031
Figure 32. The frequency dependence of magnetic loss in as quenched state, after relaxation (673 K and nanocrystalline state (793 K, 1 h). Adopted from [117], with permission from Elsevier, 2003.
Metals 10 01025 g032
Figure 33. Equilibrium H content for 3d and 4d transition elements as a function of temperature (1 atm ambient pressure). Adopted from [118], with permission from Red Globe Press, 1971.
Metals 10 01025 g033
Figure 34. Maximum solubility of C in bcc and fcc allotropes of 3D transition metals together with their valence electron states.
Metals 10 01025 g034
Figure 35. Change of coercivity (Hc) during hydrogen desorption in Fe85B15, FeW5B15 and FeV5B15 samples. Adopted from [121], with the permission from AIP Publishing LLC, 2005.
Metals 10 01025 g035
Figure 36. Change of coercivity Hc in FINEMET-type alloys during dehydrogenation. Adopted from [130], with permission from Springer Nature, 1969.
Metals 10 01025 g036
Figure 37. lnDo for H and several substitutional atoms versus the activation energy. Adopted from [131], with permission from Cambridge University Press, 2011.
Metals 10 01025 g037
Figure 38. Monitoring of the H desorption in a Fe75,3Cr9,2B15.5 glassy alloy during repeated Curie temperature TCam measurements. Adopted from [132], with permission from Elsevier, 2006.
Metals 10 01025 g038
Figure 39. Monitoring of the H desorption in a Fe75Cr10B15 glassy alloy during repeated Curie temperature TCam measurements. Adopted from [133], with permission from the Institute of Physics of the Polish Academy of Sciences, 2010.
Metals 10 01025 g039
Figure 40. Comparison of the TCam shift in Fe40Ni40Si6B14 samples, being previously charged or not charged with hydrogen. Adopted from [87], with permission from BENTHAM Open, 2010.
Metals 10 01025 g040
Figure 41. Comparison of the sign and magnitude of ΔTCam observed during the first run of TCam measurements (heating rate 20 K//min.). Adopted from [87], with permission from BENTHAM Open, 2010.
Metals 10 01025 g041
Figure 42. Temperature dependence of the viscosity (η) and the thermal expansion coefficient (α) of the Fe40Ni40Si6B14 amorphous alloy. Adopted from [136], with permission from Elsevier, 1991.
Metals 10 01025 g042
Figure 43. Distribution of bond energies in Ni1-xZrx amorphous systems versus the number of H atoms belonging to a given energy level. Adopted from [139], with permission from American Physical Society, 1987.
Metals 10 01025 g043
Figure 44. Illustration of the increasing degree of clusterization (micro-phase separation) in the amorphous state as observed during cyclic H saturation. (a) as-cast sample, (b) after first H absorption–desorption cycle, (c) after second H absorption–desorption cycle, (d) after third H absorption–desorption cycle, and (e) after fourth H absorption–desorption cycle. Enrichment of Cu is detected by SAD (Selected Area Electron Diffraction). Adopted from [138], with permission from Elsevier, 1997.
Metals 10 01025 g044
Figure 45. Regrouping of Wigner–Zeitz Voronoi polyhedra due to H absorption. (a) before hydrogen absorption and (b) after hydrogen absorption. Adopted from [140], with permission from IOP Publishing, 1934.
Metals 10 01025 g045
Figure 46. Time dependence of the relative resistance of Ni67Zr33 samples during repeated absorption–desorption cycles. Adopted from [138], with permission from Elsevier, 1997.
Metals 10 01025 g046
Table 1. Saturation magnetization (Ms) and coercivity (Hc) measured at 12 and 300 K after isothermal heat treatments. Adopted from [116], with permission from Elsevier, 2000.
AnnealingsMs (emu/g)
12 K
Ms (emu/g)
300 K
Hc (mOe)
12 K
Hc (mOe)
300 K
as-quenched 153.1 131.3 - 102
400 °C/0.5 h 154.6 135.0 83 36.6
450 °C/15 min 155.1 135.5 154 36.8
525 °C/4 min 159.4 138.2 165.5 67.2
525 °C/1 h 145.9 134.1 67.2 <20
Table 2. Comparison of the heat of formation of hydrides for various metallic elements (ΔHf, (kJ/Mol)), data from [129], with permission from author, 1998.
IonicMetallicCovalent
LiH
−176
NaH
−117
MgH2
−75
(AlH3)x
KH
−117
CaH2
−176
ScH2
−201
TiH2
−126
VH
−59
CrH
17
MnH
−17
FeH
+34
CoH
+34
NiH
+17
CuH
21
GaH6GeH4AsH3
RbH
−109
SrH2
−188
YH2
−226
ZrH2
−163
NbH
−75
MoH
+17
TcH
+50
RuH
+67
RhH
+38
PdH
−38
InH3SnH4SbH3TeH2
CsH
−100
BaH2
−176
LaH2
−209
HfH2
−134
TaH2
−59
WH
+42
ReH
+92
OsH
+84
IrH
+67
PtH
+17
T1H3PbH4BiH3PoH2
(Re)H3 PrH2
−209
NdH2
−209
SmH2
−222
GdH2
−201
ErH2
−226

