Article

CaO–CaZrO3 Mixed Oxides Prepared by Auto–Combustion for High Temperature CO2 Capture: The Effect of CaO Content on Cycle Stability

Italian National Agency for New Technologies, Energy and Sustainable Economic Development (ENEA), Via Anguillarese 301, 00123 Rome, Italy
*
Authors to whom correspondence should be addressed.
Metals 2020, 10(6), 750; https://doi.org/10.3390/met10060750
Submission received: 5 April 2020 / Revised: 21 May 2020 / Accepted: 3 June 2020 / Published: 5 June 2020
(This article belongs to the Special Issue Metal Oxides)

Abstract

:
Cycling high temperature CO2 capture using CaO–based solid sorbents, known as the calcium looping (CaL) process, is gaining considerable scientific and industrial interest due to the high theoretical sorbent capacity (0.78 gCO2/gCaO), the low specific cost, and the negligible environmental impact of the employed materials. In this work, we investigated the self–combustion synthesis of CaO–CaZrO3 sorbents with different CaO contents (40, 60, and 80 wt%) for use in the CaL process. CaZrO3 was used as a spacer to avoid CaO grains sintering at high temperature and to reduce the diffusional resistances of CO2 migrating towards the inner grains of the synthetic sorbent. Samples were characterized by X–ray diffraction (XRD), Brunauer–Emmett–Teller (BET), and scanning electron microscopy (SEM) analyses. The reaction between CO2 and CaO (i.e., carbonation) was carried out in 20 vol% CO2 at 650 °C and calcination (i.e., decomposition of CaCO3 to CaO and CO2) at 900 °C in pure Ar or with 85 vol% CO2 using a thermogravimetric analyzer (thermogravimetric/differential thermal analysis (TG–DTA)). The most stable sorbent was with 40 wt% of CaO showing a CO2 uptake of up to 0.31 g CO2/gsorbent and 0.26 g CO2/gsorbent operating under mild and severe conditions, respectively. The experimental data corroborated the prediction of the shrinking core spherical model in the first phase of the carbonation. A maximum reaction rate of 0.12–0.13 min−1 was evaluated in the first cycle under mild and severe conditions of regeneration.

Graphical Abstract

1. Introduction

Among different sorbents, metal oxides contained in naturally occurring minerals represent the cheapest option for the CO2 capture process; the calcined forms of limestone and dolomite [1,2,3] show a high reactivity within a temperature range from 550 to 750 °C, which largely fits with reforming, gasification, and pyrolysis processes, and may be regenerated by thermal decomposition of carbonates at temperatures ranging from 850 to 900 °C. This process can be implemented for CO2 removal from product gases in fluidized bed systems for combustion gasification, or methane steam reforming with water–gas shift reaction [4,5,6]. In this process, CaO is converted into CaCO3 during the CO2 uptake (carbonation Equation (1)).
CaO + CO 2 CaCO 3       Δ H 0 = 178   kJ · mol 1
The spent solid sorbent is subsequently regenerated by releasing CO2 in a calcination step. It is desirable to produce a concentrated CO2 stream during the regeneration process and, in this case, the calcination will often be carried out in an atmosphere rich in CO2. This puts requirements on the sorbent, e.g., the sorbent must withstand a high CO2 concentration during its regeneration for an extended number of cycles. However, the presence of CO2 during the regeneration step has been shown to decrease the calcination rate of the solid sorbent, and also to cause sintering of CaO grains with associated negative effects on the CO2 uptake capacity after multiple cycles [7,8,9]. In order to lower the molar fraction of CO2 during calcination, it has been proposed to add steam that is easily separable after the calcination step [10]. Besides the cost for producing and separating the steam, steam itself was also found to cause sintering of CaO, thereby reducing the CO2 uptake capacity of the regenerated sorbent; steam can lead to changes in the pore–size distribution (PSD) through the CaCO3 layer [11]. In any case, the sorbent kinetics and stability of CO2 uptake capacity during cycling in industrial–sized plants are key issues and strongly influence the cost of the CaL technology [12]. The sorbent must thus show a high stability and stable sorption capacity throughout multiple CO2 uptake–regeneration cycles. Further important properties of a good sorbent are as follows: low–cost manufacturing, fast reaction kinetics, as well as mechanical stability and sintering resistance. Although natural carbonates, e.g., limestone (CaCO3) or dolomite ([Ca,Mg]CO3), seem to be the best candidates given their low cost and high availability, they show a pronounced decay in CO2 sorption capacity during repeated cycling [1,9]. The carbonation of these materials is characterized by an abrupt transition from the rapid initial reaction rate, most likely kinetically controlled, to a slower reaction rate, which is most likely diffusion controlled [3,8,13]. Other drawbacks of these materials are as follows: sorption capacity decay, due to sintering and modification of the particles’ porous structure [14,15,16], and low mechanical resistance under fluidization conditions, specifically for the calcined state, which may therefore cause elutriation of fine particles. To counteract this, efforts have been made to enhance the performances of naturally occurring sorbents. Thermal pretreatment of natural dolomite or limestone [17,18,19] and hydration with steam [20,21,22] improve the CO2 sorption capacity to some extent during subsequent cycling. Interestingly, thermally pretreated limestone sometimes shows the effect of self–activation during cycling, i.e., the sorption capacity increases during cycling [9,17]. Although positive results were obtained, these tests have frequently used regeneration in a 100% nitrogen atmosphere without taking into account the effects from CO2 on sintering. However, it is important to highlight the fact that, when dolomite and limestone are calcined in a CO2–containing atmosphere, sintering processes occur [23,24,25]. These drawbacks counteract the advantage of the low cost of naturally occurring sorbents [26,27]. Alternatives to Ca–based materials are solid sorbents based on both alkali–promoted alumina, hydrotalcites, and some other Mg–based material [28,29]. The operation temperatures of these materials are in the range of 300–600 °C.
The sorbent materials initially chosen for proof–of–concept in the CaL process had high capacity, but low mechanical stability. To overcome the abovementioned limitations of the solid sorbents that hamper the exploitation of sorption–enhanced processes, the research community has focused its efforts on the development of synthetic materials (or, alternatively, properly modified natural minerals) able to keep a very high CO2 uptake capacity over a higher number of sorption/regeneration cycles and compatible with the use in a fluidized bed reactor. The authors in [30] investigated the effects of thermal pretreatment on a naturally occurring sorbent to enhance the stability of the modified sorbent. In addition to the attempts to modify naturally occurring minerals to improve their properties, there is also the option to develop completely new synthetic sorbents with tailored properties. Several sorbents based on CaO have been synthesized, including high surface precipitated calcium carbonate [31] mixed oxides with the formula Ca0.9M0.1Ox, where M = Cu, Cr, Co, Mn [32]; CaO sorbents derived from organic salt precursors [33]; CaO doped with Cs [34]; sorbents derived from calcium lignosulphonate [35] or sorbents based on Na2CO3 or NaCl [14,36]; CaO–based sorbents using calcium aluminate (Ca12Al14O33) as a stable matrix [9,37,38]; and CaO–based sorbents using calcium titanate (CaTiO3)–based perovskite as binder [39], which showed good stable CO2 uptake capacity during cycling tests.
The aim of this paper was to further investigate Ca–based sorbent materials using calcium zirconate (CaZrO3) perovskite as binder. The new CaO–based material was tested under relevant conditions in several multi–cycle TG–DTA tests and characterized by SEM, XRD, and BET analyses.

2. Materials and Methods

All the chemical reagents were purchased from Merck Italy and used as received. Samples were prepared using the auto–combustion method, i.e., stoichiometric amounts of metal nitrate (Ca(NO3)·H2O and ZrO(NO3)2·δH2O) and glycine (NH2CH2COOH) as fuel with NO 3 2 Glycine = 0.9 were dissolved in H2O. The temperature of the solution was measured with a type K thermocouple (RS–PRO, Italy). At the beginning, the temperature was increased to 80 °C, favoring the H2O evaporation to trigger the auto–combustion. Then, the temperature was gradually increased with a ramp of 15 °C min−1 up to 250 °C. After a short time, which increased from ~3 to ~10 min as the molar ratio between Ca and Zr decreased, the self–combustion occurred with a rapid flame propagation that ended after a few minutes, producing very fine and voluminous powders that were calcined in air at 900 °C for 5 h to remove carbonaceous impurities. The samples investigated in this work were named as follows: CaZrO3 (CZ), 40 wt% CaO–CaZrO3 (CCZ40), 60 wt% CaO–CaZrO3 (CCZ60), and 80 wt% CaO–CaZrO3 (CCZ80).
XRD measurements were carried out on a RIGAKU SmartLab system (RIGAKU supplier: Assing spa, Italy) equipped with a Cu Kα (λ = 0.15418 nm) source for powder materials. The reference intensity ratio (RIR) method was used for quantitative phase analysis [40]. Because all phases were identified, no preferred texturization or amorphous phase was detected, and all RIR values were known for each phase, quantitative analysis was then permitted without adding any standard to the unknown specimen. The crystallite size was estimated from the CaZrO3 (121), CaO (111), and Ca(OH)2 (101) reflection using the Scherrer Equation (2), where the shape factor K is equal to 0.9, λ is the wavelength of the X–ray radiation used, β is the full width at half maximum intensity (FWHM), and θ is the Bragg angle of the corresponding reflection:
d ( nm ) = Κ λ / ( β · cos θ   )
N2 adsorption/desorption isotherms were measured at −196 °C using a Micromeritics ASAP 2020 adsorption apparatus (Micromeritics supplier: Alfatest srl, Italy). Samples were degassed at 350 °C under vacuum for 4 h before analysis. The specific surface area (SSA) was determined using the BET equation method in the linear range of relative pressure (p/p0) of 0.07–0.3. The pore–size distributions were calculated from desorption branches using the Barrett–Joyner–Halenda (BJH) method. The total pore volume was estimated to be the liquid N2 volume at relative pressure p/p0 of 0.95.
Morphological characterization of sorbent materials was performed by scanning electron microscopy (SEM) using a Tescan Vega 3 with LaB6 filament (Tescan supplier: Assing spa, Italy).
Sorbent analysis were carried out in a Netzsch STA 449C Jupiter thermo–microbalance–based simultaneous thermogravimetric/differential scanning calorimetry (TG–DSC) system (with integrated mass flow controller TG resolution: 0.1 µg) (Netzsch, Germany). An amount of sorbent (ranging from 20 to 30 mg) was placed in an alumina crucible. Before the carbonation test, each sorbent was first pretreated up to 900 °C at a ramp of 10 °C·min−1 under 100% Ar gas flow for 20 min in order to remove all impurities and pre–adsorbed CO2. The CO2 uptake capacity of the sorbents was tested under mild and severe conditions as follows:
(a) under mild conditions, the carbonation occurred at 650 °C for 20 min in 20 vol% CO2 in Ar (CO2 flow of 20 cm3·min−1 and Ar flow of 80 cm3·min−1) followed by the calcination step under 100% Ar gas flow for 20 min at 900 °C. All heating and cooling procedures of the experiment were performed in Ar flow of 100 cm3/min with the heating or cooling rate of 10 °C·min−1.
(b) under severe conditions, the carbonation occurred at 650 °C for 20 min in 20 vol% CO2 in Ar (CO2 flow of 20 cm3·min−1 and Ar flow of 80 cm3·min−1) followed by the calcination step under 80 vol% CO2 (CO2 flow of 80 cm3·min−1 and Ar flow of 20 cm3·min−1) for 20 min at 900 °C. After the calcination step, the cooling procedures of the experiment were performed in Ar flow of 100 cm3/min with cooling rate of 10 °C·min−1.
The performance and stabilities of the sorbents were evaluated through 12 carbonation–calcination cycles. The CO2 uptake per gram of sorbent, Cn, and the CaO conversion (%), Xn, were calculated according to Equations (3) and (4):
C n = m m a x n m m i n n m m i n n
X n = C n η × M C a O M C O 2 × 100
where m m a x n is the mass of the sorbent at the end of cycle n at 650 °C under mild and severe conditions or at 850 °C during the subsequent ramp temperature under severe conditions, m m i n n is the initial mass of the sorbent at cycle n at 650 °C under mild and severe conditions, M C a O is the molecular weight of CaO, M C a C O 3 is the molecular weight of CaCO3, and finally η is the CaO mass fraction of the sorbent.

3. Results and Discussion

3.1. Sorbent Characterization

3.1.1. X–Ray Diffraction Characterization of the As–Prepared Sorbents

The X–ray diffraction patterns of samples calcined at 900 °C are shown in Figure 1 and the main crystalline phases are reported in Table 1.
The CZ sample, containing a stoichiometric ratio between Ca and Zr, consisted of a perovskite phase with orthorhombic symmetry characteristic of CaZrO3 oxide (JCPDS card no. 35–0790). However, the presence of impurity phases, such as Ca0.15Zr0.85O1.85 (JCPDS card no. 26–0341), CaO (JCPDS card no. 37–1497), Ca(OH)2 (JCPDS card no. 01–1079), and CaCO3 (JCPDS card no. 47–1743), was also observed. As Ca content increased, the intensity of the CaZrO3 perovskite phase decreased and the diffraction peaks became wider, suggesting the progressive decrease of the crystallite size. In addition to the perovskite phase, CCZ40 and CCZ60 samples showed mainly peaks attributed to the CaO and Ca(OH)2 phases, whereas the CCZ80 sample showed principally peaks of Ca(OH)2. The presence of the Ca(OH)2 phase, which originated from the reaction of CaO with ambient humidity during material storage and handling, reflects the high surface reactivity of these mixed oxides. The high reactivity with the ambient air was also highlighted by the formation of CaCO3, which was 9.5% of the phases in CCZ80. However, Ca(OH)2 and CaCO3 were completely converted to CaO during the samples’ preheating step at 900 °C (see the TG results in Figure 2). As reported in Table 1, the crystalline size, estimated by the Scherrer equation, of CaZrO3 perovskite decreased progressively from 63.9 nm to about 32 nm from CZ to CCZ80 because the increased amount of calcium species reduced the sintering of CaZrO3 during sample calcination. The crystalline size of Ca(OH)2 progressively decreased from 16.0 nm in CCZ40 to 11.2 nm in CCZ60 samples; similarly, CaO decreased from 35.5 nm to 31.2 nm for CCZ40 and CCZ60 samples, respectively. Therefore, the progressive increase of the Ca/Zr ratio during the synthesis generates crystallites of small dimensions.

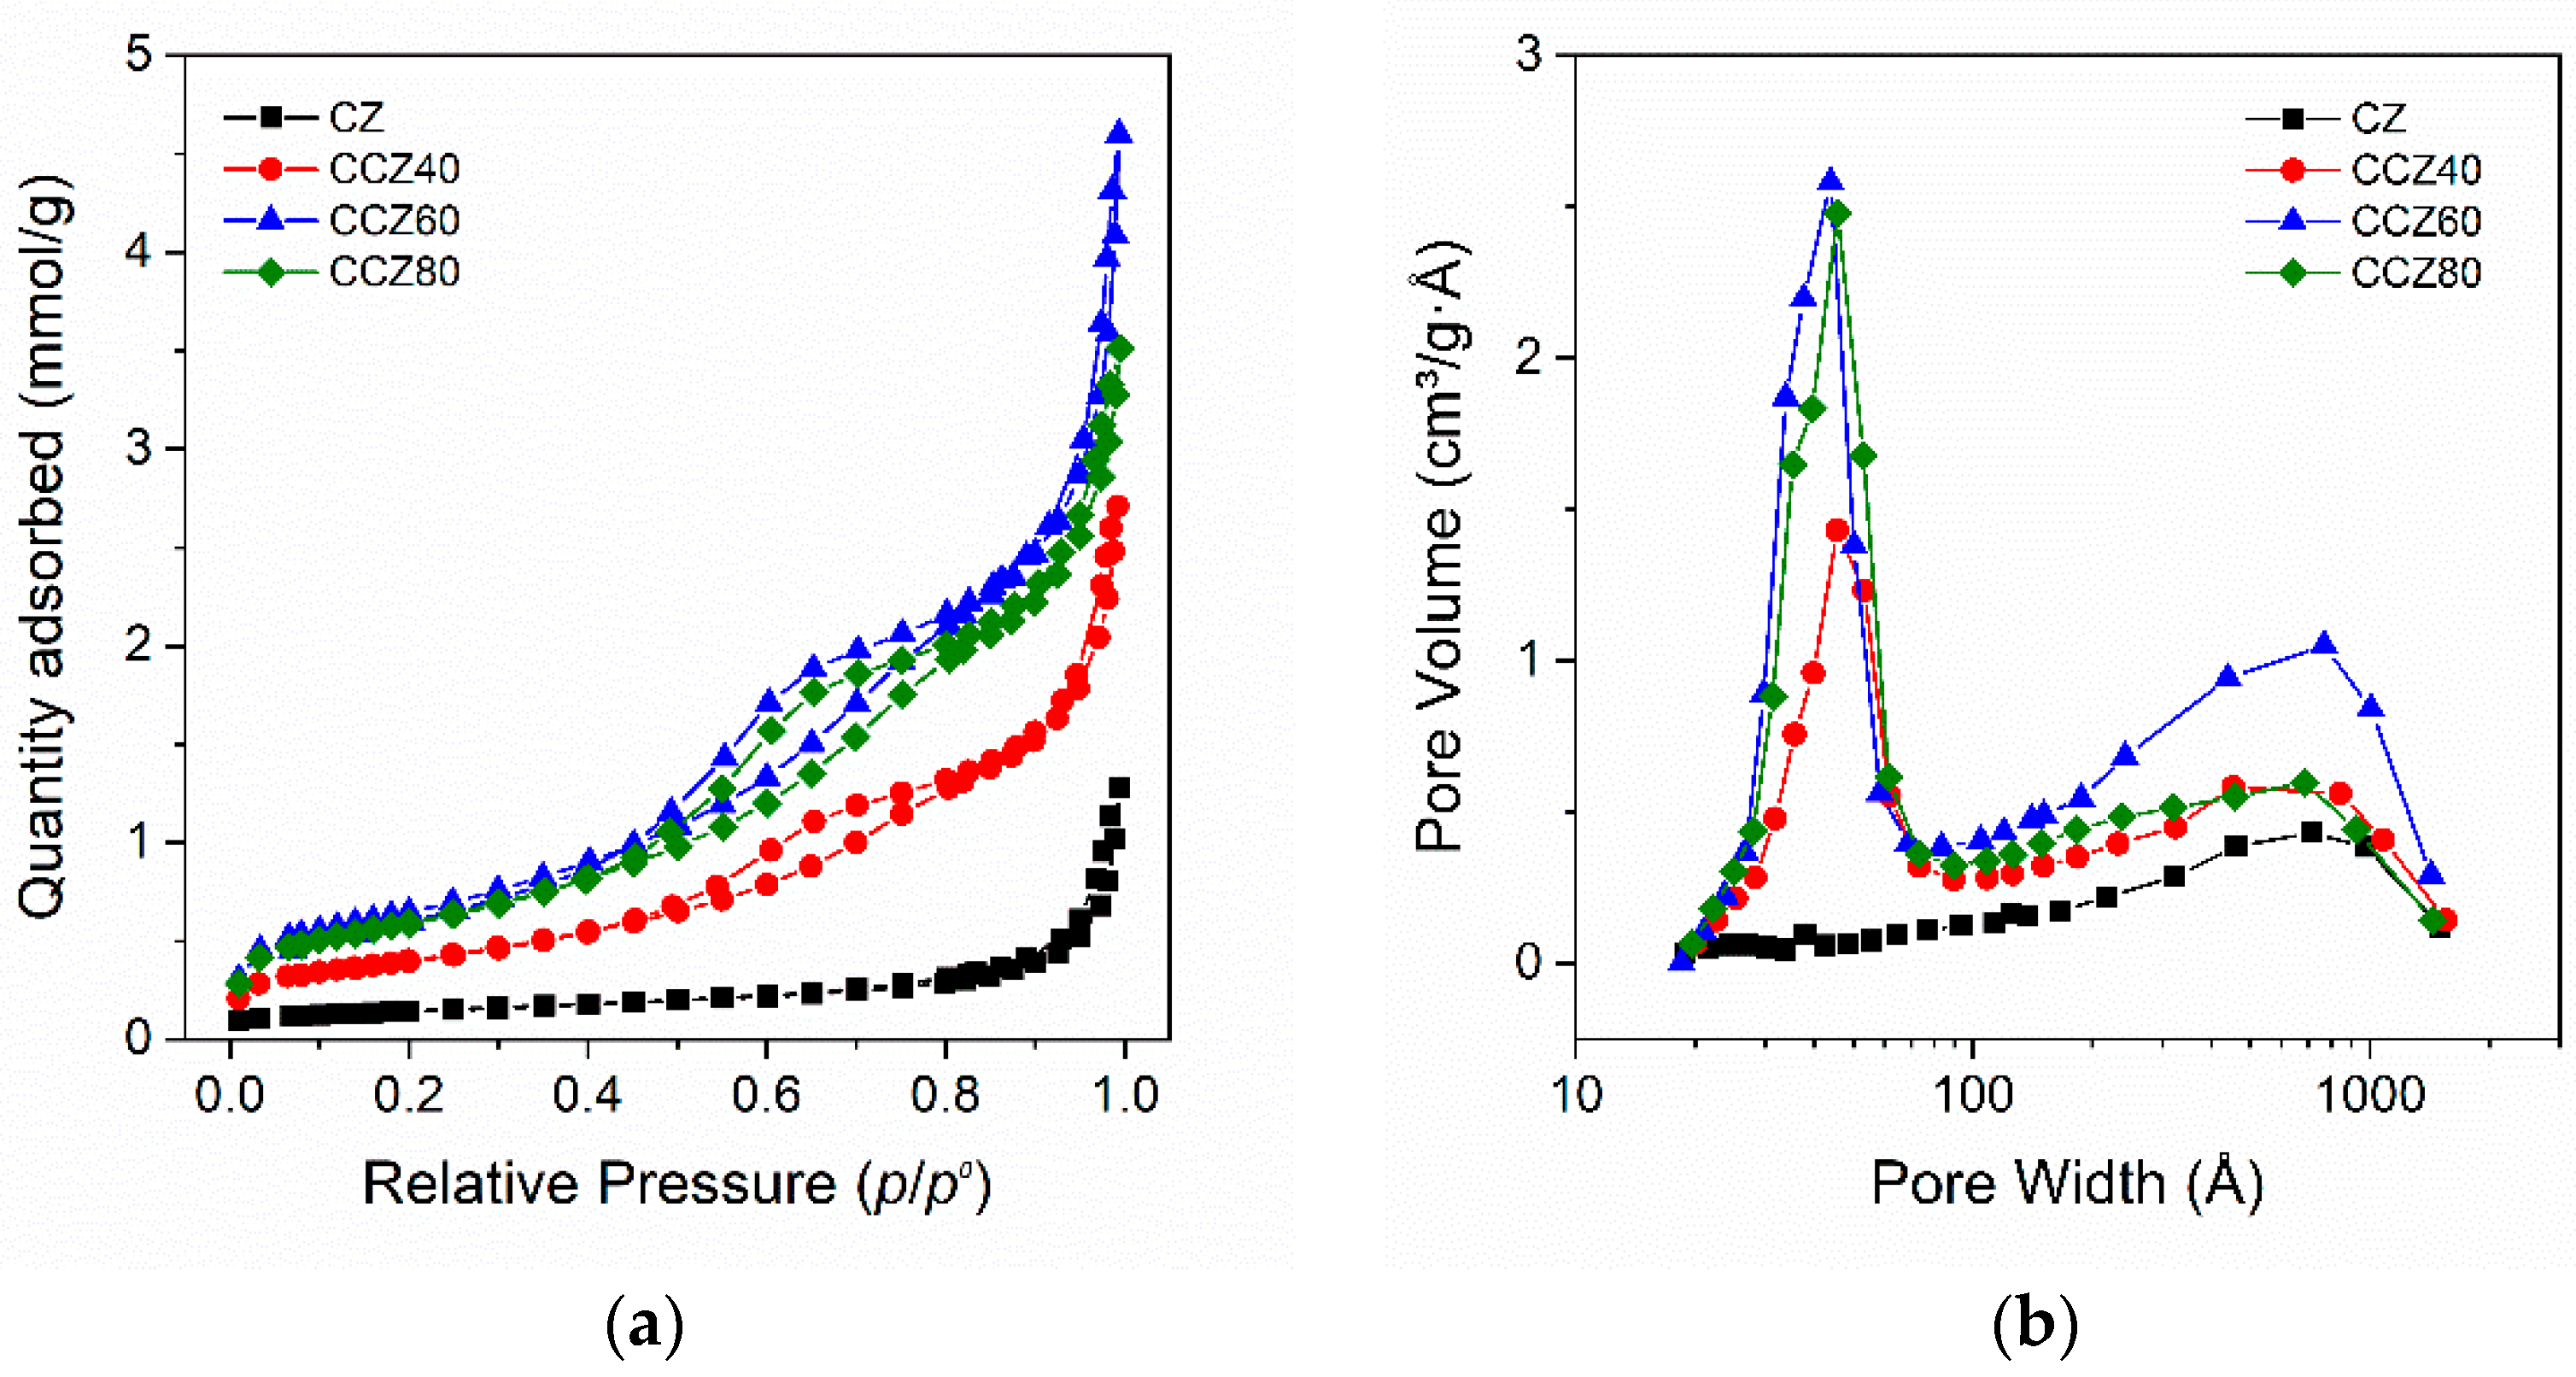
3.1.2. Textural Characterization of the As–Prepared Sorbents

The N2–adsorption/desorption isotherms and the corresponding pore–size distribution (BJH method) of as–prepared sorbents are shown in Figure 2, and the main textural properties are compiled in Table 1. According to the empirical classification given by the International Union of Pure and Applied Chemistry (IUPAC) [41], CZ belonged to a Type II isotherm (Figure 2a) of macroporous material, characterized by unrestricted multilayer adsorption. At pressure higher than p/p° ~0.8, the absorption and desorption isotherms showed nearly vertical shapes with a negligible hysteresis loop, assigned to the condensation on mesopore and macropore. The pore–size distribution (PSD) calculated using the BJH method (Figure 2b) showed a weak curve with a maximum around ~710 Å assigned to macropores. The specific surface area (SSA) was 11.2 m2·g−1 and the pore volume was 0.043 cm3·g−1.
The N2–absorption/desorption isotherms of the CCZ samples were significantly different from those of the CZ perovskite. They were classified as a Type IV isotherm (Figure 2a), given by mesoporous materials, that possess a hysteresis loop. The initial part of the absorption isotherms increased up to the low pressure of p/p0 < 0.1, due to monolayer–multilayer adsorption as in the case of the Type II isotherm. The lower and upper branches of the hysteresis loop were in the range of p/p0 = 0.5–0.8 and the hysteresis was classified, accordingly to IUPAC, as type H1 associated to porous materials with cylindrical–like pores or agglomerates of approximately uniform spheres. As in the case of the CZ sample, at pressure higher than p/p0 ~0.8, the absorption and desorption isotherms showed nearly vertical shapes due to the condensation on macropores and mesopores, suggesting also the presence of a Type II isotherm part. The PSD calculated using the BJH method (Figure 2b) showed two peaks, one at around ~44 Å assigned to the mesopores, and another with a maximum around ~710 Å assigned to the macropores.
The SSA increased from 32.4 m2·g−1 to 52.7 m2·g−1 on the CCZ40 and CCZ60 samples, respectively, whereas it decreased to 48.0 m2·g−1 in the CCZ80 sample with the highest content of calcium, suggesting that the progressive amount of the Ca(OH)2 and CaO species did not continuously increase the SSA of the oxides. Accordingly, the pore volume also showed a similar trend that increased from 0.095 cm3·g−1 up to 0.160 cm3·g−1 on the CCZ40 and CCZ60 samples, respectively, but decreased to 0.123 cm3·g−1 on the CCZ80 one. It is noteworthy that the CZ perovskite shows a unimodal distribution of pores with the maximum located at 800 Å. When the perovskite is used as spacer, the porosity of the sorbent shows a bimodal distribution—one peak is still located at 800 Å, whereas the second peak is at 50 Å. The pore volume increases with the increase of CaO content.

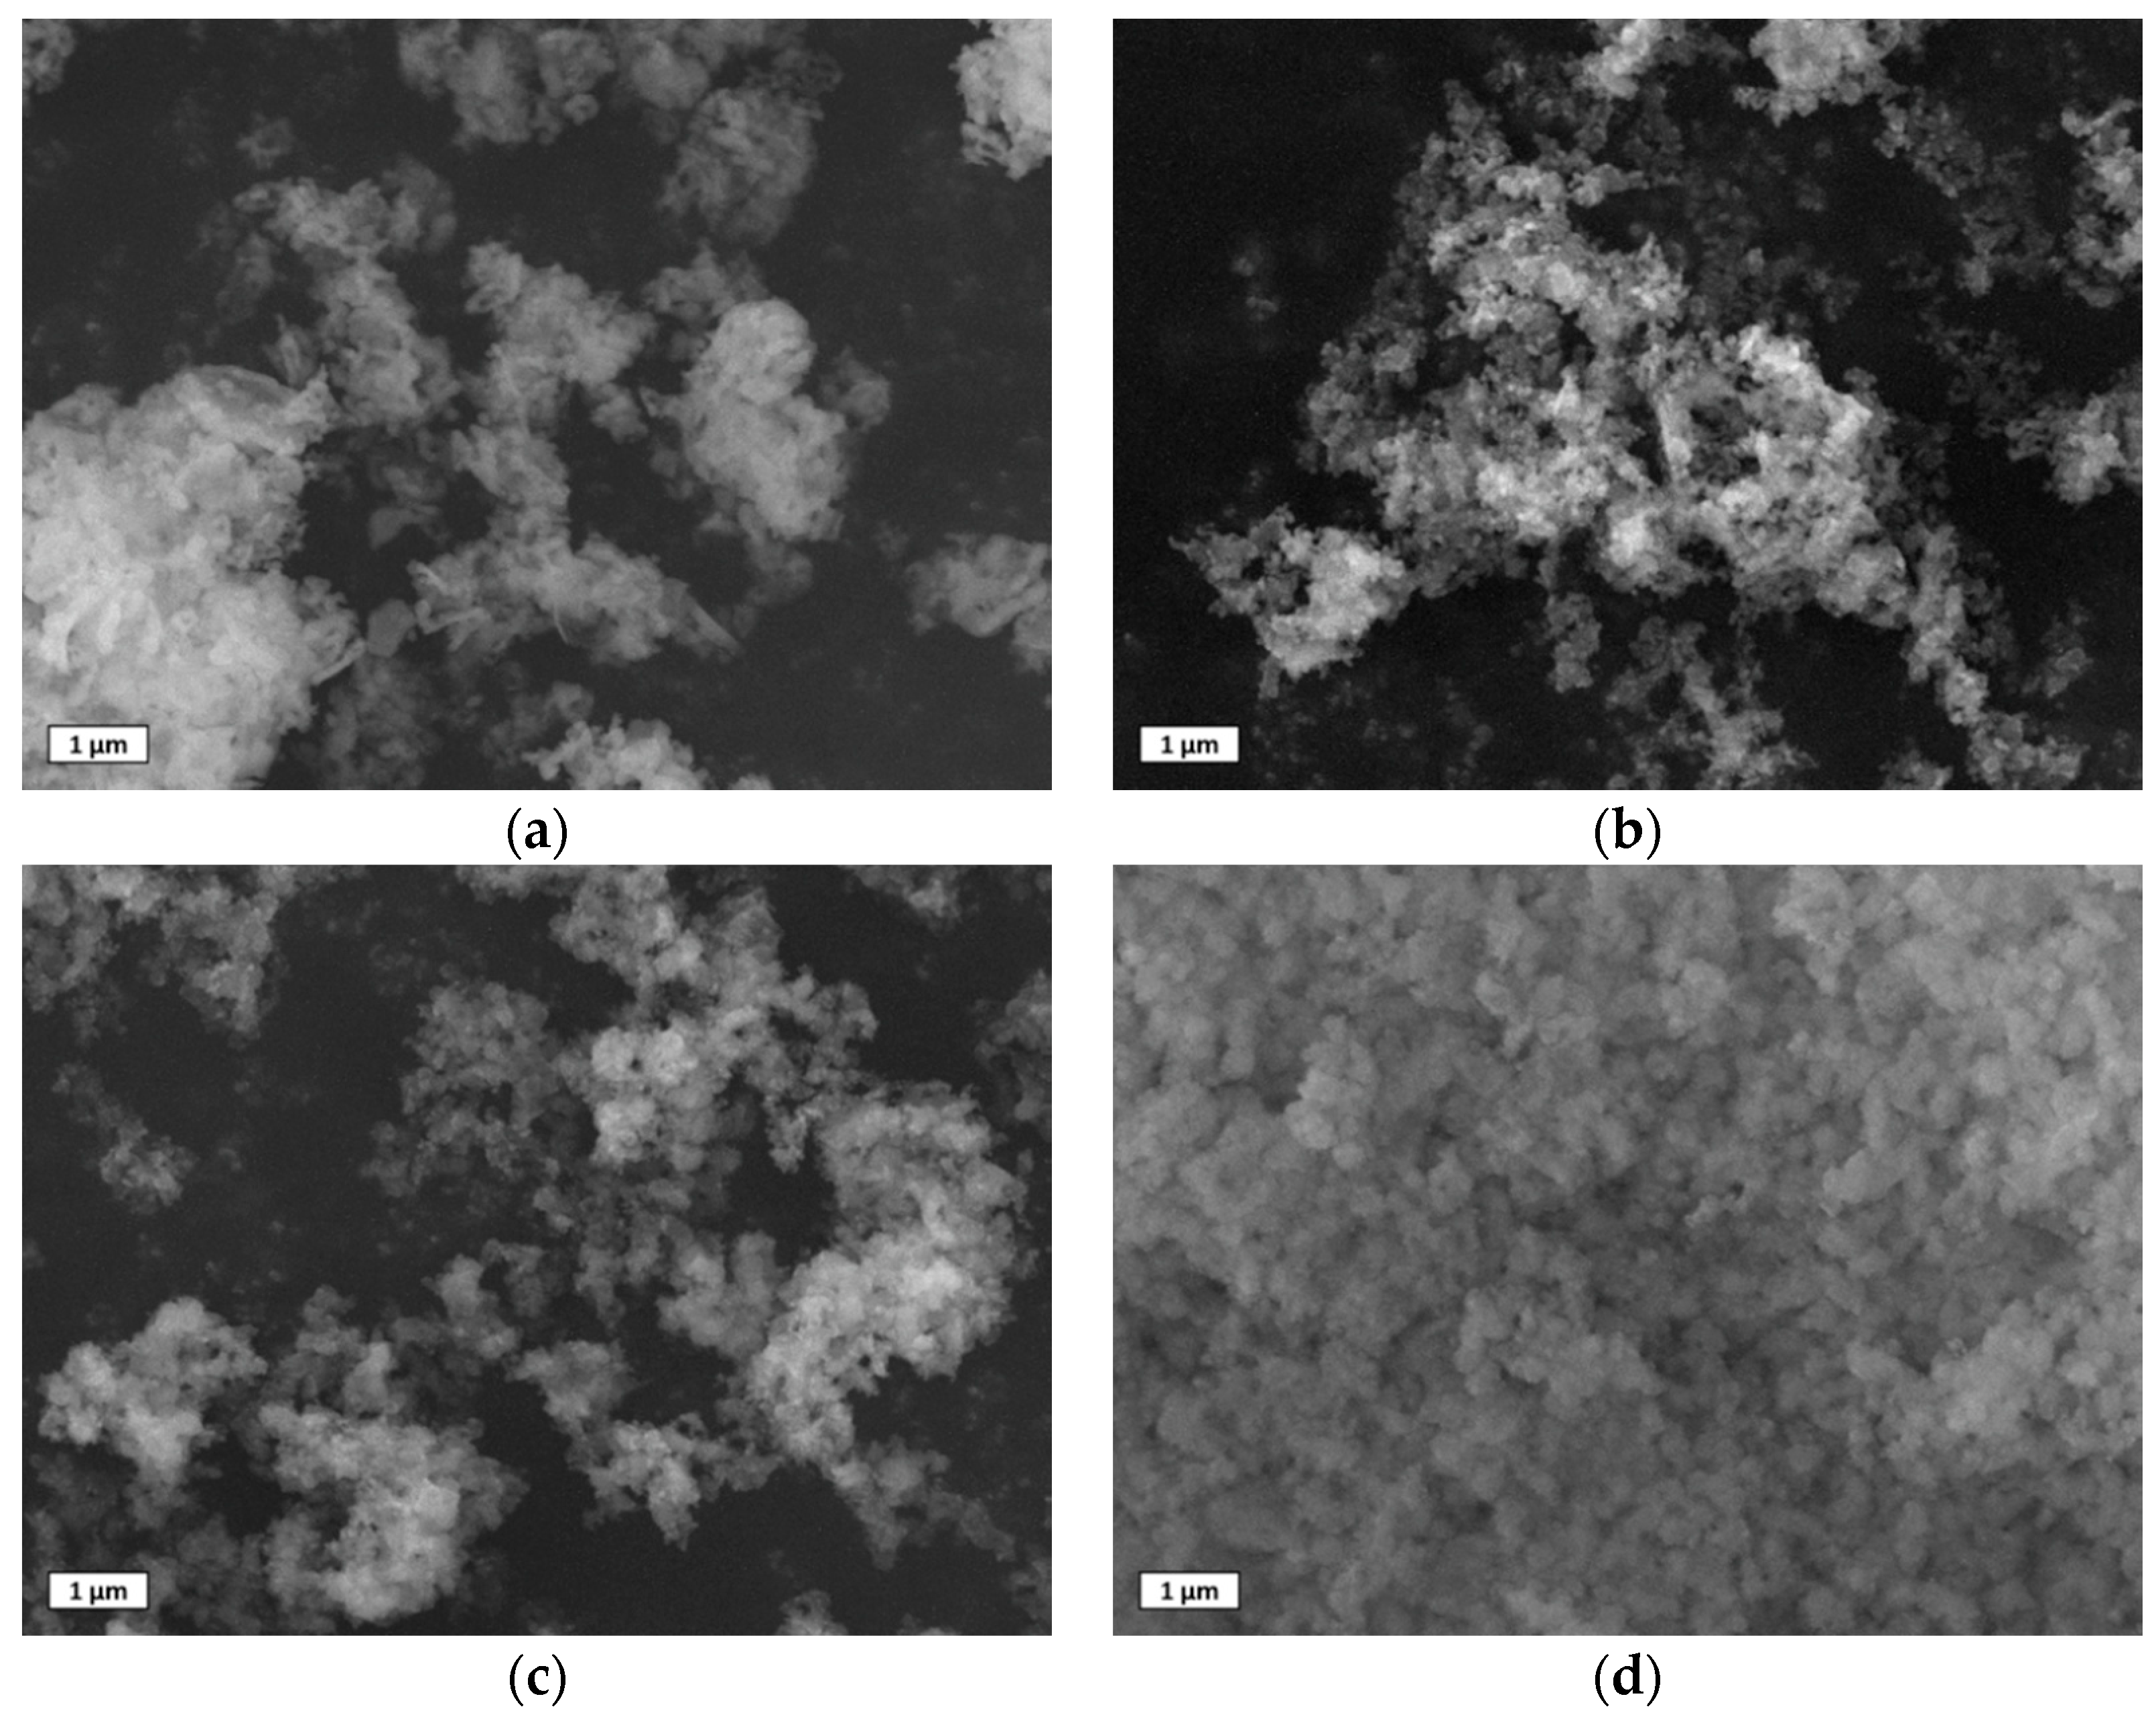
3.1.3. SEM Images of the As–Prepared Sorbents

The characteristic morphology of the as synthetized sorbents was observed by SEM images and the main results are shown in Figure 3. The CZ powders showed the typical morphology of perovskite synthetized using the auto–combustion method, using glycine as fuel, with aggregated particles having several dimensions with an average size of 227 ± 118 nm, with different shapes, i.e., spherical, elongated (similar to tetragonal), and planar. The addition of calcium, forming the CCZ samples, substantially modified the morphology. The CaZrO3 particles showed a spherical morphology deposited on much larger particles with three–dimensional polygon shapes, partially attached to each other, assigned to CaO and/or Ca(OH)2 species. The number of CaZrO3 particles followed the sample order of CCZ40 > CCZ60 > CCZ80, decreasing, as expected, according to the higher Ca content compared to Zr. On the basis of the XRD analysis, the bigger particles consisted exclusively of Ca(OH)2 in CCZ80, whereas they were formed by Ca(OH)2 and CaO in the other samples. In particular, for CCZ40 the major phase was still constituted by Ca(OH)2, whereas in CCZ60 there was an opposite trend with the CaO phase double with respect to Ca(OH)2. As shown in Figure 3, CCZ40 and CCZ60 showed a similar morphology with partially aggregated particles, whereas the CCZ80 sample showed more particle agglomeration.
The average size of the CaO, Ca(OH)2, and CaZrO3 particles measured on the as–prepared CCZ samples is reported in Figure 4. The average size of the CaZrO3 particles was 79 ± 27 > 48 ± 10 < 53 ± 14 nm for the CCZ40, CCZ60, and CCZ80 samples, respectively. The size of the bigger particles attributed to CaO and Ca(OH)2 species showed a similar trend. In fact, it was 485 ± 69 nm > 255 ± 53 nm < 366 ± 99 nm for the CCZ40, CCZ60, and CCZ80 samples, respectively. Therefore, the particles of all the species first decreased and then increased as the calcium content increased. SEM images appear to be in agreement with BET results, where the largest surface area was found for the CCZ60 sample.

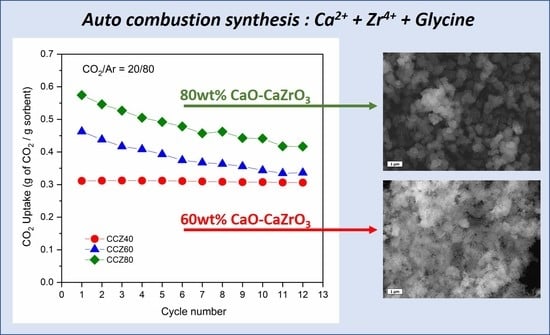
3.2. CO2 Capture Performance

Figure 5 show the results of the thermogravimetric/differential thermal analysis (TG/DTA) obtained in Ar flow on freshly prepared sorbents before the carbonation and calcination cycles; the results are also summarized in Table 2 In the temperature range 350–500 °C, the TG curves of the CCZ40, CCZ60, and CCZ80 samples showed a weight loss of 5.9%, 13.2%, and 17.6%, respectively, accompanied by a strong endothermic peak reported on the DTA curve, attributed to the decomposition of calcium hydroxide to calcium oxide. At higher temperatures, between 600 and 750 °C, a second endothermic peak was observed, which was associated with a weight loss equal to about 2.3% (CCZ40), 4.1% (CCZ60), and 4.6% (CCZ80) related to the decomposition of calcium carbonate to calcium oxide. For temperatures above 800 °C, there were no variations in weight or heat flows, indicating that the phases of the samples were stable.
The cyclic CO2 capacity under mild conditions of the CCZ samples is shown in Figure 6. The CO2 uptake of CCZ40 remained constant for 12 cycles with about 0.31 grams of CO2 uptake per gram of sorbent, a value closer to the theoretical one, which corresponded to almost 100% of CaO conversion. The initial CO2 uptake of the other samples increased with the CaO amount, reaching 0.47 and 0.57 g of CO2 per gram of sorbent for the CCZ60 and CCZ80 samples, respectively. The corresponding initial CO2 conversion was ~100% for CCZ60, whereas it was lower, about ~90%, for the CCZ80 one. Contrary to the stability found for the CCZ40 sample, the other samples showed a decrease of the CO2 uptake per gram of sorbent after 12 cycles. In fact, the final CO2 uptake was 0.34 and 0.42 g of CO2 per gram of sorbent for the CCZ60 and CCZ80 samples, respectively. The calculated loss of CaO conversion was about −27% for both CCZ60 and CCZ80 samples.
Given its promising stability, the CCZ40 sample was analyzed under severe conditions. A comparison of the first and last carbonatation steps observed by TG analysis is reported in Figure 7. The carbonation reaction at 650 °C showed a typical two–step profile, i.e., a rapid weight increase, after a few minutes, attributed to the fast gas–solid reaction, followed by a much slower weight increase due to the diffusion resistance of CO2 gas to reach CaO across the as–formed CaCO3 shell. As mentioned before, under mild conditions the weight gain at 650 °C remained very stable. In fact, only a small increase in the diffusion–controlled step with the cycle number was observed. During the temperature ramp in Ar, all cycles showed a rapid decrease in weight that terminated at about 780 °C.
In the isotherms at 650 °C, the first cycle under severe conditions showed a weight increase very similar to that found under mild conditions, with a rapid increase in the mass of CaCO3. Contrary to what was observed under mild conditions, the presence of a high partial pressure of CO2 during the temperature ramp avoided the decomposition of CaCO3, and the mass remained constant up to about 890 °C; when it reached 900 °C, the rapid decarbonation CaCO3 → CaO + CO2 occurred, accompanied by a mass decrease. However, the last cycle showed a significantly different trend. In the isotherm at 650 °C, the formation of CaCO3 decreased markedly due to the increased diffusion resistance. In the subsequent temperature ramp, the formation of CaCO3 increased rapidly again, because it was kinetically favored, returning to a similar weight gain. The CO2 uptake and the corresponding CaO conversion (%) during 12 cycles under severe conditions are reported in Figure 8. In carbonation isotherms at 650 °C, a decrease in performance was observed and the final CO2 uptake and the CaO conversion (%) were equal to 0.26 grams of CO2 per gram of sorbent and 82%, respectively, with a deactivation of 18%. However, it should be noted that after four cycles the activity decayed very slowly, tending to stabilize. Furthermore, it was noted that in the subsequent temperature ramps there was a greater overall stability as shown by the stable CO2 uptake and CaO conversion at the representative temperature of 850 °C, even at a higher CO2 concentration of 80 vol%.

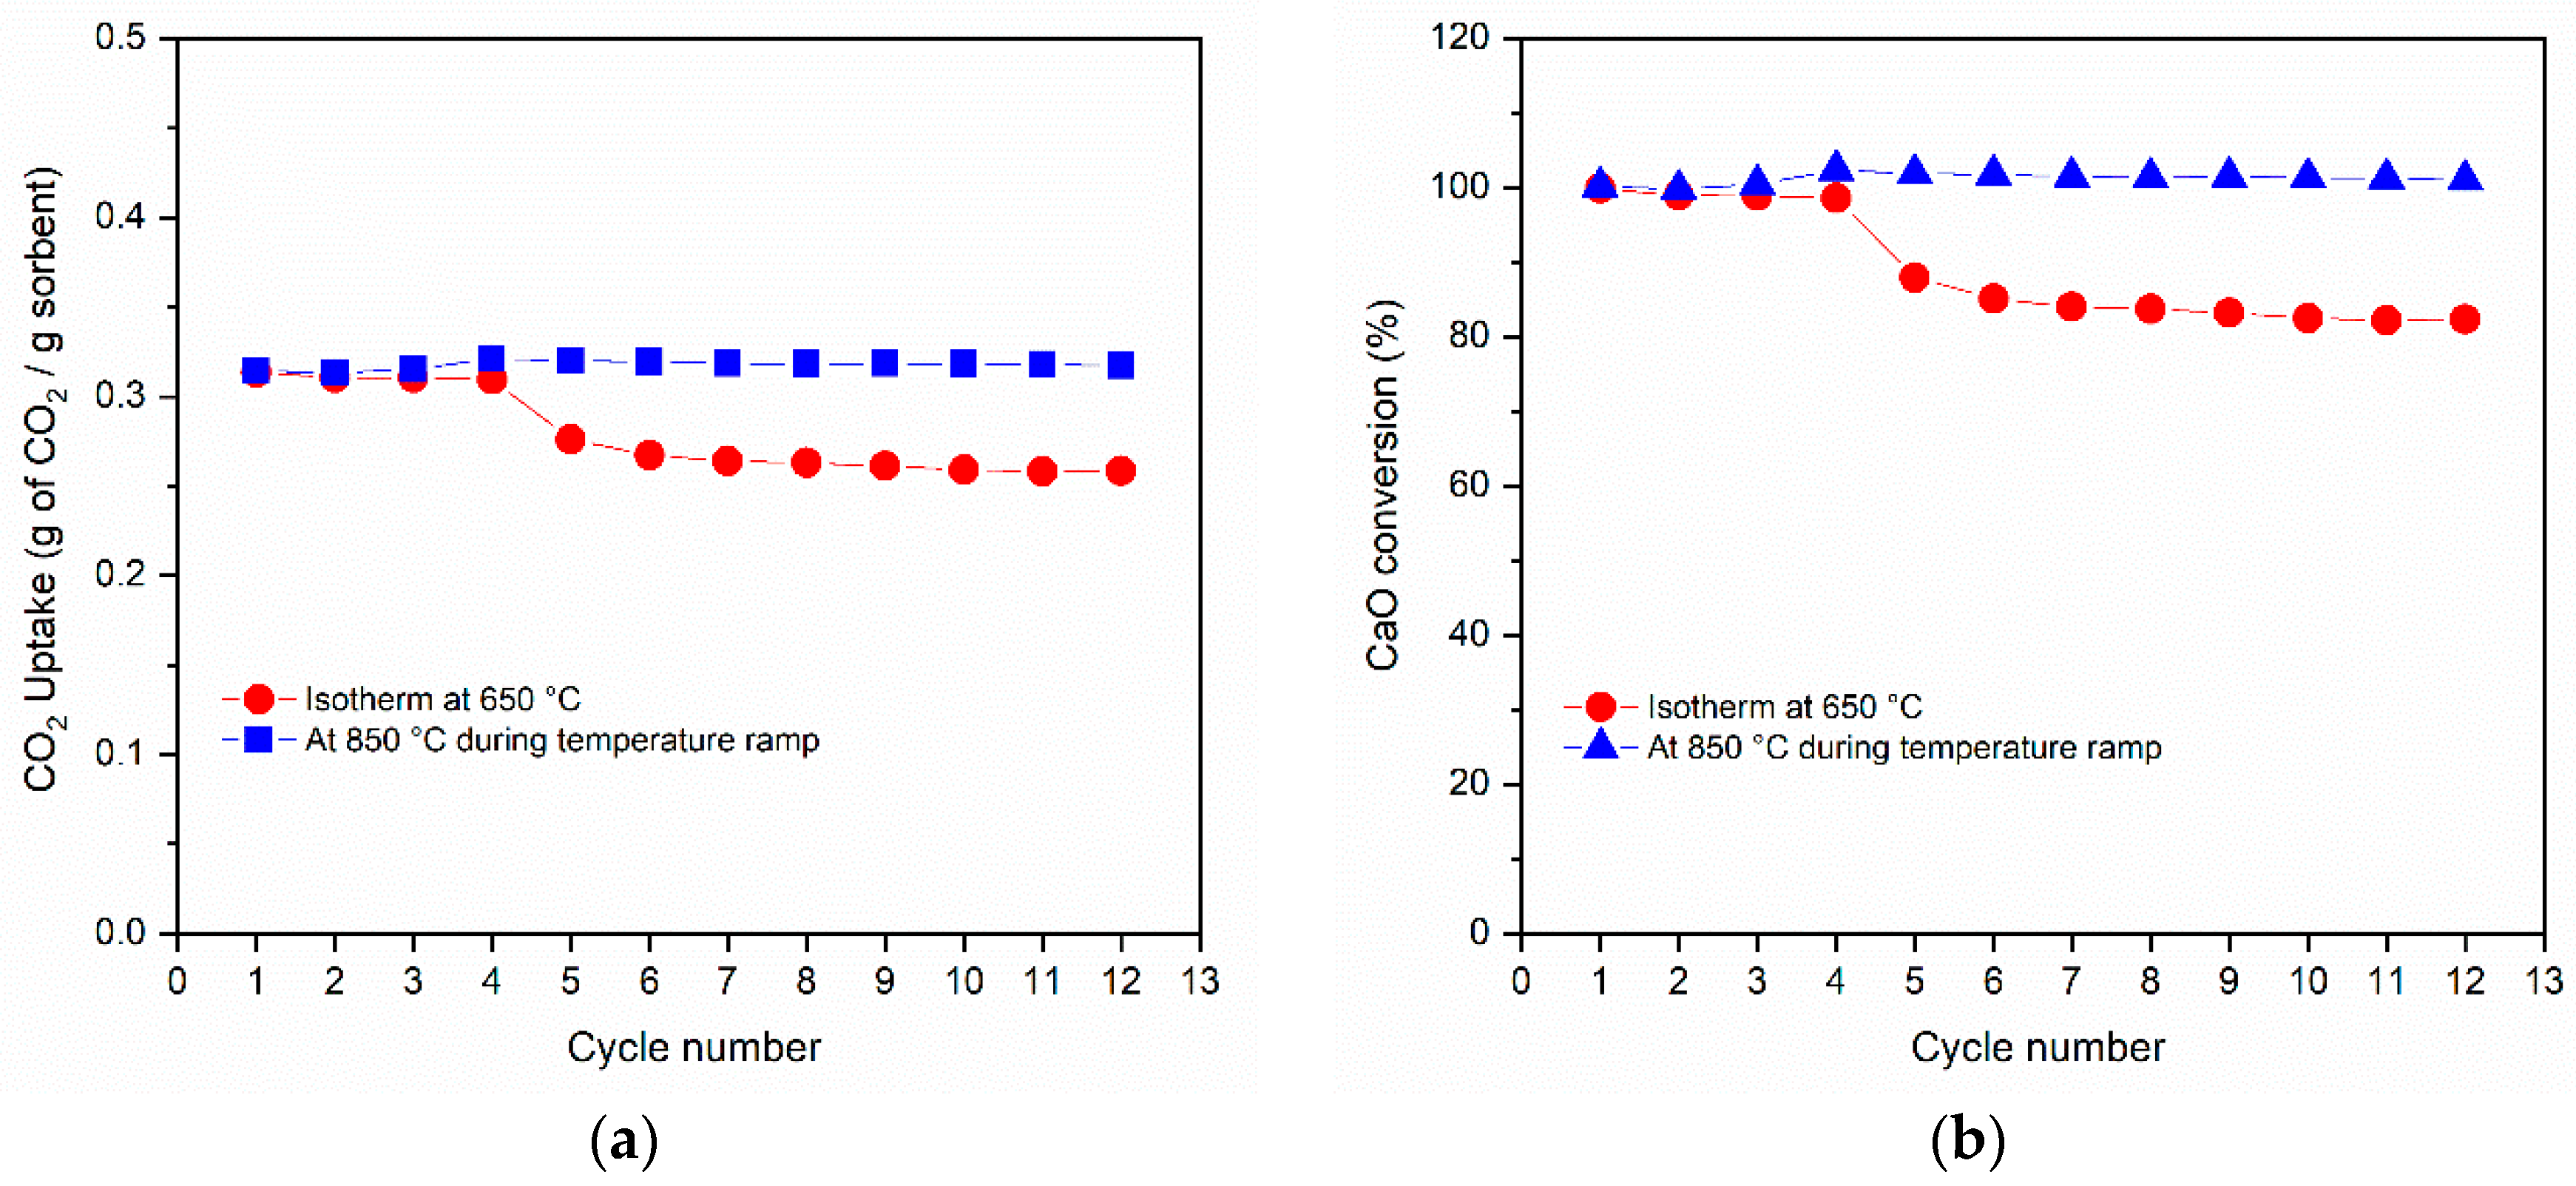
3.3. Shrinking Core Model

The gas–solid reaction for CaO carbonatation was analyzed according to the well–known shrinking core spherical grain model described in Equation (5) in its derivative form and in Equation (6) in its integral form. The variable X is the conversion of CaO to CaCO3 and r0 is the grain model reaction rate. When the reaction is under the kinetic regime, the diffusion effects are negligible, and Equation (5) is represented by a straight line with slope r0:
d X d t ( 1 X ) 2 3 = 3 r 0
[ 1 ( 1 X ) 1 3 ] = r 0 × t
The [ 1 ( 1 X ) 1 3 ] against time curves together with the straight line representing the apparent kinetic regime for the first and last carbonatation steps under mild and severe conditions are reported in Figure 9. At the beginning of the experiments, the solid sample can be regarded as an agglomerate of non–porous grains reacting in absence of both extra–particle and intra–particle diffusional effects. Thus, the progress of the reaction, X, in the investigated sample can be examined by the shrinking core spherical grain model. As expected in the first cycle, a reaction rate r0, corresponding to 0.12 and 0.13 min−1, was obtained under mild and severe conditions, respectively. After 12 cycles under mild conditions, the reaction rate did not decrease and r0 remained as the same value as the first one, i.e., 0.12 min−1. The linear phase seems to hold within the first four minutes of carbonation when the sorbent is calcined under mild conditions. Conversely, operating under severe conditions entailed a significant decrease in the reaction rate r0 to 0.06 min−1. The linear behavior of carbonation holds in the first three minutes when the sorbent is regenerated under sever conditions. As the carbonation proceeds, the solid reagent is coated by a non–porous carbonate layer. The carbon dioxide is transported via solid state diffusion and the overall process can be controlled by the slower diffusion process, and the reaction intensity decreases (see Figure 9).

3.4. SEM Images of Used Sorbents

The characteristic morphology of the used sorbents was observed by SEM images, and the main results are shown in Figure 10. The CA sample, after the CO2 capture and release cycles, showed characteristic morphologies, also detected in the synthesized sample. However, the main morphology corresponded to aggregated particles of elongated and planar shape. The average length was 371 ± 129 nm, greater than that measured on the as–prepared samples, due to the overall particle sintering. The CCZ samples, after the calcium looping cycles, showed a significantly different morphology than that of the as–prepared samples. The amount of CaZrO3 particles decreased by increasing the CaO content, as expected, maintaining a similar spherical morphology in all the samples similarly to that of the freshly prepared samples. The particles were mainly attached to those of CaO in the CCZ60 and CCZ80 samples, while many particles were also dispersed and separated from those of CaO in the CCZ40 sample, which had the greatest amount of CaZrO3. After the calcium looping cycles, the main morphological difference was found in the particles constituted by the Ca(OH)2 and CaO phases. In fact, they became CaO particles with significantly larger dimensions with respect to the freshly prepared samples and with a main morphology of spherical or even cubic and tetragonal particles.
The average size of the CaO and CaZrO3 particles measured after calcium looping cycles on the CCZ samples is reported in Figure 11. As noted also in the freshly prepared CCZ samples, the size of the CaZrO3 particles had an inverse volcano trend in which the particles had the dimensions 79 ± 16 > 51 ± 9 < 66 ± 14 nm in the CCZ40, CCZ60, and CCZ80 samples, respectively. It is interesting to note that the dimensions measured both in the fresh samples and after the calcium looping cycles were similar, suggesting that the CaZrO3 particles were stable towards sintering. On the contrary, the CaO particles were significantly larger than those of CaO and Ca(OH)2 present in the fresh samples. The particle size of CaO increased proportionally to the Ca content in the samples, being 525 ± 101 < 588 ± 166 < 604 ± 137 nm in the CCZ40, CCZ60, and CCZ80 samples, respectively.

4. Conclusions

CaZrO3 was introduced into CaO–based sorbents to increase stability during repeated CO2 capture/release cycles. The CaO–CaZrO3 sorbents with different CaO contents (40, 60, and 80 wt%) were synthesized using the self–combustion method. The calcium looping process was performed under mild and severe conditions. Under mild conditions (decarbonation in pure Ar), the CO2 capture capacity increased with the CaO content. After 12 cycles, the most stable sorbent was the one with 40 wt% of CaO (CCZ40), which maintained a CaO conversion to CaCO3 nearly 100% and a CO2 uptake of 0.31 g CO2/gsorbent. The CCZ40 sample showed high performance even operating under severe conditions (decarbonation under 85% CO2) with a decrease of the CO2 uptake from 0.31 g CO2/gsorbent to 0.26 g CO2/gsorbent. This experimental result confirms the negligible diffusional resistance of CO2 throughout the particle and the good gas–solid contacting even at the inner core of the sorbent particle. SEM images of the used sorbent showed larger micrometric CaO aggregates surrounded by nanometric CaZrO3 particles. The best stability was attributed to the correct balance between CaO, the active component, and the CaZrO3 nanoparticles. The experimental data gathered from the thermogravimetric analyzer corroborated the adoption of the shrinking core spherical model for the interpretation of CaO conversion to CaCO3. A maximum reaction rate of 0.12–0.13 min−1 was evaluated during carbonation in the multi–cycling CO2 capture under mild conditions. The reaction rate evaluated at the 12th cycle decreased to 0.06 min−1 when the sorbent was regenerated under severe conditions.

Author Contributions

Conceptualization, I.L. and S.S.; materials synthesis, I.L.; XRD analysis, R.C.; BET analysis, I.L. and G.V.; TG–DTA analysis, M.R.M.; SEM analysis, L.D.S.; writing—original draft preparation, I.L. and S.S.; writing—review and editing the final version, I.L., S.S., R.C., and M.L.G. All authors have read and agreed to the published version of the manuscript.

Funding

This research was funded by the Italian Ministry of Economic Development, under the project SFERO (Systems for Flexible Energy via Reuse of carbOn), grant number B09Y.

Conflicts of Interest

The authors declare no conflict of interest.

References

  1. Abanades, J.C.; Anthony, E.J.; Lu, D.Y.; Salvador, C.; Alvarez, D. Capture of CO2 from combustion gases in a fluidized bed of CaO. AIChE J. 2004, 50, 1614–1622. [Google Scholar] [CrossRef]
  2. Bhatia, S.K.; Perlmutter, D.D. Effect of the product layer on the kinetics of the CO2–lime reaction. AIChE J. 1983, 29, 79–86. [Google Scholar] [CrossRef]
  3. Stendardo, S.; Di Felice, L.; Gallucci, K.; Foscolo, P.U. CO2 capture with calcined dolomite: The effect of sorbent particle size. Biomass Convers. Biorefinery 2011, 1, 149–161. [Google Scholar] [CrossRef]
  4. Abanades, J.C.; Anthony, E.J.; Wang, J.; Oakey, J.E. Fluidized Bed Combustion Systems Integrating CO2 Capture with CaO. Environ. Sci. Technol. 2005, 39, 2861–2866. [Google Scholar] [CrossRef] [PubMed]
  5. Zhao, M.; He, X.; Ji, G.; Song, Y.; Zhao, X. Zirconia incorporated calcium looping absorbents with superior sintering resistance for carbon dioxide capture from in situ or ex situ processes. Sustain. Energy Fuels 2018, 2, 2733–2741. [Google Scholar] [CrossRef]
  6. Herce, C.; Cortés, C.; Stendardo, S. Computationally efficient CFD model for scale–up of bubbling fluidized bed reactors applied to sorption–enhanced steam methane reforming. Fuel Process. Technol. 2017, 167, 747–761. [Google Scholar] [CrossRef]
  7. Wang, W.; Li, Y.; Xie, X.; Sun, R. Effect of the presence of HCl on cyclic CO2 capture of calcium–based sorbent in calcium looping process. Appl. Energy 2014, 125, 246–253. [Google Scholar] [CrossRef]
  8. Stendardo, S.; Foscolo, P.U. Carbon dioxide capture with dolomite: A model for gas–solid reaction within the grains of a particulate sorbent. Chem. Eng. Sci. 2009, 64, 2343–2352. [Google Scholar] [CrossRef]
  9. Stendardo, S.; Andersen, L.K.; Herce, C. Self–activation and effect of regeneration conditions in CO2–carbonate looping with CaO–Ca12Al14O33 sorbent. Chem. Eng. J. 2013, 220, 383–394. [Google Scholar] [CrossRef]
  10. Berger, E.E. Effect of Steam on the Decomposition of Limestone1,1. Ind. Eng. Chem. 1927, 19, 594–596. [Google Scholar] [CrossRef]
  11. Wang, Y.; Lin, S.; Suzuki, Y. Limestone Calcination with CO2 Capture (II): Decomposition in CO2/Steam and CO2/N2 Atmospheres. Energy Fuels 2008, 22, 2326–2331. [Google Scholar] [CrossRef]
  12. Abanades, J.C.; Rubin, E.S.; Anthony, E.J. Sorbent Cost and Performance in CO2 Capture Systems. Ind. Eng. Chem. Res. 2004, 43, 3462–3466. [Google Scholar] [CrossRef]
  13. Gallucci, K.; Stendardo, S.; Foscolo, P.U. CO2 capture by means of dolomite in hydrogen production from syn gas. Int. J. Hydrogen Energy 2008, 33, 3049–3055. [Google Scholar] [CrossRef]
  14. Fennell, P.S.; Pacciani, R.; Dennis, J.S.; Davidson, J.F.; Hayhurst, A.N. The Effects of Repeated Cycles of Calcination and Carbonation on a Variety of Different Limestones, as Measured in a Hot Fluidized Bed of Sand. Energy Fuels 2007, 21, 2072–2081. [Google Scholar] [CrossRef]
  15. Sun, P.; Grace, J.R.; Lim, C.J.; Anthony, E.J. The effect of CaO sintering on cyclic CO2 capture in energy systems. AIChE J. 2007, 53, 2432–2442. [Google Scholar] [CrossRef]
  16. Fang, F.; Li, Z.-S.; Cai, N.-S. Experiment and Modeling of CO2 Capture from Flue Gases at High Temperature in a Fluidized Bed Reactor with Ca–Based Sorbents. Energy Fuels 2009, 23, 207–216. [Google Scholar] [CrossRef]
  17. Manovic, V.; Anthony, E.J. Thermal Activation of CaO–Based Sorbent and Self–Reactivation during CO2 Capture Looping Cycles. Environ. Sci. Technol. 2008, 42, 4170–4174. [Google Scholar] [CrossRef]
  18. Chen, Z.; Song, H.S.; Portillo, M.; Lim, C.J.; Grace, J.R.; Anthony, E.J. Long–Term Calcination/Carbonation Cycling and Thermal Pretreatment for CO2 Capture by Limestone and Dolomite. Energy Fuels 2009, 23, 1437–1444. [Google Scholar] [CrossRef]
  19. Lysikov, A.I.; Salanov, A.N.; Okunev, A.G. Change of CO2 Carrying Capacity of CaO in Isothermal Recarbonation−Decomposition Cycles. Ind. Eng. Chem. Res. 2007, 46, 4633–4638. [Google Scholar] [CrossRef]
  20. Hughes, R.W.; Lu, D.; Anthony, E.J.; Wu, Y. Improved Long–Term Conversion of Limestone–Derived Sorbents for In Situ Capture of CO2 in a Fluidized Bed Combustor. Ind. Eng. Chem. Res. 2004, 43, 5529–5539. [Google Scholar] [CrossRef]
  21. Rodríguez, N.; Alonso, M.; Abanades, J.C. Experimental investigation of a circulating fluidized–bed reactor to capture CO2 with CaO. AIChE J. 2011, 57, 1356–1366. [Google Scholar] [CrossRef] [Green Version]
  22. Arias, B.; Grasa, G.S.; Abanades, J.C. Effect of sorbent hydration on the average activity of CaO in a Ca–looping system. Chem. Eng. J. 2010, 163, 324–330. [Google Scholar] [CrossRef]
  23. Borgwardt, R.H. Calcium oxide sintering in atmospheres containing water and carbon dioxide. Ind. Eng. Chem. Res. 1989, 28, 493–500. [Google Scholar] [CrossRef]
  24. Beruto, D.; Barco, L.; Searcy, A.W. CO2–Catalyzed Surface Area and Porosity Changes in High–Surface–Area CaO Aggregates. J. Am. Ceram. Soc. 1984, 67, 512–516. [Google Scholar] [CrossRef] [Green Version]
  25. Ewing, J.; Beruto, D.; Searcy, A.W. The Nature of CaO Produced by Calcite Powder Decomposition in Vacuum and in CO2. J. Am. Ceram. Soc. 1979, 62, 580–584. [Google Scholar] [CrossRef]
  26. Zeman, F. Effect of steam hydration on performance of lime sorbent for CO2 capture. Int. J. Greenh. Gas Control 2008, 2, 203–209. [Google Scholar] [CrossRef]
  27. Wang, K.; Guo, X.; Zhao, P.; Zhang, L.; Zheng, C. CO2 capture of limestone modified by hydration–dehydration technology for carbonation/calcination looping. Chem. Eng. J. 2011, 173, 158–163. [Google Scholar] [CrossRef]
  28. Meis, N.N.A.H.; Bitter, J.H.; de Jong, K.P. Support and Size Effects of Activated Hydrotalcites for Precombustion CO2 Capture. Ind. Eng. Chem. Res. 2010, 49, 1229–1235. [Google Scholar] [CrossRef] [Green Version]
  29. Reijers, H.T.J.; Valster–Schiermeier, S.E.A.; Cobden, P.D.; van den Brink, R.W. Hydrotalcite as CO2 Sorbent for Sorption–Enhanced Steam Reforming of Methane. Ind. Eng. Chem. Res. 2006, 45, 2522–2530. [Google Scholar] [CrossRef]
  30. Herce, C.; Stendardo, S.; Cortés, C. Increasing CO2 carrying capacity of dolomite by means of thermal stabilization by triggered calcination. Chem. Eng. J. 2015, 262, 18–28. [Google Scholar] [CrossRef]
  31. Gupta, H.; Fan, L.-S. Carbonation−Calcination Cycle Using High Reactivity Calcium Oxide for Carbon Dioxide Separation from Flue Gas. Ind. Eng. Chem. Res. 2002, 41, 4035–4042. [Google Scholar] [CrossRef]
  32. Lu, H.; Smirniotis, P.G. Calcium Oxide Doped Sorbents for CO2 Uptake in the Presence of SO2 at High Temperatures. Ind. Eng. Chem. Res. 2009, 48, 5454–5459. [Google Scholar] [CrossRef]
  33. Lu, H.; Khan, A.; Smirniotis, P.G. Relationship between Structural Properties and CO2 Capture Performance of CaO−Based Sorbents Obtained from Different Organometallic Precursors. Ind. Eng. Chem. Res. 2008, 47, 6216–6220. [Google Scholar] [CrossRef]
  34. Roesch, A.; Reddy, E.P.; Smirniotis, P.G. Parametric Study of Cs/CaO Sorbents with Respect to Simulated Flue Gas at High Temperatures. Ind. Eng. Chem. Res. 2005, 44, 6485–6490. [Google Scholar] [CrossRef]
  35. Chen, H.; Zhao, C.; Duan, L.; Liang, C.; Liu, D.; Chen, X. Enhancement of reactivity in surfactant–modified sorbent for CO2 capture in pressurized carbonation. Fuel Process. Technol. 2011, 92, 493–499. [Google Scholar] [CrossRef]
  36. Salvador, C.; Lu, D.; Anthony, E.J.; Abanades, J.C. Enhancement of CaO for CO2 capture in an FBC environment. Chem. Eng. J. 2003, 96, 187–195. [Google Scholar] [CrossRef]
  37. Li, Z.-S.; Cai, N.-S.; Huang, Y.-Y. Effect of Preparation Temperature on Cyclic CO2 Capture and Multiple Carbonation−Calcination Cycles for a New Ca–Based CO2 Sorbent. Ind. Eng. Chem. Res. 2006, 45, 1911–1917. [Google Scholar] [CrossRef]
  38. Pacciani, R.; Müller, C.R.; Davidson, J.F.; Dennis, J.S.; Hayhurst, A.N. Synthetic Ca–based solid sorbents suitable for capturing CO2 in a fluidized bed. Can. J. Chem. Eng. 2008, 86, 356–366. [Google Scholar] [CrossRef]
  39. Wu, S.F.; Zhu, Y.Q. Behavior of CaTiO3/Nano–CaO as a CO2 Reactive Adsorbent. Ind. Eng. Chem. Res. 2010, 49, 2701–2706. [Google Scholar] [CrossRef]
  40. Hubbard, C.R.; Snyder, R.L. RIR—Measurement and Use in Quantitative XRD. Powder Diffr. 2013, 3, 74–77. [Google Scholar] [CrossRef] [Green Version]
  41. Sing, K.S.W. Reporting physisorption data for gas/solid systems with special reference to the determination of surface area and porosity (Recommendations 1984). Pure Appl. Chem. 1985, 57, 603–619. [Google Scholar] [CrossRef]
Figure 1. X–ray diffraction (XRD) patterns of as–prepared samples: (a) CZ, (b) CCZ40, (c) CCZ60, and (d) CCZ80. The position and intensity of the peaks corresponding to the main phases present are also included.
Metals 10 00750 g001
Figure 2. Textural characterization of as–prepared samples: (a) N2 physisorption isotherms; (b) pore–size distribution by the BJH method.
Metals 10 00750 g002
Figure 3. Scanning electron microscopy (SEM) images using secondary electron of as–prepared samples: (a) CZ, (b) CCZ40, (c) CCZ60, and (d) CCZ80.
Metals 10 00750 g003
Figure 4. Average size of the CaO, Ca(OH)2, and CaZrO3 particles measured by SEM of as–prepared CCZ samples.
Metals 10 00750 g004
Figure 5. Thermogravimetric/differential thermal analysis (TG/DTA) curves of CaO–CaZrO3 at different % of CaO.
Metals 10 00750 g005
Figure 6. Stability and performance tests of CCZ samples under mild conditions showing the CO2 uptake over 12 carbonation/calcination cycles (a) and the calculated CaO conversion (b).
Metals 10 00750 g006
Figure 7. TGA weight profiles vs. time of the CCZ40 sorbent under mild conditions (red line) and under severe conditions (green line) for the first and last cycles.
Metals 10 00750 g007
Figure 8. Stability and performance tests of CCZ40 sample under severe conditions showing the CO2 uptake over 12 cycles (a) and the calculated CaO conversion (b) in the isotherm step at 650 °C (red) and at 850 °C during the temperature ramp up to 900 °C (blue).
Metals 10 00750 g008
Figure 9. CaO carbonatation kinetic curves of the CCZ40 sorbent for the first and last cycles under mild conditions (blue) and under severe conditions (red) and the corresponding slope extraction according to the grain model.
Metals 10 00750 g009
Figure 10. SEM images using secondary electron of used samples: (a) CZ, (b) CCZ40, (c) CCZ60, and (d) CCZ80.
Metals 10 00750 g010
Figure 11. Average size of the CaO and CaZrO3 particles measured by SEM after calcium looping cycles of the CCZ samples.
Metals 10 00750 g011
Table 1. Crystallite size, phase amount, and textural properties of as–prepared samples.
SampleCrystallite Size (nm) 1Phase Amount (%)SSA (m2·g−1)Pore Volume (cm3·g−1)
CaZrO3CaOCa(OH)2CaZrO3CaOCa(OH)2CaCO3
CZ63.989.126.931.011.20.043
CCZ4056.435.516.052.820.425.50.332.40.095
CCZ6030.531.212.235.844.818.90.552.70.160
CCZ8032.311.214.03.073.59.548.00.123
1 Calculated according to the Scherrer equation. 2 The phase amount of Ca0.15Zr0.85O1.85 was 0.2%.
Table 2. Peak temperature (from differential scanning calorimetry (DSC)) and weight loss (from thermogravimetric analysis (TGA)) of the samples.
SampleCa SpeciesPeak Temperature (°C)Weight loss (%)
CZCaCO3792.01.6
CCZ40Ca(OH)2417.05.9
CaCO3638.72.3
CCZ60Ca(OH)2458.613.2
CaCO3694.74.1
CCZ80Ca(OH)2440.417.6
CaCO3665.54.6

