Abstract
In this work, multi-pass compressions were performed at various strain rates (0.01 s−1, 0.1 s−1, 1 s−1, 10 s−1), temperatures (950 °C, 1050 °C, 1150 °C), inter-pass holding time (1 s, 10 s, 30 s, 120 s, 600 s), interrupt strains (0.3, 0.4, 0.5, 0.6), and total pass numbers (1, 2, 3, 4). The intriguing finding was that the recrystallized fraction, average dislocation density, and plastic cumulative strain were partly eliminated during inter-pass holding, resulting in the early occurrence of recrystallization in subsequent compression. Therefore, a parameter (Θ) to evaluate the overall softening fraction due to recrystallization was proposed, and it was then used to iteratively rectify the average dislocation density and plastic cumulative strain in flow-stress modeling. The flow-stress model parameters of 300M steel for multi-pass compression were identified using an optimization technique based on non-derivative method integrated in MATLAB software. The average deviation of calculated and experimental flow-stress was 0.88 MPa (1.35%), showing good accuracy of the flow-stress model. The microstructure evolution of 300M steel was analyzed by the change of softening fraction during multi-pass compression, which provided a useful reference for the research of stress–microstructure relationships of high-strength steels.
1. Introduction
As a kind of medium carbon low-alloyed steel, the 300M steel (namely 4340 M) is used a lot in the manufacture of large structural parts due to good strength (σyield ≥ 1850 MPa), transverse ductility, fracture toughness, and anti-fatigue property. For these parts, material flow controlling in multi-pass hot compression and precise flow-stress modeling are major concerns.
Plenty of work has been carried out to study the influences of process parameter and microstructure evolution on flow-stress evolution of various steels. The effects of strain rate, strain, and temperature on flow-stress were considered, and the flow-stress models of Nb-Ti steel [1] and 5CrNiMoV steel [2] for single-pass compression were constructed based on the Arrhenius model. To reflect the influence of dislocation, segmented flow-stress models of AZ61 magnesium alloy [3] and 34CrNiMo6 steel [4] were established based on the Kocks-Mecking model during hot compression. Moreover, the effect of average grain size was coupled in the flow-stress model of as-cast 42CrMo billet in ring rolling by Guo et al. [5]. The flow-stress models of pure iron [6], 30Si2MnCrMoVE steel [7], and FB2 steel [8] were established considering the evolution of stress parameters. A flow-stress model coupling the effects of dislocation, vacancy, recrystallization, and grain growth was developed by Safara et al. [9] for single-pass compression.
In multi-pass compression, dynamic recovery, dynamic recrystallization, meta-dynamic recrystallization, static recrystallization, and static recovery are the main microstructure evolution processes that cause material softening. From the point of view of dislocation evolution, these microstructure evolution processes all contribute to the annihilation of dislocation, but the time of effect and the degree of contribution are different. Dynamic recovery and dynamic recrystallization occur during deformation, while meta-dynamic recrystallization, static recrystallization, and static recovery occur during holding. Determining the contribution of each microstructure evolution on the flow behaviors of steels is complex, and there are many variables that may affect the flow behavior, for example, strain, strain rate, temperature, interrupt strain, inter-pass holding time, and total pass number. Tang et al. [10] proposed a model to establish the influences of strain, strain rate, and temperature on flow-stress in three-pass compression of 4343/4A60Nb-Ti steel based on the Arrhenius model. A mean field model was proposed by Beltran et al. [11] to predict the flow-stress by assuming that the grain boundary mobilities were the same in dynamic and post-dynamic recrystallizations of 304L steel. The effect of pass number was investigated by Guan et al. [12], and it was found that the flow-stress of a low carbon bainitic steel increased with increasing total pass number. By using the recrystallized dislocation-free portion (X) as an internal state variable, Cho et al. [13] established a model to account for the effects of static recrystallization, dynamic recrystallization, and grain size in multi-pass compressions of various metals. Yield stress, critical stress, saturation stress, and steady-state stress were also used as internal state variables to describe the flow behaviors of steels [14,15,16] in multi-pass compressions. A flow-stress model coupling microstructure evolution of C-Mn steel was established by Lin et al. [17]. For 300M steel, the flow-stress in single-pass compression have been modeled by the authors [18] and Guo et al. [19]. The microstructure evolutions in static recrystallization and meta-dynamic recrystallization was investigated by Zhao et al. [20,21] via double-pass compression, and it was found that the mechanism of static recrystallization was strain-induced boundary migration. The effect of interrupt strain was discussed by Zeng et al. [22], and a model was constructed based on the evolution of stress parameters. However, the existing model of 300M steel does not take into account the average dislocation density evolution, so it is facing difficulty in precise flow-stress prediction in multi-pass compression.
Accordingly, the previously established single-pass flow-stress model [18] was extended to multi-pass compression. The kinetics of recrystallizations during holding were coupled in the flow-stress model. A parameter (Θ) to evaluate the overall softening fraction due to recrystallizations was proposed, and it was further used in flow-stress modeling to iteratively rectify the average dislocation density and plastic cumulative strain. The flow-stress–microstructure relationship was revealed, which was of critical importance for the material flow control of 300M steel forging.
2. Materials and Experiments
2.1. Materials
As forged 300M steel ingot with the diameter of 300 mm was used. The chemical composition was measured to be 93.982Fe-2.562Si-0.896Cr-0.824Ni-0.808Mn-0.435Mo-0.39C-0.086V-0.017S (weight %) [23,24]. Specimens with the diameter of 8 mm and with the height of 12 mm were cut in the circumference direction of the ingot.
2.2. Multi-Pass Compression Experiments
Multi-pass compression tests were performed on Gleeble 3500 (Dynamic Systems Inc., Austin, TX, USA). The experimental procedures are shown in Figure 1a, which is described as follows: (a) the specimen was heated to 1200 °C at the rate of 3.3 °C/s, held there for 240 s, cooled to deformation temperature at the rate of 3.3 °C/s, and held again for 240 s. (b) the specimen was compressed under the temperature of Tc and at the strain rate of to the logarithmic strain of . (c) the specimen was held at the temperature for the time of . (d) the specimen was compressed to another logarithmic strain of . The experimental parameters of double-pass compressions are in Table 1. The tests are numbered sequentially as T1–T14.
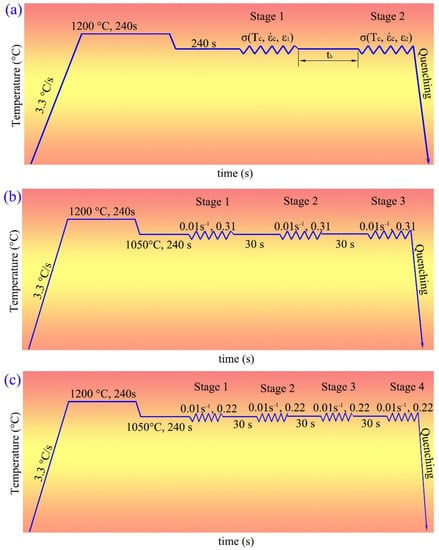
Figure 1.
Experimental procedures of (a) double-pass compressions, (b) triple-pass compression, (c) quadruple-pass compression.

Table 1.
Experimental parameters of double-pass compressions.
The triple-pass compression (T15) and quadruple-pass compression (T16) were carried out. The heating and holding process of triple-pass and quadruple-pass compression was the same as single-pass compression, but the deformation process was different. In the triple-pass compression, the strain rate, temperature, strain, and inter-pass holding time were set as 0.01 s−1, 1050 °C, 0.31, and 30 s, respectively. In the quadruple-pass compression, the parameters were set as 0.01 s−1, 1050 °C, 0.22, and 30 s, respectively. The experimental procedures are illustrated in Figure 1b,c. The stress–strain curves were smoothed by sampling stress at an interval strain of 0.01.
3. Results
3.1. Influence of Strain Rate
The stress-strain curves in double-pass compressions under different strain rates are shown in Figure 2. The stress increased with the increase of strain rate (T1→T4), because there was not sufficient time for dislocation annihilation at 10 s−1, resulting in work-hardening. The stress–strain curve shapes gradually changed from dynamic recrystallization type to dynamic recovery type, and finally changed to work-hardening type as the strain rate increased owing to the competing effect of work-hardening, dynamic recrystallization softening, and dynamic recovery softening. The stress–strain curve shapes of the two passes were similar, indicating the microstructure evolutions of the two passes were similar. The initial stress of the second pass was slightly higher, showing that the hardening effect of the first pass deformation was partly retained and transferred the second pass. However, the peak stress of the second pass was lower. Moreover, comparing the flow-stress of the two passes in test T1, it could be found that although dynamic recrystallization was completed in the first pass, it occurred again in the second pass. Thus, not only the dislocation densities but also dynamic recrystallization volume fraction (the volume fraction of dynamic recrystallized grains in total grains) and strain were partly eliminated in inter-pass holdings. A flow-stress model neglecting the inter-pass holdings would not accurately predict the flow behavior of 300M steel in multi-pass compression.
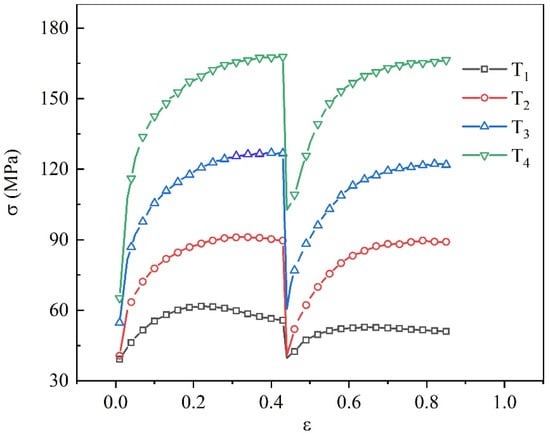
Figure 2.
Stress–strain curves in double-pass compressions under different strain rates (Tc = 1050 °C, = = 0.43, = 30 s).
3.2. Influence of Temperature
The stress–strain curves in double-pass compression under different temperatures are shown in Figure 3. Stress decreased with increasing temperatures (T5→T1→T6). This was because the dynamic recovery softening effect was more intense at higher temperatures. Different stress–strain curve shapes of the two passes were found in test T5 and T6. In the test of T6, the deformation was interrupted when dynamic recrystallization was fulfilled for a large proportion. Therefore, in the inter-pass holding, meta-dynamic recrystallization dominated. However, in the test of T5, dynamic recrystallization occurred incompletely, and in the holding, static recrystallization dominated. The meta-dynamic and static recrystallization volume fraction in inter-pass holding was determined by the dynamic recrystallization volume fraction in the first pass. The initial stress of the second pass was slightly higher and the peak stress was lower, which was consistent with the result in Figure 2. An early occurrence of dynamic recrystallization of the second pass of test T6 was facilitated by the deformation stored energy in the first pass.
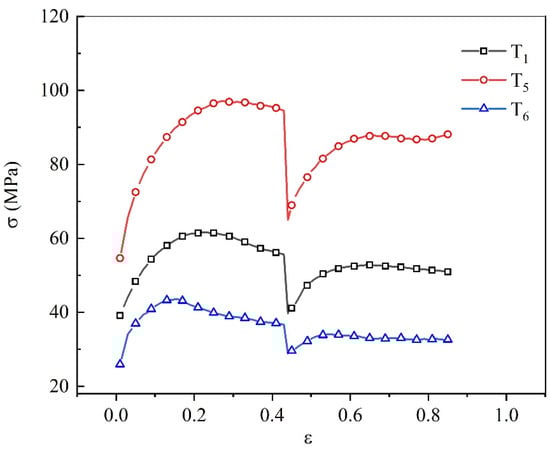
Figure 3.
Stress–strain curves in double-pass compression under different temperatures ( = 0.01 s−1, = = 0.43, = 30 s).
3.3. Influence of Inter-Pass Holding Time
The stress-strain curves in double-pass compression under different inter-pass holding time are shown in Figure 4. Comparing the second pass flow-stress with the first pass flow-stress of test T7–T10, it was revealed that initial stress decreased, and peak stress increased with increasing inter-pass holding time. The stress–strain curves were crossed at the strain of ~0.57. It could be explained that the longer the inter-pass holding time, a larger proportion of dynamic recrystallization volume fraction, strain, and dislocation density was eliminated. As a result, the material state was close to the initial state. The initial stress was low, and the peak stress was relatively high. On the contrary, when the inter-pass holding time was short, there was no significant change in the dynamic recrystallization volume fraction, strain, and dislocation density. The material state was close to the state before interrupting, and therefore, the initial stress was high, and the peak stress was low.
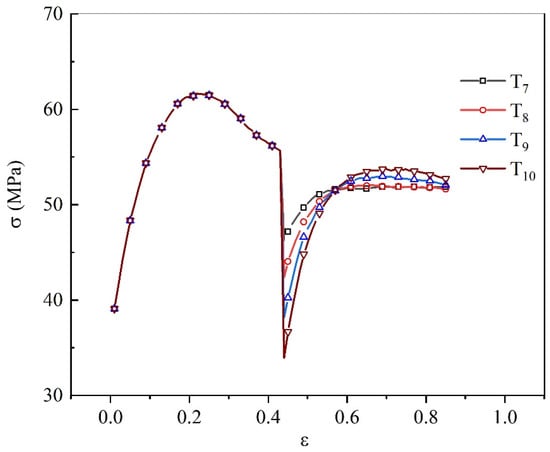
Figure 4.
Stress–strain curves in double-pass compression under different inter-pass holding time ( = 0.01 s−1, Tc = 1050 °C, = = 0.43).
3.4. Influence of Interrupt Strain
The stress–strain curves in double-pass compression under different interrupt strains are shown in Figure 5. The curve of the first pass was dynamic recrystallization type, and the interrupt strain from T11 to T14 located in the downward section of the stress–strain curve, indicating that the dynamic recrystallization volume fraction from T11 to T14 was gradually increasing before interrupting. As the interrupt strain increased (T11→T14), both the initial stress and the peak stress of the second pass decreased. This was because the larger the interrupt strain, the higher the first pass recrystallization volume fraction, and the more obvious the softening effect on the second pass compression.
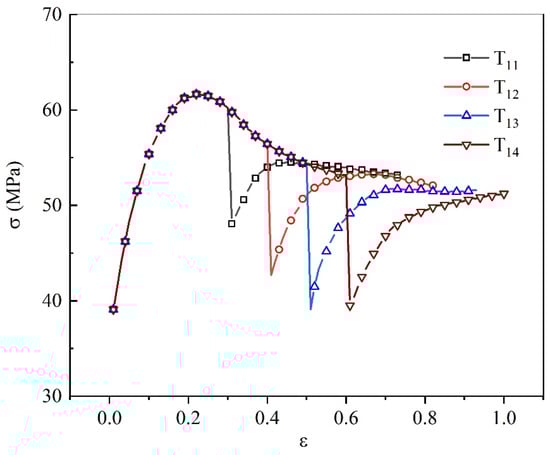
Figure 5.
Stress–strain curves in double-pass compression under different interrupt strains ( = 0.01 s−1, Tc = 1050 °C, = 30 s).
3.5. Influence of Total Pass Number
The stress-strain curves of double-pass, triple-pass, and quadruple-pass compression are in Figure 6. In the double-pass compression (T1), the peak stress of the second pass was lower than the first pass. In triple-pass compression (T15), the peak stress also decreased gradually. In quadruple-pass compression (T16), the peak stress ceased to drop at the fourth pass. Therefore, by increasing the total pass number and making good use of recrystallizations in inter-pass holdings, the deformation force could be decreased, which was very useful in actual forging. Moreover, the flow stresses at the strain of 0.9 in test T1, T15, and T16 are proximately the same, suggesting that the softening effect by increasing the total pass number was limited.
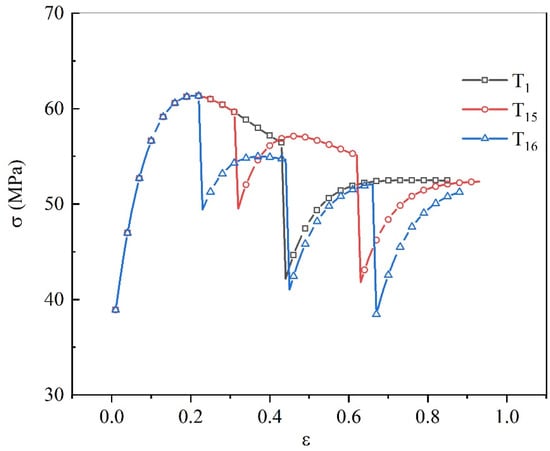
Figure 6.
Stress–strain curves in double-pass, triple-pass, and quadruple-pass compressions. ( = 0.01 s−1, Tc = 1050 °C, = 30 s).
4. Discussion
4.1. The Flow-Stress Model
The flow-stress calculation procedure is shown in Figure 7.
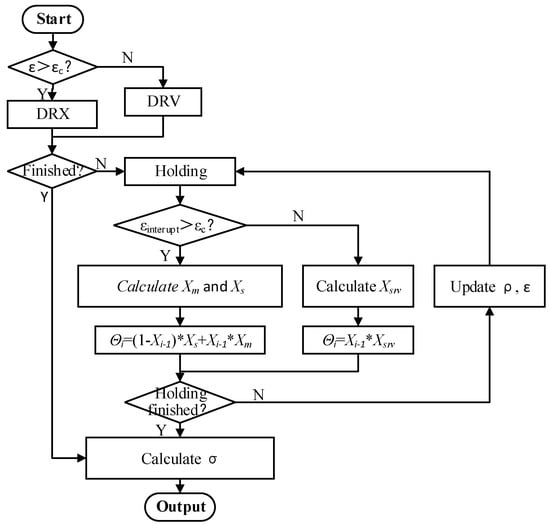
Figure 7.
Calculation procedure of the flow-stress.
In the thermal compression, if the plastic strain were too low to initiate dynamic recrystallization, only dynamic recovery would occur. The grains underwent dynamic recovery would experience static recovery afterwards in inter-pass holding. A parameter () to evaluate the overall softening fraction was proposed in the present work, and expressed as:
where was the volume fraction of dynamic recrystallized grains in the prior pass. was the softening fraction due to static recovery, which was expressed as [22]:
where was a model parameter, and was expressed as:
where , , , , , were all material constants. t was the inter-pass holding time. Otherwise, if the strain exceeded the critical strain, dynamic recrystallization, and dynamic recovery happened. The volume fraction of the dynamic recrystallized grains in total grains (X) was expressed as [18]:
where was the dynamic recrystallization kinetics in the i−1th iteration, and was the plastic cumulative strain. was the critical strain for initiating dynamic recrystallization, which could be expressed by the Arrhenius equation:
where , , and were material constants. = 8.314 kJ/(mol K). was the peak strain, which could also be expressed as:
where , , and were material constants.
The dynamic recrystallized grains, whose portion was X, would experience meta-dynamic recrystallization afterwards in inter-pass holding. However, for the rest of the grains, whose portion was 1−X, static recrystallization would occur. In this case, the softening fraction () could be calculated by:
where was the static recrystallization kinetics, and was the meta-dynamic recrystallization kinetics. They could be expressed as [22]:
where t was the inter-pass holding time, was the time needed to achieve 50% softening in static recrystallization. was the time needed to achieve 50% softening in meta-dynamic recrystallization. They could be expressed as [20,21]:
where , , , , , were all material constants. The strain in the model was an important parameter both for calculating the dynamic recrystallization volume fraction, and for determining whether dynamic recrystallization occurred. In multi-pass compression, it was necessary to accurately judge how the strain evolved. On the one hand, the strain increased as deformation went on, and on the other hand, the strain decreased with increasing volume fraction of recrystallized grains. Therefore, in inter-pass holdings, the strain () was calibrated by:
where was the interruption strain of the last pass deformation. The evolution of average dislocation density was also considered during multi-pass compressions. The average dislocation density of the initial material () was calculated by:
where , , and were material constants. In dynamic recrystallization, the average dislocation density () was calculated by [18]:
where was the average dislocation density in the i−1th iteration. M was the Taylor factor. b was the module of the Burgess vector. was the initial grain size (37.7 μm). , , and were calculated by:
where , , were material constants. Then, the flow-stress () was calculated by the Taylor equation [25]:
where was a constant, was the shear modulus. When inter-pass holding finished, the average dislocation density was calculated by:
4.2. Parameter Identification
There were 34 parameters that needed to be determined in the flow-stress model of 300M steel for multi-pass compression. To successfully solve the unknown parameters, a parameter identification program was integrated in MATLAB software. The optimization goal was set as:
where were the experimental flow-stress, and was the calculated flow-stress. For genetic algorithm, the optimized parameters could be obtained simply by providing the parameter ranges, for example, from to , but the drawback was the optimization speed. For none-derivative method, the optimization could be much quicker, but an initial solution needed to be set. Therefore, to speed up the solving process, the model parameters were first identified by genetic algorithm. Then, the combination of model parameters was set as initial solution for none-derivative method. Twenty-one of the parameters were solved first by the stress–strain curves of test T1–T6, and 13 of the parameters were solved by the stress–strain curve of T7–T14. The optimized model parameters are shown in Table 2.
Table 2.
Flow-stress model parameters of 300M steel.
4.3. Comparison and Validation
The flow-stress calculated by the model parameters in Table 2 is shown as a line in Figure 8. The experimental flow-stress is shown as a symbol for comparison. It can be seen that the calculated stress fitted well with the experimental stress. The average error was 0.88 MPa, and the relative error was 1.35%. Therefore, the established flow-stress model could accurately describe the flow behavior of 300M steel in double-pass compression.
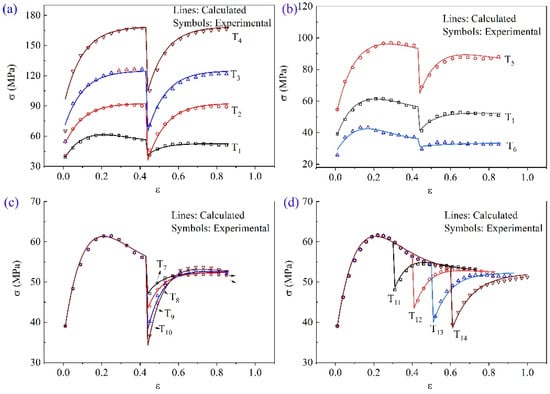
Figure 8.
Comparison of the model predictions and experimental values for the double-pass compression. (a) T1–T4, (b) T1, T5, and T6, (c) T7–T10, (d) T11–T14.
To verify whether the model could accurately predict the flow-stress in multi-pass compression, this model was applied in stress predictions of triple-pass compression and quadruple-pass compression. The calculated and experimental flow stresses of the triple-pass and the quadruple-pass compression are shown in Figure 9. The average error was 0.58 MPa, and the relative error was 0.95%. Therefore, the established flow-stress model was also capable of describing the stress evolution in triple-pass compression and quadruple-pass compression.
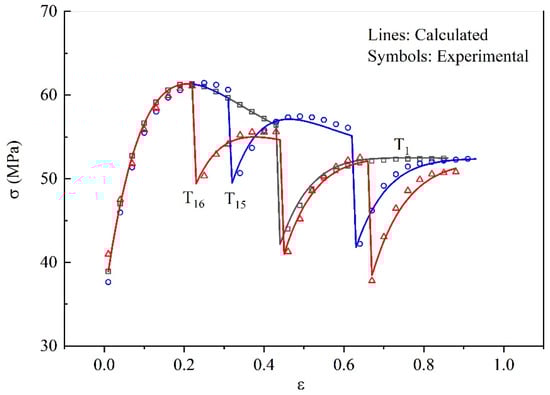
Figure 9.
Comparison of the calculated and experimental flow stresses for the triple-pass compression and the quadruple-pass compression of 300M steel.
4.4. Analysis of the Softening Fraction
The softening fraction () in the present research reflected the recrystallization kinetics during and after hot compressions, and it allowed explanation of the change of flow-stress with microstructure evolution. The softening fraction in double-pass compression was calculated by the model parameters in Table 2, shown in Figure 10. At the same strain, the dynamic recrystallization volume fraction of the first pass decreased with increasing strain rate (T1→T4). After holding at 1050 °C for 30 s, the softening fraction at 0.01 s−1 (T1) was 28%, which was much smaller than the softening fraction at 0.1 s−1 (T2, 89%), 1 s−1 (T3, 80%), and 10 s−1 (T4, 69%). The softening fraction in inter-pass holdings were mainly affected by the meta-dynamic recrystallization and static recrystallization kinetics, and the results showed that the first pass strain rate affected the recrystallization kinetics during holding.
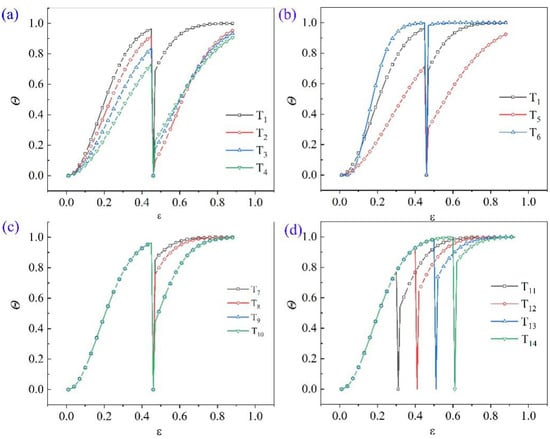
Figure 10.
Softening fraction in double-pass compressions. (a) T1–T4, (b) T1, T5, and T6, (c) T7–T10, (d) T11–T14.
The softening fractions under various temperatures are shown in Figure 10b. At 950 °C (T5), the dynamic recrystallization volume fractions both in the first and second pass were lower than that at 1050 °C (T1) and 1150 °C (T6). At the end of the first pass of test T6, the dynamic recrystallization was almost completed, while at the temperature of 950 °C (T5), the dynamic recrystallization volume fraction was only 73% at the end of the first pass. During inter-pass holding, the dynamic recrystallization volume fraction dropped from 71% to 31% at 950 °C (T5), resulting in a second round of dynamic recrystallization. The deformation was interrupted when steady-state flow occurred in test T6, and the dynamic recrystallization volume fraction dropped from 100% to 98%.
The influence of inter-pass holding time on the evolution of is shown in Figure 10c. The value of of the second pass of test T7, T8, and T9 increased with inter-pass holding time, but the softening fraction of test T9 and T10 were identical. It was explained that the meta-dynamic recrystallization was completed after holding for 120 s at 1050 °C, but the static recrystallization has not yet occurred because of the incubation period.
The influence of interrupt strain on the evolution of is shown in Figure 10d. The dynamic recrystallization volume fractions of the first pass of T11 (77%), T12 (91%), T13 (98%), and T14 (100%) increased with increasing interrupt strains (0.3, 0.4, 0.5, 0.6). After holding at 1050 °C for 30 s, the dynamic recrystallization volume fraction dropped to 0.54, 0.64, 0.72, and 0.84, respectively. However, the dynamic recrystallization volume fraction increased to 100% when the strain increased to 0.90 in the second pass deformation.
The softening fractions of 300M steel in triple-pass and quadruple-pass compression are shown in Figure 11. In the test of T15, the dynamic recrystallization volume fractions at the strain of 0.31 and 0.62 were 79% and 96%, respectively. However, it decreased to 35% and 69% due to recrystallizations in inter-pass holdings. The dynamic recrystallization volume fraction in the test of T16 also decreased in holdings. The microstructure evolutions of 300 M steel could be revealed by stress-strain curves. In practical production of large forgings, multi-pass compression parameters could be optimized to obtain fully recrystallized grains.
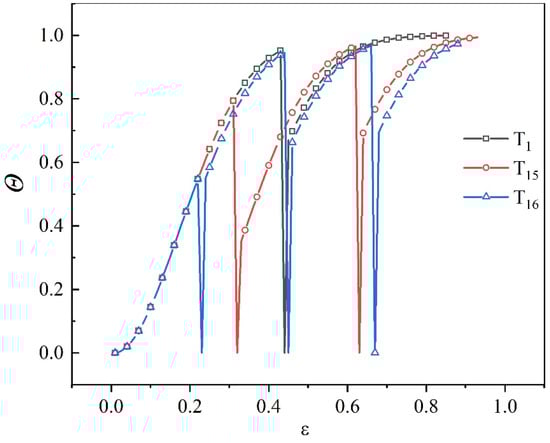
Figure 11.
Softening fraction of 300M steel in triple-pass and quadruple-pass compression.
5. Conclusions
The following conclusions were drawn:
(1) The influences of strain rates, temperatures, inter-pass holding time, interrupt strains, and total pass number on flow-stress evolution were investigated. The recrystallized fraction, average dislocation density, and plastic cumulative strain were partly eliminated during inter-pass holdings, resulting in the early occurrence of recrystallization in subsequent compressions.
(2) A parameter () to evaluate the overall softening fraction due to recrystallizations was proposed, and it was then used to iteratively rectify the average dislocation density and plastic strain in flow-stress modeling. The average deviation of calculated and experimental flow-stress was 0.88 MPa (1.35%), showing good accuracy of the model.
(3) The model was verified by the results of triple-pass and quadruple-pass compressions. The average error was 0.58 MPa, and the relative error was 0.95%. Therefore, the established model was accurate in triple-pass and quadruple-pass compression. The established model allowed explanation of the change of flow-stress of 300M steel with microstructure evolution.
Author Contributions
Writing-Original Draft Preparation, R.C.; writing-review & editing, J.Z. & G.Y.; funding acquisition, F.F. All authors have read and agreed to the published version of the manuscript.
Funding
This work was funded by the State Key Laboratory of Materials Processing and Die & Mould Technology in Huazhong University of Science and Technology (P2020-015), the Key Laboratory of Automotive Power Train and Electronic in Hubei University of Automotive Technology (ZDK1201903), and the Doctoral Scientific Research Fund of Hubei University of Automotive Technology (BK201901).
Conflicts of Interest
The authors declare that they have no conflicts of interest.
References
- Wu, G.L.; Zhang, Y.J.; Wu, S.W. Characterization of hot deformation behaviour of Nb-Ti microalloyed high strength steel. J. S. Afr. I. Min. Metall. 2019, 119, 503–508. [Google Scholar] [CrossRef]
- Hu, Z.; Wang, K. Evolution of Dynamic Recrystallization in 5CrNiMoV Steel during Hot Forming. Adv. Mater. Sci. Eng. 2020, 2020, 4732683. [Google Scholar] [CrossRef]
- Wu, H.; Xu, W.; Wang, S. A cellular automaton coupled FEA model for hot deformation behavior of AZ61 magnesium alloys. J. Alloy Compd. 2020, 816, 152562. [Google Scholar] [CrossRef]
- Gong, B.; Duan, X.W.; Liu, J.S. A physically based constitutive model of As-forged 34CrNiMo6 steel and processing maps for hot working. Vacuum 2018, 155, 345–357. [Google Scholar] [CrossRef]
- Guo, L.; Wang, F.; Zhen, P. A novel unified model predicting flow stress and grain size evolutions during hot working of non-uniform as-cast 42CrMo billets. Chin. J. Aeronaut. 2019, 32, 531–545. [Google Scholar] [CrossRef]
- Zhang, Y.; Fan, Q.; Zhang, X. Avrami Kinetic-Based Constitutive Relationship for Armco-Type Pure Iron in Hot Deformation. Metals 2019, 9, 365. [Google Scholar] [CrossRef]
- Wang, H.; Liu, D.; Wang, J. Characterization of hot deformation behavior of 30Si2MnCrMoVE low-alloying ultra-high-strength steel by constitutive equations and processing maps. J. Iron Steel Res. Int. 2020, in press. [Google Scholar] [CrossRef]
- Chen, F.; Wang, H.; Zhu, H. High-temperature deformation mechanisms and physical-based constitutive modeling of ultra-supercritical rotor steel. J. Manuf. Process. 2019, 38, 223–234. [Google Scholar] [CrossRef]
- Safara, N.; Engberg, G.; Ågren, J. Modeling Microstructure Evolution in a Martensitic Stainless Steel Subjected to Hot Working Using a Physically Based Model. Metall. Mater. Trans. A 2019, 50, 1480–1488. [Google Scholar] [CrossRef]
- Tang, C.; Zhou, Y.; Weng, H. Constitutive behavior of 4343/4A60 aluminum alloy at multi-pass hot deformation. Strength Mater. 2017, 49, 83–92. [Google Scholar] [CrossRef]
- Beltran, O.; Huang, K.; Logé, R.E. A mean field model of dynamic and post-dynamic recrystallization predicting kinetics, grain size and flow stress. Comp. Mater. Sci. 2015, 102, 293–303. [Google Scholar] [CrossRef]
- Guan, Y.; Chen, Q.; Ma, J. A study on recrystallization behavior of low carbon bainitic steel during multi-pass deformation. Appl. Mech. Mater. 2012, 217–219, 471–475. [Google Scholar] [CrossRef]
- Cho, H.E.; Hammi, Y.; Bowman, A.L. A unified static and dynamic recrystallization Internal State Variable (ISV) constitutive model coupled with grain size evolution for metals and mineral aggregates. Int. J. Plast. 2019, 112, 123–157. [Google Scholar] [CrossRef]
- Yanagida, A.; Yanagimoto, J. Formularization of softening fractions and related kinetics for static recrystallization using inverse analysis of double compression test. Mater. Sci. Eng. A 2008, 487, 510–517. [Google Scholar] [CrossRef]
- Puchi-Cabrera, E.S.; Staia, M.H.; Guérin, J.D. An experimental analysis and modeling of the work-softening transient due to dynamic recrystallization. Int. J. Plast. 2014, 54, 113–131. [Google Scholar] [CrossRef]
- Puchi-Cabrera, E.S.; Guerin, J.D.; Barbera-Sosa, J.G. Incremental constitutive description of SAE 5120 steel deformed under hot-working conditions. Int. J. Mech. Sci. 2017, 133, 619–630. [Google Scholar] [CrossRef]
- Lin, J.; Liu, Y.; Farrugia, D.C.J. Development of dislocation-based unified material model for simulating microstructure evolution in multipass hot rolling. Philos. Mag. 2005, 85, 1967–1987. [Google Scholar] [CrossRef]
- Chen, R.; Guo, P.; Zheng, Z. Dislocation Based Flow Stress Model of 300M Steel in Isothermal Compression Process. Materials 2018, 11, 972. [Google Scholar] [CrossRef] [PubMed]
- Guo, P.; Deng, L.; Wang, X.Y. Modelling of dynamic recrystallization kinetics of 300M steel at high strain rates during hot deformation. Sci. China Technol. Sci. 2019, 62, 1–11. [Google Scholar] [CrossRef]
- Zhao, M.; Huang, L.; Zeng, R. In-situ observations and modeling of static recrystallization in 300M steel. Mater. Sci. Eng. A 2019, 765, 138300. [Google Scholar] [CrossRef]
- Zhao, M.; Huang, L.; Zeng, R. In-situ observations and modeling of metadynamic recrystallization in 300M steel. Mater. Charact. 2020, 159, 109997. [Google Scholar] [CrossRef]
- Zeng, R.; Huang, L.; Li, J. Quantification of multiple softening processes occurring during multi-stage thermoforming of high-strength steel. Int. J. Plast. 2019, 120, 64–87. [Google Scholar] [CrossRef]
- Chen, R.; Xiao, H.; Wang, M. Hot Workability of 300M Steel Investigated by In Situ and Ex Situ Compression Tests. Metals 2019, 9, 880. [Google Scholar] [CrossRef]
- Chen, R.; Zheng, Z.; Li, N. In-situ investigation of phase transformation behaviors of 300M steel in continuous cooling process. Mater. Charact. 2018, 144, 400–410. [Google Scholar] [CrossRef]
- Liu, J.; Edberg, J.; Tan, M.J. Finite element modelling of superplastic-like forming using a dislocation density-based model for AA5083. Model. Simul. Mater. Sci. Eng. 2013, 21, 25006–25028. [Google Scholar] [CrossRef]


© 2020 by the authors. Licensee MDPI, Basel, Switzerland. This article is an open access article distributed under the terms and conditions of the Creative Commons Attribution (CC BY) license (http://creativecommons.org/licenses/by/4.0/).