Abstract
An as-cast macrostructure of electron beam additively manufactured metallic materials was represented by coarse columnar grains whose axes were inclined at 25° with respect to the substrate’s plane. One part of the as-grown samples was annealed to form a coarse grain microstructure while the other part was pre-deformed by forging and then annealed what allowed obtaining recrystallized microstructures with small grains and multiple annealing twin boundaries. This sample showed both high strength and plasticity during the tensile tests. These tensile tests demonstrated also two-stage stress-strain curves as depended on their strain hardening rates. High and low strain hardening rates corresponded to a twinning-dominated deformation at stage II and dislocation-base deformation at stage III. A submicron size strain-induced grain-subgrain microstructure was formed in the vicinity of a necked zone as a result of combined twinning/dislocation grain refining.
1. Introduction
Additive processes have been developed during recent last decades to allow the manufacturing of complex near net-shape articles with their mechanical characteristics suitable for further mechanical processing. There are, however, some problems with improving the quality of macro-and microstructures in the layer-by-layer grown materials and thus obtaining the desired optimal structures and phases. For instance, it is a well-known fact that electron beam additive manufacturing (EBAM) on specific metallic materials like titanium [1,2] or aluminum bronze [3] might result in growing large columnar dendrites whose height would be almost equal to that of the obtained sample. Such a sample would then be characterized by high anisotropy of its mechanical characteristics, and to improve the situation, either heat or thermo-mechanical treatment must be used. Various post-manufacturing treatment methods may be used mainly for improving the microstructure and mechanical characteristics of additively manufactured titanium alloys. However, there are many fewer methods in use for low stacking fault energy single-phase aluminum bronzes printed using the electron beam wire-feed method. Single-phase aluminum bronzes possess a set of characteristics including high mechanical characteristics, good corrosion and cavitation resistance, non-sparking properties, and machinability, which makes them almost irreplaceable when fabricating pipe fittings, bellows, bearings, strips, wires intended for oil and petrochemical industries, marine and ship equipment, water supplies, etc.
Using severe plastic deformation on copper [4] and brass [5] resulted in improved strength, but simultaneously affected their ductility greatly. That loss of ductility should have a negative effect on dimensional post-processing, and therefore some balance between strength and ductility must be looked for.
It was shown recently [6,7,8,9,10,11,12], however, that there are advanced approaches to tailoring both the composition and microstructure of some FCC solid solution alloys that allow improvements in both strength and ductility. One such approach is based on changing the stacking fault energy and thus making use of a twinning-induced plasticity effect. Another approach is used to control both the shape and size of the alloy grains, as well as the grain boundary type. Dislocation-base deformation is easily developed in the coarse grains while twinning is delayed until reaching higher strain hardening stages. In smaller grains, the dislocation free-run length is shorter, such that twinning starts at earlier deformation stages and thus quickly becomes a dominating deformation mechanism. Tailoring the grain size allows combining two strengthening mechanisms, for example, the grain size of ~20 μm in Cu-Al alloy proved to achieve such a cooperative effect, improve ultimate strength, and yield strength levels.
A grain boundary type may be a factor that is no less important for strain hardening than stacking fault energy or grain size. Grain boundary engineering or thermomechanical processing is of wide use for controlling the grain boundary in the FCC alloys [7]. For instance, Σ3 twin boundaries are very effective dislocation barriers and simultaneously are not prone to forming dislocation pile-ups that are too dense [8,9,10,11,12].
Therefore, achieving a “synchronous improvement of strength and plasticity (SISP)” [12] or “strength-ductility synergy (SDS)” [13] is possible only when combining contributions from the above-discussed factors in order to provide a delayed initiation of either one of the deformation mechanism at high-strain deformation stages. Such an approach enabled the improvement of both strength and plasticity in TWIP steels [14,15,16], Cu-Zn [17], Cu-Mn [18] and Cu-Al [12] bronzes, Ni-Fe [19] and Cu-Ag alloys [20].
In the case of single-phase additively manufactured samples, the potential of heat treatment for controlling a structural-phase state is limited but it is still possible to improve the plasticity. It is known [21,22] that a CuAl bronze may contain both CuAl2 and Cu9Al4 detrimental precipitates even at the Al content below that of from the corresponding phase diagram. It was suggested [22] that these precipitates might appear due to low energy input in wire-arc additive manufacturing (WAAM). It seems that solidification rates that were too high were achieved in this case when Al had no time to fully dissolve in copper. A homogenizing post-treatment at 900 °C for 2 h resulted in full dissolution of Cu9Al4 and partial dissolution of CuAl2 particles, as well as formation of annealing twins and modification of grain boundaries, which allowed improving both strength and plasticity [22].
A heat treatment in the temperature range 600–700 °C had a positive effect on both corrosion resistance and strength of a nickel bronze sample obtained using selective laser melting (SLM) [23]. A cryogenic treatment was an alternative method used for grain refining, increasing the fraction of high-angle boundaries and thus achieving 20% gain in strength and plasticity in the WAAM-grown Cu-Al-Si samples [24]. These examples clearly show the limited potential of the post-deposition heat treatment for modifying the microstructure and phase composition of the additively manufactured samples.
Several of the most efficient methods of thermomechanical processing, such as rolling, hot isostatic pressing, forging (including ultrasound forging), shot-peening and machine hammer peening, can also be used for improving the corrosion resistance and mechanical characteristics of samples grown with WAAM, SLM or EBAM. Rolling is of most frequently used for eliminating porosity and refining grains in the WAAM-made samples of aluminum [25], heat-resistant nickel [26] and titanium alloys [27], and corrosion-resistant [28], maraging [29], and bainite [30] steels. However, this method requires the use of heavy and bulk roll mills, which are hardly practicable for interpass processing in EBAM. Post-deposition rolling is less efficient and also not in use for complex-shaped articles.
A hot isostatic pressing (HIP) may be applied to reduce the porosity in samples printed using a powder-bed EBAM [31] or SLM [32,33], while the grain size remains intact except for high temperatures, at which point partial recrystallization, phase transformation and grain grown might occur. Thus, only moderate structural evolution manifested in improved isotropy, higher strength and elongation-to-fracture was reported after HIP on Inconel 718 [34]. On the other hand, HIP on a titanium alloy resulted in generation of some surface defects [35].
Hammer peening is applied to modify the subsurface structures by severe plastic deformation with subdivision and misorientation in the previously grown grains, and eliminate the growth textures and large columnar grains [36,37]. Surface modification processes such as cavitation peening, shot peening and laser peening methods were applied on Ti-6Al-4V samples fabricated with the use of direct metal laser sintering and electron beam melting [38], achieving 70–97% improvement in fatigue strength.
An ultrasound shot peening resulted in an increase in the low-cycle fatigue strength of Ti-6Al-4V [39] by a factor of 2.3 as compared to that of the as-grown sample. The same is true with the shot peening on an as-printed aluminum alloy AlSi10Mg [40]. These functionally flexible methods [36,37,38,39,40] were almost as effective as rolling.
In our opinion, hot forging processes have high potential for controlling the microstructural and phase composition evolution of materials in additive manufacturing because of their combination of severe plastic deformation, manifesting as the generation of high-density dislocation substructures, deformation twins with high temperature heating, and initiation of recovery and recrystallization. The resulting microstructures are represented by equiaxed refined grains and increased density of special type high-angle boundaries. Along with that, hot forging with applying a forging force as low as 17–55 N allowed not only reducing the porosity of AISI 316L steel [41] but also refining the grains [42]. Low force and high efficiency are encouraging factors for building and using space-saving equipment suitable, in particular, for vacuum chambers. Additionally, ultrasonic micro-forging treatment allowed grain refining, improved strength, hardness and plasticity in as-printed Ti-6Al-4V [43].
The objective of this work is to study the efficiency of thermal and thermomechanical treatments for structural evolution and improving mechanical characteristics of Cu-Al samples grown from wire by means of EBAM.
2. Equipment, Materials and Methods
An aluminum bronze wall was grown on a AISI 321 steel substrate from a Cu-7.5wt.%Al wire using an electron beam wire-feed machine designed and built at the Institute of Strength Physics SB RAS (Figure 1) [6]. The stainless-steel substrate possesses low thermal conductivity, and therefore it was used in order to reduce risk of cracking at the substrate/coating fusion line [44].
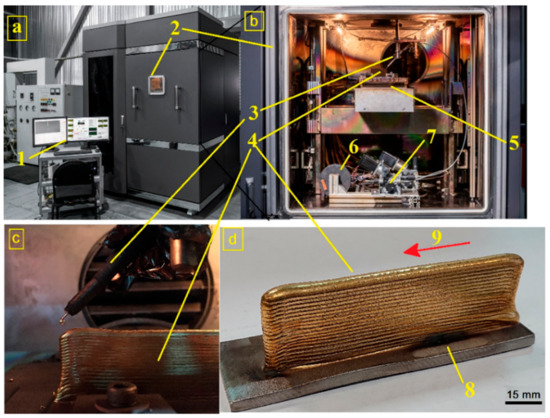
Figure 1.
Laboratory electron beam wire-feed machine (a,b) and aluminum bronze wall grown from the wire (c,d). 1—control panel, 2—vacuum chamber, 3—wire guide nozzle, 4—the sample grown, 5—water-cooled table, 6—wire reel, 7—wire feeder, 8—AISI 321 substrate, 9—table motion (deposition) direction.
Samples intended for mechanical testing and microstructural examination were cut off the wall, as shown in Figure 2, resulting in a total of four groups of samples, as follows: samples 1 and 2 cut off the as-grown wall so that their tensile axes were directed across and along the layers, respectively (Figure 2, pos.3 and pos.4). Sample 3 (Figure 2, pos.5) was annealed at 985 °C for 30 min, and, finally sample 4 (Figure 2, pos. 7) was predeformed by forging to 9% thickness reduction and then annealed at 985 °C for 30 min.
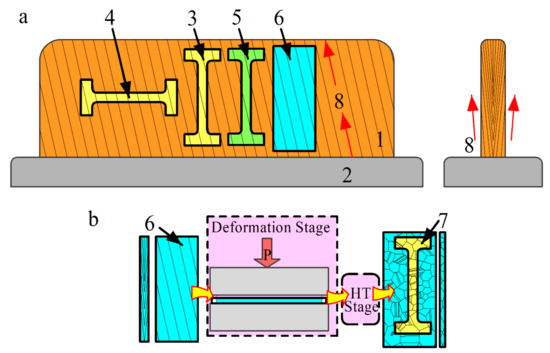
Figure 2.
The tensile sample cut-off scheme (a) and thermomechanical treatment diagram (b). 1—thin-walled printed Cu-Al sample, 2—AISI 321 steel substrate, 3 and 4—as-grown samples for tensile test, 5—as-annealed sample, 6—sample for microstructural characterization and thermomechanical treatment, 7—deformed and then annealed sample, 8—columnar grain growth directions, P—pressure direction at deformation stage for 6th sample, HT—heat treatment stage after deformation.
A tensile testing machine Testsystems 110M-10 (Testsystems, Ivanovo, Russia) was used to determine the mechanical characteristics of the samples at ambient temperatures.
An XRD instrument DRON-7 (Burevestnik, St. Petersburg, Russia) operated at CoKα radiation, 2Θ step 0.05° and exposure 35 s was used for phase identification. Metallographic examination was performed using a confocal laser scanning microscope LEXT 4100 (Olympus Corporation, Tokyo, Japan).
Fractography studies were performed using a scanning electron microscope (SEM) Microtrac SemTrac mini (Microtrac Inc., Montgomeryville, PA, USA). An electron backscatter diffraction (EBSD) instrument Nordlys (Oxford Instruments, High Wycombe, UK) mounted in a Tescan Mira 3 LMU SEM (TESCAN ORSAY HOLDING, Brno, Czech Republic) was used to study the grain orientations and grain boundary misorientations. The EBSD analysis of the obtained data was performed with the use of HKL Channel 5 software (Oxford Instruments, High Wycombe, UK). The sample surface was prepared in accordance with standard mechanical grinding, polishing and ion milling procedures. An SEMPrep2 multifunction device (Technoorg Linda Co. Ltd., Budapest, Hungary) was used for the ion milling.
Transmission electron microscopy (TEM) examination of the thin foils was prepared by first grinding the cut off slices to a thickness of ~160 μm using emery paper, and then thinning them with an ion beam slicer operated at 7 kV for 7–8 h. TEM was carried out using a TEM instrument JEOL JEM-2100 (Tokyo Boeki Ltd., Tokyo, Japan).
3. Experimental Results
3.1. Macro- and Microstructures
An as-grown single-phase bronze sample is microstructurally characterized by columnar grains oriented at some angle with respect to the wall growth direction, and whose lengths increase with the wall height to be as great as ~10 mm (Figure 3). The columnar grain width reached ~2 mm, as viewed in the section plane parallel to the wall’s sides (Figure 3a). The grain width as viewed in the section perpendicular to the table motion direction is about 1 mm (Figure 3b). Such a grain growth pattern was provided by heat sink conditions changing as the wall height is increased so that the heat removal rate reduced when depositing the upper part layers and, therefore, the grains solidified there more slowly and thus grew larger. These columnar grains were partially remelted during deposition of the next layer and served as substrates for epitaxial growth of even larger upper ones.
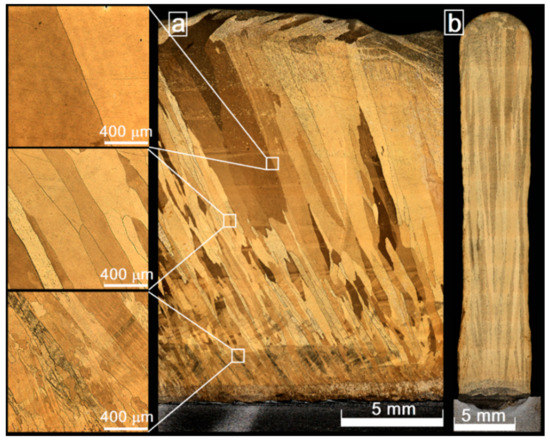
Figure 3.
The microstructures of as-grown Cu-7.5wt.%Al bronze as viewed in sections parallel to the wall sides (a) and perpendicular to the table motion direction (b).
The middle-height part of the as-annealed sample allows revealing a great number of annealing twin microstructures, grain morphology changed from columnar to irregular-shaped and discontinuous grain growth by boundary motion (Figure 4).
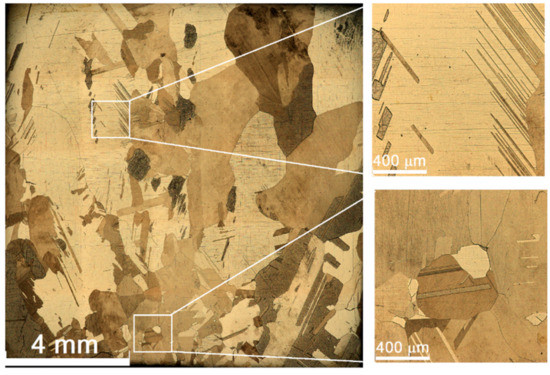
Figure 4.
The microstructure of as-annealed Cu-7.5wt.%Al bronze.
A noticeable grain refining effect was achieved in the pre-deformed and then annealed sample 4 together with forming almost equiaxed grains with numerous annealing twins (Figure 5).
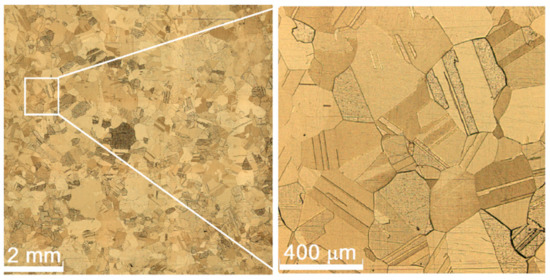
Figure 5.
The microstructure of pre-deformed and annealed Cu-7.5wt.%Al bronze.
3.2. Phase Composition
It was found that all peaks in an XRD pattern obtained from the as-printed metal inherently belong to an FCC Al/Cu solid solution phase, and neither of the post-deposition treatments changed the situation (Figure 6). All the changes occurring to the as-grown metal after annealing and after forging + annealing may be characterized as XRD peak intensity redistribution, i.e., the disappearance of the as-grown sample texture; see, for example, how the heights of (111) and (200) peaks change in the annealed and predeformed and annealed samples as compared to those of the as-printed sample.
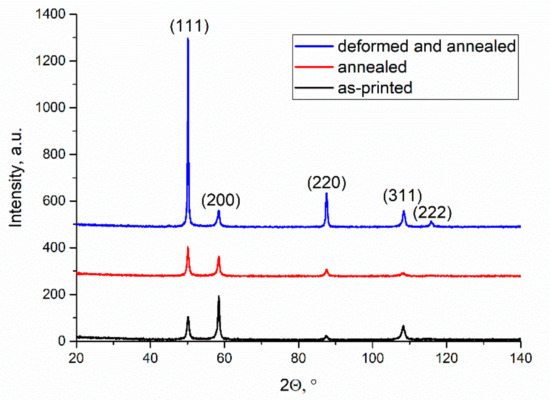
Figure 6.
An XRD pattern for the printed Cu-7.5wt.%Al bronze samples with only FCC phase reflections.
3.3. Grain Orientations and Boundary Misorientation
3.3.1. As-Grown Tensile Test Samples 1 and 2
Let us remember that samples 1 and 2 were cut off the wall, so that their tensile axes were oriented across and along and the layers, respectively. For sample 1 the corresponding grain orientation map shows that the columnar grains are inclined with their long axes at an angle of 25 ± 3° with respect to tensile axis X (Figure 7a). The sample 1 grains were characterized by orientation distribution function (ODF), which identify dumbbell-like grain orientation peaks deviating from those corresponding to an ideal cubic texture (100) <001> (φ1 = 0°, Φ = 0°, φ2 = 0°) (Figure 7b, φ2 = 0). This dumbbell peak is modified with φ2 increasing to 20° when its top part moves closer to the Φ-axis, while its bottom part disappears. A new peak appears at φ2 = 20°, which corresponds to (310) <001> orientation.
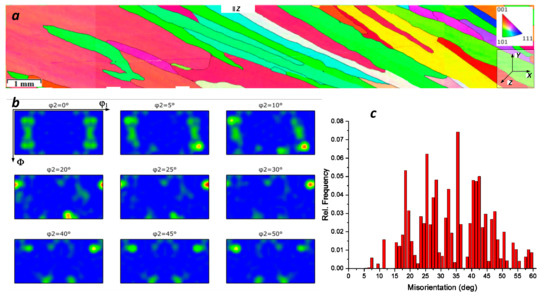
Figure 7.
Grain orientation map (a), ODF (b) and grain boundary misorientation angle distribution (c) for as-grown sample 1.
Grain boundary misorientation distribution in Figure 7c shows close to normal law distribution with the maximum misorientation angle near 35°. The majority of boundary misorientation angles falls within the 15–60° range, i.e., they are the high-angle ones. The multimodality of the distribution can be explained using the existing discrete set of the grain boundary misorientation angles formed.
Since sample 2 represents the as-grown metal section, the same as sample 1 but rotated at 90° angle (Figure 1a), its grain orientation map shows only portions of the columnar grains in Figure 7a, while the tensile axis X is almost perpendicular to the grain boundaries (Figure 8a). The ODF (Figure 8b, φ2 = 0°) demonstrates the presence of that the grain orientation peak close to ideal {100}<001> texture, which corresponds to a typical FCC metal growth texture. Along with that, some other grain orientation components close to (011)] are present. At φ2 = 10° changes are starting to form a pattern corresponding to that for φ2 = 25° with peaks close to (123)] and (120)] orientation. The grain boundary misorientation distribution was similar to that of sample 1 (Figure 7a).
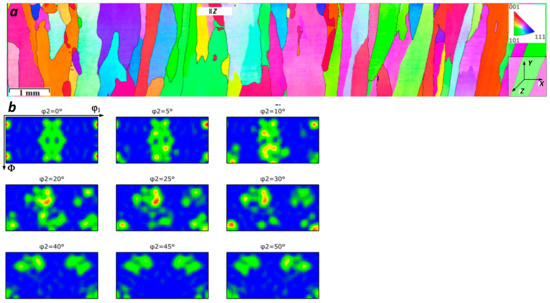
Figure 8.
Grain orientation map (a) and ODF (b) for as-grown sample 2.
3.3.2. As-Annealed Sample 3
Sample 3 is characterized by the presence of large twin-free grains, as well as smaller twinned ones. Such a microstructure may be the result of abnormal grain growth when some grains with high mobility boundaries experience preferential growth at the expense of neighborhood while twin generation is a mechanism compensating the crystallographic incompatibility at the large grain boundaries. Sample 3 shows ()] and (011)] grain orientation components at φ2 = 0° that are modified into (001)], (110)[001] when φ2→50° (Figure 9b).
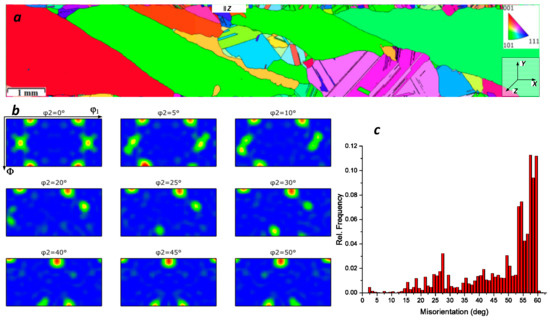
Figure 9.
Grain orientation map (a), ODF (b) and grain boundary misorientation angle distribution (c) for sample 3.
The grain boundary misorientation distribution in Figure 9c shows that the most part of the boundaries have misorientation angles greater than 50°. The twin boundaries relate to high-angle boundaries with misorientation angle 60° (Figure 9c). The percentage of high-angle twin boundaries is about 31.5%. The presence of grain growth defects reduces the mean interboundary distance along the X axis from 2500 μm to ~ 940 μm. The mean distance between the twin boundaries ranges from 200 to 300 μm.
3.3.3. Pre-Deformed and Annealed Sample 4
This sample contains equiaxed recrystallized grains with multiple twin boundaries and mean effective grain size 161 μm (Figure 10a). It is natural that recrystallization after pre-deformation eliminated the growth texture components formed during layer-by-layer electron beam wire-feed deposition. The ODF sections demonstrate that in the φ2 = 0° section, there is an intense (011)] peak that fades away with the increase in φ2 so that almost no preferential orientation can be observed except for small (110)] peaks seen starting from φ2 = 40° (Figure 10b).
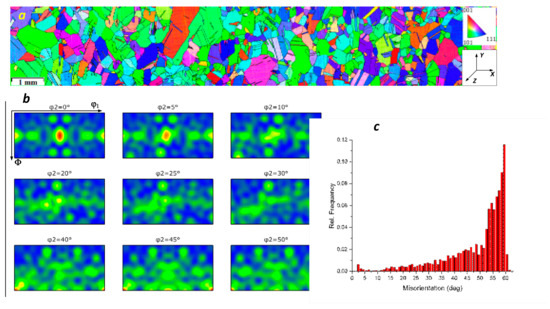
Figure 10.
Grain orientation map (a), ODF (b) and grain boundary misorientation angle distribution (c) for sample 4.
The grain boundary misorientation angle distribution in Figure 10c shows the highest fraction of high-angle boundaries including those with misorientation angle ~60°, which commonly belong to the annealing twins. These special type boundaries make up a fraction of 20.4%.
Mean grain sizes measured without and with taking into account the twin boundaries were 313 μm and 161 μm, respectively.
3.4. Tensile Strength and Deformation Stages
Both “stress-strain” and “strain hardening rate-strain” diagrams for the uniaxial static tension testing on samples 1–4 are presented in Figure 11a,b.
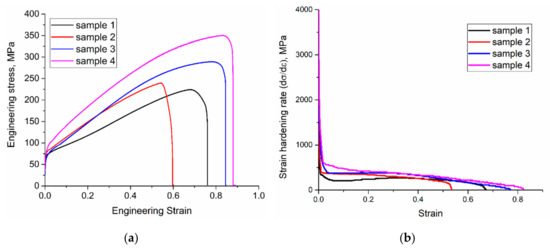
Figure 11.
The “stress-strain” (a) and “strain hardening rate-strain” (b) curves obtained from tensile tests on the samples 1–4.
Tensile test diagrams in Figure 11a,b make is possible to see that all samples show qualitatively the same type of the stress-strain curves, which are characterized by a short transition stage (ε < 0.03), followed by strain hardening stages II and III, which may be differentiated one from another by their strain-hardening coefficients (see SHRII and SHRIII in Table 1), and finally a fracture development stage.

Table 1.
Mechanical Tensile Characteristics of the Sample.
Table 1 summarizes the mechanical properties of the aluminum bronze alloy resulting from all the samples tested. The main mechanical characteristics such as yield stress (YS), ultimate tensile strength (UTS), plasticity (δ), strain-to-UTS (εmax), strain to stage III (εIII), and the tensile strength at the onset of stage III (TSIII) were determined from the experiments. The strain hardening rate for the corresponding stage of “stress-strain” curves (SHRi) was obtained using linear approximations of the relevant curve portions.
Since all the samples were coarse-grained and some of them also contained numerous annealing twin boundaries, the mean grain size was measured along the intercept coinciding with the tensile axis so that all the boundaries were taken into account. Therefore, the microstructures were characterized by some effective mean grain size Def.
A UTS value was continuously increasing from sample 1 to sample 4, while YS decreased for as-annealed sample 3. Plasticity δ values obtained on samples 3 and 4 were higher than those for samples 1 and 2 (Table 1). Then one can see from comparing the strain hardening rates (SHRII) in Table 1 that strain hardening of sample 1 at twinning stage II was developing more slowly than that of sample 2. The same situation applies for the strain hardening at stage III. Such a situation is in agreement with the experimental fact that sample 2 showed the minimum plasticity δ = 0.6 in the necked zone. It seems that orientation of grain boundaries with respect to tensile axis was the main factor in long-range stress accumulation and initiation of the twinning.
The stage II strain hardening rate in sample 4 was higher than that of sample 3. In this case, the main role was played by twinning and the availability of extra boundaries including those of numerous annealing twins. Therefore, critical level of stress needed to initiate twinning was achieved faster. At the same time, both samples demonstrated almost the same levels of SHRIII lower than that of sample 1, and especially sample 2.
The best set of mechanical characteristics was demonstrated with the pre-deformed and annealed sample 4, such as highest yield and ultimate stresses combined with the maximum level of plasticity. Along with some factors to be discussed later, such a combination may be the result of effective grain refining and the presence of special type boundaries.
3.5. Deformation Surface Morphology
The sample surface morphology is changed during deformation such that these changes correspond to the strain stages achieved in samples (Figure 12). The deformed surface of sample 1 is characterized by reorientation and distortion of as-grown and inclined at 25° to the tensile axis columnar grains. Such a crystallographic reorientation with respect to tensile axis is accompanied by a change in the deformed surface morphology through the generation of slip bands, as well as some other deformation surface formations developed at different scale levels [45].
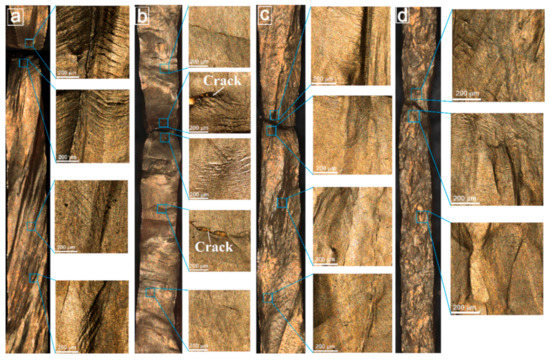
Figure 12.
Deformation surface morphologies after tensile tests of as-grown samples 1 (a) and 2 (b), annealed sample 3 (c) and pre-deformed and annealed sample 4 (d).
It should be noted here that the finest deformation morphology components, such as fine isolated slip lines, were not resolved in the present study. Only slip bands composed of at least several parallel slip lines were revealed. The majority of the grains in sample 1 contained slip bands belonging to more than one slip planes including the intercrossing planes (Figure 12a). In addition to thin and rectilinear slip bands, there are morphology elements that are more typical for higher strain levels. These elements may be characterized as a series of coarse distorted slip bands that form an overthrust zone morphologically similar to fold [46,47] or corrugated structures (Figure 12a).
Strain generation of those fold or wrinkling structures is accompanied by generation of misoriented microbands and twin boundary substructures. Therefore, one may say that tensile deformation of the sample 1 columnar grain structure is accompanied by grain reorientation, activation of new slip systems, and generation of misoriented substructures with sub-boundaries. The latter structures are more frequently met in the vicinity of the necked zone.
Tensile deformation of sample 2 resulted in the sample’s shape distortion, reorientation of as-grown grains, and generation of deformation surface morphology, as shown in Figure 12 b. Distortion of the shape of sample 2 could be related to the fact that each grain deformed using its own slip system orientations. Some grain boundaries revealed the presence of cracks (Figure 12b). Such grain boundary cracking was shown to appear mainly along the high-angle boundaries [8], while special types of boundaries proved to be more crack-resistant, and thus improved the strain homogeneity of the tensile sample gauge part. [8,48,49,50]. In connection with this, considerable strain inhomogeneity was observed in sample 2 after tensile test. Again, coarser deformation surface morphology composing the overthrust or fold structure components was found in the necked zone as compared to the gauge length periphery (Figure 12b). Bent slip bands can be also seen on the background of single or double slip system bands as viewed along the direction close to that of a normal. Such an overthrust region formed in the direction perpendicular to that of a load is typical for FCC single crystals under uniaxial compression test when a compression axis is chosen to be parallel to crystallographic axis <111> [46,51].
The annealed coarse grain structure of sample 3 was altered by tensile deformation mostly in the central part of gauge length where the main crack propagated across the large two grains. Parallel slip mesoband systems were formed in one of the grains, which experienced almost twice as much elongation along the tensile axis. A system of parallel slip bands flatwise to the tensile axis formed in the second grain according to slip system was activated. In addition to these systems, the large grains located closer to the tensile machine clamps demonstrated the presence of the overthrust or fold structures. The majority of grains showed parallel slip systems oriented at 30–60° with respect to the tensile axis. It is conceivable that the annealed grain orientation as well as reduced number of defects served to improve the plasticity of sample 3 almost by 10% as compared to that of sample 1.
The predeformed and annealed sample 4 was composed of at least one order of magnitude smaller equiaxed grains with numerous twin boundaries. After deformation by tension, grains located outside the neck zone revealed parallel slip band systems (Figure 12d). Grains inside the neck zone demonstrated a complex surface morphology composed of rectilinear slip bands as well as bended fold-like slip bands (Figure 12d) that were formed at higher strain. The deformation surface became wavy.
3.6. Deformation Mechanisms
The above-discussed surface morphology changes occur simultaneously with internal fine structure changes, which were examined using TEM images obtained from thin foils cut out of sample 1 and sample 4. For sample 1, these thin foils were obtained from the cross section areas located 1500 and 3500 μm (sections 1-1 and 1-2, respectively) away from the fracture surface. The corresponding distances for sample 4 thin foils were 500 and 2000 μm (sections 4-1 and 4-2). Measuring a gauge part width reduction in the section of interest, one may evaluate the local strain. Correspondingly, strain levels of 21% and 15% were determined for the 1-1 and 1-2 sections, respectively. For sample 4, these values were 35% (4-1) and 25% (4-2). The measurement error was about ±3%.
Sample 1 foil (1-2 section) TEM bright field images allow two intersecting twin systems to be seen (Figure 13a), which can be clearly seen also in the dark-field image (Figure 13b) using the twin reflection inside a circle in the SAED pattern inset. Shear bands may be formed in this zone, as shown in Figure 13a. The widths of the first and second system twins are 0.1–0.3 μm and 0.05–0.1 μm, respectively. In addition, the SAED pattern allows seeing oriented diffuse scattering streaks, which are the well-known electron diffraction effect of microtwinning [52].
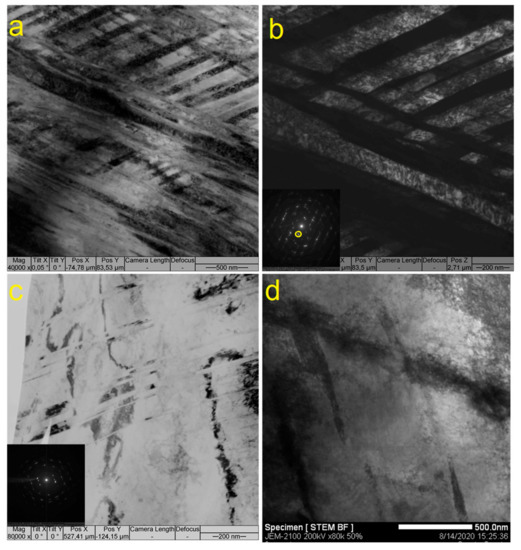
Figure 13.
Bright (a) and dark field (b) TEM images of two intersecting deformation twin systems in sample 1-2 (a,b) and thin twins as well as twin-free areas 1-1 (c,d). The dark field images were obtained using the twin reflections shown in circles in corresponding SAED insets.
High-density dislocation structures can be seen in section 1-1 TEM images located in the vicinity of fracture surface (Figure 13c,d), as well as twins subdivided by the dislocation arrays.
TEM images of section 1-1 show both twin-free and twin areas (Figure 13c,d), as well as those occupied by deformation twins, which predominantly belong to only one system and detected mainly from a SAED pattern inset in Figure 13c. The twin-free areas of the 1-1 thin foil contain deformation induced sub-boundaries (Figure 13d) and extinction contours, which are indicative of the increasing long-range stress. That type substructures are commonly observed at the pre-fracture stage of deformation which, however, is not the case in this situation, taking into account the 21% strain achieved in this section. It is suggested therefore that grain orientation has some effect on the structures formed in the coarse-grained samples. If it were true, then grain orientation would be favorable for twinning in section 1-2, while it would not be so in section 1-1. Therefore, this section shows less contribution of twinning to the deformation as compared to that of found in section 1-2.
TEM images of the 4-2 sections of sample 4 allow the observation of areas occupied by pronounced twin systems (Figure 14a,b). The section 4-2 images represent long rectilinear twins, which create either single parallel or two intersecting twin systems (Figure 14a,b). This structure shows only moderate continuous misorientations judging by the SAED pattern in Figure 14b.
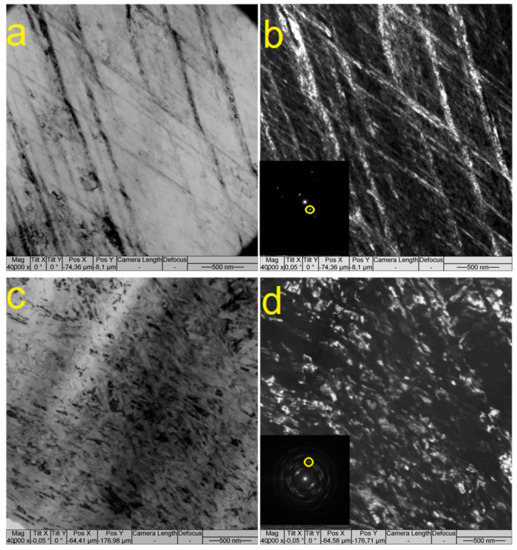
Figure 14.
TEM bright and dark field images of twin systems formed in section 4-2 (a,b) and submicron sized microstructures formed in sample 4-1 (c,d) after tensile test on sample 4. The dark field images were obtained using the twin reflections shown in circles in corresponding SAED insets.
The fine structure found in section 4-1 is represented by submicron-sized substructures formed by intense plastic deformation (Figure 14c,d). The SAED ring pattern in the inset of Figure 14d shows high azimuthal misorientation of the subdivided subgrains. Such a degree of strain refinement in tensile tests might have been achieved even if the material had been ductile enough not to fail through brittle fracture. The combined action of twinning dislocation slip and mechanisms may be the reason for achieving such fine grain subdivision, as well as maximum strength and ductility.
3.7. Fractography
Fracture surfaces of the as-grown sample 1 (Figure 15a) show brittle fracture areas along with ridge-and-drop small areas which relate to the viscous type of fracture. The sample 2 fracture surface contains a grain boundary between two neighboring grains, which shows brittle and viscous types of fracture, respectively. Similar types of fracture surface were observed on sample 3 (Figure 15c). Sample 4 is characterized by an almost completely viscous type of fracture (Figure 15d), which corresponds to the submicron fine structure of metal formed in the vicinity of the fracture surface (Figure 14c,d).
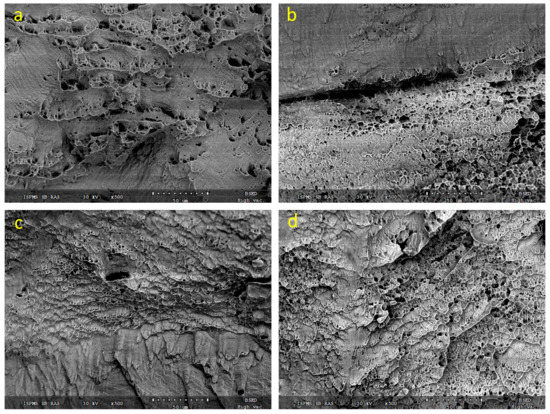
Figure 15.
The SEM images of fracture surface of printed sample 1 (a), sample 2 (b), sample 3 (c) and sample 4 (d).
4. Discussion
The tensile deformation behavior of the samples can be a function of their microstructure and deformation mechanisms. An as-grown sample showed a microstructure typical of the fusion deposited layers with long columnar grains oriented in the direction of growth, i.e., at some angle with respect to wall height and layer deposition direction. For sample 1, the tensile axis was at a 25° angle to the columnar grains, whose crystallographic orientations deviated from those of the ideal growth texture. Such a finding affects the low plasticity of this sample. TEM showed that twinning was the main mechanism of deformation in a section 3500 μm away from the fracture surface, i.e., the grain orientation was favorable for twinning at deformation stage II. At the same time, fewer of twinned areas and more of those occupied by dislocation arrays were observed in section 1-1, spaced 1500 μm away from the fracture. Such a situation makes it possible to suggest that the dislocation-base deformation mechanism succeeded the twinning at stage III.
The fact that grain boundaries were perpendicular to the tensile axis in sample 2 hindered the grain boundary reorientation and was favorable for twinning from the very beginning, which is evident from the higher strain hardening rate at stages II and III. The poor ductility of this sample may be related to the perpendicular grain boundary orientation with respect to that of the tensile load, resulting in folding and cracking along these boundaries (Figure 12b).
In the as-annealed sample 3, migrating grain boundaries formed large almost defectless grains, as well as those containing the annealing twin boundaries. The grain structure orientations have been thus changed as compared to those of sample 1. The presence of twin boundaries served for higher rate strain hardening (Table 1) at stage II by means of twinning, while at stage III, the strain hardening rate was lower than that of samples 1 and 2. Such a situation may be explained by high ductility and the favorable orientation of large recrystallized twin-free grains.
Sample 4 equiaxed grain microstructure was formed by static recrystallization from its pre-deformed state, and therefore contained a high number of annealing twin boundaries, which were effective dislocation motion barriers in deformation. Therefore, dislocation pile-ups were created and then followed by twinning at stage II. Such a statement is supported by the fact that sample 4 demonstrated the highest strain hardening rate SHRII value. Stage III was characterized by somewhat lower SHRIII determined by the dislocation mechanism, when active dislocation slip and multiplication were initiated in twins and the inter-twin spaces. The result of such a process was twin structure subdivision and refinement when the submicron-sized subgrain microstructure commonly found in metals after severe plastic deformation has been formed in the vicinity of fracture surface. Coarser twin structures were found in cross section areas located closer to the tensile machine clamps. Such high-strain refined microstructures can be generated on the basis of mechanisms discussed elsewhere [53] when dislocation walls subdivide the already formed twins, increase misorientation between their fragments and thus finally form almost equiaxed fine grain-subgrain structures. Let us note that the same twin refining mechanism was observed in ECAP on Cu-37wt.%Zn brass [5].
5. Conclusions
Directional solidification of metal in the course of additive electron beam wire-feed manufacturing resulted in growing coarse columnar grains in low stacking fault energy aluminum bronze samples. An effort was undertaken to mend such a detrimental effect of microstructure by means of pre-deformation and annealing. All samples were characterized for microstructure and mechanical strength. The main findings were as follows.
The as-grown sample was characterized by columnar grains inclined at 25° to the substrate surface. These grains showed their preferential orientations deviating from that of ideal cubic growth texture, which resulted in inhomogeneous development of deformation strain in the course of tensile test and low strength and plasticity. Analysis of stress/strain curves shows that deformation in these aluminum bronze samples occurred according to dislocation-twinning-dislocation mechanism, with the twin structure subdivision by dislocations at the pre-fracture stage.
Pre-deformed and recrystallized samples showed the highest strength and plasticity characteristics. This thermomechanical treatment allowed forming equiaxed high-angle grain boundaries with numerous annealing twin boundaries, which served as barriers for dislocations and thus initiated high strain hardening rate deformation twinning. Submicron grain-subgrain microstructure was formed in the necking zone of the tensile sample by means of twin subdivision mechanism.
Author Contributions
Conceptualization, A.F. and S.T.; methodology, A.V., S.T. and D.V.L.; formal analysis, E.K. (Ekaterina Khoroshko); investigation, E.K. (Ekaterina Khoroshko), A.F., E.M., S.F. D.V.L., N.S.; data curation, A.F. and S.T.; writing—original draft preparation, S.T., E.M., E.K. (Ekaterina Khoroshko) and A.F.; writing—review and editing, S.T. and A.F.; supervision, E.K. (Evgeny Kolubaev); funding acquisition, E.K. (Ekaterina Khoroshko) and E.K. (Evgeny Kolubaev). All authors have read and agreed to the published version of the manuscript.
Funding
The study was carried out with the financial support of the RFBR according to the research Project No. 19-38-90130.
Acknowledgments
Investigations were carried out using the equipment center for collective use “Analytical Center Geochemistry of Natural Systems” National Research Tomsk State University and Institute of Strength Physics and Materials Science of the Siberian Branch of the Russian Academy of Sciences.
Conflicts of Interest
The authors declare no conflict of interest.
References
- Utyaganova, V.R.; Vorontsov, A.V.; Eliseev, A.A.; Osipovich, K.S.; Kalashnikov, K.N.; Savchenko, N.L.; Rubtsov, V.E.; Kolubaev, E.A. Structure and Phase Composition of Ti-6Al-4V Alloy Obtained by Electron-Beam Additive Manufacturing. Russ. Phys. J. 2019, 62, 1461–1468. [Google Scholar] [CrossRef]
- Kalashnikov, K.N.; Rubtsov, V.E.; Savchenko, N.L.; Kalashnikova, T.A.; Osipovich, K.S.; Eliseev, A.A.; Chumaevskii, A.V. The effect of wire feed geometry on electron beam freeform 3D printing of complex-shaped samples from Ti-6Al-4V alloy. Int. J. Adv. Manuf. Technol. 2019, 105, 3147–3156. [Google Scholar] [CrossRef]
- Khoroshko, E.S.; Filippov, A.V.; Tarasov, S.Y.; Shamarin, N.N.; Kolubaev, E.A.; Moskvichev, E.N.; Lychagin, D.V. Study of the Structure and Mechanical Properties of Aluminum Bronze Printed by Electron Beam Additive Manufacturing. Obrab. Met. Met. Work. Mater. Sci. 2020, 22, 118–129. [Google Scholar] [CrossRef]
- Filippov, A.V.; Tarasov, S.Y.; Fortuna, S.V.; Podgornykh, O.A.; Shamarin, N.N.; Vorontsov, A.V. Wear, vibration and acoustic emission characterization of sliding friction processes of coarse-grained and ultrafine-grained copper. Wear 2019, 424–425, 78–88. [Google Scholar] [CrossRef]
- Filippov, A.V.; Tarasov, S.Y.; Fortuna, S.V.; Podgornykh, O.A.; Shamarin, N.N.; Rubtsov, V.E. Microstructural, mechanical and acoustic emission-assisted wear characterization of equal channel angular pressed (ECAP) low stacking fault energy brass. Tribol. Int. 2018, 123, 273–285. [Google Scholar] [CrossRef]
- Tian, Y.Z.; Zhao, L.J.; Park, N.; Liu, R.; Zhang, P.; Zhang, Z.J.; Shibata, A.; Zhang, Z.F.; Tsuji, N. Revealing the deformation mechanisms of Cu-Al alloys with high strength and good ductility. Acta Mater. 2016, 110, 61–72. [Google Scholar] [CrossRef]
- Watanabe, T. Grain boundary engineering: Historical perspective and future prospects. J. Mater. Sci. 2011, 46, 4095–4115. [Google Scholar] [CrossRef]
- Guan, X.J.; Shi, F.; Ji, H.M.; Li, X.W. Gain boundary character distribution optimization of Cu-16at.%Al alloy by thermomechanical process: Critical role of deformation microstructure. Mater. Sci. Eng. A 2019, 765, 138299. [Google Scholar] [CrossRef]
- Han, D.; Guan, X.J.; Yan, Y.; Shi, F.; Li, X.W. Anomalous recovery of work hardening rate in Cu-Mn alloys with high stacking fault energies under uniaxial compression. Mater. Sci. Eng. A 2019, 743, 745–754. [Google Scholar] [CrossRef]
- Shen, Z.; Wagoner, R.H.; Clark, W.A.T. Dislocation pile-up and grain boundary interactions in 304 stainless steel. Scr. Mater. 1986, 20, 921–926. [Google Scholar] [CrossRef]
- Shen, Z.; Wagoner, R.H.; Clark, W.A.T. Dislocation and grain boundary interactions in metals. Acta Metall. 1988, 36, 3231–3242. [Google Scholar] [CrossRef]
- Liu, R.; Zhang, Z.J.; Li, L.L.; An, X.H.; Zhang, Z.F. Microscopic mechanisms contributing to the synchronous improvement of strength and plasticity (SISP) for TWIP copper alloys. Sci. Rep. 2015, 5, 9550. [Google Scholar] [CrossRef] [PubMed]
- Zhu, Z.; Li, W.; Nguyen, Q.B.; An, X.; Lu, W.; Li, Z.; Ng, F.L.; Nai, S.; Wei, J. Enhanced strength–ductility synergy and transformation-induced plasticity of the selective laser melting fabricated 304L stainless steel. Addit. Manuf. 2020, 35, 101300. [Google Scholar] [CrossRef]
- Bouaziz, O.; Allain, S.; Scott, C.P.; Cugy, P.; Barbier, D. High manganese austenitic twinning induced plasticity steels: A review of the microstructure properties relationships. Solid State Mater. Sci. 2011, 15, 141–168. [Google Scholar] [CrossRef]
- Liang, X.; McDermid, J.R.; Bouaziz, O.; Wang, X.; Embury, J.D.; Zurob, H.S. Microstructural evolution and strain hardening of Fe–24Mn and Fe–30Mn alloys during tensile deformation. Acta Mater. 2009, 57, 3978–3988. [Google Scholar] [CrossRef]
- Yang, P.; Xie, Q.; Meng, L.; Ding, H.; Tang, Z. Dependence of deformation twinning on grain orientation in a high manganese steel. Scr. Mater. 2006, 55, 629–631. [Google Scholar] [CrossRef]
- Zhang, P.; An, X.H.; Zhang, Z.J.; Wu, S.D.; Li, S.X.; Zhang, Z.F.; Figueiredo, R.B.; Gao, N.; Langdon, T.G. Optimizing strength and ductility of Cu-Zn alloys through severe plastic deformation. Scr. Mater. 2012, 67, 871–874. [Google Scholar] [CrossRef]
- Wu, X.X.; San, X.Y.; Liang, X.G.; Gong, Y.L.; Zhu, X.K. Effect of stacking fault energy on mechanical behavior of cold-forging Cu and Cu alloys. Mater. Des. 2013, 47, 372–376. [Google Scholar] [CrossRef]
- Mu, J.; Li, X.; Zhao, L.; Jiang, Z.; Lian, J.; Jiang, Q. Stable ductility of an electrodeposited nanocrystalline Ni–20wt.%Fe alloy in tensile plastic deformation. J. Alloys Compd. 2013, 553, 99–105. [Google Scholar] [CrossRef]
- Raju, K.S.; Sarma, V.S.; Kauffmann, A.; Hegedűs, Z.; Gubicza, J.; Peterlechner, M.; Freudenberger, J.; Wilde, G. High strength and ductile ultrafine-grained Cu–Ag alloy through bimodal grain size, dislocation density and solute distribution. Acta Mater. 2013, 61, 228–238. [Google Scholar] [CrossRef]
- Ying, D.Y.; Zhang, D.L. Solid-state reactions between Cu and Al during mechanical alloying and heat treatment. J. Alloys Compd. 2000, 311, 275–282. [Google Scholar] [CrossRef]
- Dong, B.; Pan, Z.; Shen, C.; Ma, Y.; Li, H. Fabrication of Copper-Rich Cu-Al Alloy Using the Wire-Arc Additive Manufacturing Process. Metall. Mater. Trans. B 2017, 48, 3143–3151. [Google Scholar] [CrossRef]
- Murray, T.; Thomas, S.; Wu, Y.; Neil, W.; Hutchinson, C. Selective laser melting of nickel aluminium bronze. Addit. Manuf. 2020, 33, 101122. [Google Scholar] [CrossRef]
- Liu, K.; Chen, X.; Shen, Q.; Pan, Z.; Singh, R.A.; Jayalakshmi, S.; Konovalov, S. Microstructural evolution and mechanical properties of deep cryogenic treated Cu–Al–Si alloy fabricated by Cold Metal Transfer (CMT) process. Mater. Charact. 2020, 159, 110011. [Google Scholar] [CrossRef]
- Gu, J.; Wang, X.; Bai, J.; Ding, J.; Williams, S.; Zhai, Y.; Liu, K. Deformation microstructures and strengthening mechanisms for the wire+arc additively manufactured Al-Mg4.5Mn alloy with inter-layer rolling. Mater. Sci. Eng. A 2018, 712, 292–301. [Google Scholar] [CrossRef]
- Xu, X.; Ganguly, S.; Ding, J.; Seow, C.E.; Williams, S. Enhancing mechanical properties of wire + arc additively manufactured INCONEL 718 superalloy through in-process thermomechanical processing. Mater. Des. 2018, 160, 1042–1051. [Google Scholar] [CrossRef]
- Martina, F.; Colegrove, P.A.; Williams, S.W.; Meyer, J. Microstructure of Interpass Rolled Wire + Arc Additive Manufacturing Ti-6Al-4V Components. Metall. Mater. Trans. A 2015, 46A, 6103–6118. [Google Scholar] [CrossRef]
- Xie, Y.; Zhang, H.; Zhou, F. Improvement in Geometrical Accuracy and Mechanical Property for Arc-Based Additive Manufacturing Using Metamorphic Rolling Mechanism. J. Manuf. Sci. Eng. 2016, 138, 111002. [Google Scholar] [CrossRef]
- Xu, X.; Ganguly, S.; Ding, J.; Dirisu, P.; Martina, F.; Liu, X.; Williams, S.W. Improving mechanical properties of wire plus arc additively manufactured maraging steel through plastic deformation enhanced aging response. Mater. Sci. Eng. A 2019, 747, 111–118. [Google Scholar] [CrossRef]
- Fu, Y.; Zhang, H.; Wang, G.; Wang, H. Investigation of mechanical properties for hybrid deposition and micro-rolling of bainite steel. J. Mater. Process. Technol. 2017, 250, 220–227. [Google Scholar] [CrossRef]
- Tammas-Williams, S.; Withers, P.J.; Todd, I.; Prangnell, P.B. The Effectiveness of Hot Isostatic Pressing for Closing Porosity in Titanium Parts Manufactured by Selective Electron Beam Melting. Metall. Mater. Trans. A 2016, 47A, 1939–1946. [Google Scholar] [CrossRef]
- Haan, J.; Asseln, M.; Zivcec, M.; Eschweiler, J.; Radermacher, R.; Broeckmann, C. Effect of subsequent Hot Isostatic Pressing on mechanical properties of ASTM F75 alloy produced by Selective Laser Melting. Powder Metall. 2015, 58, 161–165. [Google Scholar] [CrossRef]
- Herzog, D.; Bartsch, K.; Bossen, B. Productivity optimization of laser powder bed fusion by hot isostatic pressing. Addit. Manuf. 2020, 36, 101494. [Google Scholar] [CrossRef]
- Tillmann, W.; Schaak, C.; Nellesen, J.; Schaper, M.; Aydinöz, M.E.; Hoyer, K.-P. Hot isostatic pressing of IN718 components manufactured by selective laser melting. Addit. Manuf. 2017, 13, 93–102. [Google Scholar] [CrossRef]
- Du Plessis, A.; Macdonald, E. Hot isostatic pressing in metal additive manufacturing: X-ray tomography reveals details of pore closure. Addit. Manuf. 2020, 34, 101191. [Google Scholar] [CrossRef]
- Neto, L.; Williams, S.; Ding, J.; Hönnige, J.; Martina, F. Mechanical Properties Enhancement of Additive Manufactured Ti-6Al-4V by Machine Hammer Peening. Lect. Notes Mech. Eng. 2020, 121–132. [Google Scholar] [CrossRef]
- Hönnige, J.R.; Davis, A.; Ho, A.; Kennedy, J.R.; Neto, L.; Prangnell, P.; Williams, S. The Effectiveness of Grain Refinement by Machine Hammer Peening in High Deposition Rate Wire-Arc AM Ti-6Al-4V. Metall. Mater. Trans. A 2020, 51A, 3692–3703. [Google Scholar] [CrossRef]
- Soyama, H.; Takeo, F. Effect of Various Peening Methods on the Fatigue Properties of Titanium Alloy Ti6Al4V Manufactured by Direct Metal Laser Sintering and Electron Beam Melting. Materials 2020, 13, 2216. [Google Scholar] [CrossRef]
- Persenot, T.; Burr, A.; Plancher, E.; Buffière, J.-Y.; Dendievel, R.; Martin, G. Effect of ultrasonic shot peening on the surface defects of thin struts built by electron beam melting: Consequences on fatigue resistance. Addit. Manuf. 2019, 28, 821–830. [Google Scholar] [CrossRef]
- Uzan, N.E.; Ramati, S.; Shneck, R.; Frage, N.; Yeheskel, O. On the effect of shot-peening on fatigue resistance of AlSi10Mg specimens fabricated by additive manufacturing using selective laser melting (AM-SLM). Addit. Manuf. 2018, 21, 458–464. [Google Scholar] [CrossRef]
- Pruncu, C.I.; Hopper, C.; Hooper, P.A.; Tan, Z.; Zhu, H.; Lin, J.; Jiang, J. Study of the Effects of Hot Forging on the Additively Manufactured Stainless Steel Preforms. J. Manuf. Process. 2020, 57, 668–676. [Google Scholar] [CrossRef]
- Duarte, V.R.; Rodrigues, T.A.; Schell, N.; Miranda, R.M.; Oliveira, J.P.; Santos, T.G. Hot forging wire and arc additive manufacturing (HF-WAAM). Addit. Manuf. 2020, 35, 101193. [Google Scholar] [CrossRef]
- Ye, H.; Ye, K.; Guo, B.-G.; Le, F.-B.; Wei, C.; Sun, X.; Wang, G.-Y.; Liu, Y. Effects of combining ultrasonic micro-forging treatment with laser metal wire deposition on microstructural and mechanical properties in Ti–6Al–4V alloy. Mater. Charact. 2020, 162, 110187. [Google Scholar] [CrossRef]
- Wang, Y.; Chen, X.; Konovalov, S.; Su, C.; Siddiquee, A.N.; Gangil, N. In-situ wire-feed additive manufacturing of Cu-Al alloy by addition of silicon. Appl. Surf. Sci. 2019, 487, 1366–1375. [Google Scholar] [CrossRef]
- Lychagin, D.V.; Starenchenko, V.A.; Solov’eva, Y.V. Classification and scale hierarchy of structure elements in compression-strained fcc single crystals. Phys. Mesomech. 2006, 9, 63–72. [Google Scholar]
- Lychagin, D.V.; Tarasov, S.Y.; Chumaevskii, A.V.; Alfyorova, E.A. Macrosegmentation and strain hardening stages in copper single crystals under compression. Int. J. Plast. 2015, 69, 36–53. [Google Scholar] [CrossRef]
- Lychagin, D.V.; Tarasov, S.; Chumaevskii, A.V.; Alfyorova, E.A. Strain-induced folding on [111]-copper single crystals under uniaxial compression. Appl. Surf. Sci. 2016, 371, 547–561. [Google Scholar] [CrossRef]
- Lu, K. Stabilizing nanostructures in metals using grain and twin boundary architectures. Nat. Rev. Mater. 2016, 1, 1–13. [Google Scholar] [CrossRef]
- Li, L.L.; Zhang, Z.J.; Zhang, P.; Yang, J.B.; Zhang, Z.F. Difference in fatigue cracking behaviors of Cu bicrystals with the same component grains but different twin boundaries. Scr. Mater. 2015, 95, 19–22. [Google Scholar] [CrossRef]
- Qu, S.; Zhang, P.; Wu, S.D.; Zhang, Q.S.; Zhang, Z.F. Twin boundaries: Strong or weak? Scr. Mater. 2008, 59, 1131–1134. [Google Scholar] [CrossRef]
- Lychagin, D.V.; Alfyorova, E.A.; Starenchenko, V.A. Effect of crystallogeometric states on the development of macrobands and deformation inhomogeneity in [111] nickel single crystals. Phys. Mesomech. 2011, 14, 66–78. [Google Scholar] [CrossRef]
- Andrews, K.W.; Dyson, D.J.; Keown, S.R. Interpretation of Electron Diffraction Patterns; Springer: Boston, MA, USA, 1967; p. 188. [Google Scholar] [CrossRef]
- Wang, K.; Tao, N.R.; Liu, G.; Lu, J.; Lu, K. Plastic strain-induced grain refinement at the nanometer scale in copper. Acta Mater. 2006, 54, 5281–5291. [Google Scholar] [CrossRef]
Publisher’s Note: MDPI stays neutral with regard to jurisdictional claims in published maps and institutional affiliations. |
© 2020 by the authors. Licensee MDPI, Basel, Switzerland. This article is an open access article distributed under the terms and conditions of the Creative Commons Attribution (CC BY) license (http://creativecommons.org/licenses/by/4.0/).