Article

The Effect of Preliminary Thermomechanical Processing on the Kinetics of Localized Plasticity Autowaves in Trip Steel

Institute of Strength Physics and Materials Science, Siberian Branch, Russian Academy of Sciences, Tomsk 634055, Russia
*
Author to whom correspondence should be addressed.
Metals 2020, 10(11), 1494; https://doi.org/10.3390/met10111494
Submission received: 23 October 2020 / Revised: 3 November 2020 / Accepted: 4 November 2020 / Published: 9 November 2020
(This article belongs to the Special Issue Thermo-Mechanical Processing and Additive Manufacturing of Steels)

Abstract

:
The kinetics of the martensitic transformation fronts in transformation-induced plasticity (TRIP) steel was studied in relation to preliminary thermomechanical treatment using the digital image correlation method. It was found that warm rolling of steel to 40–63% reduction significantly increases the stress of the onset of strain-induced phase transformation and changes the loading curve stages. The strain-induced phase transformation in TRIP steel occurring through the formation of Lüders and Portevin–Le Chatelier bands is shown to be an autowave process of localized plasticity. The austenite → martensite transformation at the elastic-plastic transition occurs in the form of several switching localized plasticity autowaves. At the jerky flow stage, excitation autowaves of localized plasticity are generated and propagate repeatedly until the strain-induced austenite → martensite transformation is completed. It is shown for the first time that the sources of excitation autowaves in the material are the sites of nucleation or annihilation of switching autowaves.

1. Introduction

Strain-induced thermoelastic martensitic transformations have been the subject of numerous experimental and theoretical investigations [1,2,3,4,5]. This specific mechanism determines the properties of the material such as increased strength, superelasticity, shape memory effect and others. The formation of martensite during deformation was first noted by Scheil [6], who found that with decreasing martensite transformation start temperature (Ms) below room temperature plastic deformation can induce a γ (FCC) to α′ (BCC) martensitic transformation. The amount of formed martensite is directly proportional to the strain value. The transformation can occur with the formation of ε-martensite, which is an intermediate phase with an hexagonal close-packed lattice, HCP lattice. The use of high-resolution techniques helped to determine the microscopic mechanisms of the main types of transformations, such as γ → α′, γ → ε, γ → ε → α′, in deformed metastable austenitic steels [1,3,7,8,9].
The recently growing interest in the study of thermoelastic martensitic transformations is, on the one hand, associated with the development of new high-strength materials [10,11,12]. These are transformation-induced plasticity (TRIP) steels demanded in aircraft and automotive industries for the manufacture of safety critical components. The strain-induced martensitic transformations in such materials allow increasing their strength up to 2000 MPa and ductility up to 60%, as well as contribute to better formability and efficient impact energy absorption. At the same time, many aspects of the deformation behavior of TRIP steels are not fully understood. Their mechanical properties are highly dependent on pretreatment [13]. In particular, the stages and types of the stress–strain curves of such steels can drastically change from smooth parabolic σ ~ εn to serrated and curves with a yield plateau [4,11,13].
On the other hand, modern methods for visualizing the deformation kinetics allow observing martensitic transformations in real time. For example, neutron or high-energy X-ray diffraction was used for an in-situ investigation of martensitic transformation in TRIP steels [14,15,16]. The chemical and mechanical partitioning in multiphase TRIP steels was quantitatively investigated using quasi in-situ tensile tests combined with high-resolution electron back-scattered diffraction, microscopic digital image correlation and atom probe tomography [17]. The digital correlation of electron microscopy micrographs was used in a study of martensite band formation [18]. The strain localization behavior during phase transformation in a medium manganese steel was investigated by digital image correlation [19]. As shown [10,11,12,20,21], a strain-induced phase transformation at the macroscale, not only in single crystals but also in polycrystalline objects, can occur through the nucleation and propagation of corresponding fronts. The existence of such phase transformation fronts determines the localized nature of the deformation process.
Recently, the concept of a multilevel and localized nature of plastic deformation is generally accepted; it was first presented in References [22,23]. Analysis of the plastic flow process indicates the existence of dislocation, mesoscopic and macroscopic levels [24,25,26,27,28,29] there. The plastic flow localization takes place in any materials at all loading stages from elastic-plastic transition to fracture as well as at all spatial, temporal and structural levels. This means that the shape and spatio-temporal distribution of localized plasticity sites over the volume of a loaded object can be considered the most important characteristics of plastic deformation. The existence of active sites of macroscopic localized plastic flow as well as data on their nucleation and evolution mechanisms provided a basis for the concepts of self-organization of plastic flow [23,29,30] and, as a consequence, of the autowave nature of localized plastic flow [27,31,32,33,34,35,36]. In general terms, the autowave processes of localized plasticity should be considered as the formation of dissipative structures in active media. A deformable object within the given concept is a universal generator of various autowave modes of localized plasticity [34,35,36]. Based on experiments conducted mainly on polycrystalline bodies with dislocation-mediated plastic flow, a correspondence rule was derived according to which the type of autowave mode is determined by the hardening law applicable at a given stage of the stress-strain curve [35]. The stages with zero hardening σ = const are characterized by switching autowaves observed as single moving sites of localized deformation. At the stages with a constant work hardening coefficient σ ~ ε, the phase autowaves are generated in the form of moving spatially periodic strain localization sites. The parabolic work hardening stages σ ~ ε0.5 correspond to the formation of stationary systems of spatially periodic sites, so-called stationary dissipative structures. The prefracture stages are characterized by autowave collapse, that is, when the strain localization sites are concentrated in a neck. The presence of a jerky flow stage in the stress-strain curve indicates the generation of excitation autowaves in the form of single fronts that, unlike switching autowaves, repeatedly pass through the deformable object [37].
Therefore, it is of great interest to apply the autowave concept for describing the inhomogeneous (localized) plastic flow of materials with strain-induced phase transformation. As noted above, the stress-strain curve of TRIP steel can exhibit both a yield plateau and a jerky flow stage, which can solve the problem of the generation of autowave modes and their interconversion. The ratio of these stages is largely determined by the preliminary reduction of the material. The aim of this work is to study the kinetics of localized plasticity autowaves in deformed TRIP steel depending on preliminary thermomechanical processing.

2. Materials and Methods

The investigation was performed on TRIP steel with the composition presented in Table 1.
Steel sheets of 1 mm thickness in the as-received condition were subjected to thermomechanical processing in different regimes (see Table 2). Annealing of the as-received material was performed to suppress the TRIP effect (state 1). The maximum content of metastable austenite in the sheets was obtained by austenitization (state 2). The amount of work-hardened metastable austenite and the degree of its hardening were controlled by the level of reduction during warm rolling of austenitized steel sheets (states 3,4,5). Five dog-bone specimens with a gauge width of 6 mm and a gauge length of 40 mm were prepared for each state.
The prepared specimens were tested in uniaxial tensile tests at room temperature on an LFM-125 testing machine (Walter + Bai AG, LFM Electromechanical Floor Standing Machines up to 125 kN). The velocity of the movable grip was Vmach = 0.4 mm/min, which ensured a strain rate of 6.67 × 10⁻⁵ s−1. During tensile testing, local displacement fields were identified by digital image correlation (DIC) [38]. To do this, the tensile specimen was illuminated with coherent light from a semiconductor laser with a wavelength of 635 nm and a power of 15 mW. The images of the illuminated deformed specimens with speckle patterns superimposed on them were captured by a digital camera Point Grey FL3-GE-50S5M-C with a frequency of 10 Hz. The kinetics of the strain-induced transformation fronts was presented in this work either as spatio-temporal distribution maps of local elongations εxx(x,y,t) or as chronograms in which the positions of the maxima of εxx in space and time were shown by dark spots showing the propagation tracks. Microstructural studies were carried out using a Neophot-21 optical microscope and a Solver P47H-Pro atomic force microscope. The structural phase composition was detected by electrolytic polishing in a 80% H3PO4 + 13% CrO3 + 7% H2O solution. The same method was used to remove surface layers. The amount of martensite phase in the specimens was determined by measuring the material magnetization using an MVP-2M multifunctional eddy current tester and an X-ray diffractometer with CoKα radiation.

3. Results

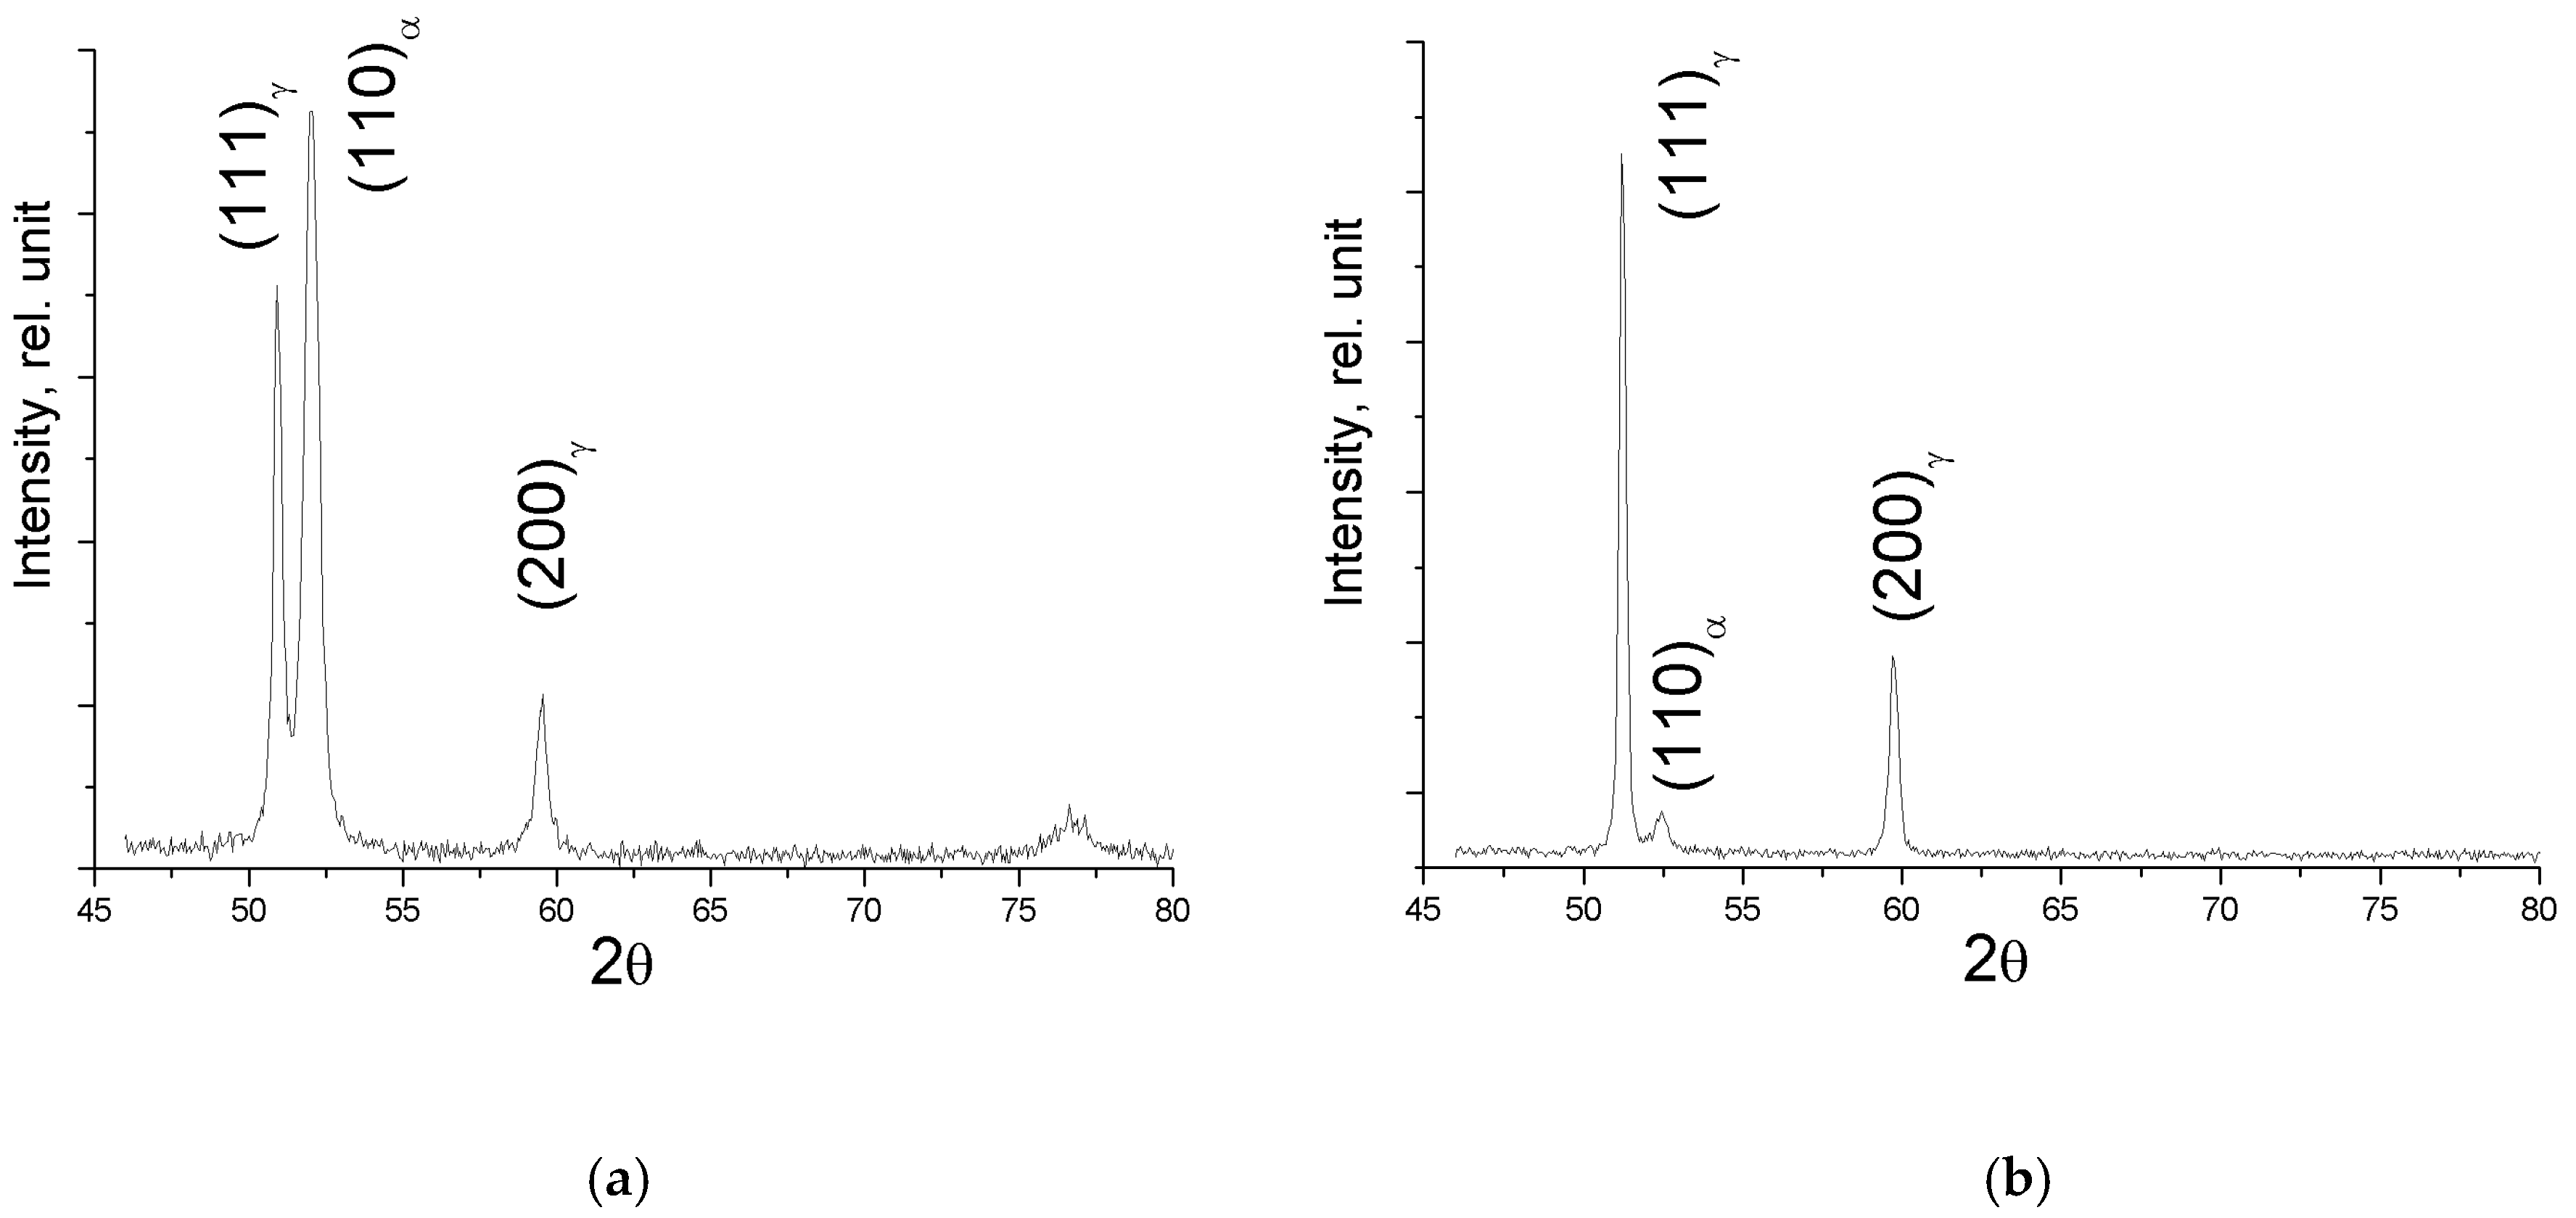
3.1. Phase and Structure Evolution in the Material Depending on the Amount of Rolling Reduction

The shape of the stress–strain curves, the length of the deformation stages, as well as the kinetics of strain-induced transformations are determined by the amount of work-hardened metastable austenite and its hardening degree in specimens in the studied states. Table 3 shows the content of the austenite (γ) phase determined by the magnetic measurement results. As expected, the maximum γ phase content is measured after austenitization. Warm rolling causes no significant martensitic transformation. After annealing the material at 875 K, the austenite content corresponds to that in the as-received state.
The data obtained reflect the phase composition in the bulk of the material. The amount of the martensite phase on the surface can be much larger [39,40]. Figure 1a shows an X-ray diffraction pattern of a specimen in state 2 according to which the α’ martensite content amounts to 73%. After removal of a 20 μm thick surface layer, it decreases to 12% (Figure 1b), which is close to the magnetic measurement results. This factor was taken into account in microstructural studies.
Before tensile testing, the gauge surface of specimens in all five states after removal of a 20 μm thick surface layer was analyzed metallographically. The analysis revealed that, despite the measures taken, all specimens had a noticeable amount of the martensite phase in their surface layer (Figure 2a–e).
The microstructure of specimens in states 1 and 2 consists of equiaxed austenite grains of size 97 and 120 μm, respectively and lath martensite (Figure 2a,b). According to optical metallography, the amount of martensite phase on the surface is about 10–20%. Subsequent plastic deformation of the specimens rolled to various reduction percentages causes a nonuniform grain size distribution and grain elongation in the rolling direction. (Figure 2c–e). Deformation of TRIP steel to 40% strain causes an increase in the number of twins in austenite grains and the formation of lath martensite regions with a lath width of about 1 μm (Figure 2c). The amount of martensite on the surface is at 21%. With strain increase to 51% and 63%, no noticeable additional austenite → martensite transformation occurs and the amount of strain-induced martensite on the surface remains at the same level of ≈20%. Thermomechanical processing results in a very fine martensite structure (Figure 2d,e). In addition, significant plastic deformation gives rise to curved shear bands near one or more austenite grains (Figure 2f). With increasing rolling reduction, the TRIP steel is significantly hardened due to work-hardened austenite grains, which is manifested in more than a two-fold increase in microhardness as compared with the initial state 2. The microhardness values and the mean grain sizes in the longitudinal section (along the rolling axis) for all states are given in Table 4.

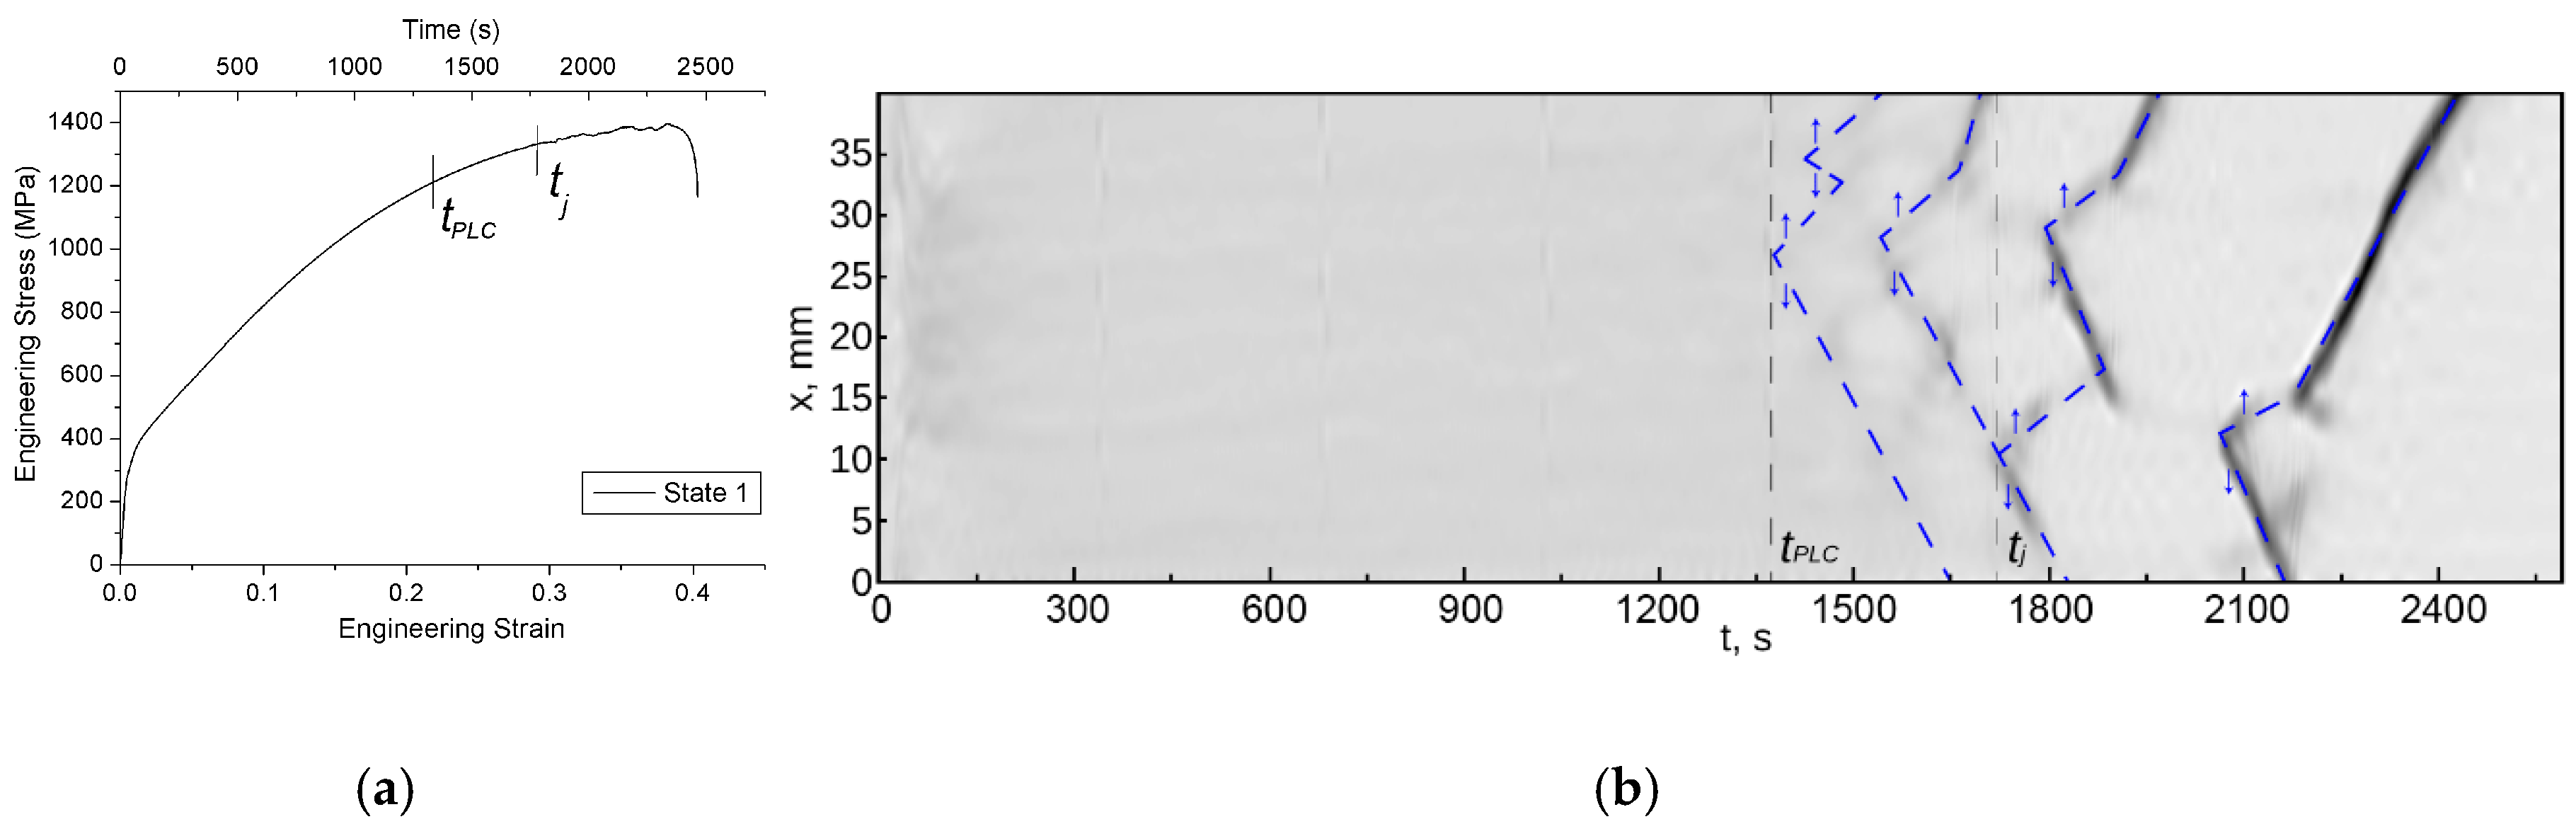
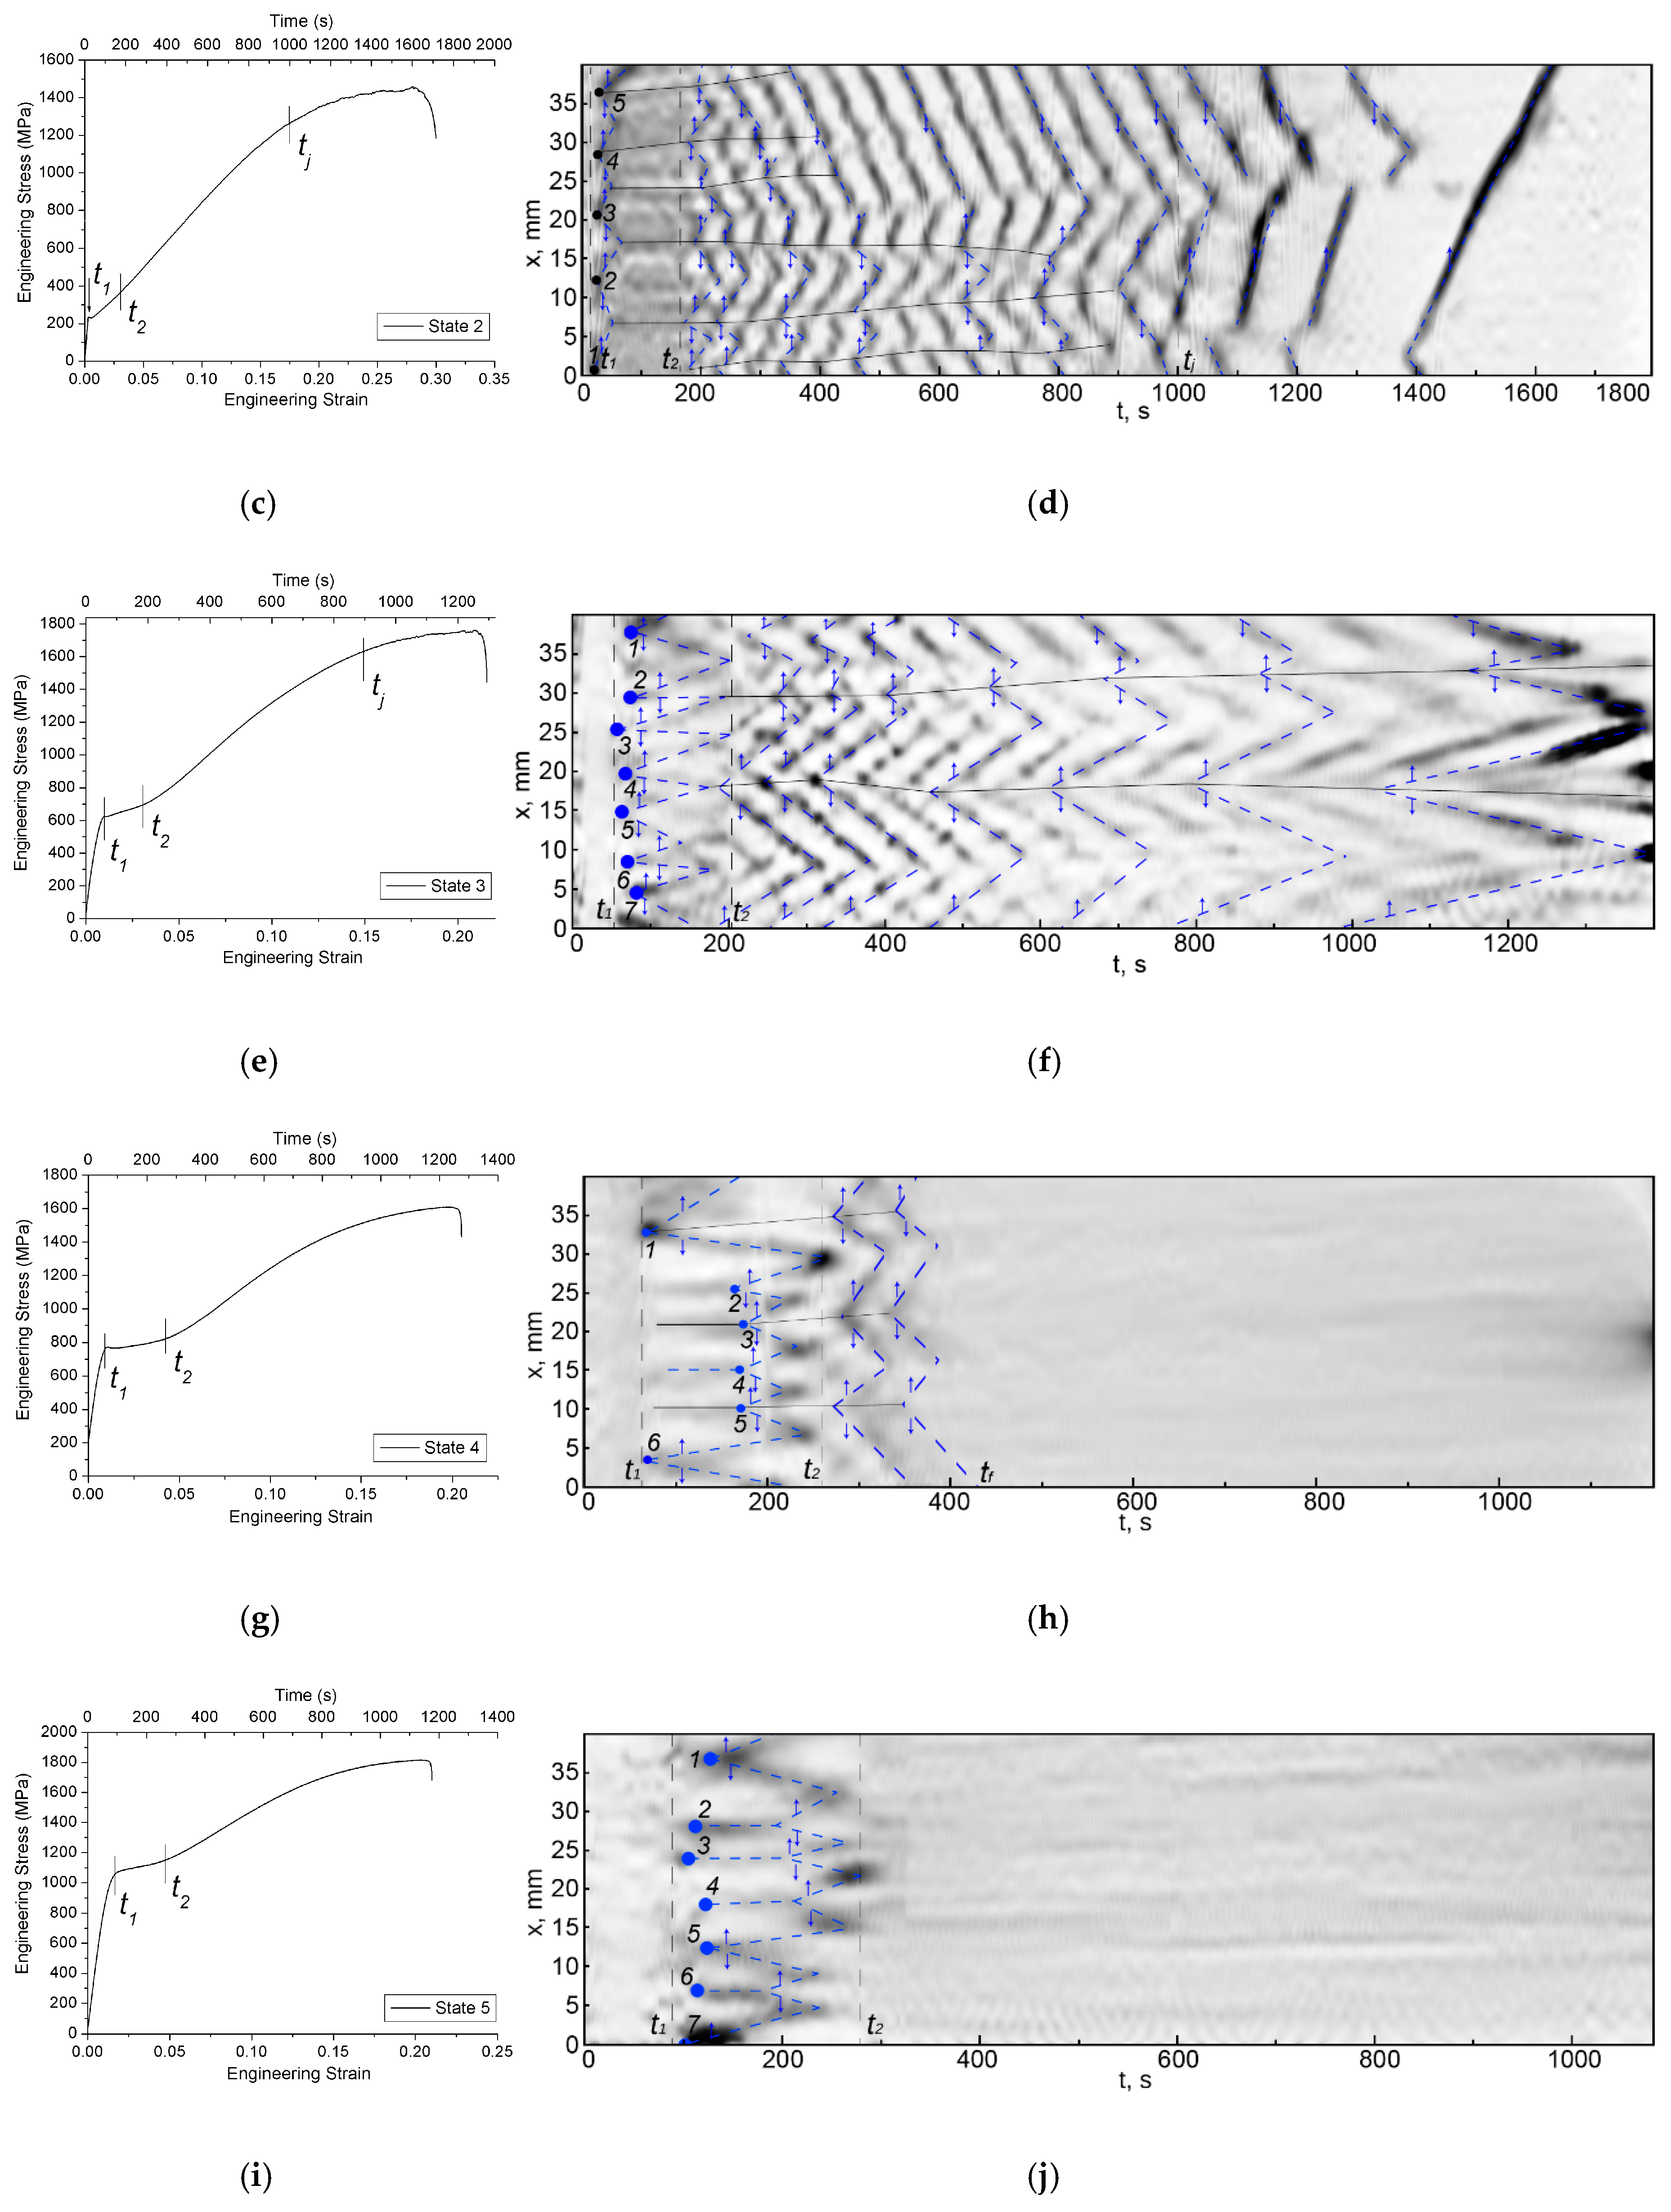
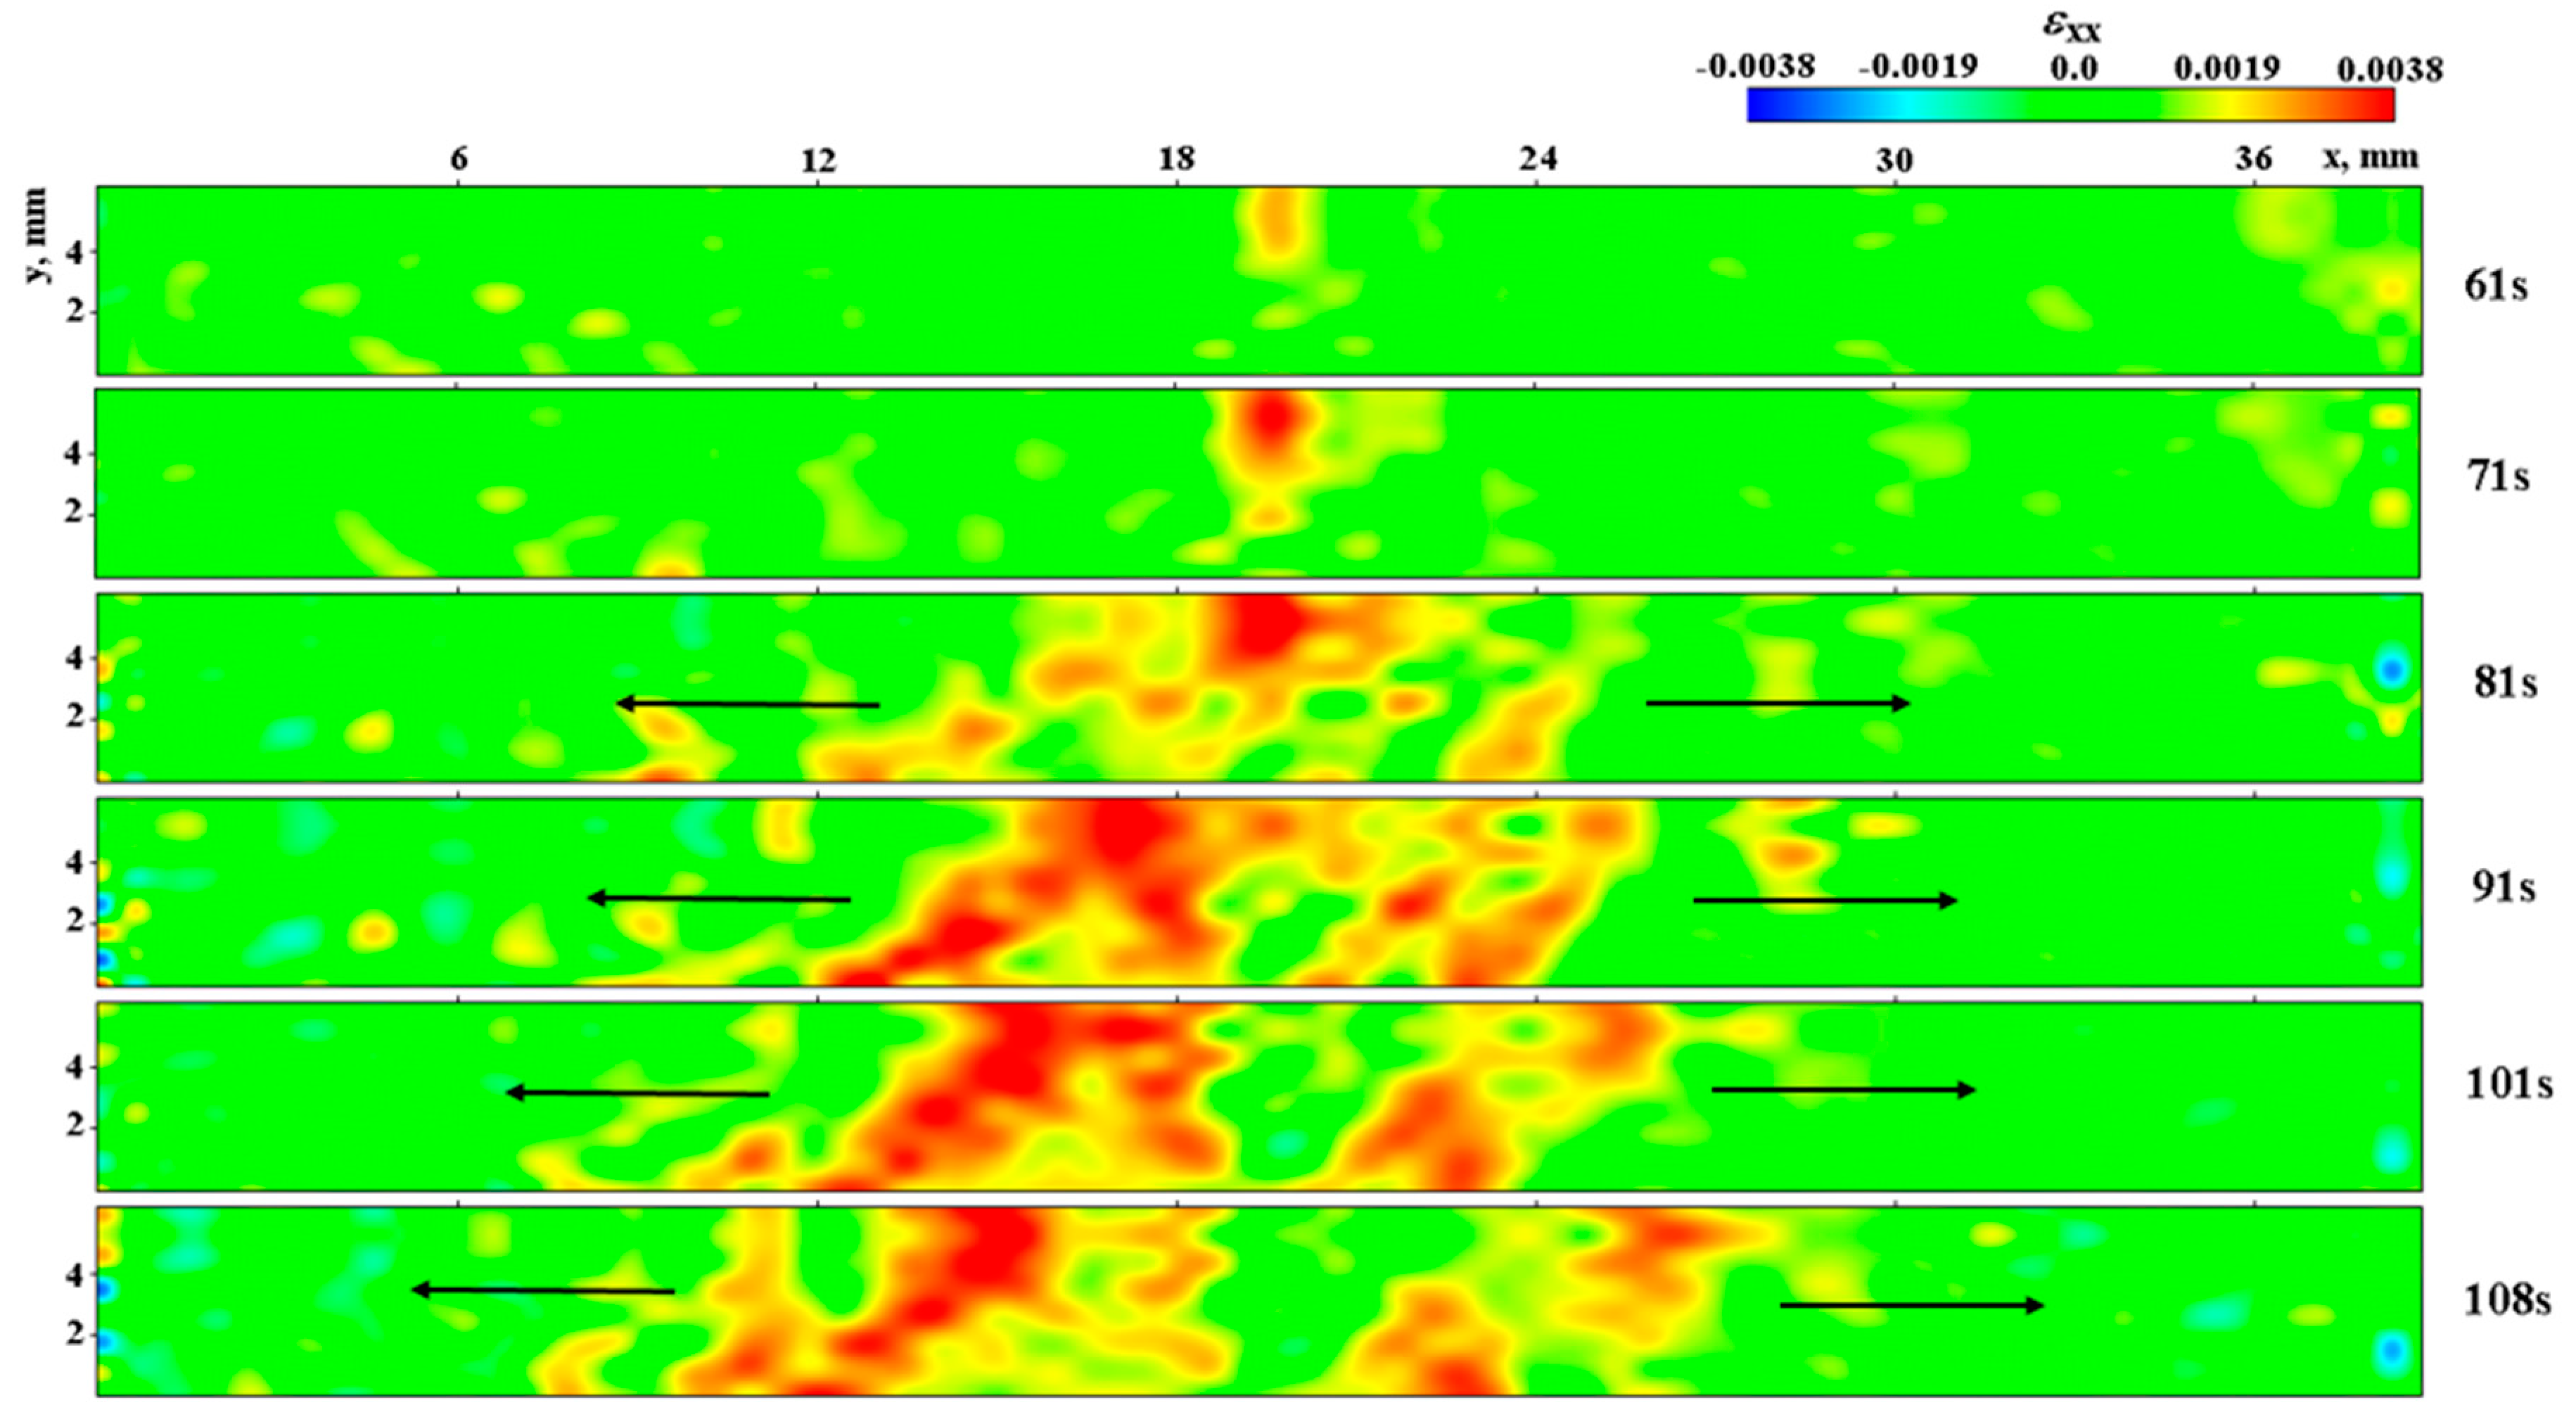
3.2. Nucleation and Propagation of Deformation Fronts in Tensile Trip Steel Specimens

The stress-strain curves of the studied steel for all states are illustrated in Figure 3. Table 5 presents the average mechanical properties of the steel and the length of the loading curve stages.
In state 1, the material exhibits a low yield strength and a parabolic stress–strain curve without a yield plateau (Figure 3a). The attainment of stresses ≈1300 MPa corresponds to the beginning of jerky flow (tj = 1725 s) which continues until fracture. An analysis of the localization patterns showed that deformation at the beginning of the loading curve is macroscopically homogeneous over the entire gauge section of the specimen. Starting from the time point tPLC = 1335 s (ε = 0.23), mobile fronts of localized deformation are generated which repeatedly pass through the specimen gauge section for the remaining time until fracture (Figure 3b). After tj = 1725 s (ε = 0.29), the generation and propagation of these fronts is in good agreement with the appearance of serrations in the stress–strain curve. The larger the number of propagating fronts at a given time point, the more slowly they move, ceteris paribus. Therefore, the process kinetics is better reflected by the sum of the absolute velocity values of simultaneously propagating fronts. The sum decreases monotonically closer to the point of fracture. At the time t = 1407 s, this generalized velocity is equal to 0.38 mm/s and before fracture at t = 1929 s it is equal to 0.08 mm/s. The behavior of the given fronts completely coincides with the behavior of the Portevin–Le Chatelier (PLC) bands in duralumin, where jerky flow also occurs together with parabolic hardening and continues until fracture [37].
The loading curve of specimens in state 2 exhibits a low yield point (t1 = 18 s, ε = 0.003) followed by a portion with a monotonically increasing work hardening coefficient 0.003 ≤ ε ≤ 0.03 (Figure 3c). This portion can be considered as a pseudo-plateau [11]. By the time t2 = 160 s, it is replaced by the parabolic stage with superimposed jerky flow tj = 1000 s. The yield point corresponds to the nucleation (t1 = 18 s) of a localized deformation band, namely, Lüders band (LB) whose lower front immediately leaves the measurement area (Figure 3d, band 1). Further plastic deformation in the pseudo-plateau region occurs through the nucleation and propagation of four more bands, which arise almost simultaneously (from 20 to 28 s) on the specimen gauge section (Figure 3d). Note that a similar situation is observed during the formation of multiple LBs in materials with a microscopic dislocation deformation mechanism [41]. The meeting fronts of adjacent bands annihilate. By the time t = 55 s, stationary zones of localized deformation are formed in the sites of nucleation and annihilation of the fronts. Thus, the specimen gauge section is divided into separate regions bounded by the aforementioned stationary zones (indicated by solid horizontal lines in Figure 3d).
After the end of the pseudo-plateau at the time t2 = 160 s, other deformation bands begin to form at the boundaries of the above mentioned regions. Their fronts move and annihilate only within the bounded areas of the specimen gauge section (Figure 3d). This process is repeated many times. In this case, a situation is possible when the initial boundaries lose their function and several separate regions merge (t ≈ 400 s, Figure 3d). It is important to note that, as in state 1, although there are no well-defined serrations in the loading curve, the behavior of deformation fronts is similar to the propagation of PLC bands. Serrations appear on the diagram when stresses reach ≈1200 MPa (tj = 1000 s in Figure 3c). Starting from this time, the separate regions lose their independence and the localized deformation fronts pass several times through the entire gauge section of the specimen. Their velocities gradually decrease from 0.28 to 0.14 mm/s.
The strength characteristics of specimens in state 3 increased significantly but plasticity decreased (see Table 5). The pseudo-plateau on the stress-strain curve is observed within the total strain interval 0.009 ≤ ε ≤ 0.029 (t1 = 55 s, t2 = 205 s) (Figure 3f). The strain localization pattern is similar to that described above for the specimen in state 2. The only difference is that the number of localized deformation bands in the pseudo-plateau region increased to seven (Figure 3f). Band fronts 1-2, 2-3, 3-4, 4-5, 5-6 and 6-7 annihilate in pairs. However, unlike state 2, further development of localized deformation is affected only by the annihilation sites of fronts 2-3 and 4-5 as well as by the nucleation site of band 1 and the gauge section boundary at the moving grip. They become the sources of PLC bands that nucleate and propagate with the beginning of the parabolic hardening stage t2 = 205 s until fracture. At the jerky flow stage, the propagation of the PLC band fronts corresponds to serrations. The velocity of the PLC fronts also decreases with work hardening (Figure 3f).
In state 4, the specimens demonstrate stress-strain curves with a well-defined yield point and pseudo-plateau (Figure 3g). The jerky flow stage is absent. The pseudo-plateau corresponds to the nucleation of six LBs (Figure 3h). The fronts of bands 1 and 6 start to propagate immediately after nucleation at the time t1 = 66 s (corresponds to the yield point in the diagram). The nucleation sites of bands 2–5 first exhibit stationary localization zones, whose boundaries start to move only after ≈87 s. The phase transformation fronts pass through the specimen gauge section only once. After the end of the pseudo-plateau at t2 = 260 s (ε = 0.043), we observed the propagation of the fronts associated with the nucleation of PLC bands moving within the separate regions. The boundaries of these regions are the nucleation sites of bands 1, 3 and 5 (Figure 3h). When the total strain reaches ≈ 0.08, that is, by the time tf = 430 s from the beginning of deformation, the propagation of PLC bands stops. Further deformation is macroscopically homogeneous, up to the onset of necking at 1050 s (Figure 3h).
At a reduction of 63% (state 5), the material exhibits the highest strength properties (see Table 5 and Figure 3i). Seven LBs nucleate almost simultaneously in the pseudo-plateau region (Figure 3j). Bands 1, 3 and 7 begin to broaden immediately after nucleation. Band 7 is the first to nucleate with the largest strain amplitude (t1 = 93 s) and one of its fronts immediately leaves the measurement area. Bands 2, 3, 4 and 6 remain stationary for 80, 99, 90 and 70 s, respectively. By the end of the pseudo-plateau (t2 = 280 s), the deformation band fronts pass through the entire gauge section of the specimen and annihilate in pairs. Localized deformation stops at this point; jerky flow and PLC bands are absent.

4. Discussion

4.1. The Nature of Localized Deformation Fronts in TRIP Steel

It is argued in the literature [4,10,11,12] that the martensitic-type strain-induced phase transformation of metastable austenite in a medium manganese TRIP steel is manifested through the formation of LBs on the yield plateau and through uneven plastic deformation.
After annealing at 875 K (state 1), the internal stresses are minimal and austenite is not work-hardened, as a result of which there is no localized plastic deformation occurring by the dislocation or twinning mechanism, as in stable austenitic steels [42]. Only when the applied stresses reach ≈ 1300 MPa (Figure 3a,b), the strain-induced γ → α′ phase transformation becomes possible. Subsequently, it occurs through the periodic propagation of PLC (the Portevin–Le Chatelier effect) bands and is completed by the time of fracture.
In state 2, after quenching from 1400 K, the steel specimen has an austenitic structure in its bulk (see Table 3). The surface of the specimen exhibits a work-hardened layer with a large amount of the martensite phase. This is confirmed by X-ray (Figure 1) and metallography data (Figure 2b). That is why the martensitic transformation begins immediately after the yield point has been reached. Figure 4 shows the formation and broadening of one of the transformation bands at a loading rate of 0.1 mm/min. When the yield point is reached at t1 = 61 s, the band nucleates on the lateral surface of the gauge section at a distance x0 = 20 mm from the fixed grip. After 10 s, it propagates through the entire thickness and its boundaries start to move. At the time t6 = 108 s, the test was stopped and the specimen was unloaded. It can be seen that the transformation took place in the region from x1 = 11 mm to x2 = 26 mm, which is confirmed by the martensite phase distribution obtained from magnetic measurements (Figure 5). The maximum martensite content of 8% corresponds to the band nucleation coordinate x0 = 20 mm. A gradual decrease in the martensite content closer to the specimen edges is consistent with the partial passage of the band fronts. Thus, the strain-induced transformation in the pseudo-plateau region occurs through the formation of bands similar to LBs in low carbon steels [41,42].
The fact that the phase transformation in state 2 is not completed in the pseudo-plateau region is confirmed by the results of microstructural studies (Figure 6). A comparison of Figure 6a,b shows that additional martensite laths appeared in austenite grains. For example, they filled a previously free austenite grain highlighted in Figure 6a. The resulting martensite has a fine structure. According to the atomic force microscopy image, the width of martensite laths varies from 800 to 1000 nm and the average height is 150 nm (Figure 6c,d).
The remaining austenite is transformed with increasing deformation stresses in the form of periodically propagating PLC bands and is completed by the time of fracture.
Warm rolling to 40% reduction led to a partial transformation of metastable austenite to martensite (see Table 3) as well as to a substantial hardening of the γ phase, due to which the yield strength increased by a factor of three. Therefore, the martensitic transformation in work-hardened austenite in state 3 in the pseudo-plateau region occurs to a greater extent than in the previous case. In other respects, the deformation kinetics in states 2 and 3 is similar: LB propagation in the pseudo-plateau region and PLC band propagation at the jerky flow stage. The transformation occurs throughout the stress-strain curve until fracture but the strain amplitudes associated with the PLC band fronts decrease closer to the point of fracture. In state 2, the situation was reverse (cf. Figure 3d,f). The main difference between states 3 and 2 is that the PLC bands in state 3 propagated only in the gaps between the above mentioned separate regions of the specimen (Figure 3f).
Rolling to 51% and 63% reduction (states 4 and 5) leads to even greater work hardening of austenite and therefore the degree of strain-induced transformation in the pseudo-plateau region is even greater than in state 3. In state 4, after the pseudo-plateau, there remains a small amount of metastable austenite that transforms to martensite as a result of the passage of PLC bands. The transformation is fully completed by the time tf. In state 5, the strain-induced transformation is fully completed at the pseudo-plateau. According to X-ray diffraction analysis, the ruptured specimens contain no austenite phase. It is important that the jerky flow stage is not pronounced in the stress-strain curves of specimens in both states. The deformation is mostly macroscopically homogeneous and occurs by the twinning and dislocation mechanisms.

4.2. The Autowave Nature of the Phase Transformation Fronts

Research results on the kinetics of the fronts of strain-induced phase transformation in TRIP steel indicate that their behavior is similar to the propagation of the Lüders and Portevin–Le Chatelier band fronts, which means that they can be described in terms of the autowave plasticity model [34,35,36,37].
Autowave concepts are applicable to active media, that is, to objects containing distributed sources of potential energy which arise, relax and cause changes in the object under applied loads, that is, the sources are active elements of the medium [43]. Bi-stable media whose elements exist in two states—metastable and stable—are the systems where switching autowaves are generated [43]. As applied to strain-induced phase transformations, these are an elastically strained metastable phase and a relaxed stable one. In our case, the switching autowave is the boundary between the deformable body regions where the material is elastically stressed and in the austenitic state and the region where the material relaxes and transforms to the martensitic state.
These boundaries are the fronts of the transformation bands which pass through the entire gauge section of the specimen and annihilate upon meeting. Such a behavior is an attribute of switching autowaves. Each band at the time of nucleation has a pair of mobile fronts, that is, it is the source of two switching autowaves. The front velocities are determined not only by the material properties but also by the external loading parameters, particularly the loading rate, which is also characteristic of autowaves [43]. The structure and state of the material substantially change in the zones of nucleation and annihilation of switching autowaves, so that these zones divide the object into parts where the deformation processes proceed independently. Along with the propagation of LBs, there are PLC bands propagating in TRIP steel, which also represent the strain-induced transformation fronts. However, unlike LBs, PLC bands repeatedly pass through the specimen gauge section. Such a behavior is characteristic of excitation autowaves that arise in active media with elements having three states: quiescence, excitation and refractoriness [43]. A loaded specimen of TRIP steel, where the direct strain-induced martensitic transformation is not completed at the elastic-plastic transition, should be considered an excitable active medium. After the passage and annihilation of primary localized plasticity autowaves in it, the nucleation zones are again activated with a subsequent increase in the deformation stresses. The zones become sources of excitation localized plasticity autowaves, which nucleate and propagate many times until the strain-induced austenite → martensite phase transformation is fully completed. The sources of excitation autowaves are the zones of nucleation or annihilation of primary LBs (switching autowaves) and their velocities decrease with increasing deformation stresses.

5. Conclusions

The findings of this study into the structure and behavior of plastic strain macrolocalization in metastable austenitic-martensitic steel depending on its preliminary thermomechanical processing yielded the following conclusions:
  • Preliminary heat treatment and warm rolling of chromium-nickel-molybdenum TRIP steel to 40–63% reduction significantly increases the stress of the onset of strain-induced phase transformation as well as changes the loading curve stages. After austenitization and rolling, the specimens demonstrate an S-shaped loading curve with a pseudo-plateau. Annealing leads to a decrease in strength and to a parabolic loading curve with a gradually decreasing hardening coefficient.
  • The martensitic transformation in specimens with a pseudo-plateau begins with the nucleation and propagation of transformation bands similar to Lüders bands in materials with a dislocation deformation mechanism, whose moving boundaries (fronts) are switching autowaves of localized plasticity.
  • Further plastic flow after annihilation of switching autowaves can occur by martensitic transformation in the form of propagating excitation autowaves, which are mobile PLC band fronts. Regardless of the presence of visible serrations in the stress-strain curve, the PLC band fronts repeatedly pass through the loaded specimen until the strain-induced phase transformation is fully completed.
  • The interconversion of autowave modes was observed for the first time. It was found that the sources of excitation autowaves in the material are the nucleation or annihilation sites of switching autowaves. The sites divide the material into separate regions in which the strain-induced phase transformation processes proceed independently.

Author Contributions

Writing—original draft preparation, writing—review and editing, validation, formal analysis, investigation, V.I.D. and D.V.O.; Methodology, software, V.V.G.; Validation, investigation, L.V.D. and G.V.S.; Conceptualization, project administration, supervision, L.B.Z. All authors have read and agreed to the published version of the manuscript.

Funding

This work was performed within the frame of the Fundamental Research Program of the State Academies of Sciences and the Russian Foundation for Basic Research (grant No. 20-08-00305-a).

Conflicts of Interest

The authors declare no conflict of interest.

References

  1. Fahr, D. Stress- and strain-induced formation of martensite and its effects on strength and ductility of metastable austenitic stainless steels. Metall. Trans. 1971, 2, 1883–1892. [Google Scholar] [CrossRef]
  2. Mumtaz, K.; Takahashi, S.; Echigoya, J.; Kamada, Y.; Zhang, F.; Kikuchi, H.; Ara, K.; Sato, M. Magnetic measurements of martensitic transformation in austenitic stainless steel after room temperature rolling. J. Mater. Sci. 2004, 39, 85–97. [Google Scholar] [CrossRef]
  3. Auricchio, F.; Bonetti, E.; Scalet, G.; Ubertini, F. Theoretical and numerical modeling of shape memory alloys accounting for multiple phase transformations and martensite reorientation. Int. J. Plast. 2014, 59, 30–54. [Google Scholar] [CrossRef]
  4. Luo, H.W.; Dong, H.; Huang, M.X. Effect of intercritical annealing on the Lüders strains of medium Mn transformation-induced plasticity steels. Mater. Des. 2015, 83, 42–48. [Google Scholar] [CrossRef]
  5. Blondé, R.; Jimenez-Melero, E.; Zhao, L.; Wright, J.P.; Brück, E.; van der Zwaag, S.; van Dijk, N.H. High-energy X-ray diffraction study on the temperature-dependent mechanical stability of retained austenite in low-alloyed TRIP steels. Acta Mater. 2012, 60, 565–577. [Google Scholar] [CrossRef]
  6. Scheil, E. Uber die Umwandlung des Austenits in Martensit in Eisen-Nickellegierungen unter Belastung. Z. Anorg. Allg. Chem. 1932, 207, 21–40. [Google Scholar] [CrossRef]
  7. Wechsler, M.S.; Lieberman, D.; Read, T. On the theory of the formation of martensite. Trans. AIME 1953, 197, 1503–1515. [Google Scholar]
  8. Bowles, J.; Mackenzie, J. The crystallography of martensite transformations I. Acta Metall. 1954, 2, 129–137. [Google Scholar] [CrossRef]
  9. Das, A.; Tarafder, S. Experimental investigation on martensitic transformation and fracture morphologies of austenitic stainless steel. Int. J. Plast. 2009, 25, 2222–2247. [Google Scholar] [CrossRef]
  10. De Meyer, M.; Vanderschueren, D.; De Cooman, B.C. The Influence of the Substitution of Si by Al on the Properties of Cold Rolled C-Mn-Si TRIP Steels. ISIJ Int. 1999, 39, 813–822. [Google Scholar] [CrossRef]
  11. Callahan, M.; Hubert, O.; Hild, F.; Perlade, A.; Schmitt, J.-H. Coincidence of strain-induced TRIP and propagative PLC bands in Medium Mn steels. Mater. Sci. Eng. 2017, 704, 391–400. [Google Scholar] [CrossRef] [Green Version]
  12. Wang, X.G.; Liu, C.H.; He, B.B.; Jiang, C.; Huang, M.X. Microscopic strain partitioning in Lüders band of an ultrafine-grained medium Mn steel. Mater. Sci. Eng. A. 2019, 761, 138050. [Google Scholar] [CrossRef]
  13. Koppenaal, T.J.; Gold, E. The effect of prior deformation on the strength and annealing of reverted austenite. Metall. Trans. B 1972, 3, 2965–2972. [Google Scholar] [CrossRef]
  14. Wang, Y.; Tomota, Y.; Ohmura, T.; Morooka, S.; Gong, W.; Harjoc, S. Real time observation of martensite transformation for a 0.4 C low alloyed steel by neutron diffraction. Acta Mater. 2020, 184, 30–40. [Google Scholar] [CrossRef]
  15. Van Dijk, N.H.; Butt, A.M.; Zhao, L.; Sietsma, J.; Offerman, S.E.; Wright, J.P.; Van Der Zwaag, S. Thermal stability of retained austenite in TRIP steels studied by synchrotron X-ray diffraction during cooling. Acta Mater. 2005, 53, 5439–5447. [Google Scholar] [CrossRef]
  16. Allain, S.Y.P.; Geandier, G.; Hell, J.-C.; Soler, M.; Danoix, F.; Gouné, M. Effects of Q&P processing conditions on austenite carbon enrichment studied by in situ high-energy X-ray diffraction experiments. Metals 2017, 7, 232. [Google Scholar] [CrossRef] [Green Version]
  17. Tan, X.; Ponge, D.; Lu, W.; Xu, Y.; He, H.; Yan, J.; Wu, D.; Raabe, D. Joint investigation of strain partitioning and chemical partitioning in ferrite-containing TRIP-assisted steels. Acta Mater. 2020, 186, 374–388. [Google Scholar] [CrossRef]
  18. Tasan, C.; Hoefnagels, J.; Geers, M. Microstructural banding effects clarified through micrographic digital image correlation. Scr. Mater. 2010, 62, 835–838. [Google Scholar] [CrossRef]
  19. Dutta, A.; Ponge, D.; Sandlöbes, S.; Raabe, D. Strain partitioning and strain localization in medium manganese steels measured by in situ microscopic digital image correlation. Materialia 2019, 5, 100252. [Google Scholar] [CrossRef]
  20. Egorov, S.A.; Volkov, A.E. Dependence of the enthalpy of the direct martensitic transformation in titanium nickelide on the stress. Tech. Phys. 2017, 62, 230–236. [Google Scholar] [CrossRef]
  21. Kim, K.; Daly, S. The effect of texture on stress-induced martensite formation in nickel–titanium. Smart Mater. Struct. 2013, 22, 075012. [Google Scholar] [CrossRef]
  22. Panin, V.E.; Grinyaev, Y.V.; Elsukova, T.F.; Ivanchin, A.G. Structural levels of deformation in solids. Sov. Phys. J. 1982, 25, 479–497. [Google Scholar] [CrossRef]
  23. Vladimirov, V.I. Collective effects in ensembles of defects. In Problems of the Theory of Defects in Crystals; Vonsovskii, S.V., Ed.; Nauka: Leningrad, Russia, 1987; pp. 43–57. [Google Scholar]
  24. Aifantis, E.C. Pattern formation in plasticity. Int. J. Eng. Sci. 1995, 33, 2161–2178. [Google Scholar] [CrossRef]
  25. Panin, V.E. Dynamic gauge theory of waves in elastoplastic media. In Physical Mesomechanics of Heterogeneous Media and Computer-Aided Design of Materials; Panin, V.E., Ed.; Cambridge International Science Publishing Ltd.: Great Abington, Cambridge, UK, 1998; pp. 97–117. [Google Scholar]
  26. Zbib, H.M.; de la Rubia, T.D. A multiscale model of plasticity. Int. J. Plasticity 2002, 18, 1133–1163. [Google Scholar] [CrossRef]
  27. Ohashi, T.; Kawamukai, M.; Zbib, H.M. A multiscale approach for modeling scale-dependent yield stress in polycrystalline metals. Int. J. Plasticity 2007, 23, 897–914. [Google Scholar] [CrossRef]
  28. Huvier, C.; Conforto, E.; El Alami, H.; Delafosse, D.; Feaugas, X. Some correlations between slip band and dislocation patterns. IOP Conf. Ser. Mater. Sci. Eng. 2009, 3, 012012–012018. [Google Scholar] [CrossRef]
  29. Seeger, A.; Frank, W. Structure formation by dissipative processes in crystals with high defect densities. In Non-Linear Wave Processes in Excitable Media; Kubin, L.P., Martin, G., Eds.; Trans. Tech. Publ.: New York, NY, USA, 1987; pp. 125–138. [Google Scholar] [CrossRef]
  30. Nicolis, G.; Prigogine, I. Exploring Complexity; Freeman: New York, NY, USA, 1989; p. 313. [Google Scholar]
  31. Davydov, V.A.; Zykov, V.S.; Mikhailov, A.S. Kinematics of autowave structures in excitable media. Phys.-Uspekhi 1991, 34, 665–684. [Google Scholar] [CrossRef]
  32. Zaiser, M.; Aifantis, E.C. Randomness and slip avalanches in gradient plasticity. Int. J. Plasticity 2006, 22, 1432–1455. [Google Scholar] [CrossRef]
  33. Lebyodkin, M.A.; Kobelev, N.P.; Bougherira, Y.; Entemeyer, D.; Fressengeas, C.; Gornakov, V.S.; Lebedkina, T.A.; Shashkov, I.V. On similarity of plastic flow processes during smooth and jerky flow: Statistical analysis. Acta Mater. 2012, 60, 3729–3740. [Google Scholar] [CrossRef]
  34. Zuev, L.B. and Barannikova, S.A. Autowave Physics of Material Plasticity. Crystals 2019, 9, 458. [Google Scholar] [CrossRef] [Green Version]
  35. Zuev, L.B. Using a crystal as a universal generator of localized plastic flow autowaves. Bull. Russ. Acad. Sci. Phys. 2014, 78, 957–964. [Google Scholar] [CrossRef]
  36. Zuev, L.B.; Danilov, V.I.; Barannikova, S.A.; Gorbatenko, V.V. Autowave model of localized plastic flow of solids. Phys. Wave Phenom. 2009, 17, 67–75. [Google Scholar] [CrossRef]
  37. Gorbatenko, V.V.; Danilov, V.I.; Zuev, L.B. Plastic flow instability: Chernov–Lüders bands and the Portevin—Le Chatelier effect. Tech. Phys. 2017, 62, 395–400. [Google Scholar] [CrossRef]
  38. Sutton, M.A. Digital image correlation for shape and deformation measurements. In Springer Handbook of Experimental Solid Mechanics; Sharpe, W.N., Jr., Ed.; Springer: Boston, MA, USA, 2008; pp. 565–600. [Google Scholar] [CrossRef]
  39. Terent’ev, V.F.; Slizov, A.K.; Sirotinkin, V.P.; Prosvirnin, D.V.; Kobeleva, L.I.; Eliseev, E.A.; Rybal’chenko, O.V.; Ashmarin, A.A. Effect of the removal of the surface layer of a TRIP steel sheet on its phase composition after static tension at various strain rates. Russ. Metall. 2016, 1, 34–38. [Google Scholar] [CrossRef]
  40. Terent’ev, V.F.; Ashmarin, A.A.; Titov, D.D.; Blinov, V.M.; Seval’neva, T.G.; Blinova, E.N.; Slizov, A.K. Mechanical properties and structure of a VNS9-sh steel as functions of the tempering temperature. Russ. Metall. 2019, 4, 403–408. [Google Scholar] [CrossRef]
  41. Danilov, V.I.; Gorbatenko, V.V.; Zuev, L.B.; Orlova, D.V. Kinetics and morphology of Lüders deformation in specimens with homogeneous structure and with a weld joint. J. Mater. Sci. Eng. A 2018, 714, 160–166. [Google Scholar] [CrossRef]
  42. Karaman, I.; Sehitoglu, H.; Maier, H.J.; Chumlyakov, Y.I. Competing mechanisms and modeling of deformation in austenitic stainless steel single crystals with and without nitrogen. Acta Met. 2001, 49, 3919–3933. [Google Scholar] [CrossRef]
  43. Mikhailov, A.S.; Loskutov, A.Y. Foundations of Synergetics II; Springer: Berlin/Heidelberg, Germany, 1991; p. 212. [Google Scholar] [CrossRef]
Figure 1. X-ray diffraction patterns of TRIP steel in state 2: (a) on the surface after austenitization; (b) after removal of a 20 µm thick surface layer.
Metals 10 01494 g001
Figure 2. Structure of TRIP steel in different states: after annealing at T = 875 K, τ = 1 h (a); after austenitization (b); 40% reduction (c); 51% reduction (d); 63% reduction (e).
Metals 10 01494 g002
Figure 3. Loading curves of TRIP steel and the chronogram of the propagation of phase transformation fronts: (a,b) annealing at 600 °C (state 1); (c,d) after austenitization (state 2); (e,f) after austenitization and warm rolling to 40% reduction (state 3); (g,h) after austenitization and warm rolling to 51% reduction (state 4); (i,j) after austenitization and warm rolling to 63% reduction (state 5). The arrows indicate the front propagation direction, points 17 denote the nucleation sites of primary localization bands.
Metals 10 01494 g003aMetals 10 01494 g003b
Figure 4. Nucleation and propagation of localized deformation fronts in state 2. The arrows indicate the front propagation direction.
Metals 10 01494 g004
Figure 5. Martensite distribution before (1) and after (2) deformation in the pseudo-plateau region (state 2, time point t6 after specimen unloading).
Metals 10 01494 g005
Figure 6. Microstructure of TRIP steel in state 2; (a) optical image of the undeformed specimen; (b) optical image after deformation in the pseudo-plateau region; (c,d) atomic force microscopy (AFM) image of the selected area. The top of the Vickers pyramid indentation served as a reference. A—austenite, Md—strain-induced martensite.
Metals 10 01494 g006
Table 1. Chemical Composition of Transformation-Induced Plasticity (TRIP) Steel.
ElementsCCrNiMoNMnSiSP
wt. %0.2514.5–16.04.8–5.82.7–3.20.03–0.07≤1≤0.6≤0.01≤0.015
Table 2. Thermomechanical Processing Regimes.
Thermomechanical Processing RegimesState
12345
Annealing, T = 875 K, τ = 1 h, furnace cooling+
Austenitization (quenching), T = 1400 K, τ = 1 h, water cooling++++
Multi-pass warm rolling, T = 620 K+++
Reduction in rolling, %405163
Thickness, mm110.60.50.47
Table 3. Phase Composition of Steel in the Studied States.
State12345
Martensite content,%≤4≤430 ± 117 ± 0.515 ± 0.4
Austenite content,%≥96≥9670 ± 183 ± 0.585 ± 0.4
Table 4. Effect of Rolling Reduction on Microhardness and Grain Size.
StateMicrohardness Hµ, MPaMean Grain Size, μm
12370 ± 22097 ± 29
22140 ± 260120 ± 35
34580 ± 90117 ± 39
45140 ± 140141 ± 47
55450 ± 180163 ± 45
Table 5. Mechanical Characteristics of TRIP Steel Specimens and the Length of the Loading Curve Stages.
StateYield Point, MPaTensile Strength, MPaStrain at Break, %Pseudo-PlateauParabolic HardeningJERKY FLOW
1290 ± 81396 ± 240 ± 2-0.002 ≤ ε ≤ 0.420.29 ≤ ε ≤ 0.42
2280 ± 401457 ± 1033 ± 30.003 ≤ ε ≤ 0.030.03 ≤ ε ≤ 0.290.17 ≤ ε ≤ 0.29
3598 ± 321766 ± 2419 ± 10.009 ≤ ε ≤ 0.0290.029 ≤ ε ≤ 0.200.14 ≤ ε ≤ 0.20
4862 ± 601747 ± 5620 ± 20.01 ≤ ε ≤ 0.0430.043 ≤ ε ≤ 0.19-
51060 ± 611752 ± 3219 ± 10.015 ≤ ε ≤ 0.0490.049 ≤ ε ≤ 0.19-
Publisher’s Note: MDPI stays neutral with regard to jurisdictional claims in published maps and institutional affiliations.

