Abstract
Prestressing steel wires usually undergo cyclic loading in service. Therefore, it is of interest to analyse certain features of their mechanical behaviour under this type of loading, such as the Bauschinger effect (BE) or the hardening rule, that fit the real mechanical behaviour appropriately. In this study, different samples of high strength pearlitic steel wires were subjected to cyclic tension-compression load exceeding the material yield strength, thus generating plastic strains. From the experimental results, various parameters were obtained revealing that analysed steels exhibited the so-called Masing type BE. In addition, the variation of the BE characteristics (of the effective and internal stresses) with the applied plastic pre-strain indicated that the studied materials followed a mixed strain hardening rule with the domination of the kinematic component.
1. Introduction
Material responses to mechanical loads depend on the stress states that materials experience in service, and also on past plastic straining histories [1]. In this context, the relevant phenomenon was discovered in 1881 by Bauschinger [2] who observed that, in certain metals subjected to compressive loads after tensile loads exceeding the yield limit, the plastic regime started at lower stress magnitude than it was previously in tension, i.e., the plastic pre-strain by tension caused the reduction of the material yield strength in compression [3,4,5,6,7]. This is called the Bauschinger effect (BE). The reduction of strength due to plastic pre-strain is a question of major relevance in various research and application areas. This finding furthered the advancements in the theory of the mechanical behaviour of materials in the plastic regime under cyclic loading [1,3,8,9,10,11,12,13,14,15,16], as well as the technological innovations in cold plastic strain conforming processes [17,18,19,20]. On the one hand, deeper knowledge about the material mechanical response allows one to optimise the plastic strain conforming processes, avoiding excessive material damage in load reversals, and on the other, this facilitates more accurate predictions (e.g., from numerical simulations) of the performance of materials undergoing cyclic strain hardening.
For these reasons, significant efforts have been aimed at the clarification of the causes of this phenomenon. Many theories have been proposed to explain the BE following both micro and macroscopic approaches [1,21,22,23]. The physical origin of the BE is associated with the action of the long range internal stresses (e.g., from the dislocation pile-ups at grain boundaries or from the so-called Orowan loops around precipitates) or with the short range opposition to the dislocation movement appearing during the process of plastic straining in reverse loading [21].
Several studies have been devoted to the characterisation of the BE quantitatively [5,7,24,25,26,27]. Different types of tests were employed to achieve this; the most common one is the Bauschinger test [3,28]. This test consists in applying to the specimen a loading history, consisting of a cycle of tension up to a certain magnitude of the maximum load above the material yield strength, followed by compressive load, the absolute value of which attains the same level as reached in the previous phase of tensile loading, and finally, unloading. Various parameters that quantify this effect, the so-called BE indicators, can be derived from the loading curves obtained in such tests. Further, these tests enable one to identify the strain hardening model that fits the metal behaviour in the plastic regime better. The theory proposed by Kuhlmann-Willsdorf and Laird [29] allows one to establish a relation between the origins of the BE at the microstructural level and the mathematical models of the plasticity theory for analysing the strain hardening in metals in terms of two parameters: the so-called internal stress and the effective stress. On the one hand, the internal stress, which is associated with the local strain process leading to long range interactions with mobile dislocations, is linked to the isotropic hardening where the yield surface expands homothetically along with plastic strains during loading without changing its shape. On the other hand, the effective stress is linked to the kinematic hardening that moves the yield surface in the principal stress space without increasing its size.
The analysis of this effect is particularly interesting in high strength pearlitic steels widely used in civil engineering in the form of prestressing steel wires. These wires are obtained by means of a plastic strain conforming process called cold drawing. It consists in progressive stepwise reduction of the cross-sectional area of wires (supplied hot rolled bars) by forcing them to pass through a series of different drawing dies. As a consequence, the manufacturing-induced residual stress-strain state is generated that strongly affects the wire failure, in particular, due to hydrogen embrittlement phenomenon [30]. During the drawing process, the material undergoes severe plastic strains and diverse microstructural changes [31,32,33,34,35,36,37].
The aim of this study was to characterize the BE in high strength pearlitic steels under uniaxial tension-compression at room temperature. To this end, the most relevant BE indicators were evaluated from the experimental data, and the type of appropriate strain hardening model was determined. The tests were performed taking the wires from two stages of a commercial cold drawing process, namely the as-received hot rolled bars (not yet cold drawn) and the wires from an intermediate stage of the cold drawing process, after passing three consecutive diameter reductions when the manufacturing-induced microstructural changes [32] and corresponding material behaviour anisotropy [38] become detectable. Based on the original results obtained in the present work, the most adequate type of material behaviour model is suggested to describe the fatigue performance of cold-drawn pearlitic steels for prestressing wires, which are the key constituents of prestressed concrete.
2. Theoretical Background
2.1. Bauschinger Effect Indicators
Several studies [1,3,24,27] have established different methods to characterise the considered effect in terms of the Bauschinger indicators obtaining them from the data of tension-compression Bauschinger tests. Such indicators are based on stress, strain, or strain energy. The indicators in terms of stress (βσ), strain (βε), and energy per volume (βW) are as follows:
where σmax is the stress at maximum loading or pre-stress, σYC is the yield strength at the compression stage (σYC < 0), εB is the Bauschinger strain, εP* is the plastic pre-strain, WS is the Bauschinger energy factor and WP the plastic pre-strain energy density. Involved parameters are defined as shown by the scheme in Figure 1 displaying the hysteresis loop obtained from a Bauschinger test, where the compression curve is mirrored in the tensile domain (dashed line in Figure 1) to simplify the parameter definition. In this plot, the tensile yield strength is denoted as σYT. Accordingly, a material does not exhibit BE when the aforesaid parameters βσ, βε, and βW are null. The values of these parameters establish the degree of BE quantitatively.
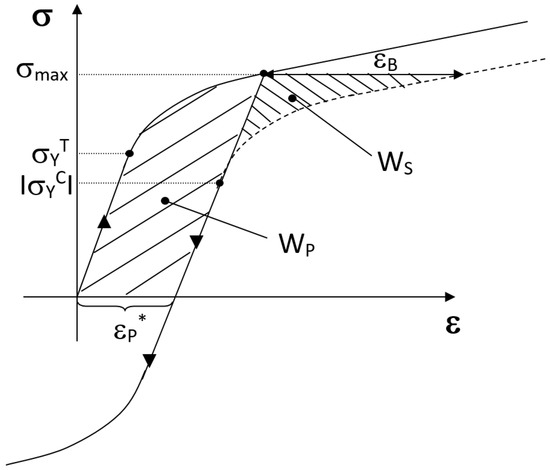
Figure 1.
Parameters used to characterize the Bauschinger effect from the tension-compression tests.
2.2. Effective and Internal Stresses
The study performed by Kuhlmann-Wilsdorf and Laird [29] allows one to establish the most appropriate hardening model to fit the real behaviour with the use of the values of the effective stress (σef) and internal stress (σint) deduced from the hysteresis loop obtained in the Bauschinger test. The mentioned parameters are defined as follows (see Figure 2):
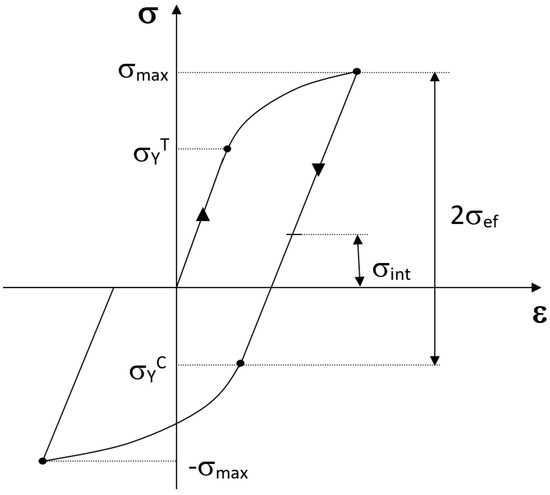
Figure 2.
Definition of the effective and internal stresses.
The stress interval between the maximum tensile stress applied during the test (σmax) and the yield strength in compression (σYC < 0) is related to the diameter of the yield surface, and the stress at the half-way between them, i.e., at the middle point of the former interval, corresponds to the position of the shifted axis of the yield surface in the space of stress components. Variations of these parameters for different plastic pre-strain values indicate whether the yield surface moves in the principal stress space (this is the kinematic hardening) or if it expands in size (this is the isotropic hardening).
Kishi and Tanabe [39] established the relation between the plastic pre-strain and the yield stress decrease caused by the BE. As well, the yield criterion accounting for the kinematic hardening, which is useful for the analysis of the strain-induced mechanical anisotropy of initially isotropic materials, was proposed. According to Kishi and Tanabe [39], the effective stress and the plastic pre-strain are related by a power-law equation as follows:
where A is the BE constant and m is the BE exponent. Accordingly, a material exhibits the BE when the factor A is not zero.
2.3. The Masing Model
After Bauschinger’s finding [2], Masing proposed a theoretical model for explaining the BE in metals [40]. Briefly, this model considers several yield stress levels (ten in the Masing’s original work) associated with respective parallel elastic-perfectly plastic elements that constitute a solid experiencing uniform strain under load [40]. To re-start yielding during reverse loading, each of these elements must deform through twice its previous strain range [40]. Different yield stress levels of the mentioned solid constituents are attributed mainly to the local variations of the dislocation density [40]. Thus, in a Masing material, the tensile branches of hysteresis loops for various plastic pre-strain ranges are the same when the loops are plotted in such a way that they share their points of maximum compression load [40]. According to the study [41], the Bauschinger strain (εB) grows linearly with the plastic pre-strain applied during the Bauschinger test of the Masing type material.
It turns [41] that when the plastic cyclic stress-strain curve of the Masing-type metal is represented by the power-law equation
where K’ is the cyclic strength coefficient, n’ is the cyclic strain-hardening exponent, then the work developed during the Bauschinger test (WP) can be obtained directly from the Equation (7) as follows:
where Δσ is twice the maximum applied stress.
3. Materials & Methods
3.1. Material
To analyse the BE in high strength steels used in civil engineering, various Bauschinger tests were carried out with the steels corresponding to two stages of the industrial seven-step cold drawing process used for obtaining commercial prestressing steel wires: the initial hot rolled bar not yet subjected to drawing to generate plastic strain (i.e., the drawing induced strain is nil there), which is labelled hereafter as the steel E0, and the steel from the intermediate drawing stage after passing through three drawing dies, which is denoted as the steel E3. The diameters of the wires E0 and E3 were, respectively, dE0 = 11.03 mm and dE3 = 8.21 mm [32]. Accordingly, the drawing induced engineering plastic strain in the steel E3 is (dE02/dE32) − 1 = 0.80, which is rather moderate in comparison with that generated by the industrial drawing process rendering the diameter of manufactured prestressing wire close to 5 mm, which corresponds to the engineering strain of 3.9 (the details of drawing chain behind the present study can be found in the cited paper [32]). Taking into account elevated levels of test load and rather not large wire diameters, undesirable buckling could appear during testing in the compression loading phase. To avoid this, the analysis was focused on the third step of the cold drawing chain after which the drawn wire diameter remains not too small. This wire has a slenderness ratio sufficient to avoid buckling, and in addition, manufacturing induced microstructural changes are rather moderate and induce not too strong anisotropy [32]. The chemical composition of the steel is 0.789% C, 0.681% Mn, 0.210% Si, 0.010% P, 0.008% S, 0.003% Al, 0.218% Cr, 0.061% V [32]. This provides the eutectoid steel wires with pearlitic microstructure (Figure 3).
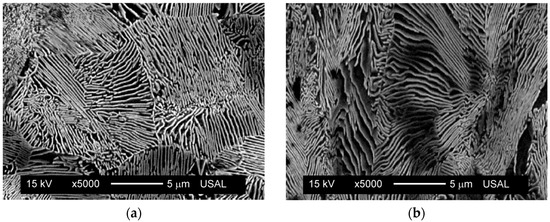
Figure 3.
Microstructure in the longitudinal sections of the analysed pearlitic steel wires at different degrees of drawing: (a) hot rolled wire E0 (not cold drawn) and (b) moderately cold drawn wire E3.
3.2. Mechanical Testing
To reveal the mechanical properties of the analysed steels, ordinary tension tests of three samples of each wire E0 and E3 were carried out with a universal testing machine MTS RF200 (MTS Systems Corporation, Eden Prairie, MN, USA) under constant displacement rate of 2 mm/min up to fracture. The specimens were 300 mm long. To keep close to the real behaviour of prestressing wires in service, the specimens were cut from the as-received wires. The stress-strain curves of the studied steels obtained from these tests are displayed in Figure 4 manifesting the strain hardening with significant increase (of about 30%) of the yield stress of the steel E3 due to cold drawing. The values of the Young modulus E and yield strength σY, which is identified with the usual 0.2% offset yield point, were obtained from the experimental data for the steels E0 and E3, respectively, as follows: E0 = 199 MPa, σY0 = 720 MPa, and E3 = 192 MPa, σY3 = 930 MPa.
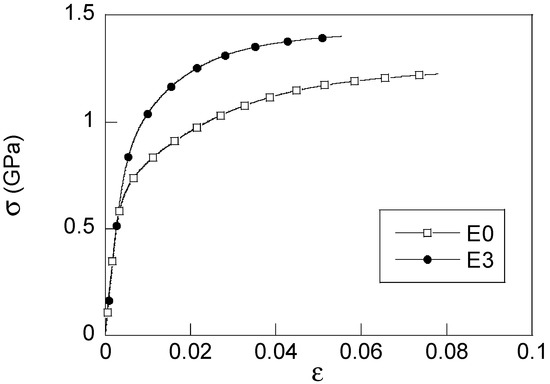
Figure 4.
Stress-strain curves of the steels E0 (open symbols) and E3 (full symbols).
Bauschinger tests were carried out with a test machine 810 MTS (MTS Systems Corporation, Eden Prairie, MN, USA), see Figure 5a,b. The specimens (see Figure 5c) were round bars machined from the wires E0 and E3. The specimen geometry is characterised by the diameter din in the central third of the bar being the gauge section, which is reduced with respect to the diameter dout of two outer thirds being the shoulders for gripping. These diameters din and dout are indicated Table 1. This reduction of din comparing to dout avoided undesirable fracture in the test machine grips. In order to avoid deformation inhomogeneity within the gauge sections in line with the known standards, the reduced parts of the specimens provided the gauge section lengths that always more than quadrupled the gauge section diameters. The wire strains were measured using the MTS extensometers. Available extensometers used in the tests had the base lengths of 20 mm and 10 mm. Though, this data is irrelevant as far as the specimen cross-section areas remained uniform with no detectable necking, i.e., the distributions of strain were uniform along the gauge lengths in these experiments. The extensometers were placed on the specimens in this central third during testing. The specimen surfaces were polished before testing.
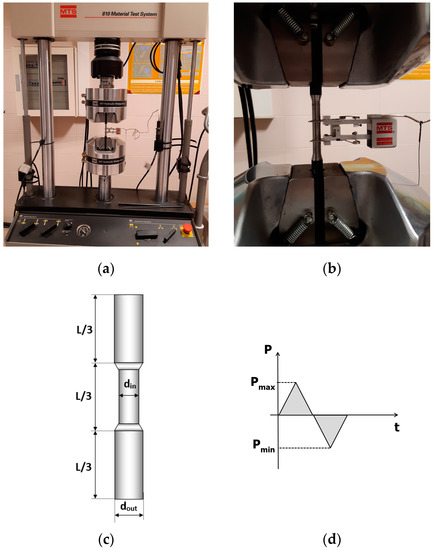
Figure 5.
Experimental set up: (a) test machine used for Bauschinger test, (b) detail of the test specimen with the extensometer, (c) scheme of the specimen geometry and (d) scheme of the applied load route.

Table 1.
Specimen dimensions in the Bauschinger tests for the steels E0 and E3.
The tests were carried out under displacement control imposing limits on maximum load. Cyclic loading between the extremes of the same absolute value in tension and compression was applied at constant displacement rate of 2 mm/min (Figure 5d). The upper and lower load limits in each test were determined from the steel flow curves obtained from tensile tests (Figure 4) in correspondence with plastic strain levels applied during cyclic loading of the hot rolled steel and of the cold drawn one as indicated in Table 2.
Table 2.
Plastic pre-strain and maximum applied stress in Bauschinger tests for the steels E0 and E3.
4. Experimental Results
Figure 6 shows the hysteresis loops for the steel E0 that were obtained in the Bauschinger tests performed at seven pre-strain levels specified in Table 2. For comparison, the flow curve obtained from the tension test of the same steel [32] is presented there, too. Similarly, Figure 7 displays analogous data for the steel E3. Each load case is identified in Figure 6 and Figure 7 with a number after the steel label E0 or E3. For instance, E0_i represents the curve of the steel E0 in the test number i specified in Table 2, where the larger curve numbers i correspond to larger plastic pre-strains.
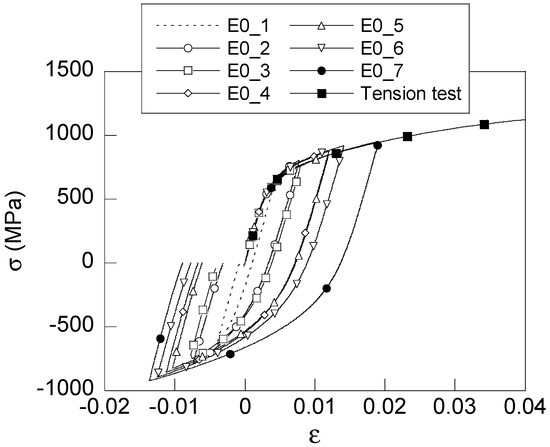
Figure 6.
Comparison of the stress-strain hysteresis loops obtained in Bauschinger tests with the flow curve of a tension test for the steel E0.
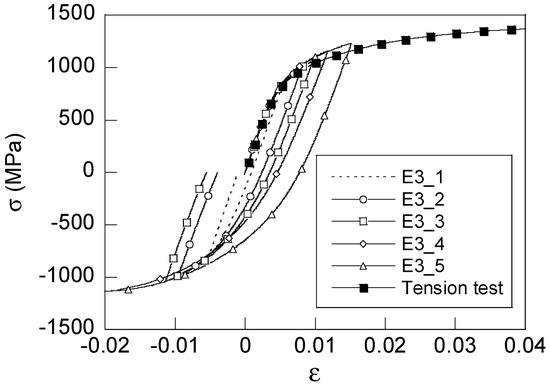
Figure 7.
Comparison of the stress-strain hysteresis loops obtained in Bauschinger tests with the flow curve of a tension test for the steel E3.
5. Discussion
The Bauschinger tests performed at different pre-strain levels allow one to characterise the BE in a material basing on the evolution of the mentioned effect indicators (1) to (3) with the applied plastic pre-strain. The present analysis is focused on the evolution of the stress-based indicator βσ in agreement with the performed test conditions.
Figure 8 shows the evolution of the Bauschinger effect stress indicator βσ with the plastic pre-strain applied in testing of the steels E0 and E3. The yield stress in compression σYC, which is necessary to determine βσ according to Equation (1), was identified as the stress at which 0.2% plastic deformation was newly generated in the compression phase of the test. To this end, the compression-stage curve was plotted (mirrored) in the tension field (see the dashed line in Figure 1), and then the yield stress σYC was determined using customary procedure for the evaluation of the conventional 0.2% offset yield point. The variation of βσ shows that analysed steels exhibit the BE as far as the value of this parameter is not null for all the performed tests. This parameter increases with the plastic pre-strain showing steep variation at low plastic pre-strain values and apparent approaching of an asymptotic level at larger plastic pre-strains. The main difference between the steels E0 and E3 is due to the cold drawing induced plastic strain that caused microstructure alterations. The microstructure of the steel E3 differs from E0 (Figure 3) and induces some anisotropy in the drawing direction. Further, cold drawing is known to increase the dislocation density, the number of dislocation-dislocation interactions, and the back stress value during forward loading, thus causing the reverse yield stress decrease. These differences between steels affect their conventional mechanical behaviour evaluated by means of ordinary tension tests under monotonic loading (Figure 4). In the matter of cyclic loading, such microstructural changes also affect the Bauschinger stress indicators of both steels (see Figure 8).
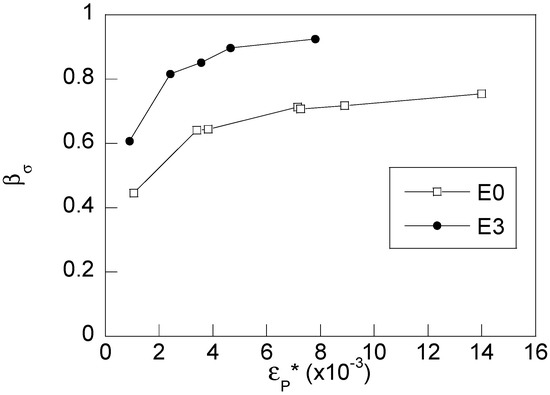
Figure 8.
Evolution of the Bauschinger effect stress indicator with plastic pre-strain for the steels E0 (open symbols) and E3 (full symbols).
Figure 9 shows the evolutions of the internal and effective stresses σint and σef with plastic pre-strain levels in both steels. In relative terms, the variations of the internal stress σint with the plastic pre-strain are much more pronounced than those of the effective stress σef in both steels. According to the previously mentioned theoretical model, this implies that the mechanical behaviour of the steels in the plastic regime should obey the kinematic strain hardening rule as far as the characteristic associated with the isotropic hardening does not vary substantially in the explored plastic strain range. According to the Kishi and Tanabe theory [39], the rising trend manifested by the internal stress in Figure 9 indicates that both steels exhibit appreciable BE.
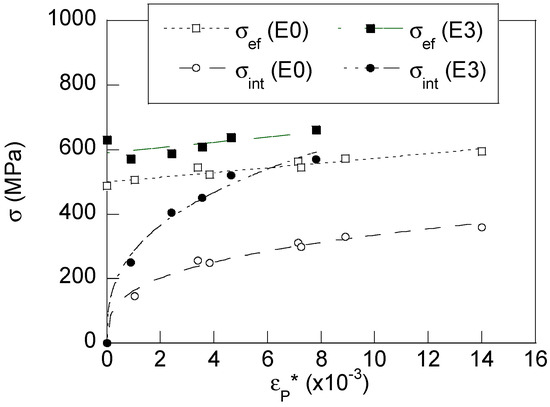
Figure 9.
Evolution of the internal and effective stresses with plastic pre-strain for the steels E0 (open symbols) and E3 (full symbols).
Figure 10 shows the evolution of the Bauschinger strain (εB) with the plastic pre-strain. The linear variation between these variables (the regression coefficient of the linear fitting is R = 0.989 for the steel E0 and R = 0.974 for the steel E3) indicates according to the study [41] that the steel behaviours agree with the Masing type equation.
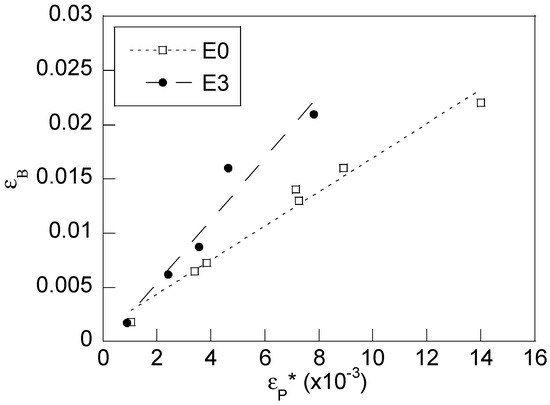
Figure 10.
Evolution of the Bauschinger strain with the plastic pre-strain for the steels E0 (open symbols) and E3 (full symbols).
The present study has important implications for the modelling of material constitutive behaviour under cyclic loading [42,43]. In this particular case of high-strength cold-drawn pearlitic steels, which provide prestressing steel wires being the basic constituent of prestressed concrete structures, substantial research efforts have been made for the computational modelling of the performance of these steels for the purposes of the assessments of structural fatigue [44,45,46,47,48,49]. The results of these simulations manifested substantial sensitivity to the implemented hypothetical strain hardening rules, so that there remained a deal of uncertainty about the fatigue predictions due to indeterminacy of the appropriate hardening rule (isotropic, kinematic, or their combination) to be used in simulations for a particular steel. The present results open the way to perform the fatigue simulations employing the suitable hardening model.
6. Conclusions
The main achievements of this study can be summarized as follows:
- The results show that the studied high-strength pearlitic steels exhibit a notable Bauschinger effect (BE). This is reflected by the variations of the considered effect parameters dependent on the applied plastic pre-strain, which were revealed by the performed tests. In addition, it follows that the material behaviour can be described as that of the Masing type.
- The variation of the internal and effective stresses with the plastic pre-strain demonstrates that the considered steels manifest mainly the kinematic-type strain hardening behaviour, whereas the isotropic strain hardening component is much less significant.
- The results of the present paper are relevant for the computational modelling of fatigue in cold drawn pearlitic steel, allowing one to implement the appropriate rule of hardening and its parameters in the simulations of fatigue.
Author Contributions
J.T., V.K. and M.L. conceived and designed the research; F.-J.A., B.G., J.-C.M. and L.A. performed the tests. All authors have read and agreed to the published version of the manuscript.
Funding
This research was funded by the following Spanish Institutions: Ministry for Science and Technology (MICYT; Grant MAT2002-01831), Ministry for Education and Science (MEC; Grant BIA2005-08965), Ministry for Science and Innovation (MICINN; Grant BIA2008-06810), Ministry for Economy and Competitiveness (MINECO; Grant BIA2011-27870), Junta de Castilla y León (JCyL; Grants SA067A05, SA111A07, SA039A08 and SA132G18).
Acknowledgments
The authors wish to express their gratitude to Juan José Morillo for machining of the specimens used in the experiments.
Conflicts of Interest
The authors declare no conflict of interest.
References
- Sowerby, R.; Uko, D.K.; Tomita, Y. A review of certain aspects of the Bauschinger effect in metals. Mater. Sci. Eng. 1979, 41, 43–58. [Google Scholar] [CrossRef]
- Bauschinger, J. Über die Veränderung der Elastizitätsgrenze und des Elastizitätsmoduls verschiedener Metalle. In Civilingenieur XXVII; Felix: Leipzig, Germany, 1881; pp. 289–348. [Google Scholar]
- Choteau, M.; Quaegebeur, P.; Degallaix, S. Modelling of Bauschinger effect by various constitutive relations derived from thermodynamical formulation. Mech. Mater. 2005, 37, 1143–1152. [Google Scholar] [CrossRef]
- Lee, J.; Kim, D.; Quagliato, L.; Kang, S.; Kim, N. Change of the yield stress in roll formed ERW pipes considering the Bauschinger effect. J. Mater. Process. Technol. 2017, 244, 304–313. [Google Scholar] [CrossRef]
- Loffredo, M. Measurement and modelling of Bauschinger effect for low-level plastic strains on AISI 4140 steel. Procedia Struct. Integr. 2018, 8, 265–275. [Google Scholar] [CrossRef]
- Paul, J.D.H.; Hoppe, R.; Appel, F. On the Bauschinger effect in TiAl alloys. Acta Mater. 2016, 104, 101–108. [Google Scholar] [CrossRef]
- Zang, S.I.; Sun, L.; Niu, C. Measurements of Bauschinger effect and transient behavior of a quenched and partitioned advanced high strength steel. Mater. Sci. Eng. A 2013, 586, 31–37. [Google Scholar] [CrossRef]
- Buciumeanu, M.; Palaghian, L.; Miranda, A.S.; Silva, F.S. Fatigue life predictions including the Bauschinger effect. Int. J. Fatigue 2011, 33, 145–152. [Google Scholar] [CrossRef]
- Gan, W.; Bong, H.J.; Lim, H.; Boger, R.K.; Barlat, F.; Wagoner, R.H. Mechanism of the Bauschinger effect in Al-Ge-Si alloys. Mater. Sci. Eng. A 2017, 684, 353–372. [Google Scholar] [CrossRef]
- Han, S.Y.; Sohn, S.S.; Shin, S.Y.; Bae, J.H.; Kim, H.S.; Lee, S. Effects of microstructure and yield ratio on strain hardening and Bauschinger effect in two API X80 linepipe steels. Mater. Sci. Eng. A 2012, 551, 192–199. [Google Scholar] [CrossRef]
- Hu, J.N.; Cocks, A.C.F. Effect of creep on the Bauschinger effect in a polycrystalline austenitic stainless steel. Scr. Mater. 2017, 128, 100–104. [Google Scholar] [CrossRef]
- Kafka, V.; Vokoun, D. Causality in the Bauschinger effect generation and in other deformation processes in metals. Eur. J. Mech. A Solids 2013, 42, 395–401. [Google Scholar] [CrossRef]
- Lee, E.-H.; Choi, H.; Stoughton, T.B.; Yoon, J.W. Combined anisotropic and distortion hardening to describe directional response with Bauschinger effect. Int. J. Plast. 2019, 122, 73–88. [Google Scholar] [CrossRef]
- Mamun, A.A.; Moat, R.J.; Kelleher, J.; Bouchard, P.J. Origin of the Bauschinger effect in a polycrystalline material. Mater. Sci. Eng. A 2017, 707, 576–584. [Google Scholar] [CrossRef]
- Ruiz-Andres, M.; Conde, A.; De Damborenea, J.; Garcia, I. Influence of sliding direction changes, contact frequency and Bauschinger effect on the wear of dual phase steels. Tribol. Int. 2015, 92, 485–492. [Google Scholar] [CrossRef]
- Weiss, M.; Kupke, A.; Manach, P.Y.; Galdos, L.; Hodgson, P.D. On the Bauschinger effect in dual phase steel at high levels of strain. Mater. Sci. Eng. A 2015, 643, 127–136. [Google Scholar] [CrossRef]
- Bouzid, A.-H.; Mourad, A.-H.I.; El Domiaty, A. Influence of Bauschinger effect on the residual contact pressure of hydraulically expanded tube-to-tubesheet joints. Int. J. Press. Vessel. Pip. 2016, 146, 1–10. [Google Scholar] [CrossRef]
- Kumar, S.; Krishnaswamy, H.; Digavalli, R.K.; Paul, S.K. Accounting Bauschinger effect in the numerical simulation of constrained groove pressing process. J. Manuf. Process. 2019, 38, 49–62. [Google Scholar] [CrossRef]
- Narita, S.; Hayakawa, K.; Uemori, T.; Kubota, Y. Evaluation of strength of stainless steel bolt without heat treatment considering Bauschinger effect during manufacturing process. J. Mater. Process. Technol. 2019, 278, 116481. [Google Scholar] [CrossRef]
- Sumikawa, S.; Ishiwatari, A.; Hiramoto, J.; Urabe, T. Improvement of springback prediction accuracy using material model considering elastoplastic anisotropy and Bauschinger effect. J. Mater. Process. Technol. 2016, 230, 1–7. [Google Scholar] [CrossRef]
- Brown, L.M. Orowan’s explanation of the Bauschinger effect. Scr. Metall. 1977, 11, 127–131. [Google Scholar] [CrossRef]
- Margolin, H.; Hazaveh, F.; Yaguchi, H. The grain boundary contribution to the Bauschinger effect. Scr. Metall. 1978, 12, 1141–1145. [Google Scholar] [CrossRef]
- Ono, N.; Tsuchikawa, T.; Nishimura, S.; Karashima, S. Intergranular constraint and the Bauschinger effect. Mater. Sci. Eng. 1983, 59, 223–233. [Google Scholar] [CrossRef]
- Aran, A.; Demirkol, M.; Karabulut, A. Bauschinger effect in precipitation-strengthened aluminium alloy 2024. Mater. Sci. Eng. 1987, 89, L35–L39. [Google Scholar] [CrossRef]
- Bate, P.S.; Wilson, D.V. Analysis of the Bauschinger effect. Acta Metall. 1986, 34, 1097–1105. [Google Scholar] [CrossRef]
- Kato, H.; Sasaki, K.; Mori, T. Four-point bending test of the Bauschinger effect in prestrained IF steel thin sheet. Mater. Sci. Eng. A 2015, 642, 150–156. [Google Scholar] [CrossRef]
- Pedersen, O.B.; Brown, L.M.; Stobbs, W.M. The Bauschinger effect in copper. Acta Metall. 1981, 29, 1843–1850. [Google Scholar] [CrossRef]
- Abel, A.; Muir, H. The Bauschinger effect and stacking fault energy. Philos. Mag. J. Theor. Exp. Appl. Phys. 1973, 27, 585–594. [Google Scholar] [CrossRef]
- Kuhlmann-Wilsdorf, D.; Laird, C. Dislocation behavior in fatigue II. Friction stress and back stress as inferred from an analysis of hysteresis loops. Mater. Sci. Eng. 1979, 37, 111–120. [Google Scholar] [CrossRef]
- Toribio, J.; Kharin, V.; Lorenzo, M.; Vergara, D. Role of drawing-induced residual stresses and strains in the hydrogen embrittlement susceptibility of prestressing steels. Corros. Sci. 2011, 53, 3346–3355. [Google Scholar] [CrossRef]
- Fang, F.; Zhou, L.; Hu, X.; Zhou, X.; Tu, Y.; Xie, Z.; Jiang, J. Microstructure and mechanical properties of cold-drawn pearlitic wires affect by inherited texture. Mater. Des. 2015, 79, 60–67. [Google Scholar] [CrossRef]
- Toribio, J.; Ayaso, F.-J.; González, B.; Matos, J.-C.; Vergara, D.; Lorenzo, M. Tensile fracture behavior of progressively-drawn pearlitic steels. Metals 2016, 6, 114. [Google Scholar] [CrossRef]
- Toribio, J.; Ovejero, E. Microstructure evolution in a pearlitic steel subjected to progressive plastic deformation. Mater. Sci. Eng. A 1997, 234, 579–582. [Google Scholar] [CrossRef]
- Toribio, J.; Ovejero, E. Effect of cold drawing on microstructure and corrosion performance of high-strength steel. Mech. Time Depend. Mater. 1997, 1, 307–319. [Google Scholar] [CrossRef]
- Toribio, J.; Ovejero, E. Microstructure orientation in a pearlitic steel subjected to progressive plastic deformation. J. Mater. Sci. Lett. 1998, 17, 1045–1048. [Google Scholar] [CrossRef]
- Toribio, J.; Ovejero, E. Effect of cumulative cold drawing on the pearlite interlamellar spacing in eutectoid steel. Scr. Mater. 1998, 39, 323–328. [Google Scholar] [CrossRef]
- Toribio, J.; González, B.; Matos, J.-C. Microstructure and mechanical properties in progressively drawn pearlitic steel. Mater. Trans. 2014, 55, 93–98. [Google Scholar] [CrossRef]
- Toribio, J.; González, B.; Matos, J.C.; Kharin, V. Evaluation by sharp indentation of anisotropic plastic behaviour in progressively drawn pearlitic steel. ISIJ Int. 2011, 51, 843–848. [Google Scholar] [CrossRef][Green Version]
- Kishi, T.; Tanabe, T. The Bauschinger effect and its role in mechanical anisotropy. J. Mech. Phys. Solids 1973, 21, 303–315. [Google Scholar] [CrossRef]
- Skelton, R.P.; Maier, H.J.; Christ, H.J. The Bauschinger effect, Masing model and the Ramberg-Osgood relation for cyclic deformation in metals. Mater. Sci. Eng. A 1997, 238, 377–390. [Google Scholar] [CrossRef]
- Ye, D.; Matsuoka, S.; Nagashima, N.; Suzuki, N. The low-cycle fatigue, deformation and final fracture behaviour of an austenitic stainless steel. Mater. Sci. Eng. A 2006, 415, 104–117. [Google Scholar] [CrossRef]
- Toribio, J.; Kharin, V. Localized plasticity near a crack tip in a strain hardening material subjected to mode I loading. Mater. Sci. Eng. A 2001, 319, 535–539. [Google Scholar] [CrossRef]
- Tvergaard, V. On fatigue crack growth in ductile materials by crack–tip blunting. J. Mech. Phys. Solids 2004, 52, 2149–2166. [Google Scholar] [CrossRef]
- Toribio, J.; Kharin, V. Comments on simulations of fatigue crack propagation by blunting and re-sharpening: The mesh sensitivity. Int. J. Fract. 2006, 140, 285–292. [Google Scholar] [CrossRef]
- Toribio, J.; Kharin, V. Crack-tip stress-strain fields during cyclic loading and effect of overload. Int. J. Fract. 2006, 139, 333–340. [Google Scholar] [CrossRef]
- Toribio, J.; Kharin, V. Finite-deformation analysis of the crack-tip fields under cyclic loading. Int. J. Solids Struct. 2009, 46, 1937–1952. [Google Scholar] [CrossRef]
- Toribio, J.; Kharin, V.; Ayaso, F.J.; González, B.; Matos, J.C.; Vergara, D.; Lorenzo, M. Numerical and experimental analyses of the plasticity-induced fatigue crack growth in high-strength steels. Constr. Build. Mater. 2011, 25, 3935–3940. [Google Scholar] [CrossRef]
- Toribio, J.; Kharin, V. Plasticity-induced crack closure: A contribution to the debate. Eur. J. Mech. A Solids 2011, 30, 105–112. [Google Scholar] [CrossRef]
- Toribio, J.; Kharin, V. Simulations of fatigue crack growth by blunting–re-sharpening: Plasticity induced crack closure vs. alternative controlling variables. Int. J. Fatigue 2013, 50, 72–82. [Google Scholar] [CrossRef]
© 2020 by the authors. Licensee MDPI, Basel, Switzerland. This article is an open access article distributed under the terms and conditions of the Creative Commons Attribution (CC BY) license (http://creativecommons.org/licenses/by/4.0/).