Abstract
Background and Aims: Current changes in family structures make the development of models for sustainably ensuring high-quality care for older people in the province of Bolzano–Bozen increasingly necessary to identify new solutions to address the needs of older people. This research project explores support options that enable older individuals to live independently in their homes for as long as possible, based on data collected through a quantitative survey. Special attention is devoted to recent transformations in family dynamics, highlighting the urgency of rethinking care strategies for older people. Data and Methods: The study focuses on a sample of individuals aged 60 and older who reside in their own homes in South Tyrol. Data were collected through 536 interviews conducted in 2020, using a questionnaire administered in both German and Italian. A Latent Class Model (LCA) was used to identify latent categorical indicators, with each category representing a specific combination of factors derived from the data. Results: The findings underscore the critical role of eliminating architectural barriers, fostering social connections, and promoting volunteer activities as key factors in enhancing the quality of life and independence of older adults.
1. Introduction
In recent years, demographic trends and significant transformations in family structures—such as rising divorce rates, declining birth rates, the growing prevalence of one- or two-person households, and increased geographic mobility, particularly among younger generations—presage a social change that poses new challenges to society for the care and protection of the older adults [1,2]. These demographic and cultural changes suggest a decreasing likelihood of practical support from children to their older parents, particularly in cases of geographical distance or family separation, compounded by the increasing formation of new partnerships later in life [3].
The sharp decline in traditional family support systems underscores that families are no longer able to provide the necessary care for older adults as they once did [4,5]. However, it remains evident that most older adults wish to continue living in their own homes or within familiar environments and neighbourhoods for as long as their health permits [6]. In response to these changes, it is essential to establish care frameworks and facilities that address these societal transformations while ensuring the continuity of long-term care for older adults [7].
This study focuses on older age groups—the “young older adults” and the “very old”—in South Tyrol, an autonomous rural region in northern Italy. It examines the living spaces and immediate environments of the target group, including their relationships with neighbours, under the assumption that the living environment significantly impacts opportunities for activities outside their home [8,9].
A mixed-method approach was adopted for this study, following a sequential exploratory design. The qualitative component of the research was experimental and aimed at gathering elements and insights that informed the subsequent quantitative analysis [10]. For the qualitative phase, semi-structured interviews were conducted with experts working in public and private care institutions for older adults. The interviews included general questions about age-appropriate housing and the housing needs of older adults, future approaches to accommodation for older individuals in South Tyrol, and support options to enable them to remain in their homes for as long as possible. Additionally, experts were asked to evaluate the current state of older adults’ care in South Tyrol and to identify perceived gaps in existing services. A total of ten guideline-based expert interviews were conducted from August to December 2019 throughout South Tyrol. The purpose of conducting these expert interviews was twofold: firstly, to obtain an initial assessment of the topic of living in old age and the existing services and resources, and secondly, to collect ideas from local stakeholders on meaningful support services for the elderly. Thematic analysis [11] was employed to systematically analyse the interview transcripts.
As reported in Paone & Mairhofer [12], the qualitative findings underscored the significance of the immediate living environment for the subjective well-being of older adults. Experts highlight the necessity of interdisciplinary collaboration between social and healthcare institutions to enhance support for this group. Older people often lack knowledge about available information and counselling options. Additionally, accessing support services is frequently associated with bureaucratic hurdles, and contact tends to be made exclusively through digital channels. This can pose a challenge for older individuals with limited access to digital media. Therefore, it is essential for social and healthcare organisations to consider these factors when designing support services.
A key issue raised in the interviews is the lack of communication between social and healthcare services, leading to redundant structures and inefficiencies. Interviewees emphasised the need for diverse support services to address the heterogeneity of older adults. While barriers exist, resources such as volunteer work were seen as valuable complements to professional services. Community relationships were also highlighted as essential and should be systematically supported by professionals.
Overall, the study results indicate a need for local, small-scale support services that are barrier-free, adaptable to changing circumstances, and capable of facilitating smoother transitions between different levels of care. To improve long-term access to services for older adults, outreach-based forms of assistance are essential. This is particularly relevant in rural communities. The findings of this part of the research suggest that, alongside professional services, small-scale daily assistance and pre-care services play a critical role in assisting older adults [12].
These insights formed the basis for the design of the quantitative questionnaire.
The quantitative phase, which is the focus of this analysis, aims to identify the factors that enable or hinder older adults from remaining in their homes for as long as possible. Building on the premise that most older adults prefer to age in place, the study explores how to simultaneously ensure dignified and participatory ageing.
Therefore, the research addresses the following key points: (1) what support services enhance the living conditions of older persons, and what additional services could be introduced; (2) what role is played by the neighbourhood/volunteerism in supporting older adults; (3) how the social space and living environment could contribute to this support; (4) what characteristics of the living environment act as resources and what as barriers for older persons in South Tyrol.
The Theoretical Context
The current social assistance system supporting domiciliary care in Italy presents several weaknesses. These include the rigidity of care hours and days, inconsistencies in procedural processes, and, most notably, a widespread lack of coordination and integration across various interventions [13].
Research findings suggest that home care recipients often receive services that are partially inferior to those provided in nursing homes. However, satisfaction with care and health-related quality of life among older adults appears to be more closely linked to functional impairments and health problems than to whether care is received at home or in a specialised facility [14,15].
Despite the evident demand, alternative services and comprehensive social policy reforms remain marginal compared to the actual needs of the population. In Italy, much of the care burden still falls on families. This is especially evident in rural communities, where local infrastructures and social networks are often diluted. Within such contexts, older adults frequently experience loneliness, low self-esteem, and monotonous lifestyles. Nevertheless, many older adults engage in mutual assistance and spontaneous participation in community activities, transitioning from passive recipients of care to active participants and contributors to services [16].
Social and demographic changes are presenting significant challenges for municipalities and social policies. Most older people express a strong preference to remain in their homes for as long as possible [17] or to live near their children. However, household needs are becoming increasingly complex, and the number of single-care recipients continues to grow. These developments demand new strategies that address intricate needs, transform outpatient services into accessible and timely care facilities close to home, and support self-determined living.
In the past, life in rural areas was more constrained than it is today. Traditional village communities primarily consisted of ‘old families’, characterised by low generational mobility and stable role assignments [18]. Since the mid-20th century, rural communities have experienced significant lifestyle changes, leading to an increasing alignment between rural and urban regions.
While cities benefit from robust infrastructure in areas such as healthcare, education, and transportation, rural areas are facing a decline in public transport services and a rise in vacant residential and commercial properties [19]. In the context of demographic change, ageing in rural areas often brings specific challenges. The growing number of older adults in need of care, coupled with demographic decline due to youth migration, has significantly impacted the care of older adults in these regions [20].
One major issue is the lack of adequate public transport connections [21]. Due to the lack of public transport, mobility becomes particularly restricted for those without access to a vehicle or a driving licence, as driving often remains the only practical way to navigate rural areas [22].
Another challenge is that hospitals and doctors are generally located in larger cities, which are often difficult to access without assistance.
In addition, older adults who have lived their entire lives in the same village are typically deeply embedded in the local community and maintain frequent social interactions. However, the rural context, combined with sharp demographic declines over recent decades, has significantly influenced the development of social networks, particularly during the transition from adulthood to later life stages [23].
Putz [24] highlights that the older adults’ quality of life depends heavily on the commitment of local communities. Teti and Höpflinger [25] argue that insufficient local resources can force older adults to relocate to inpatient facilities, particularly in rural regions. According to Jacobs [26], future care structures must focus on two key areas: facilitating age-related transitions (“transitional care”) and enhancing community-based support services that allow older adults to remain in their homes.
As the range of physical, psychological, and social mobility diminishes in old age, the importance of the home [27] and the living environment [28] becomes increasingly pronounced. The living environment assumes greater significance as older adults’ movement and activity range declines [29].
The focus of this research is on the living spaces and immediate environments of older adults in the province of Bolzano/Bozen (South Tyrol). The study aims to identify gaps in care and develop recommendations for support structures that can sustain and improve life at home.
The central research questions are as follows:
- What facilities enable older adults to remain in their homes for as long as possible?
- What role does the neighbourhood play in this context?
- How do relationships with the immediate living environment differ between larger municipalities and smaller rural centres?
- What factors are perceived as resources or barriers?
These research questions aim to shed light on the specific characteristics of enabling structures within the immediate living environment. This focus is crucial because the spatial domain in old age plays a vital role in ensuring quality of life and fostering a self-determined lifestyle.
2. Materials and Methods
2.1. Participants
To capture the diversity of living conditions among old people, a sample of 536 individuals aged 60 and older who live in their own homes and reside in South Tyrol (Bolzano–Bozen province) were interviewed. We selected this province as our case study due to its distinctive governance model, which grants a high degree of self-rule, particularly in social and health policies. This autonomy, established by the Autonomy Statute of 1972, allows the province to legislate and administer key sectors, including healthcare. As a result, South Tyrol has developed a local health and care system that directly influences accessibility, organisation, and service delivery.
Interested parties, including local associations for older adults, senior citizens’ clubs, the White Cross, and Social Districts, were informed about the project in writing and invited to participate. Follow-up telephone conversations were conducted to address any remaining questions.
The following considerations guided this process: the research group aimed to reflect the diversity of living conditions among older adults and encompass the entire Province of Bozen/Bolzano. Accordingly, the target group included younger, active older adults and very old individuals with support needs (aged 60+). Exclusion criteria included individuals not residing in the Province of Bozen/Bolzano and those in inpatient or semi-inpatient facilities at the time of the study.
However, due to the participant selection methods, the sample cannot be considered fully representative. Despite this limitation, the achieved sample size, along with a balanced gender distribution, an appropriate representation of speakers of the province’s three official languages, and of the eight territorial areas’ administrative districts, allowed the study to attain a statistical power of 80%. Given the recruitment method and sample composition, potential selection biases cannot be excluded, particularly regarding individuals with higher levels of social engagement or access to services. As such, this study serves as a pilot investigation, providing valuable insights into the topic under examination, and it can be considered as a foundation for a future study based on a fully representative sample.
2.2. Instruments
A fourteen-page questionnaire was used for the quantitative part of the survey. To ensure accessibility, the questionnaire was written in simple language, available in both German and Italian. Participants belonging to the Ladin-speaking group received the questionnaire in either German or Italian.
The questionnaire included closed and hybrid questions. Hybrid questions combined predefined answer categories with the option for participants to provide their responses in their own words. Filter questions were also utilised to guide the survey process, determining whether follow-up questions were applicable based on initial responses [30].
For improved readability, the questionnaire was formatted with a large font (Arial 12) and organised into seven thematic sections: socio-demographic information (age, gender, marital status, educational level, mother tongue), economic situation (current and past job, kind of job), family situation (household composition, number of children, family exchanges, exchanges with non-coresident children (i.e., face-to-face and phone contact)), daily activities leisure and community (i.e., meeting friends or neighbours, frequency of these activities, voluntary, association or social activities), housing and living environment (house size, kind of house, satisfaction about housing), health conditions, if they received any kind of social or health support, subjective well-being, and satisfaction with relationships with a specific non-coresident child.
To ensure broader participation and accommodate restrictions due to infection control measures, the questionnaire was distributed in both digital and analogue formats. Considering the target group’s familiarity with technology, providing both formats ensured inclusivity.
2.3. ‘Living Longer’ as a Set of Latent Classes
To conceptualise the idea of older adults “living longer in their own homes”, a latent class model was employed. This approach allows the identification of latent categorical indicators, with each category representing a specific combination of factors derived from the data.
The model considers the following indicators: perceived health (5 categories), satisfaction with living conditions (4 categories), satisfaction with the neighbourhood (10 categories), time spent outside the home (4 categories), as well as perceived safety in one’s own home (4 categories).
However, this approach presents certain challenges. All these indicators do not normally distribute and are characterised by strongly skewed distributions, as demonstrated by the Shapiro–Wilk and Kolmogorov–Smirnov tests to test the normality hypotheses [31].
Consequently, to address the identified issues, we propose dichotomising the variables into five indices, where 0 represents a negative state and 1 represents a positive state.
The variables selected for the analysis are as follows:
- Perceived health: How is your health in general? (0 = bad; 1 = good);
- Time spent away from home: cross-reference two questions (‘How much time do you spend away from home?’ and ‘Do you sometimes not leave the house for a few days in a row?’ (0 = a little; 1 = a lot);
- Satisfaction with the neighbourhood: How satisfied are you with your relationship with the neighbourhood? (0 = dissatisfied; 1 = satisfied);
- Housing satisfaction: How satisfied are you with your living conditions? (0 = dissatisfied; 1 = satisfied);
- Perceived housing safety: Do you feel safe in your home (0 = unsafe; 1 = safe)
At this stage, a latent class model (LCA) can be applied, utilising the manifest variables listed above. Through the model, these manifest variables are connected to the latent concept under analysis [32].
In other words, LCA allows us the identify latent factor categories associated with specific combinations of observable variables. The fundamental assumption is that local independence exists among the manifest variables, meaning that any observed association between them is assumed to be zero within the categories of the latent variable [33].
Formally, the conditional probability of a response pattern given a latent class can be expressed as follows:
where denotes the probability of response to variable A, conditional on membership in class c, and similarly for variables B and C. This structure relies on the local independence assumption, meaning that the observed responses are assumed to be independent given class membership.
In the model selection process, we applied the Akaike Information Criterion (AIC) and the Bayesian Information Criterion (BIC), both of which are penalised-likelihood metrics used to evaluate model fit while accounting for model complexity. They are defined as follows:
where is the maximum likelihood of the model, K is the number of estimated parameters, and N is the sample size. The model with the lowest AIC and BIC values was selected as the best fitting and most parsimonious.
This method was chosen because it is particularly suited to identify latent typologies based on categorical data, allowing us to uncover unobserved subgroups of older adults with distinct combinations of life conditions. Unlike standard clustering techniques, LCA offers a probabilistic, model-based approach that provides measures of classification uncertainty and allows for the use of statistical criteria (such as AIC and BIC) to determine the optimal number of classes.
2.4. Specifying an Indicator
For the multivariate analysis procedure, an index was constructed by summing the normalised items to provide a clearer summary of the information from the observed indicator:
In the formula, represents the minimum value of Xj and the maximum value of Xj, while indicates the value of the reference items. This calculation produces a standardised index ranging from 0 to 1, enabling more accessible interpretation and comparability of results. All analyses were conducted using Stata/MP 17 (StataCorp LLC, College Station, TX, USA).
3. Results
3.1. Preliminary Descriptive Data
Before addressing the research questions, it is essential to provide a brief description of the dataset and the variables under analysis. The sample comprises 536 respondents, aged 60 to 101 years, with 60% women, 39% men and just under one per cent identifying as “other”.
Reflecting the socio-cultural diversity and multilingualism of South Tyrol, 68% of participants were German-speaking, 20% Italian-speaking, and 12% Ladin-speaking. The survey also showed that 51% were married, 27% were widowed, 10% single, 6% cohabiting, and 6% divorced or separated.
The data indicates a general tendency towards smaller household sizes: the majority of respondents (81%) stated that they resided in a one- or two-person household, while the remainder stated that they resided in larger households (three- to four-person households). The majority of participants reported living with their partner and/or children.
The number of people in employment is minimal. This phenomenon can be attributed to the age structure of the target group of the survey, which is characterised by a limited proportion of individuals in employment. The majority of participants had already retired at the time of the survey. The participants are residents of the various district communities that are located within the province.
Table 1 presents the percentage distributions for four key variables: age, employment status, marital status, and education level. Age is divided into six categories, with the largest group being 60–65 years old (22.20%). There is a gradual decline in representation for older age groups, reaching 12.87% in the 81–85 range, before a slight increase in those over 85 years (16.04%).

Table 1.
Demographic and socioeconomic characteristics of the sample.
Regarding employment status, most respondents are retired, with a predominance of former employees (35.07%), followed by workers (19.59%) and housewives (14.74%). Only a small fraction of respondents are still employed, either permanently (8.40%) or on fixed-term contracts (5.22%).
Marital status shows that most respondents are married (50.75%), followed by widowed individuals (26.87%). Smaller percentages are seen for single (10.45%), cohabiting (5.60%), divorced (4.29%), and separated individuals (2.05%).
Finally, regarding education level, the majority completed elementary (26.12%) or middle school (24.81%), with 24.25% having vocational training. Lower proportions are seen among those with high school diplomas (18.66%) or university degrees (6.16%).
3.2. Latent Class Analysis
The third latent class model is observed to be the best fit for the data (Table 2), as it explains 93.63% of the Variance and simultaneously exhibits the lowest values for both BIC and AIC. Furthermore, the test result comparing this model with the saturated model yields a non-significant p-value (0.301), indicating that this model does not fit significantly worse than the saturated model. This finding is particularly noteworthy given the relatively small sample size of this study.
Table 2.
Latent classes and adaptation.
Finally, the breadth of the various classes can be interpreted based on the results of the conditional probabilities (Table 3), providing meaningful labels for the identified classes.
Table 3.
Results of latent class analysis: conditional probabilities.
Specifically, we have identified three latent classes:
- (a)
- Cluster 1: all indicators have very good values;
- (b)
- Cluster 2: all indicators have low values;
- (c)
- Cluster 3: some indicators have positive values, and others have negative values.
These clusters can be interpreted as three distinct ageing profiles. Class 1 represents older adults living in overall favourable conditions, with good health, satisfaction, and safety. Class 2 identifies individuals facing cumulative disadvantages, such as poor health and low satisfaction with their environment, which may place them at higher risk of social exclusion. Class 3 includes those with mixed conditions—some positive, others negative—who may be particularly sensitive to changes in their environment.
We can observe the profile plot graphically more effectively (Figure 1).
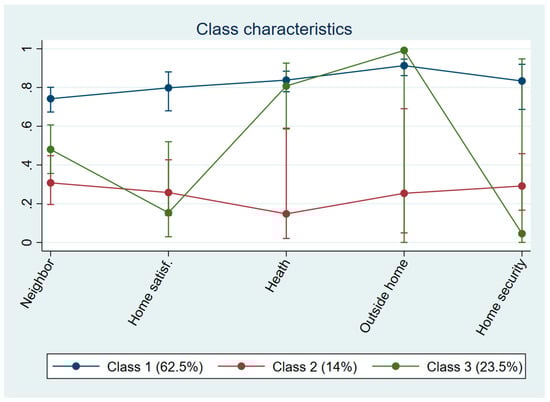
Figure 1.
Profile Plot of Conditional Probabilities by Latent Class.
The graph indicates that class 1, comprising 62.5% of the entire sample, exhibits high values for all considered indicators. In contrast, class 2 represents approximately 14% of the sample and displays consistently low values. Finally, class 3 is characterised by a mix of high and low values across the indicators. In this analysis, the comparison will focus on the first and second classes, as these groups represent individuals with distinctly different and distant values.
To summarise, the three identified classes follow a conceptual structure, with the first and second clusters representing markedly different types of individuals. The first group is associated with above-average values, while the second cluster includes individuals who scored lowest on neighbourhood satisfaction, home satisfaction, perceived health, time spent away from home, and perceived housing security. The third cluster lies between the first two, achieving intermediate values across the indicators. This study will concentrate on comparing the first and second clusters.
Figure 2 illustrates the trend of predictive margins by age, revealing an interesting finding: older individuals are more likely to belong to the second class. As people age, the likelihood of being in the second class increases, while the probability of being in the first or third clusters decreases. In summary, older individuals are more likely to belong to the second class, while younger individuals predominantly belong to the first cluster.
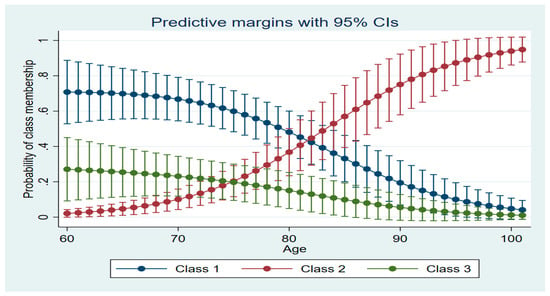
Figure 2.
Class probability by age.
This trend suggests that age-related disadvantages accumulate over time and highlights the need for age-sensitive policies. As individuals grow older, the likelihood of being in the most disadvantaged group increases, indicating a potential vulnerability that may require early interventions.
To initially frame the phenomenon of interest, we employed traditional cross-tabulations. The results (Table 4) reveal a linear trend across the first and second clusters in relation to age groups. In the first cluster (classified as “very good”), the percentage decreases steadily as we move from the youngest (60–64) to the oldest age group (90+). Conversely, in the second cluster—comprising individuals with the lowest values—the rate increases significantly, by over five times (522.71%), from the youngest (60–64) to the oldest age group (90+). The third cluster, consisting of individuals with overall average values, appears relatively balanced across age groups.
Table 4.
Cluster distribution according to age (percentage values).
Gender differences are minimal; however, the first cluster has a slightly higher percentage of men, while the second cluster has a higher percentage of women.
A distinct pattern also emerges when considering education levels within the first and second clusters. In the first cluster (very good), the percentage progressively increases with higher education levels. In contrast, in the second cluster—characterised by the lowest values—the percentage decreases significantly, by 77.81%, as we move from the least educated group (27.14%) to the most educated group (6.02%).
Regarding marital status, married individuals represent the highest percentage in the first cluster. However, in the second cluster, married individuals account for the lowest percentage (11.59%), which is lower than that of separated/divorced individuals (14.71%) and singles (17.86%).
3.3. Factorial Analysis
The indicator used in this study defines the architectural barriers present in the home. The variables considered are binary (0 = absence; 1 = presence):
- Access to the house/apartment is too narrow;
- Stairs or steps inside the house/apartment;
- Traverses within the house/apartment;
- Rough paving;
- Doors too narrow;
- Corridors too narrow;
- Inaccessible bathtub or shower;
- Small rooms;
- No lift.
First, we check through the tetrachoric correlation matrix the degree of association between the ordinal dichotomous variables [34]. Secondly, we carry out an exploratory factor analysis, a multivariate analysis technique designed to reduce the available data, starting with a large number of variables, aiming to detect the underlying structure, assuming that every indicator can be associated with every factor [35,36].
Since the observed variables are binary, the use of a tetrachoric correlation matrix is appropriate, as it estimates the strength of association between dichotomous indicators under the assumption of underlying continuous traits. Each latent factor can be represented as a linear combination of standardised observed variables :
The communality of each item was calculated as the sum of squared factor loadings:
Factors were retained based on the Kaiser criterion (eigenvalues > 1), and communalities greater than 0.35 were considered satisfactory. For interpretation purposes, factor loadings above 0.70 were regarded as excellent, those between 0.45 and 0.60 as acceptable, and those below 0.32 as weak.
Statistically, a linear transformation is produced and a projection of the observable variables under consideration onto a Cartesian axis system, in which the component with the highest Variance is projected onto the first axis, the second component with the highest Variance onto another axis, and so on. We can verify the presence of a significant correlation between the variables using certain tests, such as Barlett’s sphericity test or Kaiser-Meyer’s test [37].
The stages of the analysis are as follows:
- carry out a correlation matrix analysis between the indicators considered to test whether it is appropriate to use factor analysis and assess its consistency;
- determine the number of factors to be extracted.
At a formal level, the components represent a linear combination of the different observed variables ():
The parameters represent factor loadings, expressing the weight of a specific indicator in predicting a specific component.
In that case, factorial weights above 0.7 are excellent, 0.6 are very good, between 0.45 and 0.55 are acceptable, and below 0.32 are not good.
Finally, let us consider eigenvalues and communalities.
The former is the Variance attributable to a single factor—usually, eigenvalues with values greater than 1 (). In the second case, this is the Variance that each factor can explain. In this case, values above 0.35 (h2 > 0.35) are considered adequate.
All factor loadings exceeded the minimum acceptable threshold of 0.45, with six out of nine variables scoring above 0.70, indicating an excellent level of association with the extracted factor. Only one variable (“Stairs or steps inside the house/apartment”) showed a relatively low communality (0.26), though its factor loading (0.51) remained within the acceptable range. The overall model explained 82.72% of the variance.
This indicates that the selected indicators strongly converge into a single latent dimension representing the level of architectural accessibility. In practical terms, individuals scoring high on this factor are likely to face several physical obstacles at home, which may jointly compromise their autonomy and mobility.
We used Exploratory Factor Analysis to reduce a set of correlated architectural barrier indicators into a single latent dimension, in order to simplify the inclusion of this complex information into the multivariate models. EFA was the appropriate method given the absence of a predefined theoretical structure and the need to detect the underlying relationships among the observed variables.
When analysing the results, the presence of a dimension related to architectural barriers emerges very clearly (Table 5).
Table 5.
FA corresponding to the indicator of architectural barriers in the home.
For the subsequent multivariate analysis procedure, we constructed an index (Table 6)—calculated as the summation of the items normalised—in such a way as to summarise the information of the observable indicator considered more clearly:
Table 6.
Descriptive analysis of the indicator of architectural barriers in the home.
In the formula, represents the minimum value and the maximum, while indicates the value of the reference items. This way, we obtain a standard variation between 0 and 1, ensuring a more accessible and comparable interpretation of the results.
3.4. Results of Multivariate Analysis
The analysis was conducted in a stepwise manner. Initially, only sociodemographic variables—age, gender, marital status, education, and employment status—were included to control for potential confounding effects. The reference group for this analysis is Cluster 1, which consists of individuals who scored high on average across the selected indicators, in a model with three clusters. Results are shown in Table 7.
Table 7.
Multinomial logistic model: estimates for the probability of belonging to a particular cluster rather than Cluster 1.
In the first model, containing only sociodemographic variables, age and education emerged as significant predictors of membership in Cluster 2. Specifically, the likelihood of belonging to Cluster 2 increases significantly for individuals aged 85–89. Conversely, higher education decreases the likelihood of belonging to Cluster 2 compared to lower education levels.
This model demonstrated an adequate fit; with Likelihood Ratio (LR) Chi2(36) = 95.84; p < 0.001 and Pseudo R2 = 0.10. The Pseudo R2 indicates that 10% of the Variance is explained by the predictors included in the model
In the next step, we incorporated additional predictors, including frequency of social interactions with friends or acquaintances, duration of residence in the same dwelling, presence of shops nearby, participation in volunteer work, type of housing contract, house size, presence of architectural barriers, engagement in physical activity, demographic size of the municipality of residence.
The model’s fit improved significantly with these additional predictors (Likelihood Ratio (LR) Chi2(90) = 261.83, p < 0.001 and Pseudo R2 = 0.27), reflecting a 17% gain in explanatory power over the previous model.
The analysis presented in Table 7 reveals notable differences in the probability of various behaviours and living conditions across clusters. The likelihood of seeing friends or acquaintances once a week or less frequently increases significantly for individuals in the second cluster compared to the first (e.g., once a week: b = 1.52, SE = 0.67, p = 0.024; once a month: b = 1.61, SE = 0.71, p = 0.024; 2–4 times a year: b = 1.96, SE = 0.76, p = 0.011). Similarly, there is a significant reduction in the probability of engaging in voluntary work for individuals in the second cluster compared to the first (b = −1.14, SE = 0.44, p = 0.010).
Living arrangements also show significant differences. The probability of residing in a relative’s home or a state-provided house is higher in the second cluster compared to the likelihood of living in one’s flat (relatives: b = 2.03, SE = 0.69, p = 0.003; state-provided houses: b = 1.78, SE = 0.71, p = 0.032). Conversely, the likelihood of living in a flat of more than 150 square metres decreases significantly for individuals in this cluster (b = −1.54, SE = 0.85, p = 0.043). Additionally, the presence of architectural barriers is more likely in the second cluster compared to the first (b = 2.41, SE = 1.10, p = 0.030), and the habit of frequent physical exercise is notably less likely (b = −1.21, SE = 0.38, p = 0.001).
In contrast, there are no statistically significant differences between clusters in terms of the presence of shops in the vicinity or the demographic size of the municipality of residence.
The rightmost columns of the table report the relative risk ratios (RRR), which represent the likelihood of belonging to a specific cluster relative to the reference cluster. For instance, individuals aged 89+ in the second cluster have an RRR of 3.43, meaning they are approximately three and a half times more likely to possess a given characteristic compared to the reference group. Likewise, individuals in the second cluster are five times more likely to meet their friends only once a month and seven times more likely to meet them only 2–4 times a year. Moreover, the likelihood of living in a home for 21–30 years is four times higher for those in the second cluster, and the likelihood of living in a state-provided house is three times greater compared to the reference group. These findings underscore the significant differences between clusters regarding social behaviours, living arrangements, and environmental factors.
4. Discussion
This study employed latent class analysis (LCA) to identify the support mechanisms that facilitate elderly individuals in South Tyrol to live in their own homes for as long as possible. These findings reinforce the conceptualisation of ageing not merely as a biological process but as a socio-environmental experience. The strong association between perceived well-being and latent class membership supports the multidimensional perspective on ageing in place, where physical environment, safety, and social satisfaction jointly shape the experience of later life.
A three-class solution emerged as the best fit for the data, delineating distinct yet sharply contrasting levels of general well-being among the elderly, particularly within the first two classes, which are of greatest relevance to our objectives. These classes were conceptualised as discrete typologies, defined by specific and concrete indicators.
Using this framework, the study explored which characteristics of the living environment function as resources and which act as barriers for elderly residents in South Tyrol, with a particular focus on the role of neighbourhood dynamics, volunteerism, and the potential support offered by social spaces and the built environment.
The findings underscore the critical importance of addressing architectural barriers, especially for older adults and those with specific health challenges. The results also highlight the significant role of friendships in ensuring that elderly individuals can maintain a high quality of life and remain in their homes for as long as possible. Additionally, active participation in volunteer work proves to be a vital resource in this regard.
In other words, social space and the living environment are pivotal, as they provide opportunities for meeting, socialising and engaging in meaningful activities. Conversely, barriers encompass all elements that impede older individuals—especially those with health limitations—from moving freely and independently.
These findings align with the understanding that, as people age, their range of activity tends to shrink, making the home and immediate living environment increasingly vital [38]. The significance of these factors grows as mobility decreases due to physical, psychological, or social constraints [28,29].
One relevant result is the age-based distribution of class membership: older individuals were more likely to belong to the most disadvantaged class. This pattern aligns with the theory of cumulative disadvantage, suggesting that disadvantages related to health, mobility, and perception of safety do not appear in isolation but tend to cluster and intensify with age. Such clustering reflects structural inequalities in ageing that policies must address in an integrated way.
However, this study has certain limitations. Overall, this study supports a multidimensional approach to ageing and highlights the value of latent class analysis in uncovering hidden heterogeneity among older adults. Future research should explore how these latent profiles evolve over time and how contextual factors—such as family support or community infrastructure—interact with perceived living conditions to shape trajectories of vulnerability or resilience. Retrospective and pre-treatment variables could have enhanced the identification and control of unobserved heterogeneity. Additionally, the analyses were conducted on a relatively small sample size. Therefore, replicating this research with a larger sample would be beneficial, particularly given the specific testing techniques and procedures used, and would strengthen the robustness of the findings, especially in the context of LCA [39,40].
Further theoretical and empirical investigations are therefore essential to refine the proposed model and to conduct complementary analyses that can address key factors and elements only partially considered in this study. Future research should prioritise larger samples and adopt a longitudinal and broader retrospective approach to provide deeper and more comprehensive insights.
5. Conclusions
This study provides important insights into the factors that enable elderly individuals in South Tyrol to maintain their independence and continue living in their own homes. Through latent class analysis (LCA), we identified three distinct typologies of elderly individuals, characterised by varying levels of well-being and support needs. The findings emphasise the critical role of both the physical living environment and social connections in fostering quality of life for older adults. The elimination of architectural barriers, the cultivation of meaningful relationships, and participation in volunteer activities emerged as key protective factors. The responses from the interviews and questionnaires show that support structures should be low-threshold, accessible and more flexible to adapt to the changing needs and circumstances of older people. The responses from senior citizens also suggest that the information and public relations outreach on the subject of housing in old age should be reconsidered. Approximately one-third of the senior citizens who participated in the quantitative segment of the study reported uncertainty regarding the appropriate channels to consult for housing-related concerns. This underscores the necessity for simplified access to pertinent information and the removal of barriers that impede older individuals’ ability to obtain the necessary information.
However, the study is not without its limitations. First, the relatively small sample size restricts the generalisability of the results. Future research should aim to replicate these findings on a larger scale to confirm the robustness of the proposed typologies. Second, the cross-sectional design of the study limits our ability to explore how these dynamics evolve over time. A longitudinal approach would allow for the examination of causal relationships and the identification of long-term trends. Finally, the absence of retrospective variables prevents a more comprehensive understanding of how past experiences or conditions influence current well-being and living arrangements.
Looking ahead, future research should focus on refining the proposed model by integrating retrospective and longitudinal data to account for the dynamic nature of ageing. Moreover, exploring the interplay between specific environmental features, individual health trajectories, and broader social policies could provide a deeper understanding of how to create age-friendly communities. These directions would not only advance theoretical knowledge but also support the development of targeted interventions to improve the lives of older adults.
In conclusion, this study underscores the importance of adopting a holistic approach to ageing, one that prioritises inclusive design, fosters community engagement, and recognises the centrality of the home and living environment in later life. By addressing the barriers identified here and building on the strengths of the living environment, we can create supportive spaces that empower elderly individuals to lead independent and fulfilling lives.
Author Contributions
Conceptualisation, G.C. and N.P.; methodology, G.C., N.P. and E.T.; software, E.T. and G.C.; formal analysis, E.T.; investigation, N.P. and G.C.; data curation, E.T.; writing—original draft preparation, E.T.; writing—review and editing, G.C., E.T. and N.P.; visualisation, G.C. and E.T.; supervision, G.C.; project administration, N.P., G.C. and E.T. All authors have read and agreed to the published version of the manuscript.
Funding
This work was supported by the Open Access Publishing Fund of the Free University of Bozen-Bolzano.
Institutional Review Board Statement
At the time this study was conducted, formal ethical approval was not required by our institution for observational research that did not involve sensitive data, clinical procedures, or experimental interventions. Nonetheless, all participants provided written informed consent after receiving clear information about the study’s objectives and procedures. The research was carried out in full compliance with the ethical principles of the Declaration of Helsinki, ensuring both anonymity and confidentiality of the data collected.
Informed Consent Statement
Informed consent was obtained from all subjects involved in the study.
Data Availability Statement
Data may be provided after request.
Conflicts of Interest
The authors declare no conflicts of interest.
References
- Larranaga, I.; Martin, U.; Bacigalupe, A.; Begiristain, J.M.; Valderrama, M.J.; Arregi, B. Impact of informal caregiving on caregivers’ health and quality of life: Analysis of gender inequalities. Gac. Sanit. 2008, 22, 443–450. [Google Scholar] [PubMed]
- Petrini, M.; Cirulli, F.; D’Amore, A.; Masella, R.; Venerosi, A.; Carè, A. Health issues and informal caregiving in Europe and Italy. Ann. Ist. Super. Sanita 2019, 55, 41–50. [Google Scholar] [PubMed]
- Stuifbergen, M.C.; Van Delden, J.J.M.; Dykstra, P.A. The implications of today’s family structures for support giving to older parents. Ageing Soc. 2008, 28, 413–434. [Google Scholar] [CrossRef]
- Oris, M.; Baeriswyl, M.; Ihle, A. The Life Course Construction of Inequalities in Health and Wealth in Old Age. In Handbook of Active Ageing: Quality of Life; Springer: Cham, Switzerland, 2021; pp. 97–109. [Google Scholar]
- Quesnel-Vallée, A.; Willson, A.; Reiter-Campeau, S. Health inequalities among older adults in developed countries: Reconciling theories and policy approaches. In Handbook of Aging and the Social Sciences, 8th ed.; Elsevier: London, UK, 2016; pp. 483–502. [Google Scholar]
- Turjamaa, R.; Pehkonen, A.; Kangasniemi, M. How smart homes are used to support older people: An integrative review. Int. J. Older People Nurs. 2019, 14, e12242. [Google Scholar] [CrossRef]
- Plöthner, M.; Schmidt, K.; de Jong, L.; Zeidler, J.; Damm, K. Needs and preferences of informal caregivers regarding outpatient care for the elderly: A systematic literature review. BMC Geriatr. 2019, 19, 82. [Google Scholar] [CrossRef]
- Bonaccorsi, G.; Manzi, F.; Del Riccio, M.; Setola, N.; Naldi, E.; Milani, C.; Giorgetti, D.; Dellisanti, C.; Lorini, C. Impact of the built environment and the neighborhood in promoting physical activity and healthy aging in older people: An umbrella review. Int. J. Environ. Res. Public Health 2020, 17, 6127. [Google Scholar] [CrossRef]
- Rautio, N.; Filatova, S.; Lehtiniemi, H.; Miettunen, J. Living environment and its relationship to depressive mood: A systematic review. Int. J. Soc. Psychiatry 2018, 64, 92–103. [Google Scholar] [CrossRef]
- Cohen, S.; Janicki-Deverts, D.; Chen, E.; Matthews, K.A. Childhood socioeconomic status and adult health. Ann. N. Y. Acad. Sci. 2010, 1186, 37–55. [Google Scholar] [CrossRef]
- Mayring, P. Qualitative Inhaltsanalyse. Grundlagen und Techniken, 11th ed.; Beltz Verlag: Weinheim, Germany, 2010. [Google Scholar]
- Paone, N.; Mairhofer, S. Come favorire forme di sostegno alla domiciliarità nel lavoro sociale con gli anziani? Quad. De "La Riv. Di Serv. Sociale" 2023, 21, 51–62. [Google Scholar]
- Agenzia Nazionale per i Servizi Sanitari Regionali (AGENAS). La Presa in Carico Degli Anziani non Autosufficienti: Elementi di Analisi e Osservazione del Sistema Salute. Quaderno di Monitor, Supplemento al Numero 30. 2012. Available online: https://www.opivenezia.it/images/notizie/quaderno_monitor_10.pdf (accessed on 15 November 2012).
- Hasson, H.; Arnetz, J.E. Care recipients’ and family members’ perceptions of quality of older people care: A comparison of home-based care and nursing homes. J. Clin. Nurs. 2011, 20, 1423–1435. [Google Scholar] [CrossRef]
- Karlsson, S.; Edberg, A.K.; Jakobsson, U.L.F.; Hallberg, I.R. Care satisfaction among older people receiving public care and service at home or in special accommodation. J. Clin. Nurs. 2013, 22, 318–330. [Google Scholar] [CrossRef] [PubMed]
- Zhang, Y.; Li, W.; Wang, L. Design of Elderly Care Service in Rural Community with Mutual Assistance Mode—A Case Study of B Rural Community in A Town, Beijing. In Proceedings of the HCI International 2021-Posters: 23rd HCI International Conference (HCII 2021), Virtual Event, 24–29 July 2021; Springer International Publishing: Cham, Switzerland, 2021; pp. 318–326. [Google Scholar]
- Oswald, F.; Kaspar, R.; Frenzel-Erkert, U.; Konopik, N. Hier Will ich Wohnen Bleiben. Ergebnisse eines Frankfurter Forschungsprojekts zur Bedeutung des Wohnens in der Nachbarschaft für gesundes Altern; Goethe-Universität Frankfurt: Frankfurt am Main, Germany, 2013. [Google Scholar]
- Baumgartner, K.; Kolland, F.; Wanka, A. Altern im ländlichen Raum: Entwicklungsmöglichkeiten und Teilhabepotentiale; Kohlhammer Verlag: Stuttgart, Germany, 2013. [Google Scholar]
- Kröhnert, S.; Ningel, R.; Thomé, P. Ortsentwicklung in Ländlichen Räumen: Handbuch für Soziale und Planende Berufe; Haupt Verlag: Bern, Switzerland, 2020. [Google Scholar]
- Fachinger, U.; Künemund, H. Gerontologie und Ländlicher Raum: Lebensbedingungen, Veränderungsprozesse und Gestaltungsmöglichkeiten; Springer: Wiesbaden, Germany, 2015. [Google Scholar]
- Hahne, U. Zukunftskonzepte für schrumpfende ländliche Räume. Von dezentralen und eigenständigen Lösungen zur Aufrechterhaltung der Lebensqualität und zur Stabilisierung der Erwerbsgesellschaft. Neues Arch. Niedersachsen 2009, 1, 2–25. [Google Scholar]
- Limbourg, M. Mobilität im höheren Lebensalter in ländlichen Gebieten: Probleme und Lösungsansätze. In Gerontologie und ländlicher Raum; Springer: Wiesbaden, Germany, 2015; pp. 77–98. [Google Scholar]
- Huxhold, O.; Fiori, K.L. Do demographic changes jeopardize social integration among aging adults living in rural regions? J. Gerontol. Ser. B 2019, 74, 954–963. [Google Scholar] [CrossRef]
- Putz, T. Sociokultur. In Alternde Gesellschaften Gerecht Gestalten: Stichwörter für Die Partizipative Praxis; Ross, F., Rund, M., Steinhaußen, J., Eds.; Verlag Barbara Budrich: Opladen, Germany, 2018. [Google Scholar]
- Teti, A.; Höpflinger, F. Wohnen im höheren Lebensalter: Konzepte und aktuelle Entwicklungen. In Handbuch Wohnsoziologie; Breckner, I., Pohlan, J., Eds.; Springer: Wiesbaden, Germany, 2020; pp. 1–26. [Google Scholar]
- Jacobs, K.; Schwinger, A.; Klauber, J.; Greß, S.; Kuhlmey, A. Pflege-Report 2016: Schwerpunkt: Die Pflegenden im Fokus; Schattauer Verlag: Stuttgart, Germany, 2016. [Google Scholar]
- Pelizäus-Hoffmeister, H. Gesellschaftliche Teilhabe Älterer durch Alltagsmobilität. Forum Qual. Soc. Res. 2014, 15, 1–23. [Google Scholar]
- Barth, C.; Olbermann, E.J. Wohnen im Alter. Potenziale einer nachhaltigen Quartiersentwicklung für die Lebensqualität älterer Menschen. Blätter der Wohlfahrtspfl. 2012, 159, 138–140. [Google Scholar] [CrossRef]
- Saup, W. Alte Menschen in ihrer Wohnung: Sichtweise der ökologischen Psychologie und Gerontologie. In Alte Menschen in ihrer Umwelt; Wahl, H.W., Mollenkopf, H., Oswald, F., Eds.; VS Verlag für Sozialwissenschaften: Wiesbaden, Germany, 1999; pp. 43–52. [Google Scholar]
- Schmid, T.; Flaker, J. Von der Idee zur Forschungsarbeit. In Forschen in Sozialarbeit und Sozialwissenschaft; Flaker, V., Ed.; Böhlau Verlag: Wien, Austria, 2006; pp. 37–53. [Google Scholar]
- Razali, N.M.; Wah, Y.B. Power comparisons of Shapiro–Wilk, Kolmogorov–Smirnov, Lilliefors and Anderson–Darling tests. J. Stat. Model. Anal. 2011, 2, 21–33. [Google Scholar]
- Moisio, P. A latent class application to the multidimensional measurement of poverty. Qual. Quant. 2004, 38, 703–717. [Google Scholar] [CrossRef]
- McCutcheon, A.L. Latent Class Analysis; Sage: Thousand Oaks, CA, USA, 1987. [Google Scholar]
- Olsson, U.J. Maximum likelihood estimation of the polychoric correlation coefficient. Psychometrika 1979, 44, 443–460. [Google Scholar] [CrossRef]
- Kim, J.; Mueller, C.W. Factor Analysis: Statistical Methods and Practical Issues; Sage: Beverly Hills, CA, USA, 1978. [Google Scholar]
- Russell, D.W. In search of underlying dimensions: The use (and abuse) of factor analysis in Personality and Social Psychology Bulletin. Personal. Soc. Psychol. Bull. 2002, 28, 1629–1646. [Google Scholar] [CrossRef]
- Beavers, A.S.; Lounsbury, J.W.; Richards, J.K.; Huck, S.W.; Skolits, G.J.; Esquivel, S.L. Practical considerations for using exploratory factor analysis in educational research. Pract. Assess. Res. Eval. 2013, 18, n6. [Google Scholar]
- Saup, W. Alter und Umwelt. Eine Einführung in Die ökologische Gerontologie; Kohlhammer: Stuttgart, Germany, 1993. [Google Scholar]
- Cudeck, R.A.; Browne, M.W. Cross-Validation of Covariance Structures. Multivar. Behav. Res. 1983, 18, 147–167. [Google Scholar] [CrossRef] [PubMed]
- MacCallum, R.C.; Roznowski, M.; Mar, C.M.; Reith, J.V. Alternative strategies for cross-validation of covariance structure models. Multivar. Behav. Res. 1994, 29, 1–32. [Google Scholar] [CrossRef]
Disclaimer/Publisher’s Note: The statements, opinions and data contained in all publications are solely those of the individual author(s) and contributor(s) and not of MDPI and/or the editor(s). MDPI and/or the editor(s) disclaim responsibility for any injury to people or property resulting from any ideas, methods, instructions or products referred to in the content. |
© 2025 by the authors. Licensee MDPI, Basel, Switzerland. This article is an open access article distributed under the terms and conditions of the Creative Commons Attribution (CC BY) license (https://creativecommons.org/licenses/by/4.0/).