Abstract
One of the reasons why people hold anti-immigration attitudes is the fear that immigrants “rob jobs” of natives and decrease wages. However, academic literature finds that this is not the case. Nevertheless, in various countries, people still tend to oppose immigration. Opposition to immigration was particularly high in Turkey in the early 2000s, where almost half of the respondents to the Turkish part of the European Social Survey reported they would prefer to allow no immigrants into Turkey. This is although immigration to Turkey is very low. Turkey is becoming an important destination country as conflicts in neighboring countries force many people to flee. Therefore, understanding the opposition to immigration in Turkey is crucial for managing age immigration flows efficiently. For this purpose, we investigate the determinants of attitudes towards immigration in Turkey using the European Social Survey and Turkish population census data. The findings of the ordered probit model reveal that Turkish people tend to hold more negative attitudes towards immigration where the regional share of immigrants is higher. The little chance of contact with immigrants in Turkey through a lower share of immigrants compared to other European countries seems to influence natives’ pro-immigrant attitudes negatively.
1. Introduction
The literature on how attitudes towards immigrants differ across different types of people and how they are affected by people’s economic and socio-psychological circumstances is vast and spans various disciplines [1,2]. For example, economic theories suggest that labor market competition is one of the reasons why people oppose immigration, given the common assumption that immigrants compete for jobs with natives and consequently decrease wages [3,4]. In contrast, contact-type theories start from the idea that people tend to categorize themselves into groups: their own group and others (for example, immigrants) and evaluate their in-groups positively and out-groups negatively [5]. In this context, an increasing amount of (positive) personal contact between natives and immigrants would reduce perceived group differences and, therefore, anti-immigration attitudes [1,6,7]. Due to difficulties in measuring contact and lack of available data, one of the main variables used in the literature as a proxy for contact is the share of immigrants in the local area [8,9,10,11]. The assumption is that a larger presence of immigrants may mean more competition for jobs or scarce resources (which should have a negative effect on attitudes to immigrants) but also higher chances of contact (which should have a positive effect on attitudes to immigrants).
Most of the empirical literature on attitudes towards immigrants focuses on western developed countries such as the US and European countries, where the share of immigrants in the population is 10% or more, and therefore contact is relatively likely. There is a lack of evidence for developing countries and for countries where the share of immigrants in the population is still low. For natives to perceive immigrants as a threat, immigrants need to be “visible”; in countries where immigration is low, personal contact with immigrants is unlikely, and therefore immigrants are expected to be less visible. Nevertheless, a negative portrait of immigrants in the media may significantly increase visibility, even of small minorities. As an alternative, people’s attitudes towards migrants may be based on (political) ideology, without the need for contact in order to form an opinion.
Focusing on the case of Turkey, this study aims to investigate if the size of the immigrant population has any effect on natives’ attitudes. A set of research questions are examined: (1) What is the relationship between demographic characteristics such as gender, age, education, unemployment status, income, and anti-immigration attitudes? (2) What is the relationship between feeling safe and anti-immigration attitudes? (3) Do attitudes differ by political ideology? (4) What is the relationship between trusting the legal system and these attitudes? (5) Do attitudes differ between people with different levels of media consumption? (6) What is the relationship between happiness and these attitudes? (7) Do attitudes differ depending on the types of immigrants, such as immigrants from the same race, different races, or from poorer non-European countries?
Six dependent variables are used as measures of attitudes toward immigration/immigrants based on the following survey questions:
- To what extent do you think Turkey should allow people of the same race or ethnic group as most Turkish people to come and live here?
- How about people of a different race or ethnic group from most Turkish people?
- How about people from the poorer countries outside Europe?
- Would you say it is generally bad or good for Turkey’s economy that people come to live here from other countries?
- Would you say that Turkey’s cultural life is generally undermined or enriched by people coming to live here from other countries?
- Is Turkey made a worse or a better place to live by people coming to live here from other countries?
These models are expected to shed some light on how Turkish people’s attitudes are shaped, what kind of factors influence their attitudes, and what concerns are important for this particular country.
Historically, Turkey has always had a low share of immigrants in comparison with the world average. According to the World Bank [12], the average share of immigrants in Turkey was about 2% of the population between 1990 and 2010, and this increased to (only) 3.8% in 2015 after the influx of Syrian refugees. First, immigration in Turkey in the earlier years of the republic (from the 1920s) was characterized by Ottoman returnees, who were mostly Turkish and Muslim people, as part of the nation-state building processes [13]. Apart from returnees, Turkey was not an immigration country until the late 1980s. Second, for many immigrants, Turkey was not a destination country but a transit. Yet, as crossing the European border is getting harder year by year, many immigrants are stuck in Turkey. Moreover, most immigrants into Turkey are asylum seekers or refugees such as Iraqi, Afghan, Syrian, and Pakistani people who fled to escape political conflicts or war in their home countries. Refugees generally have weaker labor market endowments than economic immigrants [14]. This research is based on a survey which is conducted in 2004 when the share of immigrants in the country was rather low (about 2 percent) than the current situation (3.8 percent). There is a lack of relevant literature on Turkey that provides a systematic understanding of the attitudes of Turkish people, mostly due to the lack of data. When a lack of data prevents researchers from examining a certain issue, effort should still be made to shed some light on the issue, even if it means relying on relatively old data. In this respect, we aim to identify how the attitudes of Turkish people are shaped and what concerns are important from their perspectives. If we understand their motives in the past, we have a better chance of understanding their concerns in the future. Additionally, it should also be noted that the characteristics of recent immigrants are still similarities between the past and now. Therefore, we may expect the determinants of attitudes of natives to be similar over time, as they face similar types of immigrants.
Our study adds to the literature on anti-immigration attitudes by providing a unique systematic empirical study of attitudes towards immigrants in a country (Turkey) where immigrants are few and much more likely to be refugees than in developed countries with a relatively higher level of immigration that has been studied up to now.
We find that the more immigrants in a given region, the lower the tolerance for potential new immigrants, even after including an extensive set of socio-economic and psychological controls. We also find that attitudes toward different race immigrants are more unfavorable than attitudes to immigrants from the same race and even from poorer countries. Additionally, a higher percentage of immigrants in a region is associated with a higher likelihood of people agreeing with the statement that immigrants make the country a worse place to live. Regarding economic concerns, in regions with high percentages of immigrants, Turkish people are more likely to agree with the statement that immigrants make the country’s economy worse. Finally, we couldn’t find any significant effect of the percentage of immigrants on agreements with statements about cultural life.
The structure of the paper is as follows: The next section introduces the relevant literature. Section 3 provides information on the data and descriptive statistics of our dependent and independent variables. The empirical model is presented in Section 4 and followed by a discussion of the findings of the empirical investigation in Section 5. Finally, Section 6 summarizes and concludes the paper.
2. Relevant Literature
By drawing on theoretical perspectives, two contrasting theories aim at explaining natives’ attitudes to immigration: contact theory and threat theory (Kaufmann and Harris, 2015). Contact theory suggests that positive intergroup contacts reduce prejudice and enhance mutual perspectives [6]. Accordingly, increased contact with immigrants reduces anti-immigrant attitudes through acquaintanceship. Escandell and Ceobanu [9] test the hypothesis of contact theory and suggest that regions with a larger share of immigrants do not display significantly higher levels of exclusionary attitudes towards immigrants in the case of Spain. Again, for Germany, Fertig and Schmidt [15] find that a low immigrant share is associated with more negative attitudes; this might be explained by the contact hypothesis, as suggested by Escandell and Ceobanu [9], which implies that more acquaintanceships and friendships the lower anti-immigration sentiments.
In contrast to contact theory, threat or conflict theory argues that the presence of minorities increases anxiety among majority members [6]. Majority members become hostile toward minority groups because of the perception of minority threat over national own resources [16]. Craig and Richeson’s study [17] suggests that larger shares of minorities are perceived as a threat by white Americans.
Assuming self-interest and utility maximization behavior, one might expect that facing a lower wage level or the possibility of falling into unemployment may increase anti-immigration attitudes as a result of unwanted labor market competition [18,19]. Research shows that individuals who are socio-economically disadvantaged hold more anti-immigration attitudes [20,21] since a change in the size and the composition of the labor force in the host country as a result of an influx of immigrants could give rise to downward pressure on the wages of particular skill groups. Scheve and Slaughter [19] investigated immigration-related policy preferences of individuals in the U.S. in the 1990s, finding that low-skill individuals prefer more restrictions to immigration than high-skill individuals. Similarly, Mayda [22] analyzed U.S. cross-national survey data for 1995−1997 and showed that the probability of reporting pro-immigration attitudes is positively associated with the skill (i.e., education) level of the respondents. Dustmann and Preston [23] also confirm this result in the case of the U.K. In a cross-country analysis, Gang, Rivera-Batiz, and Yun [24] find that natives who are more directly in competition with immigrants hold more anti-immigration attitudes. Facchini and Mayda [18] find that more educated individuals do not favor high-skill immigration, thus implying a role for the labor market competition channel. Moreover, richer natives favor skilled immigration, which suggests that taxpayers may also consider the possible financial burden of immigrants (skilled immigrants tend to pay more taxes and use fewer benefits from welfare states).
Related to the conflict theory, prejudices, taste-based discrimination, and cultural differences are also seen as determinants of attitudes toward immigrants or foreigners. Taste-based discrimination occurs when a group of individuals prefers a certain group over another based on tastes but not any economic rationale, as seen in xenophobia and racism [25]. Dustmann and Preston [23] suggest that anti-immigrant attitudes are mostly shaped by racial attitudes that include “attitudes towards inter-ethnic marriage, having a minority boss, and self-admitted prejudice against minorities” (p. 16). Similarly, Gang, Rivera-Batiz, and Yun [24] show that people who find the presence of another race disturbing tend to feel that immigrants are bad for the country. Dustmann and Preston [23] explain that prejudices against different ethnic groups or cultures “may be fuelled by a fear of loss of national characteristics or a taste for cultural homogeneity” (p. 2). Besides, the political orientation of individuals may influence their approach with regard to immigrants [21,26]. Whilst the right-wing people are characterized by more anti-immigration attitudes, the left-wing people seem more immigrant-friendly. However, voting behavior can also change depending on the number of immigrants in a given locality. For example, Halla, Wagner, and Zweimuller [26] find that the inflow of immigrants into a community significantly affects that community’s voting for a right-wing political party.
Threats to individual self-interest may not need to be real but need only be perceived [21]. It is such perceptions that might make it hard for the public to accept immigration [27]. Media in the host country may contribute to pro or anti-immigration attitudes. Saggar and Drean [28] underline the negative approach expressed by the media, such as failure to control, too large a number, people smuggling, and wasted resources, and note their role in shaping public attitudes towards immigrants. Racial profiling and anti-foreigner, xenophobic language in the media are likely to generate negative attitudes toward minorities in society [29].
All of the above studies rely on the comparison of shares of immigrants and attitudes across areas. However, it is possible that some natives who are intolerant to immigrants locate in areas with few immigrants, and some immigrants themselves may locate in areas with a more tolerant native population. This may cause an underestimation of the real effect of the share of immigrants on anti-immigration attitudes. The instrumental variable approach is one way used in the literature to avoid this potential simultaneity bias. Dustmann and Preston [30] suggest using the share of immigrants in larger regions as an instrument for the share of immigrants in small regions. This is because, within smaller areas, natives may select areas with lower shares of immigrants, while this relationship between chosen location and share of immigrants is much weaker at larger geographical levels. Markaki and Longhi [10] employ a similar strategy and find that a higher percentage of immigrants is associated with more anti-immigration attitudes. In our case, we already use large and heterogeneous areas, thus decreasing issues of endogeneity.
Western developed countries such as the US and European countries with more than 10% immigrants in population constitute the focus of the relevant literature. Developing countries and/or low-immigration countries are not widely investigated by this literature, with a few exceptions. As one of the recent exceptions, Igarashi & Nagayoshi [31] investigate a distinctive example of Japan where ethnic homogeneity belief is held, and ethnic diversity is quite low. This study highlights the differences between Japanese and Western European/North American societies for their immigrant history, ethnic homogeneity belief, and ethnic diversities that may differentiate attitudes towards immigrants. Using an experimental design, the authors found that Japanese respondents unexpectedly showed more negative attitudes towards immigration in a direct question than in a list experiment (also called the item-count technique) which is based on the number of opinions a participant agrees within a given list of opinions suggesting exaggeration of negative attitudes towards immigrants when answers are not anonymous.
Another example from Asia is given by Lee & Chou [32], who examine the attitudes of Hong Kongers toward Chinese immigrants from the Mainland. Three reasons for anti-immigrant sentiments are suggested: economic self-interest, psychological dispositions, and sociotropic concerns (e.g., group identity and threat perception). Negative attitudes toward immigrants are suggested to be significantly related to sociotropic concerns. Moreover, Kawasaki & Ikeda [33], using the sixth wave of the World Values Survey for nine Asian countries that are China, Hong Kong, Japan, Malaysia, Philippines, Singapore, South Korea, Taiwan, and Thailand, highlights that the stronger group identities are associated with more prejudice.
3. Data and Descriptive Statistics
For our analysis of anti-immigration attitudes, we use the European Social Survey (ESS) [34,35]. The ESS is a multi-country survey that has been conducted every two years since 2002 through face-to-face interviews with participants aged 15 years or over. The survey focuses on attitudes and behaviors. Turkey participated in the ESS only in Round 2 in 2004 and Round 4 in 2008.
Our main explanatory variable, the percentage of immigrants, comes from the 2000 population census provided by the Turkish Statistical Institute upon a formal request (no other suitable data source exists). Therefore, we use only Round 2 of the ESS, which is the round closest to the census year. After dropping observations with missing data, we end up with a cross-section sample of 1287 individual observations.
In all our analyses, we use sampling weights provided with the survey. These weights adjust for differential selection probabilities as specified by sample design, nonresponse, noncoverage, and sampling error related to the four post-stratification variables (gender, age, education, and geographical region), see Kaminska [36]. Therefore, to generate nationally representative estimates, we created analysis weight as guided by Kaminska [37] using the Stata svy command. Hence, all descriptive statistics and regressions use this weight.
3.1. Dependent Variables
Our first three dependent variables related to the race and origin of immigrants, asking (1) “To what extent do you think Turkey should allow people of the same race or ethnic group as most Turkish people to come and live here?”; (2) “How about people of a different race or ethnic group from most Turkish people?”; and (3) “How about people from the poorer countries outside Europe?”. The response categories are 1: allow many to come and live here, 2: allow some, 3: allow a few, and 4: allow none. Summary statistics are shown in Table 1, and the distributions are shown in Figure 1.

Table 1.
Summary statistics of the dependent variables.
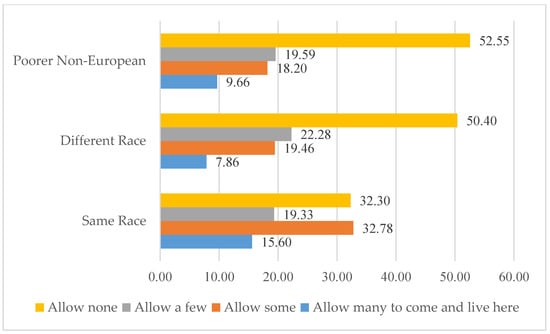
Figure 1.
Distribution of survey answers for questions about allowing more immigrants, weighted. Source: Author’s calculation based on ESS (Round 2).
Turkish people tend to report anti-immigrant attitudes, even of those immigrants from the same race as natives, as almost 33 percent of respondents said, “allow none.” The second question captures attitudes towards immigrants from different ethnic backgrounds. It is clear that Turkish people’s attitudes towards a different race are more negative in comparison with those against same-race immigrants. People in Turkey who would allow many immigrants from a different race are only 7.86 percent, while more than 50 percent of the sample responded that they would not allow any different race immigrant. Question 3 captures attitudes towards people from poorer countries. More than half the sample (about 53 percent) want no migration from poor countries.
Our three additional dependent variables measure more general views on the impact that immigrants have on the national economy, culture, and their overall effect on the country, asking: (4) “Would you say it is generally bad or good for Turkey’s economy that people come to live here from other countries?”, (5) “Would you say that Turkey’s cultural life is generally undermined or enriched by people coming to live here from other countries?”, and (6) “Is Turkey made a worse or a better place to live by people coming to live here from other countries?”. Answers are on an ordinal scale from 0, which stands for “immigrants are bad for the economy/undermine cultural life/make Turkey a worse place to live”, to 10, which stands for “immigrants are good for the economy/enrich cultural life/make Turkey a better place to live.” To have a more balanced structure of the categories we group categories 0 to 2 (strong negative attitudes: immigrants are bad for the economy/culture/place); categories 3 to 6 (weak attitudes: neither good nor bad); and categories 7 to 10 (strong positive attitudes: immigrants are good for the economy/culture/place).
Respondents tend to say that immigration is bad for the economy: only about 22 percent of people answered that immigration is good for the economy. It is seen from the middle part of Figure 2 that a considerable number of people (about half of the sample) felt threatened in terms of their culture. The difference between the two extreme points, culturally enriched and undermined, is remarkable: only 20 percent of people stated that immigration enriched culture, although almost 49 percent answered that cultural life is undermined by immigrants. As seen from the bottom of Figure 2, similar to the previous questions, people tended to think immigration makes the country a worse place to live. At the positive end of the categories, about 19 percent of the sample thought that immigration made Turkey a better place to live in.
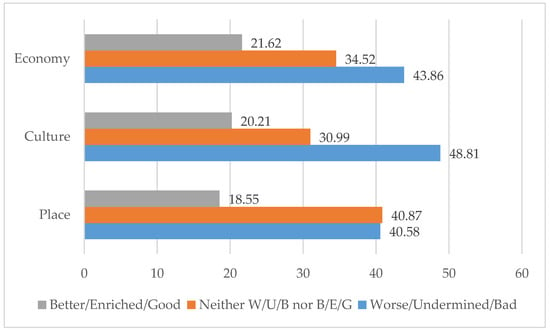
Figure 2.
Distribution of survey answers for questions about the impact of immigrants, weighted. Source: Author’s calculation based on ESS (Round 2). Note: Given percentages present the share of each answer category (e.g., allow many, allow some, allow a few, allow none) for each question. Therefore, the sum of percentages on each row is 100 percent.
3.2. Explanatory Variables
Our main explanatory variable is the percentage of immigrants over the total population in the region. The analysis includes the 12 regions of Turkey, which are quite large geographically (each region covers about six provinces). Information on the percentage of immigrants across regions is from the population census 2000, which is conducted by the Turkish Statistical Institute. We define immigrants as individuals who were born outside the country. The descriptive statistics in Table 2 suggest that there is a reasonable variation in the percentage of immigrants across areas, despite the large geographical areas. While the mean percentage of immigrants is only 1.8%, this varies across regions from 0.2% in Southeast to 5.1% in Eastern Marmara.
Table 2.
Descriptive statistics of independent variables. Source: Author’s calculation based on ESS (Round 2).
In all models, we control for a standard set of socio-economic and demographic characteristics such as the age of respondents, a male dummy, years of education, and a dummy for those who are unemployed. We also control for household income using three categories: low income (up to 700 TL/monthly), mid-income (between 701–1200 TL/monthly), and high income (more than 1200 TL/monthly). Models including these control variables constitute our baseline specification.
Attitudes towards immigration might be influenced by several characteristics. In this study, we want to include as many variables as the data allows to explain these behaviors. We include additional variables in the second part of the analysis that are thought to be associated with these attitudes. The five additional variables are included in the second part of the political analysis orientation, media usage (reading newspapers, watching TV), feeling safe, trust in the legal system, and happiness.
Media nowadays is an important tool to influence individuals’ attitudes, as suggested by Saggar and Drean [28], for example. In the case of the UK, authors highlight the effect of the media on public opinion and underline the language usually used by the media: danger, control numbers, wasted resources, etc. We, therefore, consider media as an explanatory variable that might explain our dependent variables. The ESS survey has two media-related questions that are used to measure the level of media consumption and exposure: (1) on an average weekday, how much of your time watching television is spent watching news or programs about politics and current affairs? and (2) on an average weekday how much of this time (i.e., time spent in reading newspapers) is spent reading about politics and current affairs?. Answers to these questions have eight categories in ascending order, starting from 0: no time at all to 7: more than 3 h. For simplicity, we made three broader categories for these variables from 0 representing low TV/newspaper exposure (i.e., up to half an hour spent on TV/newspapers) to two representing high TV/newspaper exposure being more than an hour spent on TV/newspapers as presented in Figure 3. The descriptive statistics in Figure 3 and Table 2 suggest high media consumption via TV but a much lower consumption via newspapers.
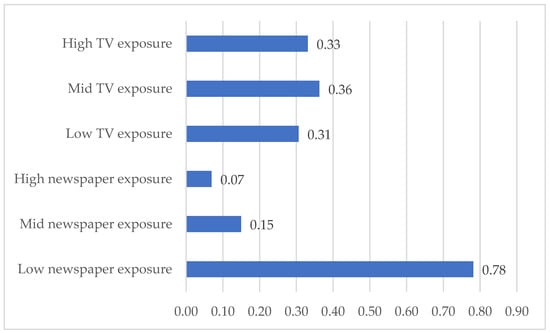
Figure 3.
Weighted proportions of media exposure.
Political orientation is another characteristic that might be related to pro or anti-immigrant attitudes. Survey data have information on individuals’ political placements, which is where individuals politically place themselves on a scale from 0 to 10, where 0 means left and 10 means right. Those who placed themselves in categories below five are grouped in the left wing and coded as 1. Others who placed themselves in category 5 or above are coded as 0. Table 2 suggests that a relatively small proportion of respondents (only 17%) lean towards the left wing.
As suggested by the literature, a belief in a relationship between crime and immigration is an important factor in attitude formation. Therefore, we use two survey questions to measure individuals’ safety concerns: (1) how safe do you—or would you—feel walking alone in this area after dark? and (2) how much do you personally trust the legal system? Question 1, referring to the variable feeling safe, originally four categories, from 1 being very safe to 4 being very unsafe; and Question 2, referring to the variable trust in the legal system, has 11 categories, from 0 being no trust at all to 10 being complete trust. To simplify the presentation and to avoid very few observations in some categories, we dichotomized those variables with dummy variables equal to 1 if a respondent answered categories 1 or 2 for Question 1 and above the 5th category for Question 2. Values of 1 indicate that the respondent feels safe and/or trusts the legal system, and 0 otherwise.
Finally, as suggested by Lyubomirsky, King, and Diener [37], happy individuals are more optimistic, experience positive moods more often, and judge others in a more favorable way. We, therefore, expect that happy people would be more supportive of immigration and are more likely to have pro-immigrant sentiments. ESS has a question that directly asks, ‘how happy are you.’ The answer consists of 11 categories from 0, which is extremely unhappy, to 10, which is extremely happy. To avoid categories with few observations and to make the presentation easier, we dichotomized this variable and recorded the answer categories from 6 to 11 as 1 being happy, and the remaining categories as 0 being unhappy. Summary statistics of the explanatory variables are presented in Table 2.
As mentioned, the analysis starts with the baseline controls that are explained above. Later, additional explanatory variables will be included. One might think that these variables might be related to each other in a way that might cause a biased estimate through the multicollinearity problem. To consider this possibility, we do not include variables such as safety, happiness, etc., in the first part of our investigation, but we include them gradually to see if the results change remarkably. We also checked the correlation coefficients among all explanatory variables to check for possible multicollinearity. The correlations are not that high (e.g., all below 0.2) to worry about multicollinearity. Pairwise correlations are not shown here but are available upon request.
4. Empirical Model
To analyze the attitudes of natives towards immigrants, a series of ordered probit models as specified in Equation (1) below is estimated. Let Ai be the outcome we observe about preferences towards immigration by native individual i (e.g., allow none, allow some immigrants, etc.). When selecting among categorical answers, the respondent will evaluate her/his level of anti-immigration sentiments on what could be considered a continuous scale and select the category that best approximates her/his personal (continuous) evaluation. The stated categorical preference can therefore be interpreted as the outcome of an underlying latent continuous variable Ai*, which measures the continuous level of anti-immigration preferences.
The possible outcomes for the first three dependent variables range from 1: allow many immigrants to 4: allow none. For the other three dependent variables, we have three possible outcomes ranging from 1: immigrants make the country a worse place/undermine cultural life/are bad for the national economy; to 3: immigrants make the country a better place/enrich cultural life/are good for the national economy.
We assume that the latent variable Ai* is determined by the following equation:
where Xi includes individual’s i socioeconomic and demographic characteristics. The key parameter of interest is β1, which denotes how the regional percentage share of immigrants (IMr) correlates with natives’ attitudes towards immigrants. SJi denotes the subjective judgments of individuals about feeling safe, trust in the legal system, political orientation, happiness, etc. εi is a zero mean random error term reflecting unobserved factors. All variables in the model are for 2004 except the share of immigrants, which is for 2000.
Ai, the observed ordinal variable, takes on values 1 through 3 or 4 depending on the question as follows:
where µ are the cut-off points and k = 3 or 4 depending on the question (Liao, 1994). Here we investigate the likelihood of a particular response to the questions on anti-immigration attitudes.
Bearing in mind the potential problems of endogeneity, we reduce the possible bias in two ways. First, we use percentages of immigrants across regions in 2000 to predict anti-immigration attitudes in 2004 since the current attitudes of natives are less likely to be correlated with the past than the current share of immigrants in the region. Secondly, using larger regions instead of small regions is likely to reduce the bias. Even though some individuals in neighborhoods or provinces may “have a taste” for homogeneous ethnic composition and a more anti-immigrant stance [23] that may push immigrants away from those places, this is unlikely to be the case in large geographic units [30]. In other words, if we consider neighborhoods as the unit of study, for example, the results might be biased since natives who desire a more homogeneous population can choose to live in neighborhoods where there are no/a few immigrants, and immigrants can also choose to live in neighborhoods where natives hold positive sentiments towards them. Large geographic units are unlikely to be so homogenous.
5. Empirical Findings
In this section, we report estimation results for our ordered probit models of attitudes towards immigration. There are six dependent variables in total. Each dependent variable is used in two specifications: a baseline specification and a specification with additional control variables.
Table 3 shows the average marginal effects of the regional share of immigrants on the attitudes towards the same race immigrants. In the categories of many and some, the signs of the coefficients are negative and positive for the last two categories. This means that in regions with higher percentages of immigrants, respondents are less likely to select “allow many” and “allow some” immigrants to come and live in this country and have a higher probability of selecting “allow a few” and “allow none.” This finding is statistically significant at a 5 percent significance level. The inclusion of additional controls does not change these findings.
Table 3.
Should Turkey allow people of the same race or ethnic group as most Turkish people to come and live here?
The results also suggest that attitudes do not vary across people with different exposure to the media (either TV or newspapers) and that the media does not seem to have a relevant effect on attitudes. However, people whose political views lean toward the left appear to be much more favorable to immigration than those who lean toward the right.
The marginal effects of attitudes towards immigrants from a different race or ethnicity (Table 4) show that the probability of reporting “allow none of the different race immigrants to live in this country” is larger than the respective probability for same-race immigrants (Table 3). This suggests that natives are more likely to accept receiving immigrants from the same race compared to immigrants from different races, which is statistically significant at a 1 percent level.
Table 4.
Should Turkey allow people of a different race or ethnic group from most Turkish people?
Also, for the question about allowing immigrants from a different race, there seems to be no difference in attitudes depending on media consumption, while people with political views leaning more to the left are more likely to be in favor of this sort of immigration. Again, however, attitudes appear to be more in favor of immigration when immigrants are of the same race as Turkish people.
Similar results are found in the model considering attitudes towards immigrants from poorer non-European countries in terms of the impact of the share of immigrants in the region, as presented in Table 5. Regions with higher percentages of immigrants are associated with a higher probability of reporting allow none by 4.8 percentage points which is larger than the respective probability for same-race immigrants. Once again, people with left political ideology are more likely to favor immigration, as are people who have high exposure to newspapers, with marginal effects slightly larger than for political ideology.
Table 5.
Should Turkey allow people from the poorer countries outside Europe?
Overall, the results suggest that the relationship between the percentage of immigrants in a region and anti-immigration attitudes is unlikely to be related to characteristics of the population in a certain region since the inclusion of additional explanatory variables reflecting media consumption, political ideology, and other factors, does not affect the coefficients of the percentage of immigrants. In addition, people’s attitudes to immigration vary depending on who the group of potential immigrants is. Although the pattern is consistent across Table 3, Table 4 and Table 5, people’s attitudes to immigration appear to be slightly more favorable when immigrants are from the same race as Turkish people, and this is consistent across all characteristics, as well as for the percentage of immigrants. This confirms that part of the reason for anti-immigration attitudes is related to racial bias or socio-cultural considerations rather than economic considerations (compare Table 3 and Table 4). Economic considerations are still part of the reason since people’s attitudes toward immigrants from poorer countries tend to be slightly more negative (compare Table 3 and Table 5).
The next three tables present our findings on the attitudes of natives on the general perceived impact of immigrants to Turkey. In Table 6, we investigate individual attitudes on how immigrants affect Turkey as a place to live. The findings reveal that a higher percentage of immigrants in a region is associated with a higher likelihood people selecting the option that immigrants make the country a worse place to live. The opposite applies to people who lean towards left-wing opinions, while, again, there does not seem to be a relevant impact of media consumption.
Table 6.
Is Turkey made a worse or a better place to live by people coming to live here from other countries?
Economic concerns seem to have an important impact on natives’ attitudes toward immigrants. The findings in Table 7 show a statistically significant impact on the percentage of immigrants: in regions with high percentages of immigrants, Turkish people are more likely to report that immigrants make the country’s economy worse. Hence, we can say that immigrants may be blamed by natives for economic problems in Turkey. In this case, there is no difference between people with different political ideologies since the marginal effects for the variable “Left” are not statistically significant. This suggests that positive attitudes toward immigration may be based mostly on ideology, even when people think that immigrants may not bring economic benefits. Once again, there seem to be no differences across people with different exposure to the media.
Table 7.
Would you say it is generally bad or good for Turkey’s economy that people come to live here from other countries?
In the results of the specification considering the cultural dimension of attitudes, we could not find any statistically significant impact on the percentage of immigrants (Table 8), although the sign of the coefficient for the first category (i.e., undermined) is positive and largest amongst other categories. One can therefore think that there is no difference in feeling their culture threatened by immigrants between people living in regions with higher percentages of immigrants.
Table 8.
Would you say that Turkey’s cultural life is generally undermined or enriched by people coming to live here from other countries?
Political ideology remains important in this specification, suggesting that those people who hold more left-wing political views are more likely to think that immigrants are positive for the culture of the country, despite being unsure about their economic impact (Table 7). Perhaps surprisingly, also those (few) people with high exposure to newspapers are more likely to consider that immigration has a positive impact on culture. These results are not in contrast with the average negative anti-immigration attitudes of the whole country since those who hold left-wing political views and those who are high consumers of newspapers are only small proportions of the overall population (Table 2).
To summarize, our findings suggest that the percentage of immigrants in the region has a role in shaping attitudes towards immigrants and immigration. The presence of immigrants in Turkey produces anti-immigrant sentiments. However, people with left-wing political ideologies tend to have significantly more positive views of immigration, also conditional on the region where they live. Attitudes tend to be more negative when migrants are of a different race and when they come from poorer countries outside Europe.
6. Conclusions
In this investigation, the aim was to assess natives’ attitudes towards immigrants by using attitudinal survey data from the 2004 European Social Survey in the context of Turkey. By estimating ordered probit equations of the likelihood that people had negative attitudes towards immigrants, this paper provided an analysis of the correlation between a set of explanatory variables and attitudes towards immigrants. Besides the regional share of immigrants as an independent variable of interest, age, education level, income level, political orientation, trust in the legal system, newspaper exposure, and safety were found to be significant factors affecting our dependent variables on attitudes toward immigration/immigrants.
According to the European Social Survey, the preference of almost half of the Turkish population is not to allow any immigrants from different races to live in Turkey; this is remarkably negative in comparison with other countries. We seek out which factors affect these negative attitudes towards immigrants.
The first finding to emerge from our analysis is that a higher percentage of immigrants in the region is correlated to an anti-immigrant stance amongst natives. Our results suggest that both economic and non-economic factors are important in explaining attitudes. Together with a baseline specification that includes a standard set of socio-economic explanatory variables, we extend model specification, including variables such as safety, political orientation, trust in the legal system, media exposure, and happiness that are likely to influence attitudes towards immigrants/immigration. Nevertheless, the inclusion of additional explanatory variables did not change the sign and magnitude of the coefficient of the variable of interest (i.e., the regional percentage of immigrants).
It should be noted that people with high newspaper exposure have a higher probability of reporting that they prefer to allow many poorer non-European immigrants to come and live in this country, while it decreases the probability that they prefer to allow none. Besides, people with high newspaper exposure also have a lower probability of reporting that “Turkey’s cultural life is generally undermined by people coming to live here from other countries”, which is statistically significant at a 5 percent significance level.
In contrast to the case of England [30] and Spain [9], which found modest or no effect of the share of immigrants, our findings suggest that immigrant group size has a significant impact on explaining anti-immigrant attitudes of Turkish people. Thereby, the little chance of contact with immigrants in Turkey through a lower share of immigrants compared to other European countries seems to influence natives’ pro-immigrant behavior negatively.
Although we find some significant coefficients in the economic indicators, such as income level, it is hard to say that they are consistent across specifications. Hence, our research suggests that natives’ anti-immigrant preferences are likely to stem from mostly non-economic factors than economic factors. This means that attitudes may not be very responsive to economic interventions. From a policy implications point of view, this might be an important factor to consider.
It’s worth emphasizing a few limitations of this paper. First, our empirical analysis is based on cross-section of data for 2004 data on attitudes. Therefore, it may not reflect change over time. The Syrian influx into the country is not included in the investigation because of data restrictions. When considering the high volume of these refugees, the attitudes of Turkish people might be affected in a different way than what we currently find, though the characteristics of these immigrants are similar to the previous ones. However, this attempt that examines the attitude of the Turkish people still provides a systematic and valuable contribution to the relevant literature in this country.
Author Contributions
Conceptualization, E.K.K. and S.L.; methodology, E.K.K. and S.L.; software, E.K.K. and S.L.; validation, E.K.K. and S.L.; formal analysis, E.K.K. and S.L.; investigation, E.K.K. and S.L.; resources, E.K.K.; data curation, E.K.K.; writing—original draft preparation, E.K.K. and S.L.; writing—review and editing, E.K.K. and S.L.; visualization, E.K.K. and S.L.; supervision, S.L. All authors have read and agreed to the published version of the manuscript.
Funding
This research received no external funding.
Institutional Review Board Statement
Not applicable.
Informed Consent Statement
Not applicable.
Data Availability Statement
In this study European Social Survey (ESS) Round 2 data for Turkey was used. This data set is publicly available through a registration process from https://www.europeansocialsurvey.org/data/ (accessed on 10 September 2022). Additionally, as the main independent variable, the percentage of immigrants across regions, comes from the 2000 population census data provided by the Turkish Statistical Institute upon a formal request.
Acknowledgments
The paper is based on a chapter of Esra Karapınar Kocağ’s PhD dissertation. Simonetta Longhi as co-author contributed substantially to the development of this paper. Esra Karapınar Kocağ likes to express her appreciation to the following people for their generous support during her PhD candidature: Professor Uma Kambhampati, Associate Professor Christian (Andi) Nygaard, Associate Professor Costanza Biavaschi, Associate Professor Vivien Burrows, and Professor Simonetta Longhi.
Conflicts of Interest
The authors declare no conflict of interest.
References
- Pettigrew, T.F.; Tropp, L.R. How does intergroup contact reduce prejudice? Meta-analytic tests of three mediators. Eur. J. Soc. Psychol. 2008, 38, 922–934. [Google Scholar] [CrossRef]
- Zhou, S.; Page-Gould, E.; Aron, A.; Moyer, A.; Hewstone, M. The Extended Contact Hypothesis: A Meta-Analysis on 20 Years of Research. Personal. Soc. Psychol. Rev. 2019, 23, 132–160. [Google Scholar] [CrossRef]
- Dustmann, C.; Preston, I. Is Immigration Good or Bad for the Economy? Analysis of Attitudinal Responses. CReAM Discussion Paper No 06/04. 2004. Available online: https://discovery.ucl.ac.uk/id/eprint/14318/1/14318.pdf (accessed on 16 March 2018).
- Dustmann, C.; Preston, I. Is Immigration Good or Bad for the Economy? Analysis of Attitudinal Responses. In The Economics of Immigration and Social Diversity; Research in Labour Economics; Polachek, S.W., Chiswick, C., Rapoport, H., Eds.; Emerald Group Publishing Limited: Bingley, UK, 2006; Volume 24, pp. 3–34. [Google Scholar] [CrossRef]
- Kahneman, D. Thinking, Fast and Slow; Penguin: London, UK, 2012. [Google Scholar]
- Kaufmann, E.; Harris, G. “White Flight” or Positive Contact? Local Diversity and Attitudes to Immigration in Britain. Comp. Political Stud. 2015, 48, 1563–1590. [Google Scholar] [CrossRef]
- Pettigrew, T.F.; Tropp, L.R. A meta-analytic test of intergroup contact theory. J. Personal. Soc. Psychol. 2006, 90, 751–783. [Google Scholar] [CrossRef]
- Krueger, A.B.; Pischke, J.S. A statistical analysis of crime against foreigners in unified Germany. J. Hum. Resour. 1997, 32, 182–209. [Google Scholar] [CrossRef]
- Escandell, X.; Ceobanu, A.M. When contact with immigrants matters: Threat, interethnic attitudes and foreigner exclusionism in Spain’s Comunidades Autónomas. Ethn. Racial Stud. 2009, 32, 44–69. [Google Scholar] [CrossRef]
- Markaki, Y.; Longhi, S. What determines attitudes to immigration in European countries? An analysis at the regional level. Migr. Stud. 2013, 1, 311–337. [Google Scholar] [CrossRef]
- Pottie-Sherman, Y.; Wilkes, R. Does Size Really Matter? On the Relationship between Immigrant Group Size and Anti-Immigrant Prejudice. Int. Migr. Rev. 2017, 51, 218–250. [Google Scholar] [CrossRef]
- World Bank. World Development Indicators. Available online: https://databank.worldbank.org/reports.aspx?source=2&series=SM.POP.TOTL.ZS&country= (accessed on 14 April 2020).
- Icduygu, A.; Sirkeci, I. Cumhuriyet Donemi Turkiye’sinde Goc Hareketleri. Istanbul75 Yilda Koylerden Sehirlere. 1999. Available online: http://works.bepress.com/sirkeci/17 (accessed on 25 February 2015).
- Bauer, T.K.; Lofstrom, M.; Zimmermann, K.F. Immigration Policy, Assimilation of Immigrants and Natives’ Sentiments towards Immigrants: Evidence from 12 OECD-Countries; IZA Discussion Paper No. 187; Institute of Labor Economics (IZA): Bonn, Germany, 2000; Available online: http://ftp.iza.org/dp187.pdf (accessed on 3 September 2017).
- Fertig, M.; Schmidt, C.M. Attitudes towards foreigners and Jews in Germany: Identifying the determinants of xenophobia in a large opinion survey. Rev. Econ. Household 2011, 9, 99–128. [Google Scholar] [CrossRef]
- McLaren, L.M. Anti-Immigrant Prejudice in Europe: Contact, Threat Perception, and Preferences for the Exclusion of Migrants. Soc. Forces 2003, 81, 909–936. [Google Scholar] [CrossRef]
- Craig, M.A.; Richeson, J.A. Majority No More? The Influence of Neighbourhood Racial Diversity and Salient National Population Changes on Whites’ Perceptions of Racial Discrimination. Russell Sage Found. J. Soc. Sci. 2018, 4, 141–157. [Google Scholar]
- Facchini, G.; Mayda, A.M. Individual attitudes towards skilled migration: An empirical analysis across countries. World Econ. 2012, 35, 183–196. [Google Scholar] [CrossRef]
- Scheve, K.F.; Slaughter, M.J. Labour Market Competition and Individual Preferences over Immigration Policy. Rev. Econ. Stat. 2001, 83, 133–145. [Google Scholar] [CrossRef]
- Schneider, S.L. Anti-Immigrant Attitudes in Europe: Outgroup Size and Perceived Ethnic Threat. Eur. Sociol. Rev. 2008, 24, 53–67. [Google Scholar] [CrossRef]
- Raijman, R.; Semyonov, M.; Schmidt, P. Do Foreigners Deserve Rights? Determinants of Public Views towards Foreigners in Germany and Israel. Eur. Sociol. Rev. 2003, 19, 379–392. [Google Scholar] [CrossRef]
- Mayda, A.M. Who is Against Immigration? A Cross-country Investigation of Individual Attitudes toward Immigrants. Rev. Econ. Stat. 2006, 88, 510–530. [Google Scholar] [CrossRef]
- Dustmann, C.; Preston, I.P. Racial and Economic Factors in Attitudes to Immigration. B.E. J. Econ. Anal. Policy 2007, 7, 62. Available online: http://www.bepress.com/bejeap/vol7/iss1/art62 (accessed on 14 October 2014).
- Gang, I.N.; Rivera-Batiz, F.; Yun, M.S. Economic Strain, Ethnic Concentration and Attitudes Towards Foreigners in the European Union; IZA Discussion Paper; Institute of Labor Economics (IZA): Bonn, Germany, 2002. [Google Scholar]
- Busetta, G.; Campolo, M.G.; Panarello, D. Immigrants and Italian labour market: Statistical or taste-based discrimination? Genus 2018, 74, 4. [Google Scholar] [CrossRef]
- Wilkes, R.; Guppy, N.; Farris, L. “No Thanks, We’re Full”: Individual Characteristics, National Context, and Changing Attitudes Toward Immigration. IMR 2008, 42, 302–329. [Google Scholar] [CrossRef]
- Halla, M.; Wagner, A.F.; Zweimuller, J. Immigration and voting for the far right. J. Eur. Econ. Assoc. 2017, 15, 1341–1385. [Google Scholar] [CrossRef]
- Saggar, S.; Drean, J. British Public Attitudes and Ethnic Minorities. Cabinet Office—Performance and Innovation Unit. 2001. Available online: http://webarchive.nationalarchives.gov.uk/+/http://www.cabinetoffice.gov.uk/upload/assets/www.cabinetoffice.gov.uk/strategy/british.pdf (accessed on 1 August 2020).
- Shrivastava, S. Boston Bombing, US Media and Its Anti-Foreigners Attitude. The World Reporter. 30 April 2013. Available online: http://www.theworldreporter.com/2013/04/boston-bombing-medias-anti-foreigners-attitude.html (accessed on 3 September 2017).
- Dustmann, C.; Preston, I. Attitudes to ethnic minorities, ethnic context and location decisions. Econ. J. 2001, 111, 353–373. [Google Scholar] [CrossRef]
- Igarashi, A.; Nagayoshi, K. Norms to be prejudiced: List experiments on attitudes towards immigrants in Japan. Soc. Sci. Res. 2022, 102, 102647. [Google Scholar] [CrossRef] [PubMed]
- Lee, S.; Chou, K. Explaining attitudes toward immigrants from Mainland China in Hong Kong. Asian Pac. Migr. J. 2018, 27, 273–298. [Google Scholar] [CrossRef]
- Kawasaki, R.K.; Ikeda, Y. Network analysis of attitudes towards immigrants in Asia. Appl. Netw. Sci. 2020, 5, 85. [Google Scholar] [CrossRef]
- European Social Survey European Research Infrastructure (ESS ERIC). ESS2—Integrated File, Edition 3.6 (Italy Not Included) [Data Set]. Sikt—Norwegian Agency for Shared Services in Education and Research. 2012. Available online: https://doi.org/10.21338/ESS2E03_6 (accessed on 1 December 2021).
- European Social Survey European Research Infrastructure (ESS ERIC). ESS2 Data Documentation. Sikt—Norwegian Agency for Shared Services in Education and Research. 2021. Available online: https://doi.org/10.21338/NSD-ESS2-2004 (accessed on 1 December 2021).
- Kaminska, O. Guide to Using Weights and Sample Design Indicators with ESS Data. 2020. Available online: http://www.europeansocialsurvey.org/docs/methodology/ESS_weighting_data_1_1.pdf (accessed on 16 December 2021).
- Lyubomirsky, S.; King, L.; Diener, E. The Benefits of Frequent Positive Affect: Does Happiness Lead to Success? Psychol. Bull. 2005, 131, 803–855. [Google Scholar] [CrossRef] [PubMed]
Publisher’s Note: MDPI stays neutral with regard to jurisdictional claims in published maps and institutional affiliations. |
© 2022 by the authors. Licensee MDPI, Basel, Switzerland. This article is an open access article distributed under the terms and conditions of the Creative Commons Attribution (CC BY) license (https://creativecommons.org/licenses/by/4.0/).