
Mitogenomes of Nine Asian Skipper Genera and Their Phylogenetic Position (Lepidoptera: Hesperiidae: Pyrginae)


Abstract
:Simple Summary
Abstract
1. Introduction
2. Materials and Methods
2.1. Sample Collection and Genomic DNA Extraction
2.2. Bioinformatics Analyses
2.3. Sequence Read Archive (SRA) Data Extraction
2.4. Phylogenetic Analysis
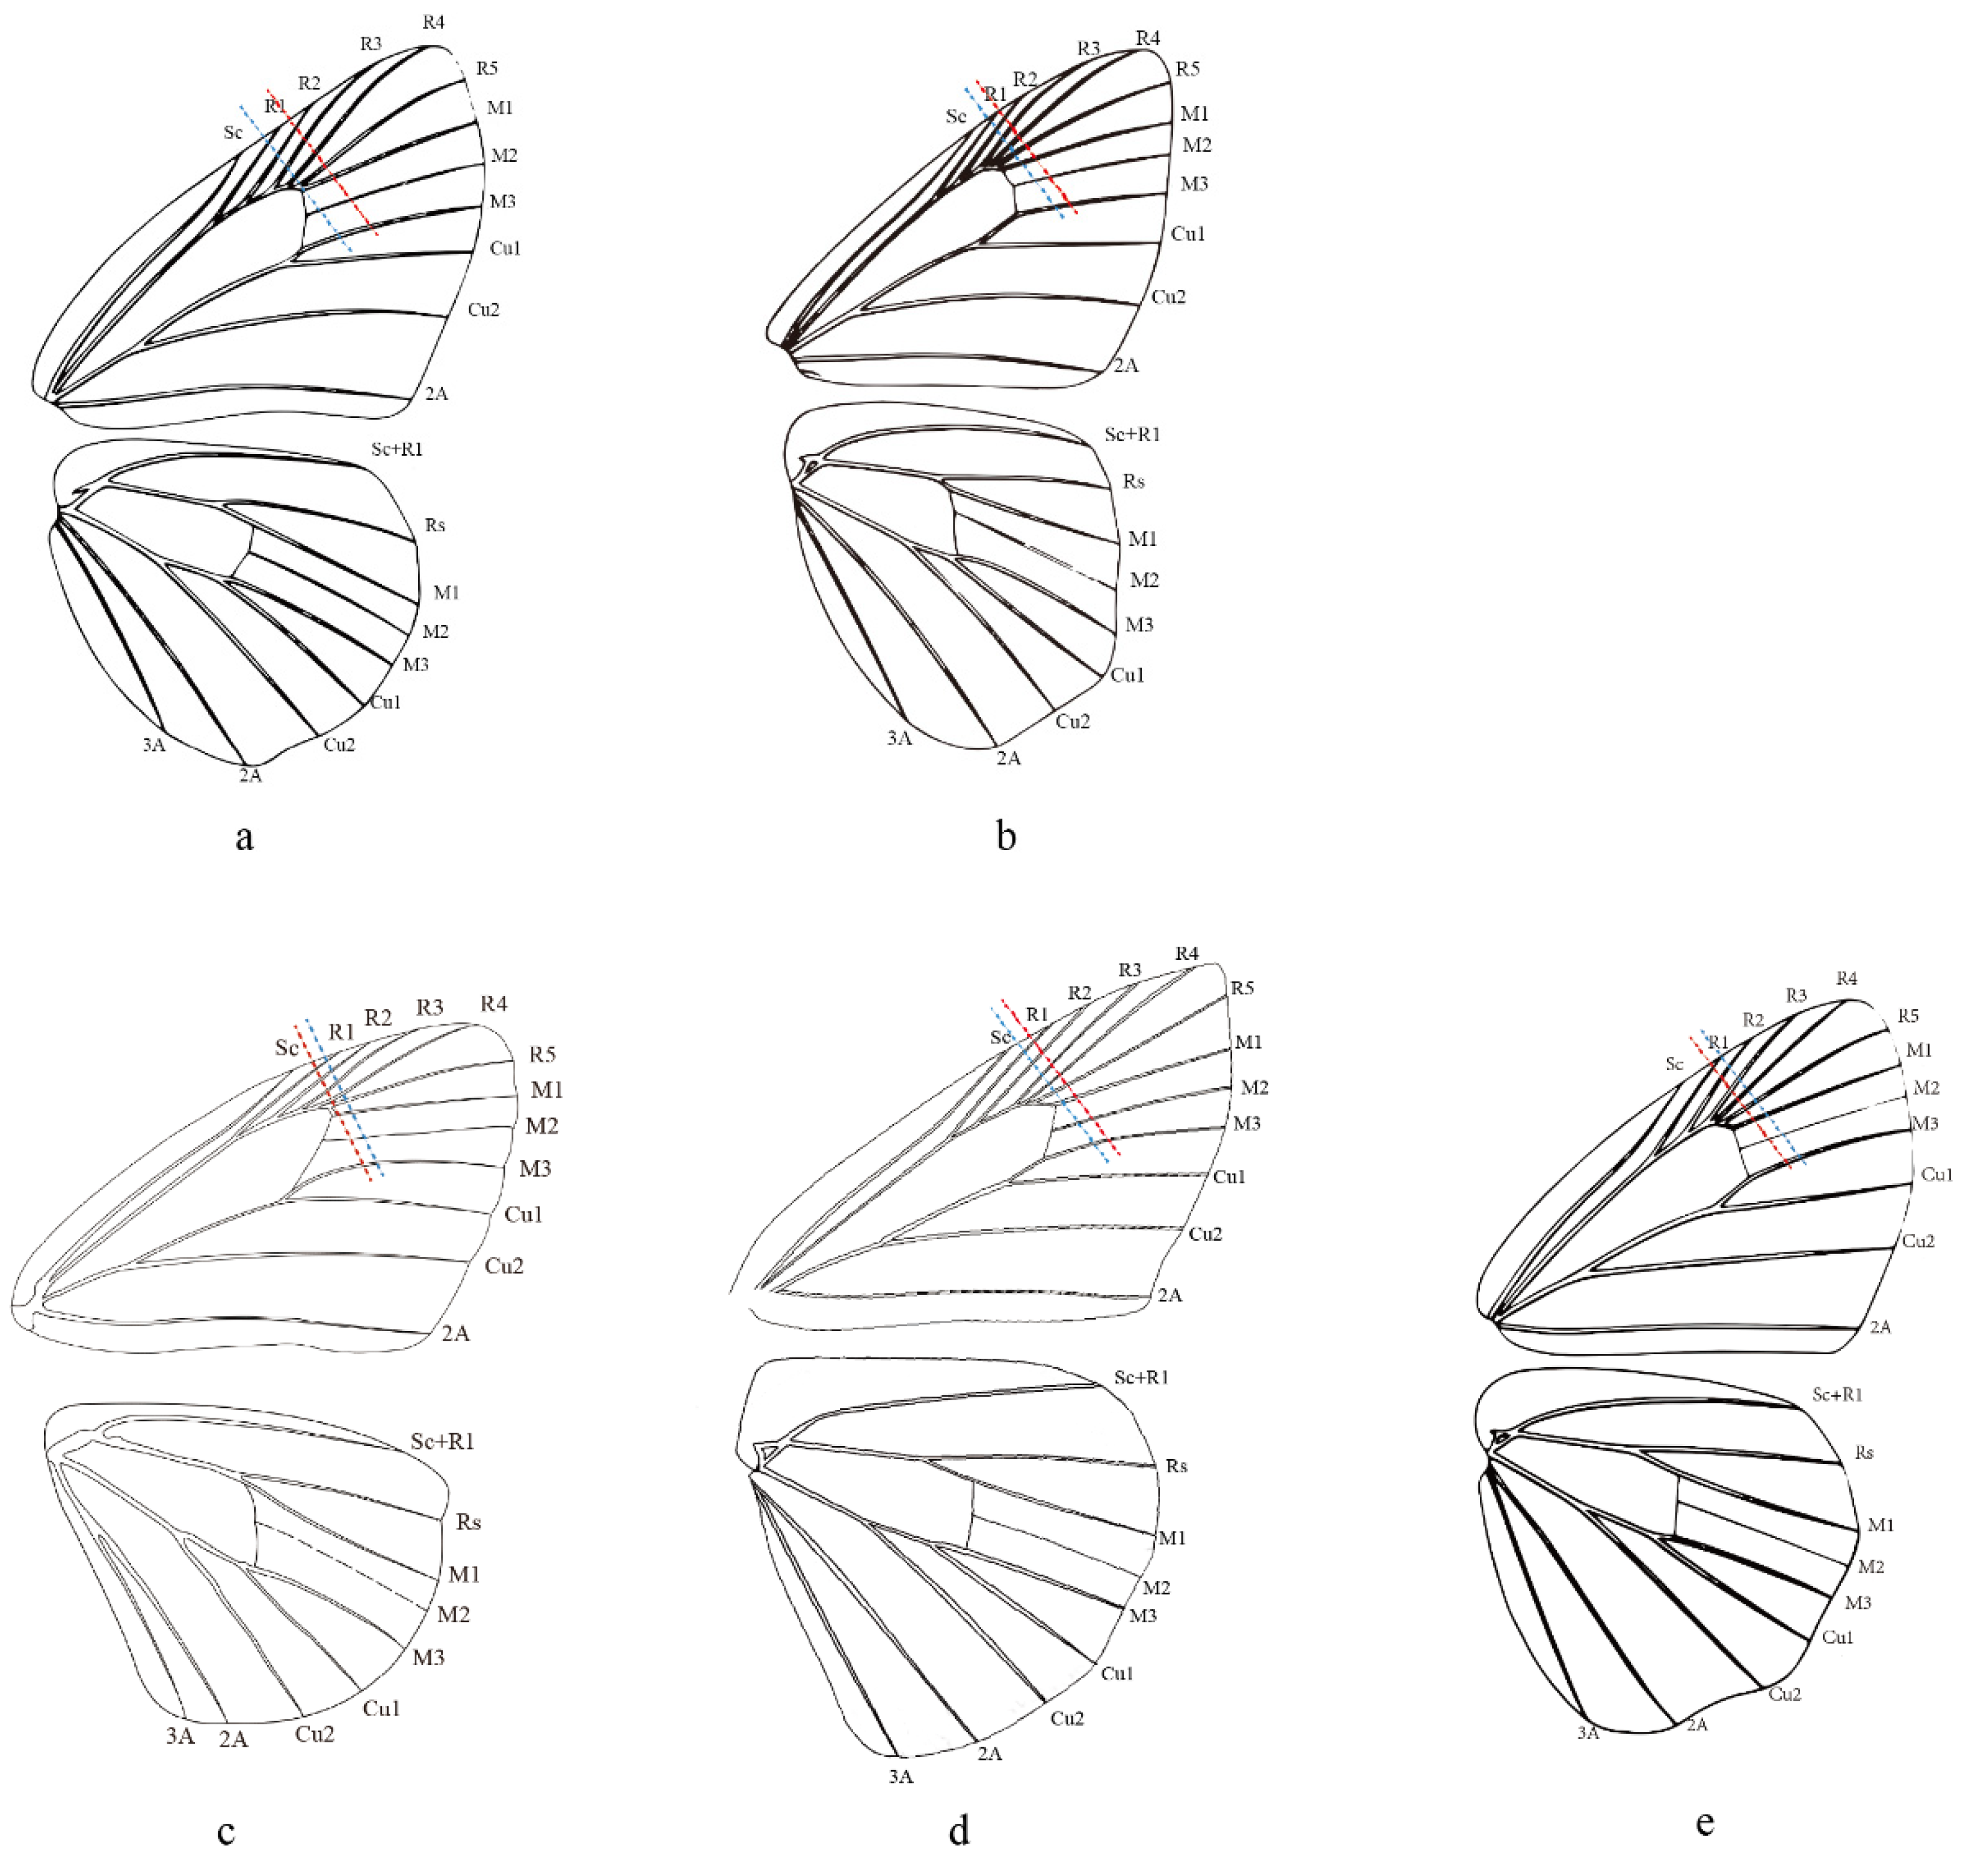
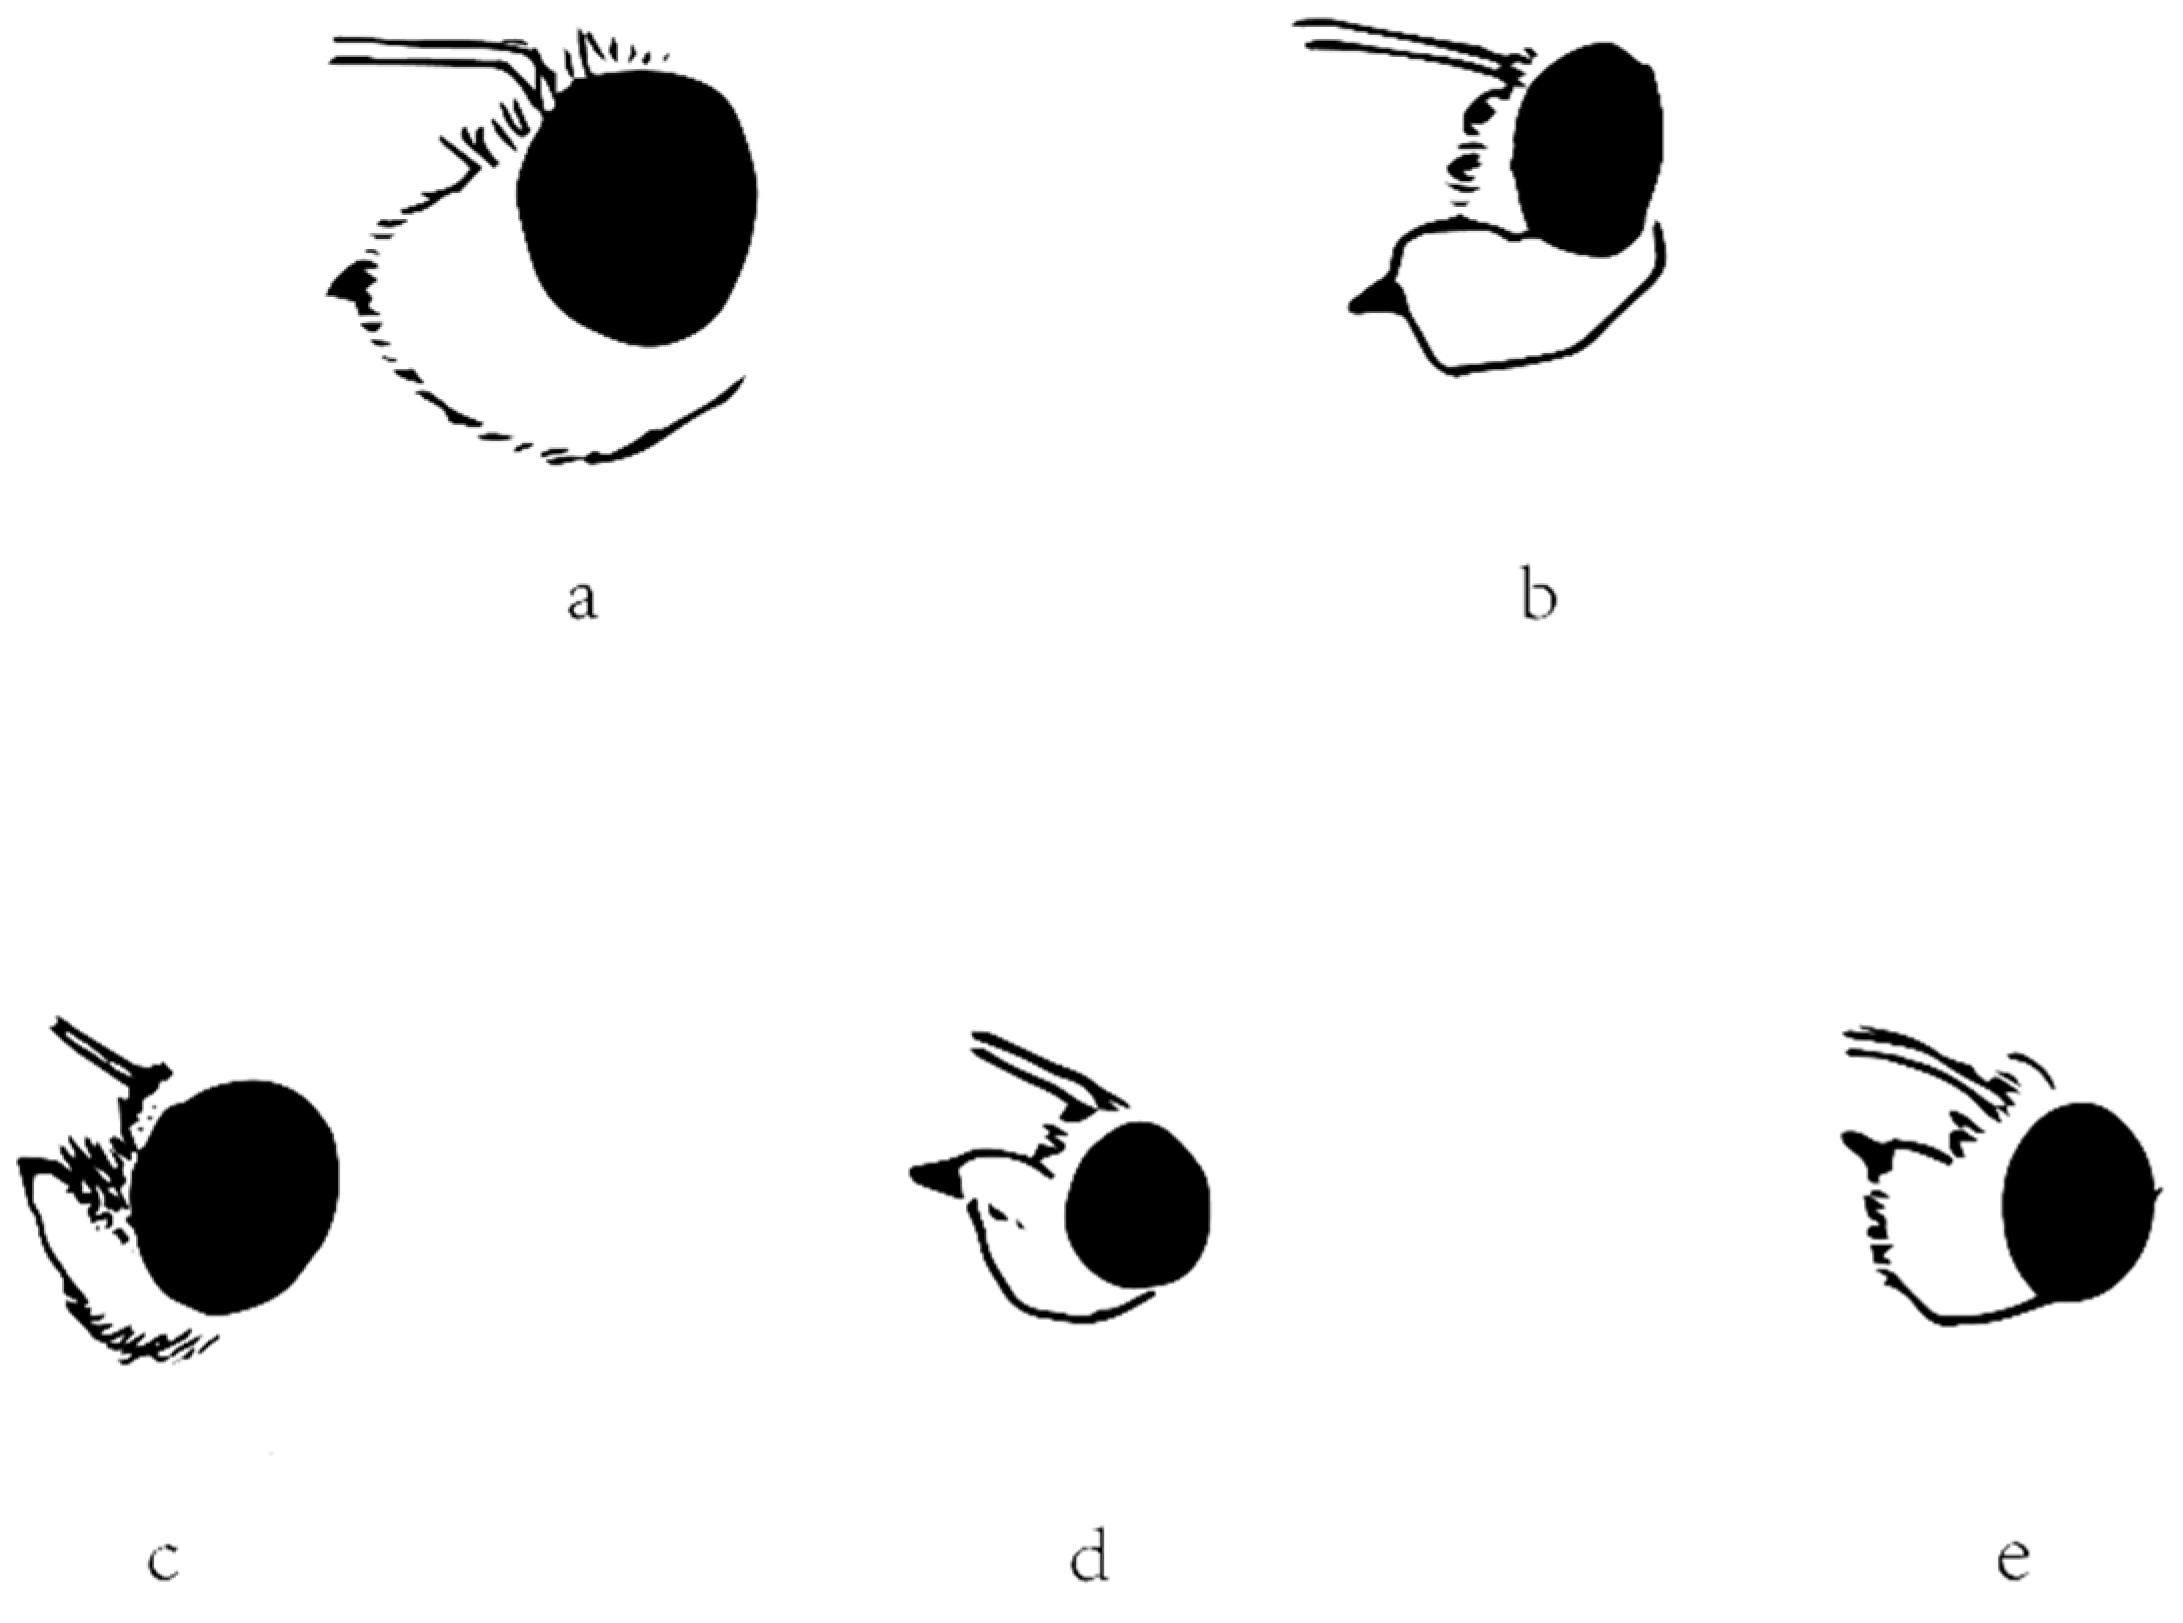
2.5. Morphological Comparison
3. Results and Discussion
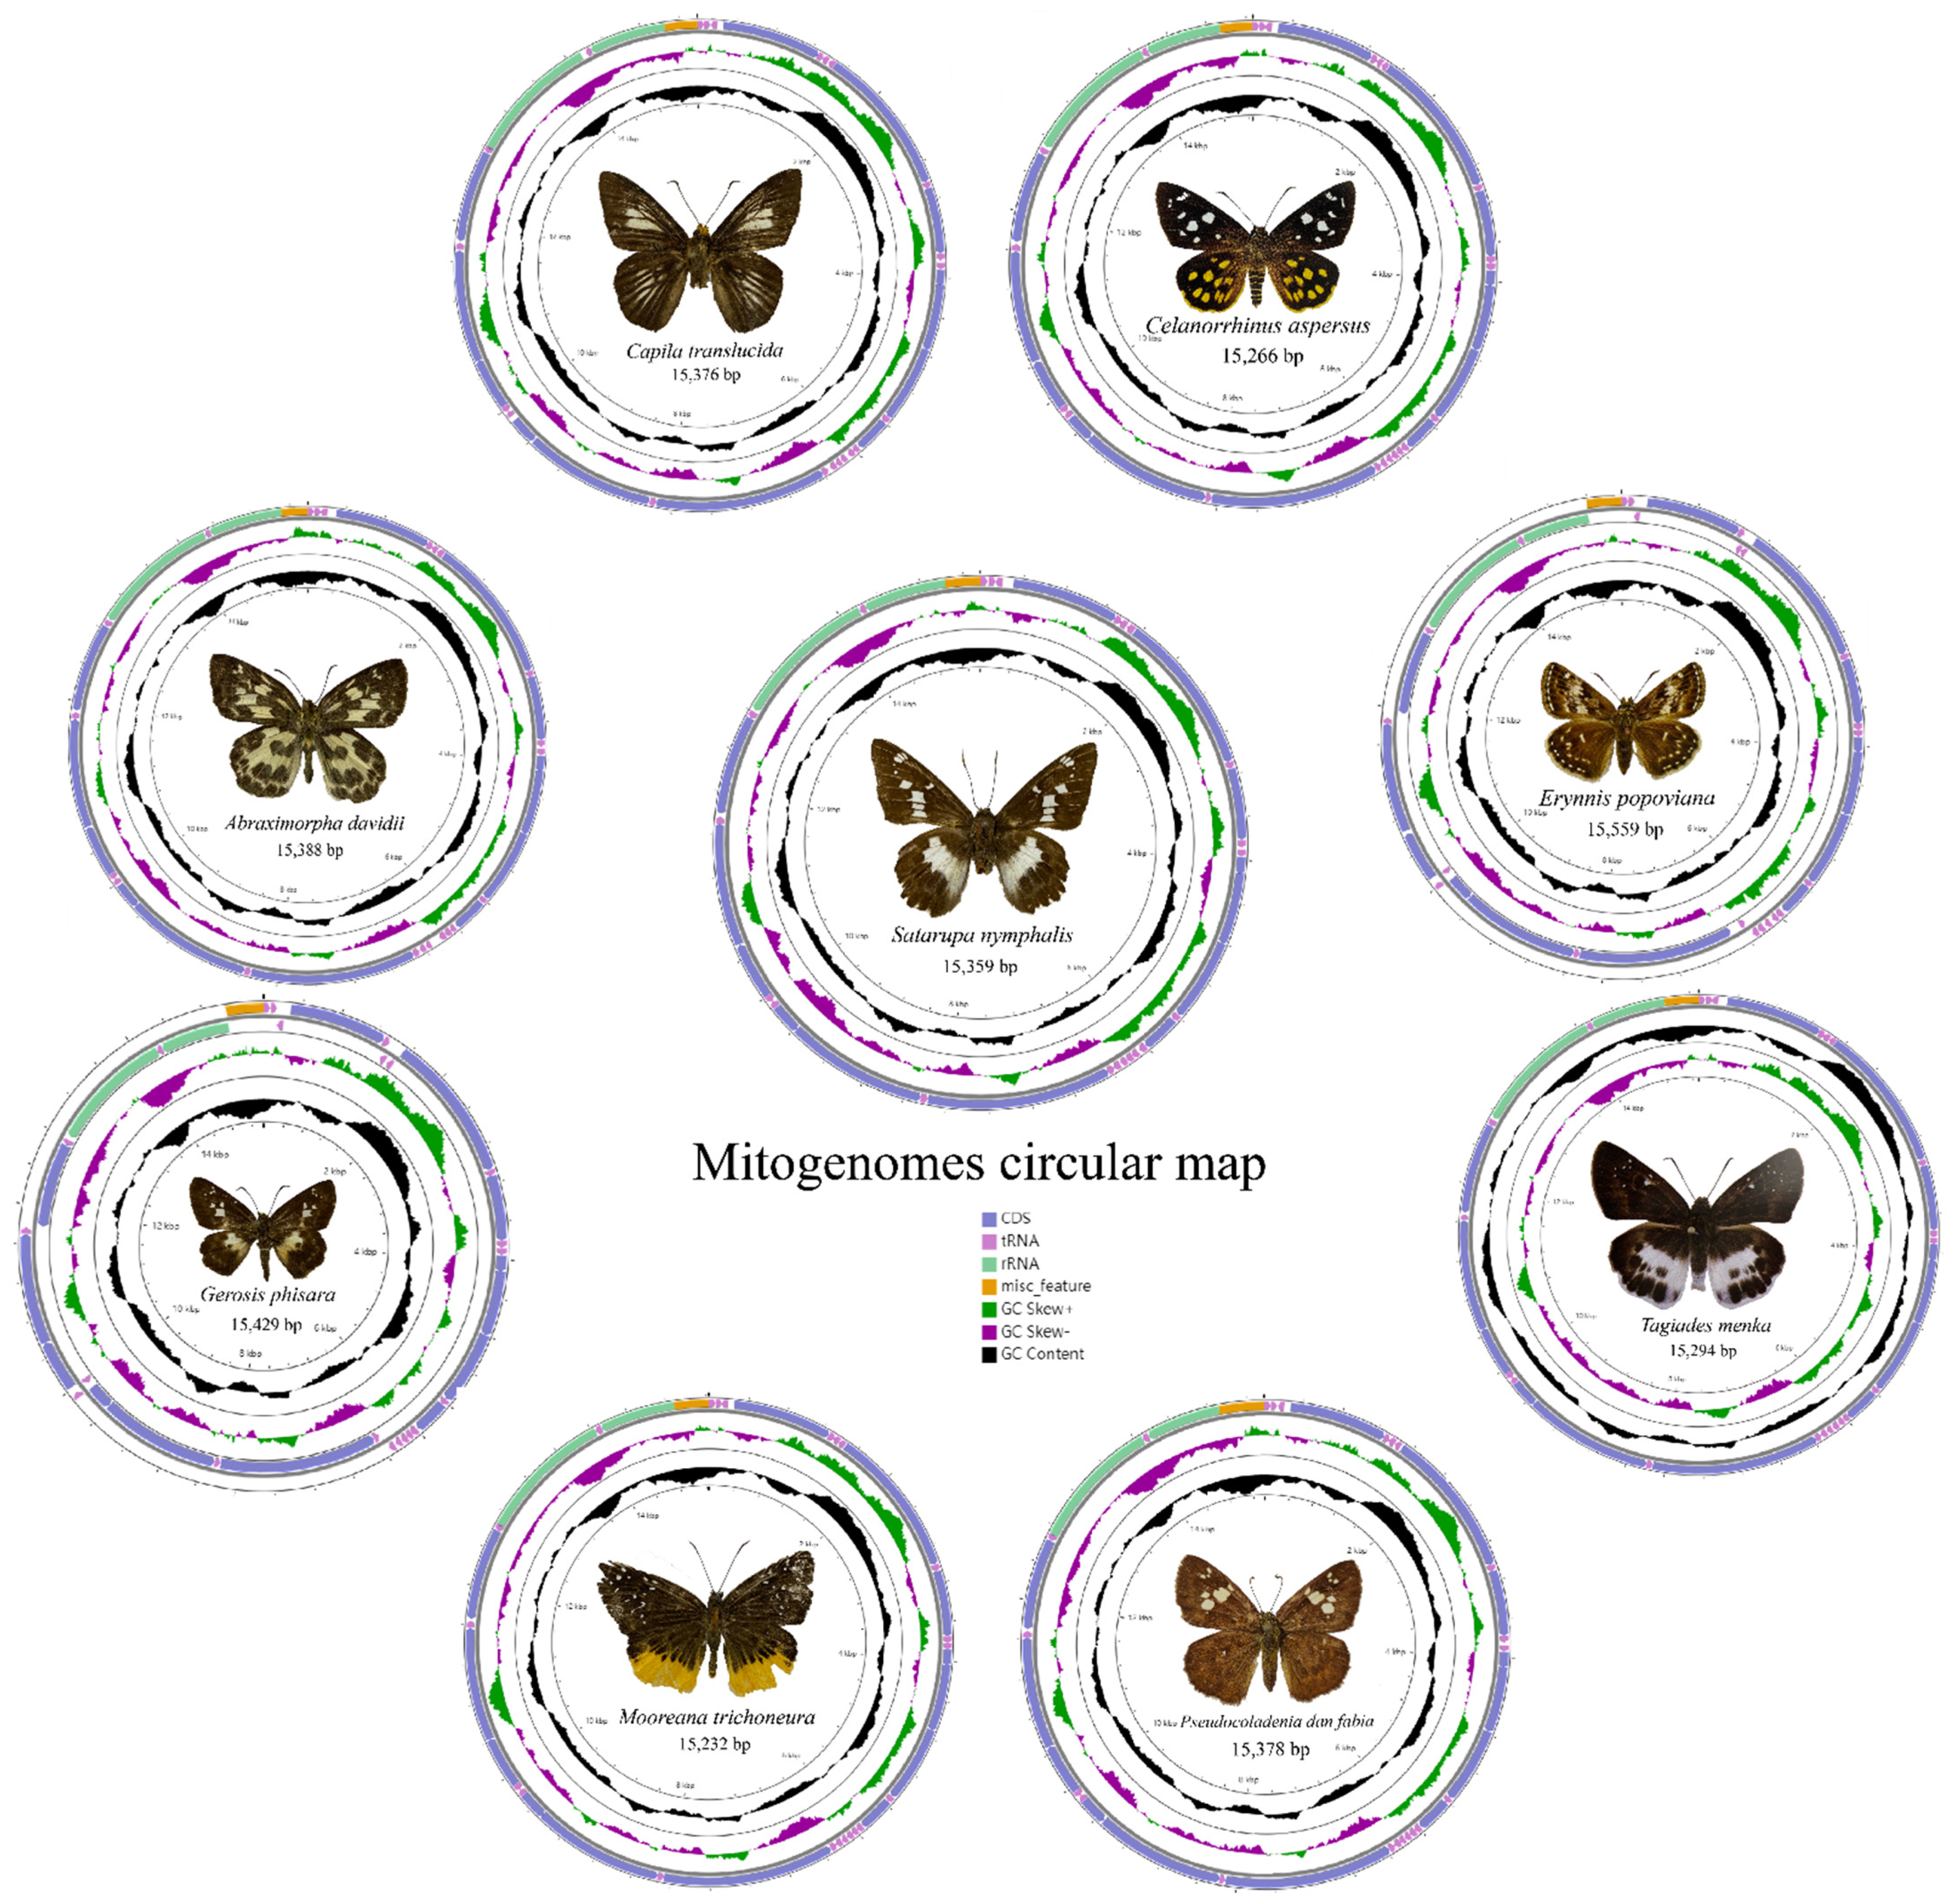
3.1. Genome Organization and Base Composition
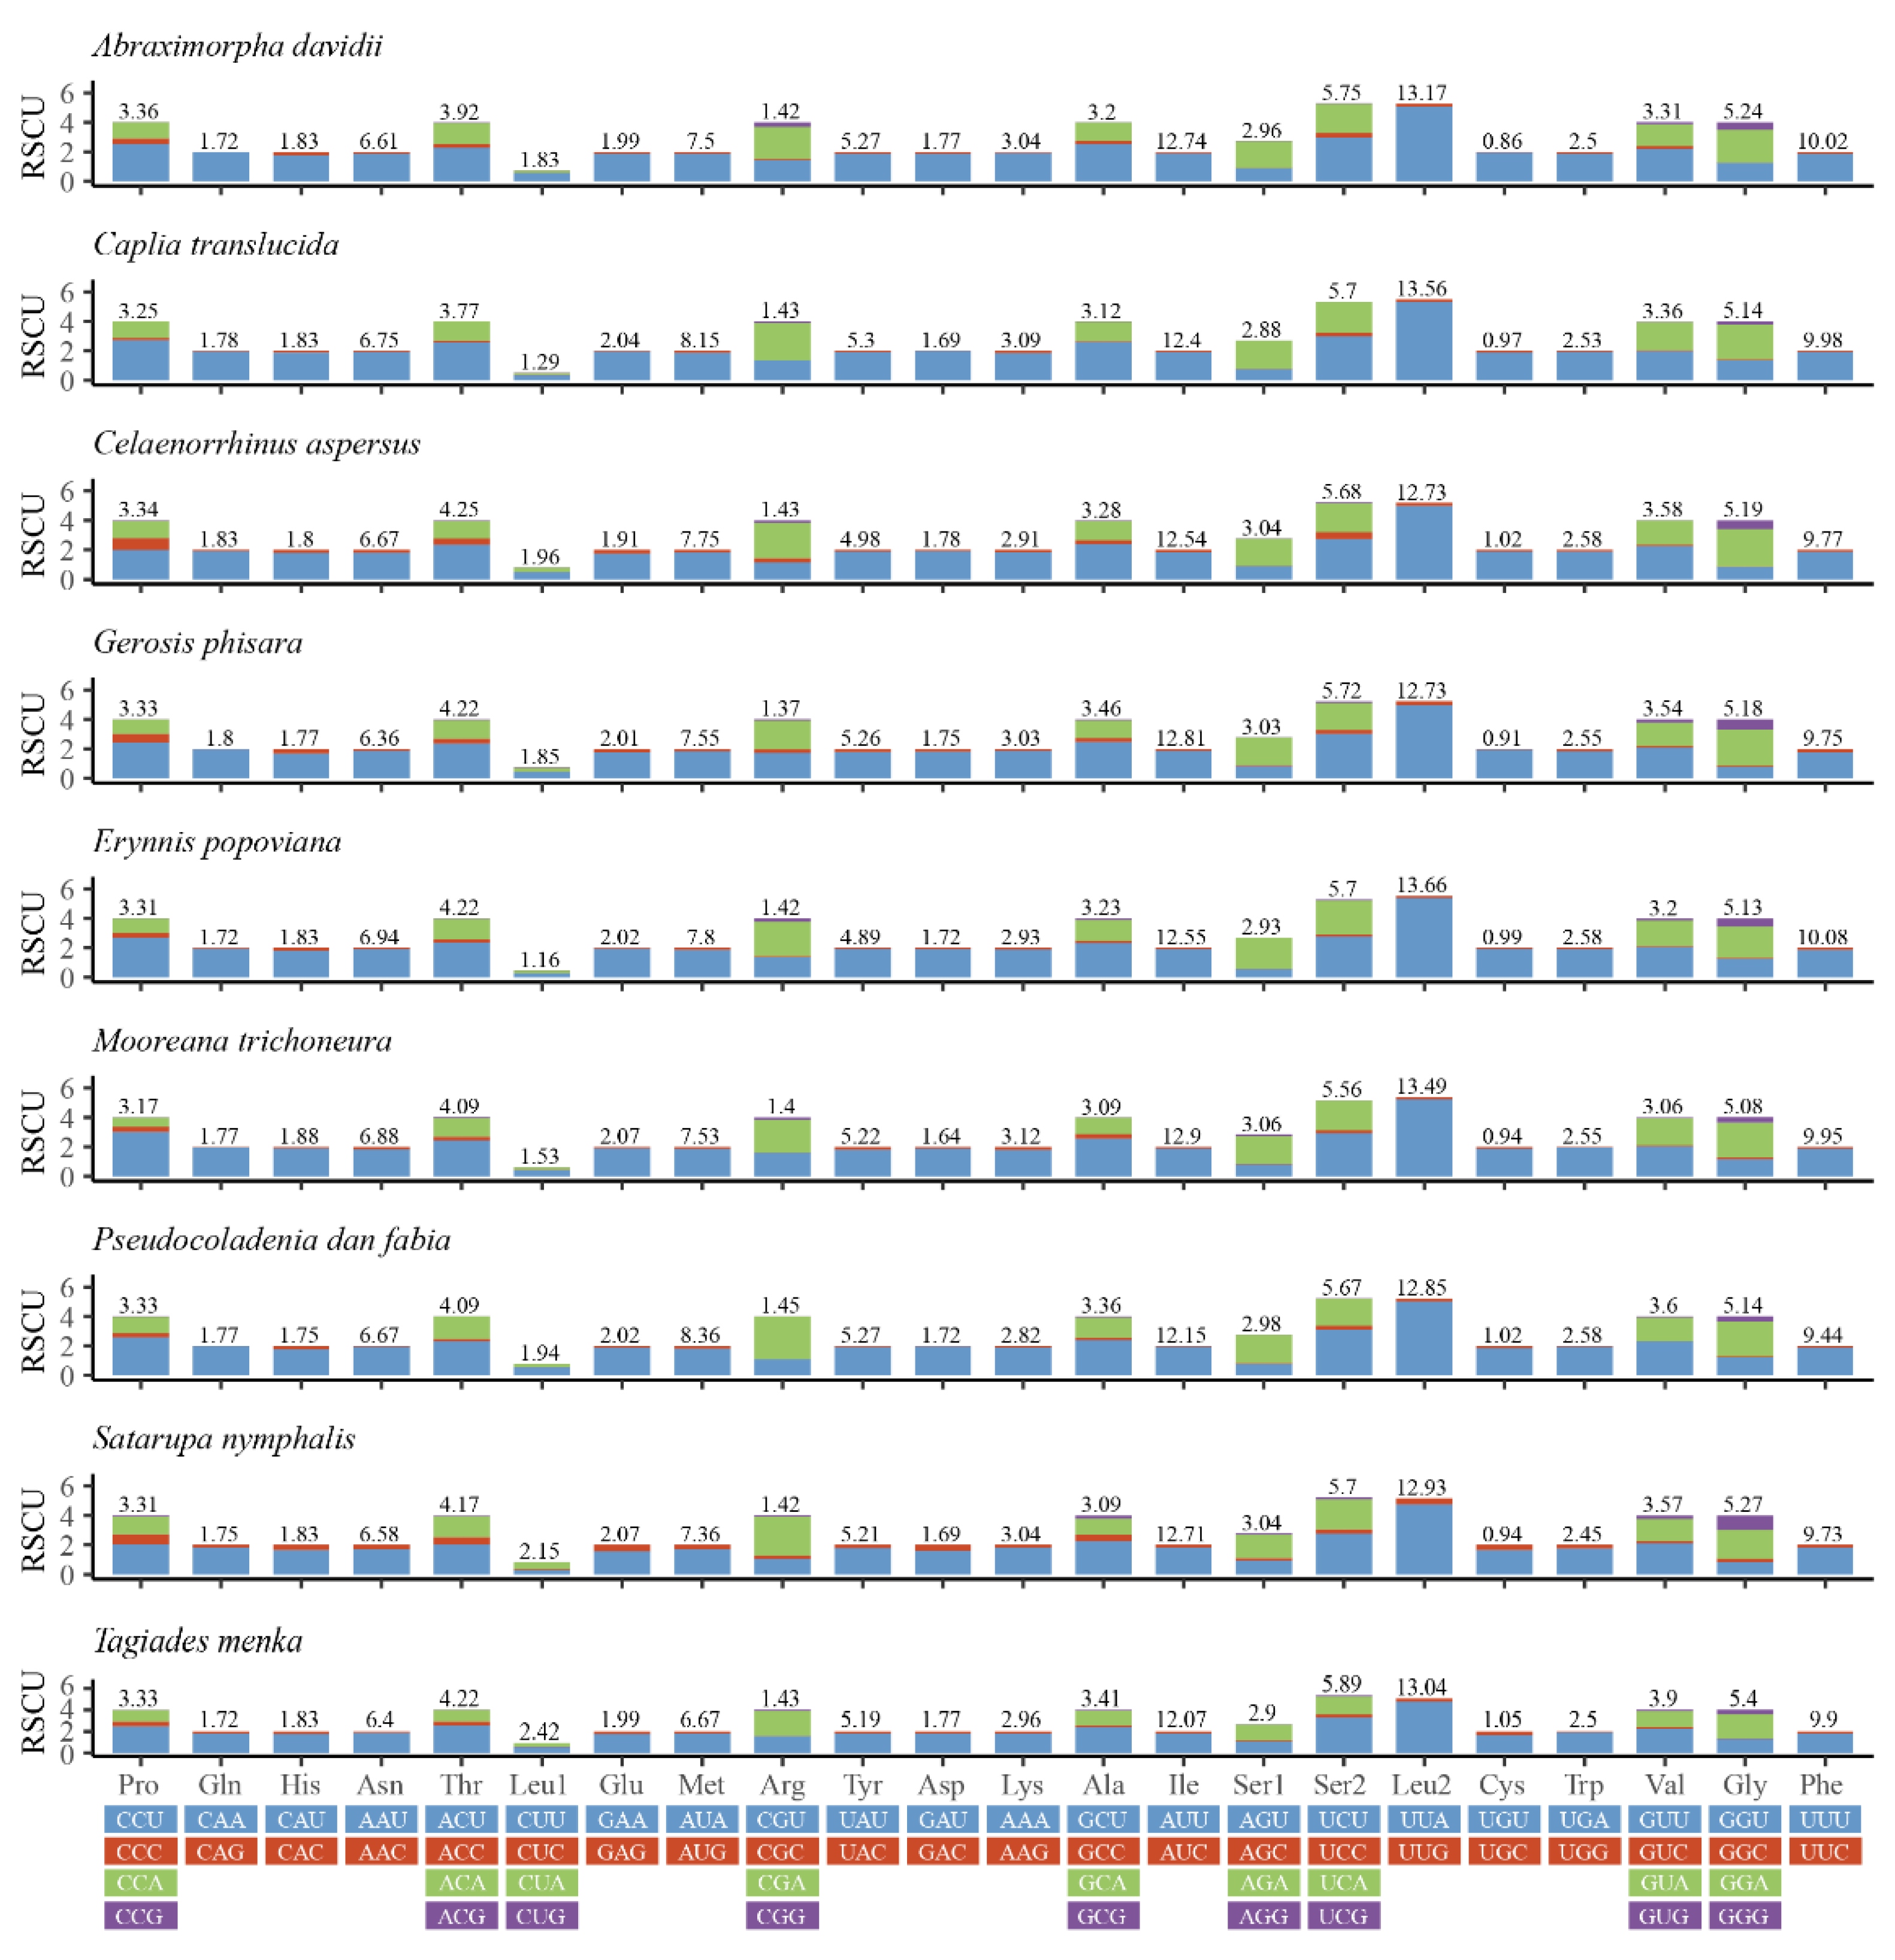
3.2. Protein-Coding Genes
3.3. Transfer and Ribosomal RNA Genes
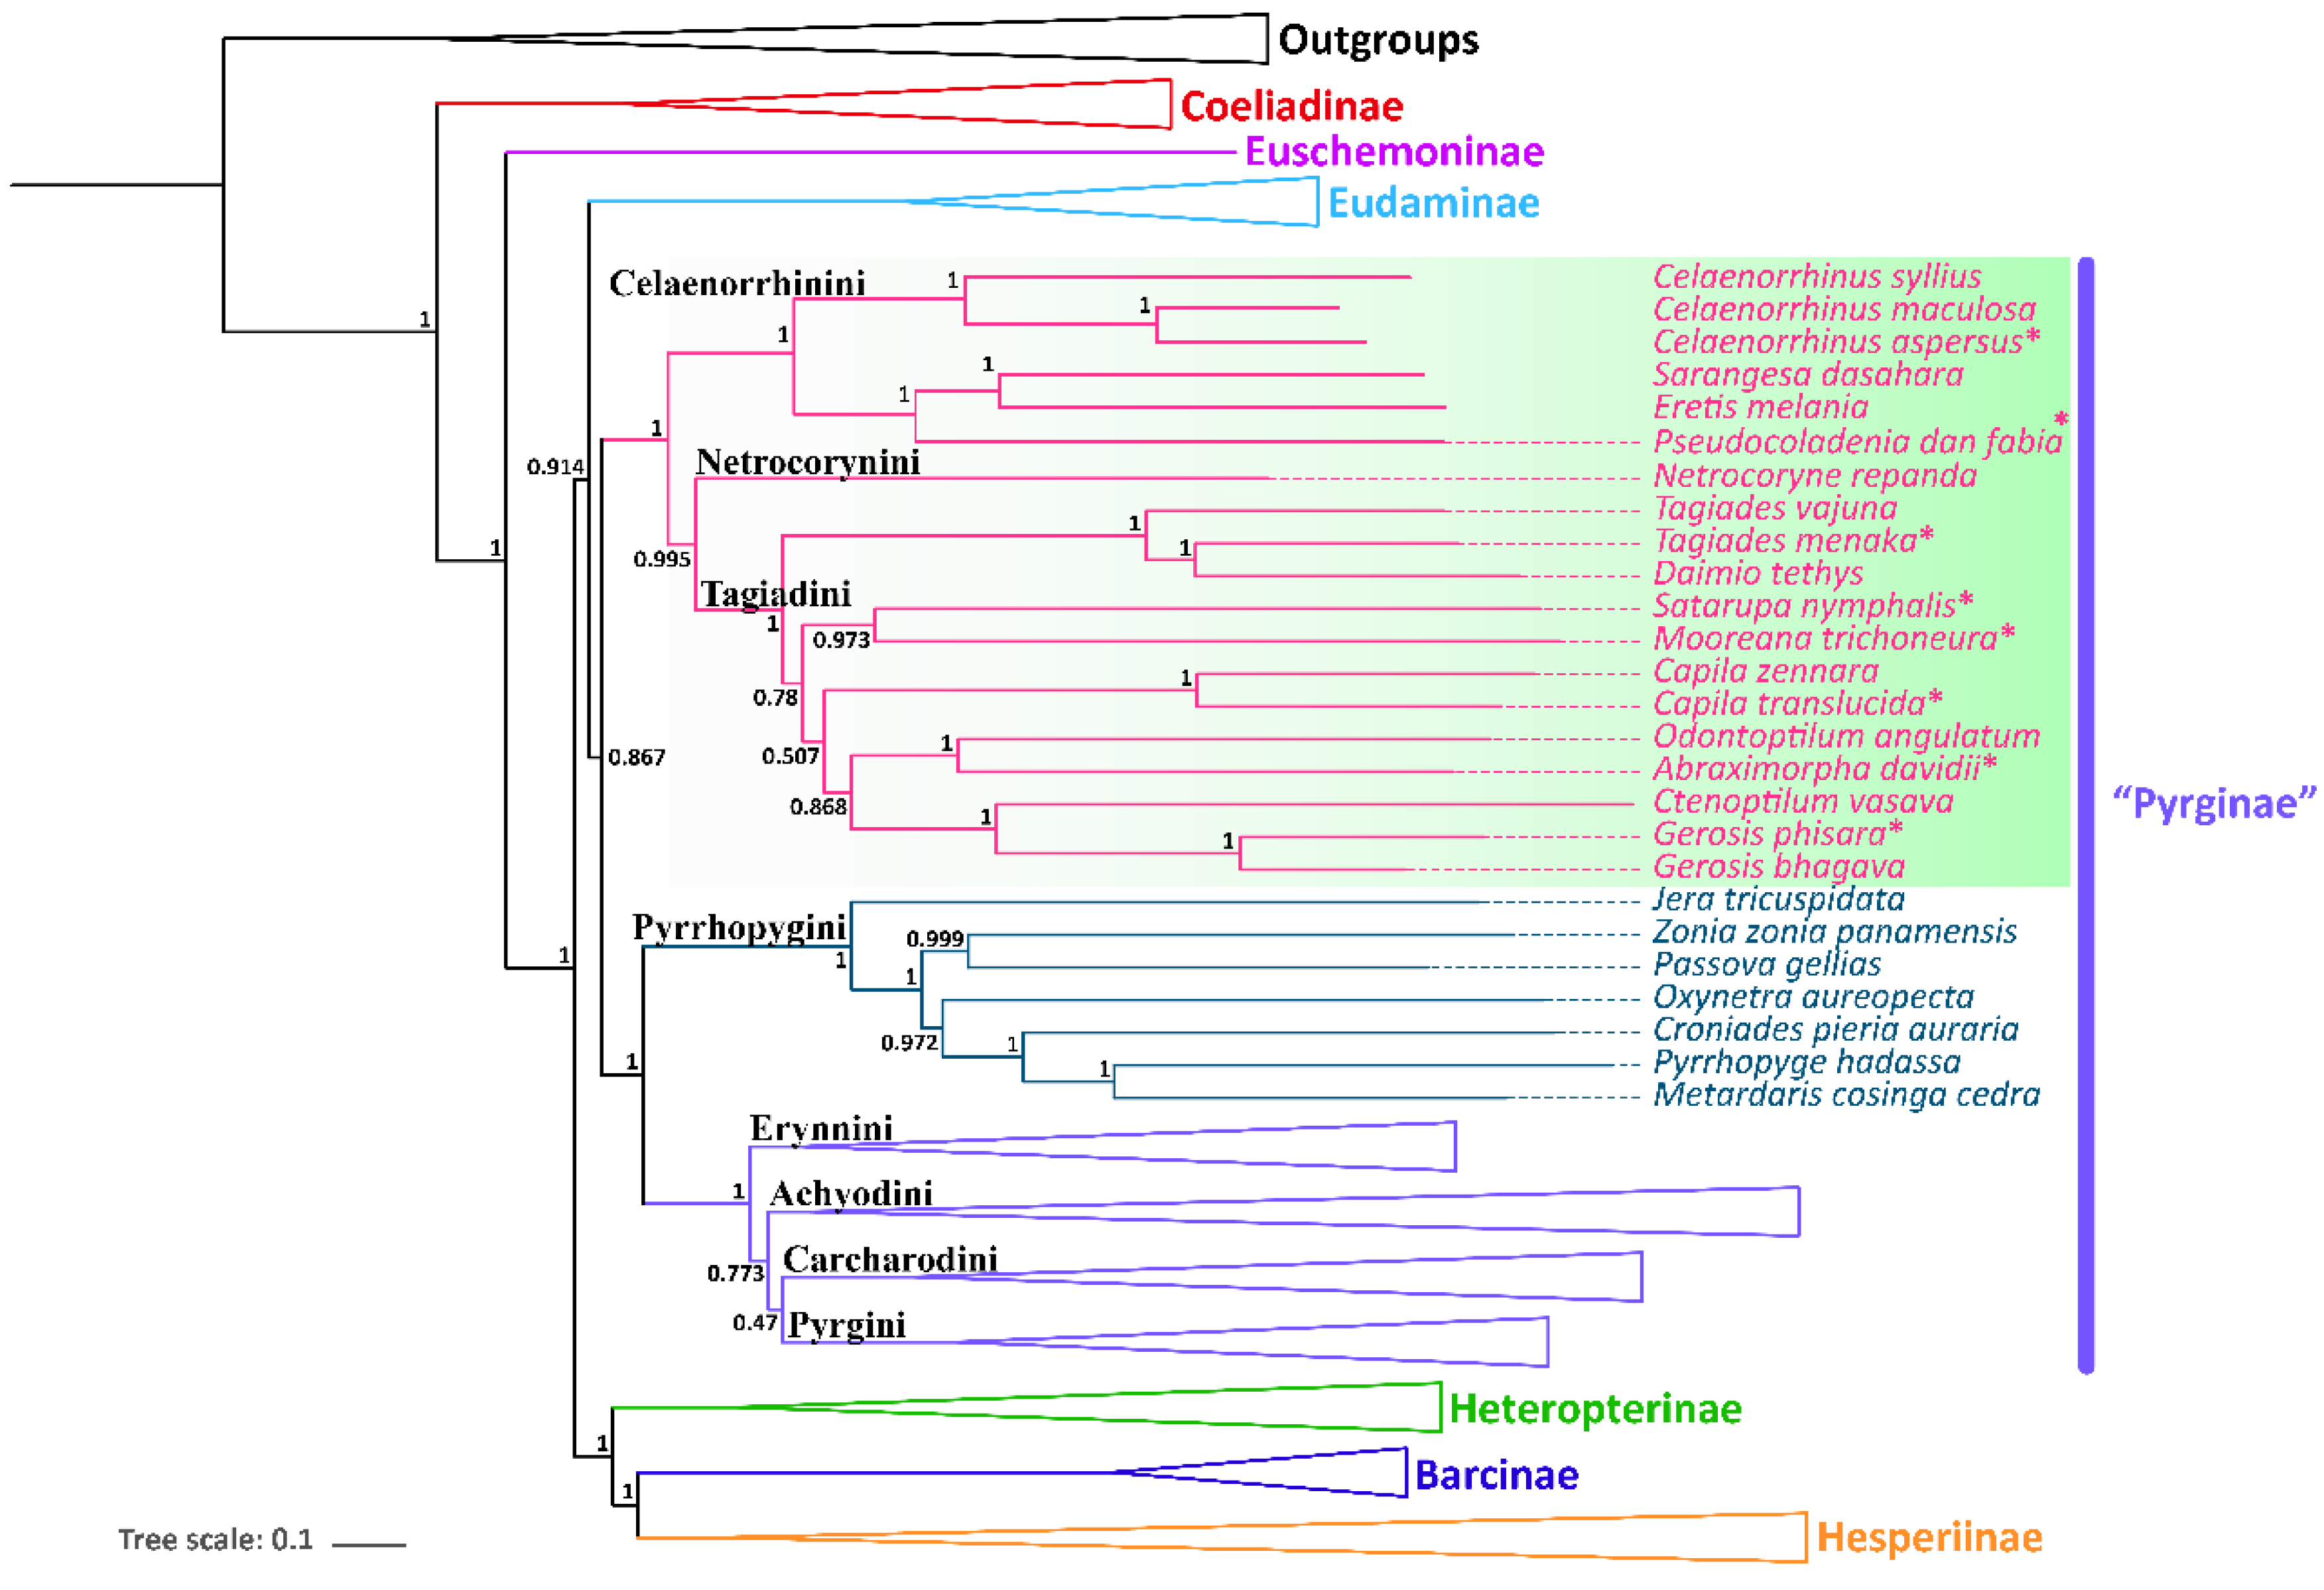
3.4. Phylogenetic Relationships
Supplementary Materials
Author Contributions
Funding
Institutional Review Board Statement
Data Availability Statement
Acknowledgments
Conflicts of Interest
References
- Warren, A.D.; Ogawa, J.R.; Brower, A.V.Z. Phylogenetic relationships of subfamilies and circumscription of tribes in the family Hesperiidae (Lepidoptera: Hesperioidea). Cladistics 2008, 24, 642–676. [Google Scholar] [CrossRef] [Green Version]
- Evans, W.H. A Catalogue of the Hesperiidae from Europe, Asia and Australia in the British Museum (Natural History); The British Museum: London, UK, 1949. [Google Scholar]
- Warren, A.D.; Ogawa, J.R.; Brower, A.V.Z. Revised classification of the family Hesperiidae (Lepidoptera: Hesperioidea) based on combined molecular and morphological data. Syst. Entomol. 2009, 34, 467–523. [Google Scholar] [CrossRef]
- Cong, Q.; Zhang, J.; Shen, J.; Grishin, N.V. Fifty new genera of Hesperiidae (Lepidoptera). Insecta Mundi 2019, 731, 1–56. [Google Scholar]
- Li, W.; Cong, Q.; Shen, J.; Zhang, J.; Hallwachs, W.; Janzen, D.H.; Grishin, N.V. Genomes of skipper butterflies reveal extensive convergence of wing patterns. Proc. Natl. Acad. Sci. USA 2019, 116, 6232–6237. [Google Scholar] [CrossRef] [PubMed] [Green Version]
- Grishin, N.V.; Burns, J.M.; Janzen, D.H.; Hallwachs, W.; Hajibabaei, M. Oxynetra: Facies and DNA barcodes point to a new species from Costa Rica (Hesperiidae: Pyrginae: Pyrrhopygini). J. Lepid. Soc. 2013, 67, 1–14. [Google Scholar] [CrossRef]
- Grishin, N.V. Adding to the rich fauna of the Chocó region in Ecuador, a new species of Potamanaxas (Hesperiidae: Pyrginae: Erynnini). Trop. Lepid. Res. 2013, 23, 1-III. [Google Scholar]
- Ferrer-Paris, J.R.; Sánchez-Mercado, A.; Viloria, A.L.; Donaldson, J. Congruence, and diversity of butterfly-host plant associations at higher taxonomic levels. PLoS ONE 2013, 8, e63570. [Google Scholar] [CrossRef] [Green Version]
- Grishin, N.V.; Janzen, D.H.; Hallwachs, W. A new species of Eracon (Hesperiidae: Pyrginae) substantiated by a number of traits, including female genitalia. J. Lepid. Soc. 2014, 68, 149–161. [Google Scholar] [CrossRef]
- Warren, A.D.; Grishin, N.V. A new species of Oxynetra from Mexico (Hesperiidae, Pyrginae, Pyrrhopygini). ZooKeys 2017, 667, 155–164. [Google Scholar] [CrossRef]
- Evans, W.H.; Wagman, D.D. Thermodynamics of some simple sulfur-containing molecules. J. Res. Nat. Bur. Stand. 1952, 49, 141–148. [Google Scholar] [CrossRef]
- Kim, M.J.; Kang, A.R.; Jeong, H.C.; Kim, K.-G.; Kim, I. Reconstructing intraordinal relationships in Lepidoptera using mitochondrial genome data with the description of two newly sequenced lycaenids, Spindasis takanonis and Protantigius superans (Lepidoptera: Lycaenidae). Mol. Phylogenet. Evol. 2011, 61, 436–445. [Google Scholar] [CrossRef]
- Makkonen, J.; Vesterbacka, A.; Martin, F.; Jussila, J.; Dieguez-Uribeondo, J.; Kortet, R.; Kokko, H. Mitochondrial genomes and comparative genomics of Aphanomyces astaci and Aphanomyces invadans. Sci. Rep. 2016, 6, 36089. [Google Scholar] [CrossRef] [Green Version]
- Sun, Y.U.; Zhang, J.; Qingqing, L.I.; Liang, D.; Abbas, M.N.; Qian, C.; Wang, L.; Wei, G.; Zhu, B.; Liu, C. Mitochondrial genome of Abraxas suspecta (Lepidoptera: Geometridae) and comparative analysis with other Lepidopterans. Zootaxa 2017, 4254, 501–519. [Google Scholar] [CrossRef]
- Yuan, X.Q.; Gao, K.; Yuan, F.; Wang, P.; Zhang, Y.L. Phylogenetic relationships of subfamilies in the family Hesperiidae (Lepidoptera: Hesperioidea) from China. Sci. Rep. 2015, 5, 11140. [Google Scholar] [CrossRef] [Green Version]
- Liu, F.F.; Li, Y.P.; Jakovlić, I.; Yuan, X.Q. Tandem duplication of two tRNA genes in the mitochondrial genome of Tagiades vajuna (Lepidoptera: Hesperiidae). Eur. J. Entomol. 2017, 114, 407–415. [Google Scholar] [CrossRef] [Green Version]
- Toussaint, E.F.A.; Breinholt, J.W.; Earl, C.; Warren, A.D.; Brower, A.V.Z.; Yago, M.; Dexter, K.M.; Espeland, M.; Pierce, N.E.; Lohman, D.J. Anchored phylogenomics illuminates the skipper butterfly tree of life. BMC Evol. Biol. 2018, 18, 101. [Google Scholar] [CrossRef] [PubMed] [Green Version]
- Ma, L.Y.; Chiba, H.; Yuan, X.Q. The mitochondrial genomes of three skippers: Insights into the evolution of the family Hesperiidae (Lepidoptera). Genomics 2019, 112, 432–441. [Google Scholar] [CrossRef]
- Nelson, L.A.; Lambkin, C.L.; Batterham, P.; Wallman, J.F.; Dowton, M.; Whiting, M.F.; Yeates, D.K.; Cameron, S.L. Beyond barcoding: A mitochondrial genomics approach to molecular phylogenetics and diagnostics of blowflies (Diptera: Calliphoridae). Gene 2012, 511, 131–142. [Google Scholar] [CrossRef] [Green Version]
- Timmermans, M.J.T.N.; Barton, C.; Haran, J.; Ahrens, D.; Culverwell, C.L.; Ollikainen, A.; Dodsworth, S.; Foster, P.G.; Bocak, L.; Vogler, A.P. Family-level sampling of mitochondrial genomes in Coleoptera: Compositional heterogeneity and phylogenetics. Genome Biol. Evol. 2016, 8, 161–175. [Google Scholar] [CrossRef] [PubMed] [Green Version]
- Wang, J.; Dai, R.; Li, H.; Zhan, H. Characterization of the complete mitochondrial genome of Japanagallia spinosa and Durgades nigropicta (Hemiptera: Cicadellidae: Megophthalminae). Biochem. Syst. Ecol. 2017, 74, 33–41. [Google Scholar] [CrossRef]
- Li, H.; Leavengood, J.J.; Chapman, E.G.; Burkhardt, D.; Song, F.; Jiang, P.; Liu, J.; Zhou, X.; Cai, W. Mitochondrial phylogenomics of Hemiptera reveals adaptive innovations driving the diversification of true bugs. Proc. R. Soc. B Biol. Sci. 2017, 284, 20171223. [Google Scholar] [CrossRef]
- Zhang, D.; Zou, H.; Wu, S.G.; Li, M.; Jakovlic, I.; Zhang, J.; Chen, R.; Li, W.X.; Wang, G.T. Three new Diplozoidae mitogenomes expose unusual compositional biases within the Monogenea class: Implications for phylogenetic studies. BMC Evol. Biol. 2018, 18, 133. [Google Scholar] [CrossRef] [Green Version]
- Han, Y.; Huang, Z.; Tang, J.; Chiba, H.; Fan, X. The complete mitochondrial genomes of two skipper genera (Lepidoptera: Hesperiidae) and their associated phylogenetic analysis. Sci. Rep. 2018, 8, 15762. [Google Scholar] [CrossRef] [PubMed] [Green Version]
- Ratnasingham, S.; Hebert, P.D.N. A DNA-based registry for all animal species: The barcode index number (BIN) system. PLoS ONE 2013, 8, e66213. [Google Scholar] [CrossRef] [Green Version]
- Kearse, M.; Moir, R.; Wilson, A.; Stones-Havas, S.; Cheung, M.; Sturrock, S.; Buxton, S.; Cooper, A.; Markowitz, S.; Duran, C.; et al. Geneious Basic: An integrated and extendable desktop software platform for the organization and analysis of sequence data. Bioinformatics 2012, 28, 1647–1649. [Google Scholar] [CrossRef]
- Bernt, M.; Donath, A.; Jühling, F.; Externbrink, F.; Florentz, C.; Fritzsch, G.; Pütz, J.; Middendorf, M.; Stadler, P.F. MITOS: Improved de novo metazoan mitochondrial genome annotation. Mol. Phylogenet. Evol. 2013, 69, 313–319. [Google Scholar] [CrossRef] [PubMed]
- Zhang, D.; Gao, F.; Jakovlić, I.; Zou, H.; Zhang, J.; Li, W.X.; Wang, G.T. PhyloSuite: An integrated and scalable desktop platform for streamlined molecular sequence data management and evolutionary phylogenetics studies. Mol. Ecol. Resour. 2020, 20, 348–355. [Google Scholar] [CrossRef]
- Katoh, K.; Standley, D.M. MAFFT multiple sequence alignment software version 7: Improvements in performance and usability. Mol. Biol. Evol. 2013, 30, 772–780. [Google Scholar] [CrossRef] [Green Version]
- Castresana, J. Selection of conserved blocks from multiple alignments for their use in phylogenetic analysis. Mol. Biol. Evol. 2000, 17, 540–552. [Google Scholar] [CrossRef] [PubMed] [Green Version]
- Zhang, J.; Cong, Q.; Shen, J.; Wang, R.; Grishin, N.V. The complete mitochondrial genome of a skipper Burara striata (Lepidoptera: Hesperiidae). Mitochondrial DNA Part B 2017, 2, 145–147. [Google Scholar] [CrossRef] [Green Version]
- Kim, M.J.; Wang, A.R.; Park, J.S.; Kim, I. Complete mitochondrial genomes of five skippers (Lepidoptera: Hesperiidae) and phylogenetic reconstruction of Lepidoptera. Gene 2014, 549, 97–112. [Google Scholar] [CrossRef]
- Wang, J.; James John, Y.; Xuan, S.; Cao, T.; Yuan, X. The complete mitochondrial genome of the butterfly Hasora anura (Lepidoptera: Hesperiidae). Mitochondrial DNA Part A 2015, 27, 4401–4402. [Google Scholar] [CrossRef]
- Cao, L.M.; Wang, J.P.; James, J.Y.; Yau, S.M.; Yuan, X.Q.; Liu, J.P.; Cao, T.W. The complete mitochondrial genome of Hasora vitta (Butler, 1870) (Lepidoptera: Hesperiidae). Mitochondrial DNA Part A 2016, 27, 3020–3021. [Google Scholar] [CrossRef]
- Zhang, J.; Cong, Q.; Shen, J.; Fan, X.L.; Wang, M.; Grishin, N.V. The complete mitogenome of Euschemon rafflesia (Lepidoptera: Hesperiidae). Mitochondrial DNA Part B 2017, 2, 136–138. [Google Scholar] [CrossRef] [Green Version]
- Jeong, S.Y.; Kim, M.J.; Jeong, N.R.; Kim, I. Complete mitochondrial genome of the silver stripped skipper, Leptalina unicolor (Lepidoptera: Hesperiidae). Mitochondrial DNA Part B 2019, 4, 3418–3420. [Google Scholar] [CrossRef] [PubMed]
- Qian, C.; Grishin, N.V. The complete mitochondrial genome of Lerema accius and its phylogenetic implications. PeerJ 2016, 4, e1546. [Google Scholar]
- Shao, L.L.; Sun, Q.Q.; Hao, J.S. The complete mitochondrial genome of Parara guttata (Lepidoptera: Hesperiidae). Mitochondrial DNA 2015, 26, 724–725. [Google Scholar] [CrossRef] [PubMed]
- Grishin, N.V.; Zhang, J.; Cong, Q.; Fan, X.L.; Wang, R.; Wang, M. Mitogenomes of Giant-Skipper Butterflies reveal an ancient split between deep and shallow root feeders. F1000Research 2017, 6, 222. [Google Scholar] [CrossRef] [Green Version]
- Shen, J.H.; Cong, Q.; Grishin, N.V. The complete mitogenome of Achalarus lyciades (Lepidoptera: Hesperiidae). Mitochondrial DNA Part B 2016, 1, 581–583. [Google Scholar] [CrossRef] [PubMed] [Green Version]
- Wang, K.; Hao, J.; Zhao, H. Characterization of complete mitochondrial genome of the skipper butterfly, Celaenorrhinus maculosus (Lepidoptera: Hesperiidae). Mitochondrial DNA 2015, 26, 690–691. [Google Scholar] [CrossRef] [PubMed]
- Hao, J.S.; Sun, Q.Q.; Zhao, H.B.; Sun, X.Y.; Gai, Y.H.; Yang, Q. The complete mitochondrial genome of Ctenoptilum vasava (Lepidoptera: Hesperiidae: Pyrginae) and its phylogenetic implication. Comp. Funct. Genom. 2012, 2012, 328049. [Google Scholar] [CrossRef] [Green Version]
- Zuo, N.; Gan, S.; Chen, Y.; Hao, J. The complete mitochondrial genome of the Daimio tethys (Lepidoptera: Hesperoidea: Hesperiidae). Mitochondrial DNA 2014, 27, 1099–1100. [Google Scholar] [CrossRef]
- Liu, J.; Xiao, J.; Hao, X.; Yuan, X. Unique Duplication of trnN in Odontoptilum angulatum (Lepidoptera: Pyrginae) and Phylogeny within Hesperiidae. Insects 2021, 12, 348. [Google Scholar] [CrossRef] [PubMed]
- Tang, M.; Tan, M.; Meng, G.; Yang, S.; Su, X.; Liu, S.; Song, W.; Li, Y.; Wu, Q.; Zhang, A.; et al. Multiplex sequencing of pooled mitochondrial genomes—A crucial step toward biodiversity analysis using mito-metagenomics. Nucleic Acids Res. 2014, 42, e166. [Google Scholar] [CrossRef] [PubMed] [Green Version]
- Chen, Y.; Gan, S.; Shao, L.; Cheng, C.; Hao, J. The complete mitochondrial genome of the Pazala timur (Lepidoptera: Papilionidae: Papilioninae). Mitochondrial DNA Part A 2016, 27, 533–534. [Google Scholar] [CrossRef] [PubMed]
- Chen, Y.H.; Huang, D.Y.; Wang, Y.L.; Zhu, C.D.; Hao, J.S. The complete mitochondrial genome of the endangered Apollo butterfly, Parnassius apollo (Lepidoptera: Papilionidae) and its comparison to other Papilionidae species. J. Asia Pac. Entomol. 2014, 17, 663–671. [Google Scholar] [CrossRef]
- Cameron, S.L.; Whiting, M.F. The complete mitochondrial genome of the tobacco hornworm, Manduca sexta, (Insecta: Lepidoptera: Sphingidae), and an examination of mitochondrial gene variability within butterflies and moths. Gene 2008, 408, 112–123. [Google Scholar] [CrossRef] [PubMed]
- Stothard, P.; Wishart, D.S. Circular genome visualization and exploration using CGView. Bioinformatics 2005, 21, 537–539. [Google Scholar] [CrossRef] [Green Version]
- Wang, X.; Chen, Z.M.; Gu, X.S.; Wang, M.; Huang, G.H.; Zwick, A. Phylogenetic relationships among Bombycidae sl (Lepidoptera) based on analyses of complete mitochondrial genomes. Syst. Entomol. 2019, 44, 490–498. [Google Scholar] [CrossRef]
- Wang, Y.; Chen, J.; Jiang, L.Y.; Qiao, G.X. Hemipteran mitochondrial genomes: Features, structures, and implications for phylogeny. Int. J. Mol. Sci. 2015, 16, 12382–12404. [Google Scholar] [CrossRef] [Green Version]
- Ojala, D.; Montoya, J.; Attardi, G. TRNA punctuation model of RNA processing in human mitochondria. Nature 1981, 290, 470–474. [Google Scholar] [CrossRef] [PubMed]
- Zhang, D.X.; Szymura, J.M.; Hewitt, G.M. Evolution, and structural conservation of the control region of insect mitochondrial DNA. J. Mol. Evol. 1995, 40, 382–391. [Google Scholar] [CrossRef] [PubMed]
- Huang, Z.F.; Chiba, H.; Deng, X.H.; Huang, S.Y.; Wang, M.; Fan, X.L. Molecular and morphological evidence reveals that Daimio Murray, 1875 is a junior synonym of Tagiades Hübner, 1819 (Lepidoptera: Hesperiidae: Tagiadini). Zootaxa 2020, 4731, zootaxa-4731. [Google Scholar] [CrossRef]
- Hebert, P.D.N.; Penton, E.H.; Burns, J.M.; Janzen, D.H.; Hallwachs, W. Ten species in one: DNA barcoding reveals cryptic species in the neotropical skipper butterfly Astraptes fulgerator. Proc. Natl. Acad. Sci. USA 2004, 101, 14812–14817. [Google Scholar] [CrossRef] [Green Version]
- Chou, I. Monographia Rhopalocerorum Sinensium; Henan Scientific and Technological Publishing House: Henan, China, 1994. [Google Scholar]


| Species | Accession Number | Collection Spot |
|---|---|---|
| Abraximorpha davidii | MZ221157 | Zhoushan, Zhejiang, China |
| Capila translucida | MZ221158 | Jianfengling, Hainan, China |
| Celaenorrhinus aspersus | MZ221159 | Guanyang County, Guangxi, China |
| Erynnis popoviana | MZ221165 | Huangling County, Shaanxi, China |
| Gerosis phisara | MZ221160 | Mountain Fengyangshan, Zhejiang, China |
| Mooreana trichoneura | MZ221161 | Yexianggu, Yunnan, China |
| Pseudocoladenia dan fabia | MZ221162 | Mengla County, Yunnan, China |
| Satarupa nymphalis | MZ221163 | Xianxialing, Zhejiang, China |
| Tagiades menaka | MZ221164 | Jianfengling, Hainan, China |
| Subfamily | Tribes | Species | Accession Number | References |
|---|---|---|---|---|
| Coeliadinae | Burara striata | NC_034676 | [31] | |
| Choaspes benjaminii | NC_024647 | [32] | ||
| Hasora anura | KF881049 | [33] | ||
| Hasora vitta | NC_027170 | [34] | ||
| Hasora badra | NC_045249 | Unpublished | ||
| Euschemoninae | Euschemon rafflesia | NC_034231 | [35] | |
| Heteropterinae | Carterocephalus silvicola | NC_024646 | [32] | |
| Heteropterus morpheus | NC_028506 | Unpublished | ||
| Leptalina unicolour | MK265705 | [36] | ||
| Barcinae | Apostictopterus fuliginosus | NC_0339946 | [24] | |
| Barca bicolor | NC_0339947 | [24] | ||
| Hesperiinae | Lerema accius | NC_029826 | [37] | |
| Ochlodes venata | HM243593 | Unpublished | ||
| Parnara guttata | NC_029136 | [38] | ||
| Potanthus flavus | KJ629167 | [32] | ||
| Astictopterus jama | MH763663 | [18] | ||
| Isoteinon lamprospilus | MH763664 | [18] | ||
| Notocrypta curvifascia | MH763665 | [18] | ||
| Agathymus mariae mariae | KY630504 | [39] | ||
| Megathymus beulahae beulahae | KY630505 | [39] | ||
| Megathymus cofaqui cofaqui | KY630503 | [39] | ||
| Megathymus streckeri streckeri | KY630501 | [39] | ||
| Megathymus ursus violae | KY630502 | [39] | ||
| Megathymus yuccae yuccae | KY630500 | [39] | ||
| Eudaminae | Achalarus lyciades | NC_030602 | [40] | |
| Lobocla bifasciata | KJ629166 | [32] | ||
| Pyrginae | Celaenorrhini | Celaenorrhinus maculosus | NC_022853 | [41] |
| Celaenorrhinus syllius | SRR7174479 | [5] | ||
| Celaenorrhinus aspersus | MZ221157 | This study | ||
| Eretis melania | SRR7174485 | [5] | ||
| Pseudocoladenia dan fabia | MZ221162 | This study | ||
| Sarangesa dasahara | SRR7174486 | [5] | ||
| Netrocorynini | Netrocoryne repanda | SRR7174483 | [5] | |
| Tagiadini | Abraximorpha davidii | MZ221157 | This study | |
| Capila translucida | MZ221157 | This study | ||
| Capila zennara | SRR7174484 | [5] | ||
| Ctenoptilum vasava | JF713818 | [42] | ||
| Tagiades (=Daimio) tethys | KJ813807 | [43] | ||
| Gerosis bhagava | SRR7174473 | [5] | ||
| Gerosis phisara | MZ221157 | This study | ||
| Mooreana trichoneura | MZ221162 | This study | ||
| Satarupa nymphalis | MZ221162 | This study | ||
| Tagiades menaka | MZ221157 | This study | ||
| Tagiades vajuna | KX865091 | [16] | ||
| Pyrrhopygini | Croniades pieria auraria | SRR7174434 | [5] | |
| Jera tricuspidata | SRR7174433 | [5] | ||
| Metardaris cosinga cedra | SRR7174435 | [5] | ||
| Odontoptilum angulatum | MW381783 | [44] | ||
| Oxynetra aureopecta | SRR7174437 | [5] | ||
| Passova gellias | SRR7174439 | [5] | ||
| Pyrrhopyge hadassa | SRR7174436 | [5] | ||
| Zonia zonia panamensis | SRR7174438 | [5] | ||
| Erynnini | Anastrus sempiternus | SRR7174507 | [5] | |
| Camptopleura auxo | SRR7174462 | [5] | ||
| Clito sp. | SRR7174503 | [5] | ||
| Chiomara georgina | SRR7174467 | [5] | ||
| Ebrietas anacreon | SRR7174464 | [5] | ||
| Ephyriades brunnea brunnea | SRR7174465 | [5] | ||
| Erynnis brizo brizo | SRR7174469 | [5] | ||
| Erynnis montanus | NC_021427 | [32] | ||
| Erynnis popoviana | MZ221162 | This study | ||
| Gesta gesta | SRR7174466 | [5] | ||
| Gorgythion begga | SRR7174468 | [5] | ||
| Helias cama | SRR7174506 | [5] | ||
| Mylon lassia | SRR7174502 | [5] | ||
| Potamanaxas melicertes | SRR7174504 | [5] | ||
| Sostrata nordica | SRR7174505 | [5] | ||
| Timochares trifasciata | SRR7174461 | [5] | ||
| Achyodini | Aethilla lavochrea | SRR7174432 | [5] | |
| Achlyodes pallida | SRR7174366 | [5] | ||
| Atarnes sallei | SRR7174338 | [5] | ||
| Charidia lucaria | SRR7174567 | [5] | ||
| Doberes anticus | SRR7174369 | [5] | ||
| Eantis tamenund | SRR7174365 | [5] | ||
| Eburuncus unifasciata | SRR7174345 | [5] | ||
| Eracon sarahburnsae | SRR7174373 | [5] | ||
| Gindanes brontinus | SRR7174337 | [5] | ||
| Grais stigmaticus | SRR7174368 | [5] | ||
| Haemactis sanguinalis | SRR7174339 | [5] | ||
| Milanion marciana | SRR7174344 | [5] | ||
| Mimia cf. chiapaensis | SRR7174372 | [5] | ||
| Morvina fissimacula | SRR7174367 | [5] | ||
| Myrinia cf. binoculus | SRR7174371 | [5] | ||
| Ouleus salvina | SRR7174340 | [5] | ||
| Paramimus stigma | SRR7174568 | [5] | ||
| Pseudodrephalys atinas | SRR7174341 | [5] | ||
| Pythonides amaryllis | SRR7174336 | [5] | ||
| Quadrus cerialis | SRR7174343 | [5] | ||
| Spioniades abbreviata | SRR7174370 | [5] | ||
| Tosta tosta | SRR7174431 | [5] | ||
| Zera sp. | SRR7174342 | [5] | ||
| Carcharodini | Arteurotia tractipennis tractipennis | SRR7174564 | [5] | |
| Austinus heroica | SRR7174561 | [5] | ||
| Bolla brennus | SRR7174539 | [5] | ||
| Carcharodus alceae | SRR7174533 | [5] | ||
| Cornuphallus problematica | SRR7174563 | [5] | ||
| Cyclosemia anastomosis | SRR7174565 | [5] | ||
| Gorgopas trochilus | SRR7174532 | [5] | ||
| Hesperopsis alpheus texana | SRR7174536 | [5] | ||
| Noctuana haematospila | SRR7174535 | [5] | ||
| Pellicia arina | SRR7174570 | [5] | ||
| Pholisora mejicanus | SRR7174538 | [5] | ||
| Polyctor polyctor | SRR7174562 | [5] | ||
| Spialia orbifer | SRR7174534 | [5] | ||
| Staphylus hayhurstii | SRR7174537 | [5] | ||
| Tiana niger | SRR7174566 | [5] | ||
| Viola violella | SRR7174571 | [5] | ||
| Pyrgini | Anisochoria polysticta | SRR7174531 | [5] | |
| Antigonus erosus | SRR7174496 | [5] | ||
| Burnsius albescens | SRR7174499 | [5] | ||
| Burnsius phIletas | SRR7174498 | [5] | ||
| Carrhenes canescens | SRR7174490 | [5] | ||
| Chirgus limbata | SRR7174488 | [5] | ||
| Heliopetes ericetorum | SRR7174500 | [5] | ||
| Heliopetes sublinea | SRR7174501 | [5] | ||
| Plumbago plumbago | SRR7174495 | [5] | ||
| Paches loxus | SRR7174494 | [5] | ||
| Pyrgus malvae | SRR7174492 | [5] | ||
| Pyrgus scriptura | SRR7174487 | [5] | ||
| Pyrgus maculatus | NC_030192 | Unpublished | ||
| Timochreon satyrus | SRR7174493 | [5] | ||
| Trina geometrina | SRR7174491 | [5] | ||
| Xenophanes tryxus | SRR7174489 | [5] | ||
| Zopyrion sandace | SRR7174530 | [5] | ||
| Outgroup | ||||
| Papilionidae | Papilio machaon | NC_018047 | Unpublished | |
| Papilio helenus | NC_025757 | [45] | ||
| Graphium timur | NC_024098 | [46] | ||
| Parnassius apollo | NC_024727 | [47] |
| Species | Whole Genome | PCGs | rRNA | tRNA | A + T-Rich Region | |||||||||||||||
|---|---|---|---|---|---|---|---|---|---|---|---|---|---|---|---|---|---|---|---|---|
| Size (bp) | AT% | AT Skew | GC Skew | Size (bp) | AT% | AT Skew | GC Skew | Size (bp) | AT% | AT Skew | GC Skew | Size (bp) | AT% | AT Skew | GC Skew | Size (bp) | AT% | AT Skew | GC Skew | |
| A. davidii | 15,388 | 81.4 | −0.018 | −0.211 | 1480 | 82.5 | 0.025 | 0.181 | 11,190 | 79.7 | −0.16 | 0.009 | 2121 | 85.2 | 0.028 | 0.327 | 278 | 96.1 | −0.086 | −0.273 |
| Ca. translucida | 15,376 | 82.4 | −0.027 | −0.186 | 1467 | 83 | 0.015 | 0.165 | 11,181 | 80.9 | −0.15 | 0.038 | 2143 | 85.5 | 0.027 | 0.327 | 333 | 96.3 | −0.022 | −0.333 |
| Ce. aspersus | 15,266 | 80.4 | 0.003 | −0.22 | 1458 | 81.7 | 0.013 | 0.184 | 11,178 | 78.9 | −0.146 | 0 | 2165 | 84.6 | −0.016 | 0.373 | 333 | 93.6 | 0.019 | −0.333 |
| E. popoviana | 15,559 | 81.8 | −0.003 | −0.168 | 1465 | 82.1 | 0.013 | 0.172 | 11,190 | 80.3 | −0.146 | 0.032 | 2156 | 86 | 0.009 | 0.307 | 368 | 93 | −0.023 | −0.231 |
| G. phisara | 15,429 | 80.4 | −0.02 | −0.212 | 1467 | 81.5 | −0.001 | 0.14 | 11,199 | 78.6 | −0.151 | 0.003 | 2144 | 85.2 | 0.058 | 0.308 | 391 | 94.9 | −0.024 | −0.2 |
| M. trichoneura | 15,232 | 81.7 | −0.023 | −0.191 | 1465 | 83 | 0.02 | 0.157 | 11,190 | 80.2 | −0.152 | 0.011 | 2162 | 85.2 | 0.015 | 0.312 | 355 | 94.6 | −0.06 | −0.368 |
| P. dan fabia | 15,378 | 81.4 | −0.024 | −0.186 | 1460 | 82.2 | 0.01 | 0.131 | 11,190 | 79.9 | −0.149 | 0.03 | 2151 | 84.7 | 0.018 | 0.331 | 466 | 94.7 | −0.02 | −0.2 |
| Sat. nymphalis | 15,359 | 79.5 | 0.026 | −0.227 | 1481 | 81.2 | 0.024 | 0.151 | 11,190 | 77.5 | −0.149 | 0.01 | 2143 | 84.3 | −0.021 | 0.335 | 332 | 95.2 | 0 | −0.375 |
| T. menaka | 15,294 | 80.2 | −0.012 | −0.215 | 1448 | 81.6 | 0.015 | 0.173 | 11,184 | 78.4 | −0.175 | 0.007 | 2147 | 84.5 | 0.028 | 0.345 | 355 | 94.7 | 0.024 | −0.263 |
| Species | Regions | Size (bp) | T (U) | C | A | G | AT (%) |
|---|---|---|---|---|---|---|---|
| A. davidii | PCGs | 11,190 | 46.2 | 10 | 33.5 | 10.2 | 79.7 |
| 1st | 3730 | 37.7 | 10.1 | 36.7 | 15.5 | 74.4 | |
| 2nd | 3730 | 48.4 | 16.2 | 22.4 | 12.9 | 70.8 | |
| 3rd | 3730 | 52.5 | 3.8 | 41.4 | 2.2 | 93.9 | |
| Ca. translucida | PCGs | 11,181 | 46.5 | 9.2 | 34.4 | 9.9 | 80.9 |
| 1st | 3727 | 38.2 | 9.6 | 36.9 | 15.3 | 75.1 | |
| 2nd | 3727 | 48.6 | 15.8 | 22.7 | 12.9 | 71.3 | |
| 3rd | 3727 | 52.7 | 2.3 | 43.5 | 1.6 | 96.2 | |
| Ce. aspersus | PCGs | 11,178 | 45.2 | 10.6 | 33.7 | 10.6 | 78.9 |
| 1st | 3726 | 36.9 | 10.3 | 37.1 | 15.7 | 74 | |
| 2nd | 3726 | 48.2 | 16.5 | 22.1 | 13.2 | 70.3 | |
| 3rd | 3726 | 50.5 | 4.9 | 41.8 | 2.8 | 92.3 | |
| E. popoviana | PCGs | 11,190 | 46 | 9.5 | 34.3 | 10.2 | 80.3 |
| 1st | 3730 | 38.1 | 9.4 | 37.3 | 15.3 | 75.4 | |
| 2nd | 3730 | 48.3 | 16.4 | 22.3 | 13 | 70.6 | |
| 3rd | 3730 | 51.6 | 2.8 | 43.3 | 2.2 | 94.9 | |
| G. phisara | PCGs | 11,199 | 45.2 | 10.7 | 33.4 | 10.8 | 78.6 |
| 1st | 3733 | 37.1 | 10.1 | 36.9 | 15.9 | 74 | |
| 2nd | 3733 | 48.1 | 16.7 | 22.2 | 13 | 70.3 | |
| 3rd | 3733 | 50.4 | 5.3 | 41 | 3.3 | 91.4 | |
| M. trichoneura | PCGs | 11,190 | 46.2 | 9.8 | 34 | 10 | 80.2 |
| 1st | 3730 | 37.9 | 9.7 | 37.5 | 14.9 | 75.4 | |
| 2nd | 3730 | 48.3 | 15.9 | 22.8 | 13 | 71.1 | |
| 3rd | 3730 | 52.4 | 3.8 | 41.8 | 2.1 | 94.2 | |
| P. dan fabia | PCGs | 11,190 | 45.9 | 9.8 | 34 | 10.4 | 79.9 |
| 1st | 3730 | 37 | 10.2 | 37 | 15.8 | 74 | |
| 2nd | 3730 | 48.2 | 16.4 | 22.3 | 13.1 | 70.5 | |
| 3rd | 3730 | 52.4 | 2.7 | 42.8 | 2.1 | 95.2 | |
| Sat. nymphalis | PCGs | 11,190 | 44.5 | 11.1 | 33 | 11.3 | 77.5 |
| 1st | 3730 | 37.1 | 10.4 | 36.8 | 15.7 | 73.9 | |
| 2nd | 3730 | 48.3 | 16.2 | 22.4 | 13.1 | 70.7 | |
| 3rd | 3730 | 48.2 | 6.7 | 39.8 | 5.3 | 88 | |
| T. menaka | PCGs | 11,184 | 46.1 | 10.7 | 32.3 | 10.9 | 78.4 |
| 1st | 3728 | 37.7 | 10.7 | 35.1 | 16.4 | 72.8 | |
| 2nd | 3728 | 47.9 | 16.8 | 22 | 13.3 | 69.9 | |
| 3rd | 3728 | 52.6 | 4.6 | 39.8 | 3 | 92.4 |
| Species | Acceptor Arm | DHU Arm | Anticodon Arm | TΨC Arm | ||||||||||
|---|---|---|---|---|---|---|---|---|---|---|---|---|---|---|
| G-U | U-U | U-C | G-U | U-U | G-U | U-U | A-C | U-C | A-A | A-G | G-U | A-C | U-U | |
| A. davidii | 5 | 2 | 1 | 3 | 2 | 1 | 2 | 1 | 2 | |||||
| Sat. nymphalis | 3 | 3 | 6 | 3 | 2 | 2 | 1 | |||||||
| M. trichoneura | 3 | 4 | 6 | 2 | 2 | 2 | 1 | 2 | 1 | |||||
| P. dan fabia | 5 | 3 | 3 | 2 | 2 | 2 | ||||||||
| G. phisara | 4 | 2 | 7 | 3 | 3 | 2 | 1 | |||||||
| T. menaka | 5 | 2 | 8 | 5 | 2 | 1 | 1 | 2 | ||||||
| E. popoviana | 4 | 3 | 6 | 1 | 3 | 2 | 1 | 1 | 3 | |||||
| Ca. translucida | 3 | 3 | 6 | 1 | 3 | 2 | 1 | 1 | 1 | |||||
| Ce. aspersus | 6 | 3 | 7 | 1 | 1 | 3 | 2 | 3 | ||||||
| Gene | Size | Intergenic Nucleotides | Codon | Strand | |
|---|---|---|---|---|---|
| Start | Stop | ||||
| T. menaka/A. davidii/Ca. translucida/Ce. aspersus/E. popoviana/G. phisara/M. trichoneura/P. dan fabia/Sat. nymphalis | |||||
| trnM | 68/68/67/68/68/68/69/68/67 | + | |||
| trnI | 64/70/67/64/65/64/64/65/67 | 7/-/-/-/6/8/-/-1/10 | + | ||
| trnQ | 69/69/69/69/69/69/69/69/69 | -3/-3/-3/1/-3/-3/8/-3/9/-3 | - | ||
| nad2 | 1014/1014/1014/1014/1014/1014/1014/1014/1014 | 59/90/97/62/60/66/65/61/62/101 | ATT/ATT/ATT/ATT/ATT/ATT/ATC/ATT/ATC | TAA/TAA/TAA/TAA/TAA/TAA/TAA/TAA/TAA | + |
| trnW | 67/67/68/67/67/67/68/67 | -2/-2/-2/-2/-2/-2/1/-1/-2/-2 | + | ||
| trnC | 67/65/63/66/67/69/66/69/68 | -8/-8/-8/-8/-8/-8/-8/-8/-8/-8 | - | ||
| trnY | 65/66/64/66/65/67/66/65/75 | -/3/8/11/1/1/26/2/3/8 | - | ||
| cox1 | 1531/1531/1531/1531/1531/1531/1531/1531/1531 | 5/3/9/2/5/6/11/8/18/8 | CGA/CGA/CGA/CGA/CGA/CGA/CGA/CGA/CGA | T/T/T/T/T/T/T/T/T | + |
| trnL2 | 67/67/67/67/67/67/70/67/67 | + | |||
| cox2 | 676/673/676/676/679/676/673/676/676 | -/-/-/-/-/-/1/-/-/- | ATT/ATG/ATG/ATG/ATG/ATG/TTG/ATG/ATG | T/T/T/T/T/T/T/T/T | + |
| trnK | 71/71/71/71/71/71/70/71/71 | + | |||
| trnD | 67/73/71/67/69/71/66/67/67 | 7/7/19/22/4/2/7/-/26/17 | + | ||
| atp8 | 168/165/159/162/162/171/159/162/159 | ATC/ATT/ATT/ATT/ATT/ATC/ATC/ATT/ATT | TAA/TAA/TAA/TAA/TAA/TAA/TAA/TAG/TAA | + | |
| atp6 | 678/678/678/678/678/678/678/678/678 | -7/-7/-7/-7/-7/-7/-7/-7/-7/-7 | ATG/ATG/ATG/ATG/ATG/ATG/ATG/ATG/ATG | TAA/TAA/TAA/TAA/TAA/TAA/TAA/TAA/TAA | + |
| cox3 | 786/786/786/786/786/777/786/786/786 | -1/-1/-1/-1/-1/-1/-1/-1/-1/-1 | ATG/ATG/ATG/ATG/ATG/ATG/ATG/ATG/ATG | TAA/TAA/TAA/TAA/TAA/TAA/TAA/TAA/TAA | + |
| trnG | 66/67/68/66/65/66/66/65/67 | 2/2/2/2/2/2/2/2/2/2 | + | ||
| nad3 | 354/354/354/354/354/354/354/354/354 | ATT/ATT/ATT/ATT/ATT/ATT/ATT/ATT/ATT | TAA/TAA/TAA/TAA/TAA/TAA/TAA/TAA/TAA | + | |
| trnA | 64/64/65/66/68/69/65/67/67 | 19/-/17/9/4/16/11/5/6/3 | + | ||
| trnR | 64/67/62/63/63/64/66/67/66 | 7/1/-/-1/1/3/-1/-1/-1/19 | + | ||
| trnN | 66/67/66/66/63/66/65/66/67 | -/6/-/30/-/29/-1/-3/-/-1 | + | ||
| trnS1 | 61/62/62/60/67/61/62/60/62 | 14/9/112/3/3/21/5/4/-/2 | + | ||
| trnE | 66/70/69/68/68/66/66/66/67 | -/9/5/1/9/9/15/2/-/8 | + | ||
| trnF | 67/68/67/63/66/66/67/65/67 | 18/-2/4/22/-2/-2/24/-2/-/-2 | - | ||
| nad5 | 1747/1750/1750/1738/1743/1756/1755/1743/1741 | 2/-/-/-/-/121/-/3/1/- | ATT/ATT/ATT/ATT/ATT/ATA/ATT/ATT/ATA | T/T/T/T/TAA/T/TAA/TAA/T | - |
| trnH | 65/70/72/65/68/67/66/66/68 | - | |||
| nad4 | 1339/1339/1339/1339/1339/1339/1336/1341/1339 | -/-/-/-/-/-/-/-/-1/- | ATG/ATG/ATG/ATG/ATG/ATG/ATG/ATG/ATG | T/T/T/T/T/T/T/TAA/T | - |
| nad4L | 282/282/282/285/285/282/285/285/282 | 2/-/-1/6/2/2/-1/-7/4/-1 | ATG/ATG/ATG/ATG/ATG/ATG/ATG/ATG/ATG | TAA/TAA/TAA/TAA/TAA/TAA/TAA/TAA/TAA | - |
| trnT | 64/65/64/65/66/64/65/64/65 | 8/5/16/50/13/6/2/2/2/5 | + | ||
| trnP | 65/65/65/67/65/66/65/65/66 | - | |||
| nad6 | 522/537/528/531/534/534/531/528/540 | 2/2/2/2/2/2/2/2/2/2 | ATT/ATT/ATA/ATT/ATT/ATC/ATT/ATT/ATA | TAA/TAA/TAA/TAA/TAA/TAA/TAA/TAA/TAA | + |
| cytb | 1152/1146/1149/1152/1152/1149/1152/1152/1152 | 8/-1/7/-1/6/30/-1/-1/-1/7 | ATG/ATG/ATG/ATG/ATG/ATG/ATG/ATG/ATG | TAA/TAA/TAA/TAA/TAA/TAA/TAA/TAA/TAA | + |
| trnS2 | 63/65/68/69/65/66/69/66 | -1/1/6/6/5/-2/4/2/-2/-2 | + | ||
| nad1 | 939/939/939/936/936/942/939/942/942 | -2/17/17/17/17/56/17/19/17/26 | ATG/ATG/ATA/ATA/ATA/ATG/ATT/ATG/ATG | TAG/TAA/TAA/TAA/TAA/TAA/TAA/TAA/TAG | - |
| trnL1 | 67/68/68/68/68/69/68/67/69 | 9/1/1/-/3/3/1/-/-/1 | - | ||
| rrnL | 1359/1347/1359/1386/1379/1367/1390/1377/1363 | 49/18/14/-25/14/21/37/-21/-19/16 | - | ||
| trnV | 65/66/65/66/65/64/68/67/66 | -/-/2/47/1/-/-2/2/-/2 | - | ||
| rrnS | 788/774/784/779/777/777/772/774/780 | -1/-1/-1/-/-1/-/-1/-2/-/-1 | - | ||
Publisher’s Note: MDPI stays neutral with regard to jurisdictional claims in published maps and institutional affiliations. |
© 2022 by the authors. Licensee MDPI, Basel, Switzerland. This article is an open access article distributed under the terms and conditions of the Creative Commons Attribution (CC BY) license (https://creativecommons.org/licenses/by/4.0/).
Share and Cite
Xiao, J.; Liu, J.; Ma, L.; Hao, X.; Yu, R.; Yuan, X. Mitogenomes of Nine Asian Skipper Genera and Their Phylogenetic Position (Lepidoptera: Hesperiidae: Pyrginae). Insects 2022, 13, 68. https://doi.org/10.3390/insects13010068
Xiao J, Liu J, Ma L, Hao X, Yu R, Yuan X. Mitogenomes of Nine Asian Skipper Genera and Their Phylogenetic Position (Lepidoptera: Hesperiidae: Pyrginae). Insects. 2022; 13(1):68. https://doi.org/10.3390/insects13010068
Chicago/Turabian StyleXiao, Jintian, Jiaqi Liu, Luyao Ma, Xiangyu Hao, Ruitao Yu, and Xiangqun Yuan. 2022. "Mitogenomes of Nine Asian Skipper Genera and Their Phylogenetic Position (Lepidoptera: Hesperiidae: Pyrginae)" Insects 13, no. 1: 68. https://doi.org/10.3390/insects13010068
APA StyleXiao, J., Liu, J., Ma, L., Hao, X., Yu, R., & Yuan, X. (2022). Mitogenomes of Nine Asian Skipper Genera and Their Phylogenetic Position (Lepidoptera: Hesperiidae: Pyrginae). Insects, 13(1), 68. https://doi.org/10.3390/insects13010068