Abstract
A spherical hinge structure is a key swivel bridge element that must be considered when evaluating friction characteristics and lubrication properties to meet the rotation requirement. Polytetrafluoroethylene (PTFE)-based spherical hinge sliders and lubrication coating have been employed for over 20 years, but with the growing tonnage of swivel bridge construction, their capacity to accommodate the required lubrication properties can be exceeded. In this manuscript, the optimal friction coefficient of the spherical hinge is obtained through the finite element analysis method. Four lubrication coatings and four spherical hinge sliders are prepared and tested through a self-developed rotation friction coefficient test, four-ball machine test, dynamic shear rheological test, and compression and shear performance test to evaluate the lubrication and friction properties of the spherical hinge structure. The results of the finite element analysis show that the optimum rotation friction coefficient of the spherical hinge structure is 0.031–1.131. The test results illustrate that the friction coefficient, wear scar diameter, maximum non-seize load, phase transition point, and thixotropic ring area of graphene lubrication coating are 0.065, 0.79 mm, 426 N, 14.6%, and 64,878 Pa/s. The graphene lubrication coating has different degrees of improvement compared with conventional polytetrafluoroethylene lubrication coating, showing more excellent lubrication properties, bearing capacity, thixotropy, and structural strength. Compressive and shear tests demonstrate that polyether ether ketone (PEEK) has good compressive and shear mechanical properties. The maximum compressive stress of PEEK is 87.7% higher than conventional PTFE, and the shear strength of PEEK is 6.07 times higher than that of PTFE. The research results can provide significantly greater wear resistance and a lower friction coefficient of the spherical hinge structure, leading to lower traction energy consumption and ensuring smooth and precise bridge rotation.
1. Introduction
The swivel bridge construction method, as an emerging bridge construction technology, is being increasingly employed in bridge construction due to its significant advantages [1,2,3]. Swivel bridge construction technology can adapt to the terrain of the bridge location, erect brackets, and cast them on-site, and then swivel into position through the spherical hinge structure [4]. The construction method is safe and convenient, and eliminates the need for complex high-altitude operations, resulting in clear social and economic advantages [5,6].
As the core structure of the swivel bridge, the spherical hinge structure mainly includes upper spherical hinges, lower spherical hinges, and related components [7,8]. During the rotation process of the bridge, the upper and lower contact surfaces of the spherical hinge structure freely engage and rotate relative to each other under traction [9,10]. The friction characteristics and lubrication properties between the upper and lower spherical hinge structure play a crucial role in determining the energy consumption needed by the traction system and the success of the rotation [11]. Therefore, it is essential to control the friction coefficient of the spherical hinge structure within a low and reasonable range.
The lubrication technology of spherical hinge structures has advanced significantly alongside the progress in material science [12]. In the early stages of swivel bridge development, limited by the material science at that time, the span and tonnage of swivel bridges were small, and concrete was primarily used to construct the spherical hinge structure [13,14,15]. Although concrete-based spherical hinge structures offered significant cost-saving advantages in engineering, they have gradually fallen out of favor in the market due to their high friction coefficient and low shear strength [16,17]. Currently, the spherical hinge structures are produced with steel by professional manufacturers, which are transported to the site and then assembled on-site to reduce the friction coefficient and improve the lubrication of the spherical hinge structure [18,19].
In the current steel-based spherical hinge structures, the combination of lubrication coating and sliders is the key component to achieve lubrication of the spherical hinge structure, as shown in Figure 1. The sliders are installed in the groove of the lower spherical hinge and securely locked. It is then coated with a lubrication coating and remains in free contact with the upper spherical hinge. Currently, this lubrication form and technology are relatively mature in engineering practice, but there is a lack of relevant technical standards.
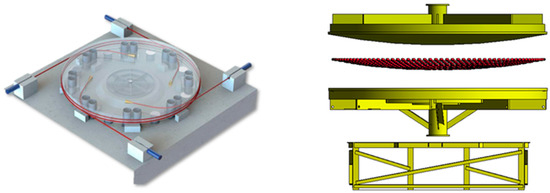
Figure 1.
Spherical hinge structure.
The spherical hinge slider is primarily composed of polytetrafluoroethylene (PTFE), while the lubrication coating typically consists of butter mixed with PTFE powder. The material composition of the lubrication coating and slider has been in use for decades since the production of steel-based spherical hinges. However, with the increasing tonnage of swivel bridges, the original lubrication coating and slider materials have started to exhibit shortcomings and are unable to meet the corresponding lubrication requirements, as outlined below:
- (1)
- Although the PTFE slider exhibits a low friction coefficient, its compression and shear properties are relatively poor and cannot meet the requirements of swivel bridges with gradually increasing tonnage;
- (2)
- The wear resistance of the PTFE slider is inadequate, and wear on its surface during rotation significantly impacts the lubrication effectiveness of the spherical hinge slider;
- (3)
- The processing accuracy of the PTFE slider is difficult to control, which further affects the installation accuracy and causes unnecessary losses;
- (4)
- Butter mixed with PTFE powder has poor wear resistance, extreme pressure and dispersibility, and cannot meet the lubrication requirements of swivel bridges with gradually increasing tonnage.
Therefore, exploring the friction characteristics and lubrication properties of spherical hinge structures and selecting superior lubrication coating and slider material have gradually become urgent needs in swivel bridge engineering. At present, there is no research on novel materials of spherical hinge lubrication coatings and sliders, but wear-resistant materials and technologies used in bridge-bearing sliding have made major breakthroughs and developments [20].
Ala et al. investigated ultra-high molecular weight polyethylene (UMWP) and glass-filled reinforced PTFE (GFR-PTFE) as bridge-bearing sliding. The tests confirmed that both UMWP and GFR-PTFE can provide considerably greater wear resistance compared with conventional plain PTFE, and can be used to increase service life when sliding surfaces are subject to high movement speed and high contact pressure [21]. Quaglini et al. developed and proposed a special sliding material, Xlide (R), to replace PTFE in bridge bearings. The tests carried out on the special material show that lubricated with silicon grease, Xlide (R) can support larger pressure levels and sustain longer ac-cumulated sliding paths than PTFE does, and has a low coefficient of friction even at very low temperatures, out of the range of the application of PTFE [22]. Deng et al. investigated the wear resistance of bridge bearings made from ultra-high molecular weight polyethylene (UHMWPE) composite material. Test results showed that the mechanical properties, prominent, creep resistance, and wearing resistance of UHMWPE composite material are better than PTFE, so it is an ideal wear composite material for high-speed railways and highway bridge bearings [23]. Dorafshan explored the coefficient of friction of bridge-bearing pads. Test results illustrated that unlubricated and graphite-lubricated surfaces resulted in very high friction values, whereas the values for soap, grease, and oil were comparably lower. The oil and grease tests gave the lowest friction values, 0.90–4.04%, and 0.67–5.15%, for the studied contact pressures, respectively, and are recommended for future use [24].
In this manuscript, lubrication and friction properties of spherical hinge structure are investigated comprehensively from two aspects of spherical hinge lubrication coatings and sliders. Firstly, the optimal friction coefficient of the spherical hinge is explored through the finite element analysis method. Secondly, four lubrication coatings are prepared and tested by a self-developed rotation friction coefficient test, four-ball machine test, and dynamic shear rheological test to evaluate the lubrication property. Moreover, four spherical hinge sliders are prepared and tested by a compression performance test and shear performance test. The research results can provide significantly greater wear resistance and lower friction coefficients of spherical hinge structures, leading to lower traction energy consumption and ensuring smooth and precise bridge rotation. This provides technical support for swivel bridges to transition towards larger tonnages.
2. Materials
2.1. Lubrication Coating
Spherical hinge lubrication coating consists of base grease and additives. At present, lithium base grease mixed with polytetrafluoroethylene powder is usually selected due to its excellent moisture resistance, extreme pressure, wear, and rust resistance. The base grease used in this manuscript is a lithium base grease produced by Sinopec Lubrication Oil Company (Chongqing, China), and its technical parameters are shown in Table 1. Polytetrafluoroethylene powder was obtained from Fude Plastics Co., Ltd. (Mianyang, China), and the technical parameters are shown in Table 2.

Table 1.
Technical parameters of lithium base grease.
Table 2.
Technical parameters of polytetrafluoroethylene powder.
In order to improve the friction resistance and environment adaptability of spherical hinge lubrication coating, graphene, carbon nanotubes, and tungsten disulfide were selected as additives. Graphene, carbon nanotubes, and tungsten disulfide were obtained from Hongdachang Evolution Technology Co., Ltd. (Ganzhou, China) and Huajing Powder Material Co., Ltd. (Changsha, China), and the technical parameters are shown in Table 3.
Table 3.
Technical parameters of lubrication coating additives.
To improve the dispersion of additive powder, polyisobutylene butadiene imine dispersant was adopted for spherical hinge lubrication material. The spherical hinge lubrication material preparation procedure is detailed as follows.
Step 1: Heat the base grease to 25 °C for 30 min, mix different proportions of additives directly into the base grease, and manually stir for 5 min.
Step 2: Mix the polyisobutylene butadiene imine dispersant into the lubrication material, and immediately grind the base grease containing additives and polyisobutylene butadiene imine dispersant 4 times on a three-roll machine.
Four spherical hinge lubrication materials, polytetrafluoroethylene spherical hinge lubrication, graphene spherical hinge lubrication material, carbon nanotube spherical hinge lubrication, and tungsten disulfide spherical hinge lubrication material, are named PTG, GPG, CNG, and TDG, respectively.
2.2. Spherical Hinge Slider
As the key component of spherical hinge structure, sliders require sufficient pressure bearing capacity, shear resistance, lubrication, and wear resistance. At present, solid PTFE is commonly used for spherical hinge slider preparation. However, the PTFE slider has been applied for many years, and with the continuous increase in swivel bridge tonnage, higher demands are put forward for the compression and shear properties of the spherical hinge slider. In this manuscript, solid polyphenyl sulfide, polyether ether ketone, and ultra-high molecular weight polyethylene were used for spherical hinge sliders, which are defined as PPS, PEEK, and UHMWPE. The PTFE, PPS, PEEK, and UHMWPE sliders were produced from Yingshen Plastic Co., Ltd. (Yingkou, China), Yuanhua Insulation Material Co., Ltd. (Dongguan, China). The technical properties of four slider materials are presented in Table 4.
Table 4.
Technical parameters of spherical hinge sliders.
3. Methods and Laboratory Tests
3.1. The Finite Element Method
3.1.1. Swivel Bridge Description
This study primarily focuses on the swivel bridge of the Xingfu highway which crosses the existing Beijing–Harbin railway. The Beijing–Harbin railway is a Ⅰ—Class line connecting Beijing and Harbin in China. It is also one of the important passenger train channels between China and Russia. Due to the fact that a tremendous amount of traffic can only be interrupted for a short time during the construction process, the swivel bridge construction method for the Xingfu highway was selected eventually. The swivel bridge is a 50 m + 50 m prestressed concrete box girder with a variable height T-shaped rigid frame, and the total weight is about 12,157.5 t. The rotation speed of the swivel bridge is designed to be 0.02 rad/min, the rotation angle is 81.6°, and the rotation procedure takes 71.2 min. The swivel bridge design is shown in Figure 2.

Figure 2.
Swivel bridge of Xingfu highway which crosses the existing Beijing–Harbin railway.
The swivel bridge is composed of a lower bearing table, spherical hinge, upper bearing table, superstructure, and traction system. The lower bearing table is the foundation supporting all the weight of the rotation structure. The lower bearing table, spherical hinge, and upper bearing table jointly form the bridge foundation after the rotation process. The lower bearing table is made of C50 concrete, and embedded with a lower spherical hinge, safety support feet, circular slider, and jack pads of the traction system. The spherical hinge structure has a diameter of 3900 mm and a thickness of 40 mm. The spherical hinge structure is divided into upper and lower pieces and is prepared with Q345 steel. The length and width of the upper bearing table are both 14 m, and the height is 3 m. The diameter of the turntable is 1080 cm, and the height is 80 cm.
3.1.2. Model Parameters
According to the design of the swivel bridge, the material of the main beam and main pier is C50 concrete, and the upper and lower turntables are also made of C50 concrete. Q345 steel was selected as the material of the upper and lower spherical hinge structure, and the sliders were prepared through a hydraulic reverse die of PTFE. The nonlinear elastic constitution model was selected for all materials in this manuscript, and the technical parameters of the material are shown in Table 5.
Table 5.
Technical parameters of materials of swivel bridge.
3.1.3. Swivel Bridge Model Establishment
The friction characteristics and lubrication properties of the spherical hinge structure significantly impact the rotation process. A higher friction coefficient of a spherical hinge structure can increase energy costs for bridge rotation and potentially lead to rotational difficulties. Conversely, a lower friction coefficient can hinder normal bridge rotation, making the superstructure unstable and prone to overturning or collapse, so it is very critical to maintain the friction coefficient of the spherical hinge structure in a low and safe range. Therefore, the paper established a vertical and deflective swivel bridge model for investigating the optimal friction coefficient of the spherical hinge structure, as is shown in Figure 3. To ensure solution convergence and calculation accuracy, finer meshing was applied near the slider in the spherical hinge, while coarser meshing was used farther away. The solid units utilized were Penta6 and Hex8, totaling 177,988 units.
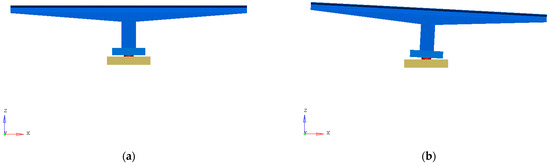
Figure 3.
Vertical and deflective swivel bridge model establishment. (a) Vertical swivel bridge model. (b) Deflective swivel bridge model.
3.2. Rotation Friction Test
Due to the heavy load, slow rotation speed, and large rotation plane of the spherical hinge structure, strict requirements are placed on the friction and wear characteristics of spherical hinge lubrication coating. The rotation friction performance of four spherical hinge lubrication coatings was investigated through a self-developed rotation friction coefficient test and four-ball machine test.
The self-developed rotation friction coefficient test (Figure 4) was adopted for measuring the interface friction coefficient of laboratory horizontal rotation spherical hinges. The self-developed rotation friction coefficient test adopts a modular design, including a spherical hinge structure, loading system, and traction system, which can characterize more accurately and reliably the friction state of lubrication coatings during the actual swivel process. In order to control the spherical hinge lubrication coating film thickness, the optimal oil film thickness of lubrication coatings was explored through a self-developed rotation friction coefficient test. The experimental results show that the optimal oil film thickness of lubrication coatings is 0.7 mm.

Figure 4.
Rotation friction coefficient test and four-ball machine test. (a) Rotation friction coefficient test. (b) MRS 10 four-ball machine test.
Four-ball machine test was adopted for obtaining the wear spot diameter, average friction coefficient, maximum non-bite load, and wear scar diameter of four lubrication coatings. The MRS 10 four-ball machine used in this manuscript was produced through Yihua Electromechanical Co., Ltd. (Hangzhou, China). The test applied pressure was 147 Pa, the torque was 1 Nm, the speed was 1450 r/min, and the temperature was 75 °C. After the experiment, the final wear spot diameter was measured by a CMM-20 digital microscope. The MRS 10 four-ball machine is shown in Figure 4.
3.3. Rheological Performance Test
The flow and deformation ability of lubrication coatings under external forces is called the rheological properties of lubrication coatings. The rheological properties of lubrication coatings determine the load-bearing capacity and lubrication characteristics. In this manuscript, the MCR 302 Rheometer was employed for research. The plate rotation mode was adopted for the thixotropic performance evaluation, the plate spacing was 1 mm, and the shear rate gradually increased from 0.01 s−1 to 500 s−1. After constant shear, the shear rate gradually decreased from 500 s−1 to 0.01 s−1. The storage modulus and loss modulus were measured through a plate oscillation model with a testing spacing of 1 mm, and a shear deformation of 0.01–150%.
3.4. Mechanical Property Test
To ensure the smooth and safe rotation of the swivel bridge, the contact between the sliders and the upper-lower spherical hinge is crucial. During the construction of a swivel bridge, the force exerted on the sliders is mainly a normal pressure perpendicular to the surface of the sliders. During the rotation, the sliders are subjected to a tangential shear stress due to the relative frictional motion between the upper and lower spherical hinge. Moreover, dry friction may be generated between the upper spherical hinge and sliders during the rotation, due to uneven application and compression loss of lubrication coatings. This dry friction can lead to excessive local friction, severe wear, and failure of the sliders, which has a negative impact on the smooth rotation of the swivel bridge, so the compressive strength, shear resistance, and wear resistance of sliders are vitally important.
In this paper, an electronic universal pressure testing machine (INSTRON 5985, Figure 5) was adopted for evaluating the static compression and shear performance of several slider materials. Through analyzing the stress–strain relationship curves of slider materials, the quasi-static compressive and shear mechanical properties of sliders can be obtained, which can provide guidance and reference for the selection of slider material in practice.
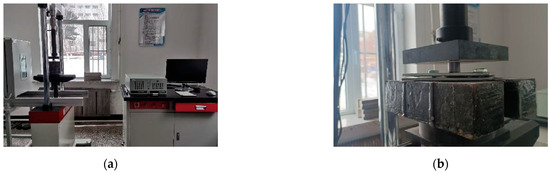
Figure 5.
Mechanical property test of spherical hinge slider. (a) Compression performance test. (b) Shear performance test.
4. Results and Discussion
4.1. Numerical Analysis Results
When the deflection angle is 4°, the deflection instability of the swivel bridge occurs based on FEM, which indicates that the deflection angle of the upper structure should be controlled within 4° during the actual rotation process. Von Mises stress nephograms of the swivel bridge with 0°, 1°, 2°, and 3° deflection angles are shown in Figure 6.

Figure 6.
Von Mises stress nephogram of swivel bridge with different deflection angles.
From Figure 6, it is evident that the maximum Von Mises stress of the swivel bridge with different deflection angles was generated on the spherical hinge, and it increased significantly with the increase in the deflection angle. This showed that the spherical hinge structure could perceive the deflection state of the swivel bridge. When the deflection angle was 0°, the mechanical characteristics of the spherical hinge structure were uniform and distributed in layers. As shown in Figure 7, the maximum Von Mises stress of the spherical hinge structure was 17.84 MPa.

Figure 7.
Von Mises stress nephograms of the spherical hinge with different deflection angles.
Von Mises stress nephograms of the spherical hinge with different deflection angles are shown in Figure 7.
When the swivel bridge deflected, the mechanical characteristics of the spherical hinge structure changed, and the maximum Von Mises stress was generated on the side of the rotation central axis of the spherical hinge structure. At deflection angles of 1°, 2°, and 3°, the maximum Von Mises stress of the swivel spherical hinge structure was 22.87 MPa, 29.64 MPa, and 39.73 MPa, respectively, which was 28.2%, 66.1%, and 122.7% higher than before deflection. The maximum stress changed greatly when the deflection angle shifted from 2° to 3°. At a deflection angle of 3°, the maximum stress of the upper spherical hinge structure’s concrete was 39.76 MPa, slightly exceeding the allowable stress of the concrete compressive strength of 50 × 0.75 = 37.5 MPa. In this scenario, the structure was already in a dangerous state, and the deflection angle should be controlled within 3° during the rotation process. Due to the center of gravity shift caused by the upper structure’s deflection, eccentric pressure was generated on the surface of the upper turntable, and gradually increased with the deflection angle’s increase.
Contact pressure nephograms of a lower spherical hinge with different deflection angles are shown in Figure 8.

Figure 8.
Contact pressure nephograms of a lower spherical hinge with different deflection.
From Figure 8, it is observed that the maximum contact pressure of a spherical hinge with different deflection angles was generated at the edge of the contact between the upper spherical hinge and the lower spherical hinge, and gradually increased with the deflection angle’s increase. At the deflection angles of 1°, 2°, and 3°, the maximum contact force of the spherical hinge interface was 32.95 MPa, 40.01 MPa, and 53.55 MPa, respectively, representing a 54.9%, 88.1%, and 151.8% increase compared to before deflection. As the deflection angle increased, the contact pressure on the right side of the lower spherical hinge gradually increased, while the contact pressure on the left side gradually decreased, potentially indicating a center of gravity shift of the upper structure.
Through the analysis of the friction force of the lower spherical hinge in both the longitudinal and the transverse direction at different deflection angles, it can be found that the longitudinal friction force was negative, opposing the deflection direction, serving as the anti-overturning force of the swivel bridge. The transverse bridge friction force of the lower spherical hinge exhibited symmetrical distribution, equal in magnitude and opposite in direction, indicating that the solution model did not exhibit deflection in the transverse bridge direction.
In order to prevent such deflection accidents, supporting feet are set on the outer ring of the spherical hinge. They can contact the base and transfer the eccentric pressure of the deflection bridge. In this manuscript, the simplified mechanical analysis diagram of the deflection swivel bridge is drawn in Figure 9.

Figure 9.
Swivel bridge and spherical hinge structure.
When the deflection angle was θ, the supporting feet just contacted the lower pile cap. As the deflection angle exceeded θ, the supporting feet contacted the lower file cap, and also provided a force to resist the overturning of the upper structure. The value of θ, approximately 0.616°, was calculated based on the spatial position of different components of actual engineering. At a deflection angle of 0.616°, the supporting feet contacted the lower pile cap, and the friction moment of the lower spherical hinge with different friction coefficients was obtained based on the FEM, as shown in Table 6.
Table 6.
The friction moment of the lower spherical hinge with different friction coefficients.
It can be seen from Table 6 that the average friction force of the spherical hinge slider gradually increased with the increasing friction coefficient, resulting in an increase in the friction moment. When the friction coefficient reached 0.01 or 0.02, the upper structure of the swivel bridge was overturned. This indicated that the friction force of the lower spherical hinge was not sufficient to support the stability of the upper structure when the friction coefficient was 0.01 or 0.02. At a deflection angle of 0.616° for the upper structure, the center of mass had shifted, with coordinates X: 61.00701, Y: 3.060855 × 10⁻⁴, Z: 1.448855 × 10⁴, and the gravitational deflection moment of the upper structure could be calculated as Mp = G × L = 7.28 × 10³ KN·m. The ratio of the friction moment of the spherical hinge structure to the gravitational deflection moment of the upper structure under different friction coefficients is shown in Figure 10.

Figure 10.
Mp/Mf of the spherical hinge with different friction coefficients.
It can be seen from Figure 10 that the ratio of the deflection moment to the friction moment changed with the variation in the friction coefficient. When this ratio equaled 1, the corresponding friction coefficient was 0.031. It demonstrated that the minimum friction coefficient required to maintain the stability of the deflected bridge is 0.031.
As the friction coefficient increased, the friction moment of the rotational spherical hinge also increased, leading to improved stability of the bridge but requiring a higher rotation traction. However, an excessive friction coefficient could lead to unbalanced traction during the rotation process, resulting in rotational angular acceleration of the swivel bridge and potentially causing the beam balance to break more easily. Therefore, it is recommended to keep the friction coefficient of the spherical hinge structure within a reasonable range. Based on the above discussion, the range of the friction coefficient is defined as 0.1, so the optimum theoretical rotational friction coefficient of the spherical hinge structure is 0.031–1.131.
4.2. Rotation Friction Test Results
Rotation friction coefficient test results of four spherical hinge lubrication coatings samples are shown in Figure 11.

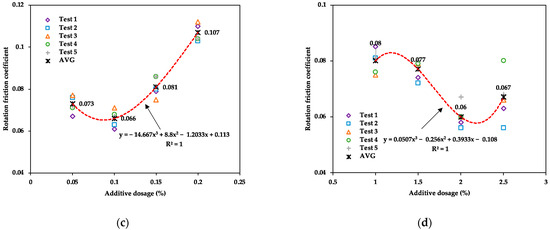
Figure 11.
Rotation friction coefficient test results of four spherical hinge lubrication coatings. (a) PTG. (b) GPG. (c) CNG. (d) TDG.
It can be seen from Figure 11 that the rotation friction coefficient of four spherical hinge lubrication coatings initially decreased and then increased with the increase in lubrication additive content. Through fitting the regression, the optimal content of four lubrication additives, namely polytetrafluoroethylene powder, graphene, carbon nanotubes, and tungsten disulfide, is 1.0%, 0.1%, 0.1%, and 2.3%, respectively.
Comparatively, it can be seen that only a small amount of graphene or carbon nanotubes is required to achieve a better lubrication effect compared to polytetrafluoroethylene powder and tungsten disulfide. Furthermore, the standard error of the five sets of parallel test results was within 7.9%, ensuring the accuracy and reliability of the results.
4.3. Four-Ball Machine Test Results
The friction coefficient test results of four spherical hinge lubrication coatings samples are shown in Figure 12 and Table 7.

Figure 12.
Friction coefficient test results of four spherical hinge lubrication coatings.
Table 7.
Friction parameters of four spherical hinge lubrication coatings.
It can be seen from Figure 12 and Table 7 that the friction coefficient of GPG was smallest at 0.065, while PTG exhibited the highest friction coefficient among the several lubrication coatings at 0.072, marking a 9.1% increase compared to GPG. Moreover, the friction coefficients of CNG and TDG were relatively close, both around 0.068, which was 5.6% lower than that of PTG.
Regarding the wear scar diameter, PTFE showed the largest value at 0.848 mm, while GPG had the smallest wear scar diameter among the materials at 0.79 mm, marking a 16% reduction compared to PTG. Furthermore, the wear scar diameters of TDG and CNG were 0.775 mm and 0.790 mm, which were 9.4% and 7.3% smaller than PTG, respectively.
In summary, the GPG, TDG, and CNG spherical hinge lubrication coatings exhibited lower friction coefficients and wear scar diameters compared to PTG, indicating lubrication performance. Particularly, GPG demonstrated the best wear resistance among the coatings. The standard error of the five sets of parallel test results is within 6.8%, ensuring the accuracy and reliability of the findings.
Analysis from Figure 13 revealed several observations about the lubrication coatings. CNG lubrication coating exhibited discoloration compared with other coatings, attributed to the generation of friction heat on its surface. PTG, on the other hand, displayed relatively high surface roughness and numerous surface scratches, likely resulting from the movement of friction particles during the friction process. This also indicates that the PTG lubrication coating is relatively rough. There are many small scratches on the friction surface of TDG, and a part of the coating surface is peeled off, indicating that the viscosity of TDG is relatively high.
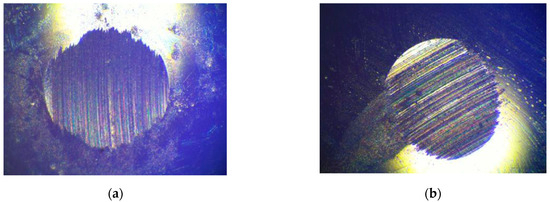
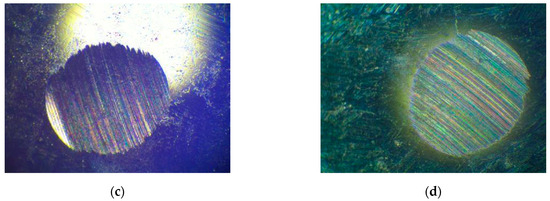
Figure 13.
Friction microscopic morphology of four spherical hinge lubrication coatings. (a) PTG. (b) GPG. (c) CNG. (d) TDG.
The maximum non-seize load of four spherical hinge lubrication coating samples is shown in Figure 14 and Table 8.

Figure 14.
Maximum non-seize load of four spherical hinge lubrication coatings. (a) PTG. (b) TDG. (c) GPG. (d) CNG.
Table 8.
Maximum non-seize load of four spherical hinge lubrication coatings.
The PB index refers to the maximum load at which a steel ball does not seize under a lubrication environment at a certain temperature and speed. The PB value represented the level of load prior to a sudden change in the diameter of the steel ball’s wear spot. The higher the PB value, the better the lubrication performance of the lubrication coatings. As is shown in Figure 14 and Table 8, the GPG, TDG, and CNG spherical hinge lubrication coatings had higher maximum non-seize loads than PTG. The maximum non-seize load of PTG and GPG is 421.5 N and 455.5 N, respectively. The maximum non-seize load of GPG is 8.1% higher than that of PTG. The PB value of TDG is the largest among several coatings, 480 N, which is 13.9% higher than PTG. The PB value of CNG is 460.5 N, which is 9.3% higher than PTG. The test results indicate that the load-bearing capacity of GPG, TDG, and CNG spherical hinge lubrication coatings are improved in different degrees compared with PTG, and the TDG spherical hinge lubrication coating has the most outstanding load-bearing capacity.
4.4. Rheological Performance Test Results
The thixotropic test results of four spherical hinge lubrication coatings samples are shown in Figure 15.

Figure 15.
Thixotropic test results of four spherical hinge lubrication coatings. (a) PTG. (b) GPG. (c) CNG. (d) TDG.
The ability of lubrication coating to flow or deform under external forces is termed its rheological properties. As a non-Newtonian fluid, lubrication coating exhibits complex rheological properties. Under low temperatures and small loads, the lubrication coating can maintain a fixed form without flowing. However, at high temperatures or when shear stress reaches the yield stress, the lubrication coating transforms from semi-solid to semi-fluid, initiating flow.
The rheological properties of lubrication coating are crucial as they determine load-bearing capacity and lubrication performance. As can be seen from Figure 15, the thixotropic ring of PTG is the largest, followed by GPG, TDG, and CNG spherical hinge lubrication coatings, with CNG exhibiting the smallest thixotropic ring. The test results indicate that PTG has poor thixotropic performance, while GPG, TDG, and CNG show better thixotropic properties, with CNG displaying the best thixotropic properties.
When subjected to shear stress, the highly intertwined soap fibers forming the surface microstructure of the material may experience knot failure or fiber fracture, leading to a significant decrease in the lubrication coating’s viscosity. Upon removing the shear stress, the original damaged structure can recover to some extent through recombination, but this recoverability is limited and depends on the speed of soap fiber recombination within the microscopic skeleton. Test results demonstrate that CNG lubrication coating has the best recovery speed.
Dynamic shear rheological test results of four spherical hinge lubrication coatings samples are shown in Figure 16.

Figure 16.
Dynamic shear rheological test results of four spherical hinge slider samples. (a) PTG. (b) GPG. (c) CNG. (d) TDG.
The storage modulus (G’) and loss modulus (G”), respectively, represent the viscoelastic properties of the lubrication coating. The storage modulus signifies the elastic performance, while the loss modulus indicates the viscosity performance. When G’ > G”, the lubrication coating primarily exhibits recoverable elastic characteristics and lubrication performance. When G’ = G”, the dynamic phase transition point of lubrication coating is reached, transitioning gradually from a semi-fluid state to a fluid state. The shear stress at the intersection can represent the structural strength of the lubrication coating. When G’ < G”, the lubrication coating mainly displays irreversible viscosity properties.
Figure 16 illustrates that the storage modulus (G’) and loss modulus (G”) of four spherical hinge lubrication coatings decrease gradually with increasing strain. After passing through a linear viscoelastic region, all four spherical hinge lubrication coatings enter a nonlinear viscoelastic region. The storage modulus and loss modulus are completely intersected, indicating a phase transition point where the semi-fluid state of lubrication coating shifts to a fluid state. Prior to this point, the storage modulus of the lubrication coating was generally higher than the loss modulus, emphasizing elasticity. After the phase transition point, the loss modulus surpasses the storage modulus significantly, emphasizing viscous properties.
Analyzing the structural strength of the lubrication coatings at the same temperature reveals that PTG has the lowest structural strength compared to both CNG and TDG, while GPG exhibits the highest structural strength. When the strain rates for PTG, GPG, CNG, and TDG are 8.8%, 12.7%, 13.5%, and 12.2%, respectively, the storage modulus curve and the loss modulus curve intersect. This indicates that the phase transition point of PTG among these lubrication coatings is closest to the left, implying its elastic recovery is the poorest.
The apparent viscosity of four spherical hinge lubrication coatings samples under shear conditions is shown in Figure 17.

Figure 17.
Apparent viscosity of four spherical hinge lubrication coatings samples.
The molecules of lubrication coating form a stable spatial structure through hydrogen bonding and Van der Waals force connection. Lubrication coatings prepared with different molecular groups form different intermolecular forces and spatial structures. It can be observed in Figure 17 that the apparent viscosity of the four spherical hinge lubrication coatings decreases as the shear time gradually increases. TDG exhibited the highest apparent viscosity among the lubrication coatings, while PTG had the lowest apparent viscosity. Specifically, when the shear time was 300 s, the apparent viscosity of PTG and TDG was 1.67 Pa·s and 1.85 Pa·s, respectively. The apparent viscosity of TDG was 10.8% higher than that of PTG. The apparent viscosity of GPG was 1.78 Pa·s, which was 6.6% higher than PTG. The apparent viscosity of CNG was 1.76 Pa·s, which was 5.4% higher than PTG. Test results indicate that the viscosity performance of GPG, CNG, and TDG is superior to that of PTG.
4.5. Mechanical Property Test Results
Quasi-static compression test results of four spherical hinge slider samples are shown in Figure 18.
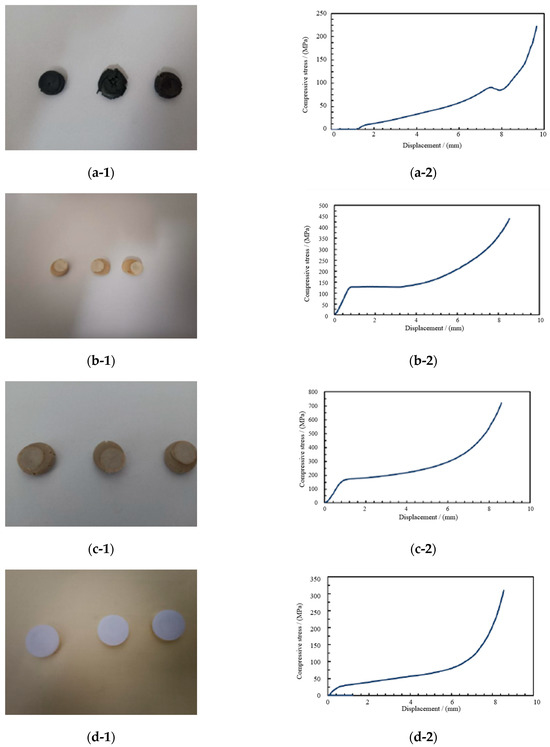
Figure 18.
Compressive property test results of four spherical hinge slider samples. (a-1) Compressive failure of PTFE. (a-2) Stress–displacement curve of PTFE. (b-1) Compressive failure of PPS. (b-2) Stress–displacement curve of PPS. (c-1) Compressive failure of PEEK. (c-2) Stress–displacement curve of PEEK. (d-1) Compressive failure of UWHPEF. (d-2) Stress–displacement curve of UWHPEF.
As observed from compressive failure morphology, the four spherical hinge slider samples underwent significant deformation and exhibited a flattened cake-like form after compression failure. PTFE displayed several obvious and large cracks after the compression failure, appearing in a scattered state, indicating poor viscosity under ultimate pressure and insufficient plasticity, and potentially hindering the smooth rotation of the swivel bridge after the compressive failure of sliders. Conversely, PPS and UWHPEF showed no obvious cracks after compression failure, maintaining a relatively smooth surface, suggesting good adhesive properties and strong plasticity. Even after enduring ultimate pressure loads, failed PPS and UWHPEF sliders may still retain some shape and structural integrity.
PEEK also exhibited cracks after compression, but its overall shape remained intact with a relatively smooth surface. Compared with the compressive failure morphology, PPS, UWHPEF, and PEEK are more conducive to the safe and smooth rotation of bridges than PTFE sliders.
Examining the stress-strain curves of four spherical hinge slider samples, it is evident that the maximum compressive stress of PTFE was 91.l MPa. The maximum compressive stress of UWHPEF is 120.3 MPa, which is 32.1% higher than PTFE. PPS demonstrated a maximum compressive stress of 127.8 MPa, marking a 40.3% increase over PTFE. PEEK showcased a maximum compressive stress of 171 MPa, an 87.7% surge over PTFE. Notably, all four materials met the specification for maximum compressive stress.
The pressure resistance properties of PPS, UWHPEF, and PEEK were improved compared with conventional PTFE sliders. However, considering the failure form and compression deformation, UWHPEF’s smoother surface comes with significant deformation post-compression, necessitating very high UWHPEF sliders, which is not conducive to construction and rotation. On the other hand, PEEK, being the hardest material, maintains good surface morphology after compression, meeting the rotation requirements of large tonnage swivel bridges. PEEK slider can remain in the linear elastic working stage under maximum stress, which is an ideal compressive slider for swivel bridges.
Quasi-static shear property test results of four spherical hinge slider samples are shown in Figure 19.
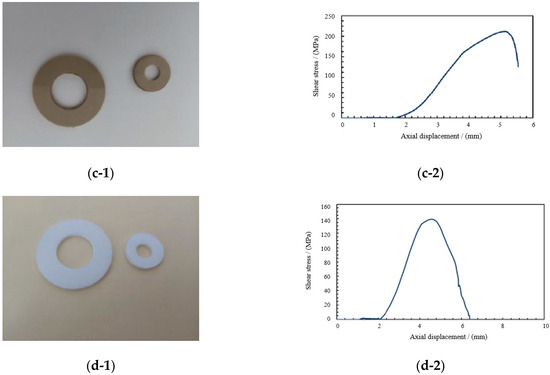
Figure 19.
Shear property test results of four spherical hinge slider samples. (a-1) Shear failure of PTFE. (a-2) Stress–displacement curve of PTFE. (b-1) Shear failure of PPS. (b-2) Stress–displacement curve of PPS. (c-1) Shear failure of PEEK. (c-2) Stress–displacement curve of PEEK. (d-1) Shear failure of UWHPEF. (d-2) Stress–displacement curve of UWHPEF.
As shown in Figure 19, it can be seen that the shear resistance of the PEEK slider was better than that of PTFE. The shear strength of PEEK was 215 MPa, which was 6.07 times higher than that of PTFE. PEEK had a hard texture and a smooth fracture, making it an ideal slider material for extreme shear requirements of large tonnage swivel bridges. Compared with PTFE, the shear strength of UWHPEF also had a certain improvement, reaching 139 MPa, which was 3.93 times the shear strength of PTFE. However, from the perspective of damage form, the texture of UWHPEF was soft, and it could be pushed out during the shear process, damaging the overall structure of the slider and hindering the normal and orderly rotation of the swivel bridge. The shear resistance of PPS was higher than PTFE, up to 132 MPa, which was 3.39 times that of PTFE. The shear deformation of PPS material was better than that of PTFE, but there was still a possibility of warping, hindering the rotation procedure. It could be concluded that the shear strength of PPS, UWHPEF, and PEEK was much higher than that of PEEK, and PEEK was more suitable for large tonnage bridges to improve the shear resistance of sliders.
5. Conclusions
PTFE has been the state-of-the-art material for spherical hinge slider and lubrication coating for over 20 years, due to its exceptionally low friction. However, recent advancements in bridge design and the growing tonnage of swivel bridge construction have imposed more stringent requirements on friction characteristics and lubrication properties that are no longer matched by PTFE. Therefore, four lubrication coatings and spherical hinge slider materials were developed and proposed to replace PTFE in a spherical hinge structure. The research results can provide significantly greater wear resistance and lower friction coefficient of spherical hinge structure, leading to lower traction energy consumption and ensuring smooth and precise bridge rotation. This provides technical support for swivel bridges to transition towards larger tonnages. The main conclusions are as follows.
- (1)
- The finite element analysis of the swivel bridge illustrated that the optimum theoretical rotation friction coefficient of the spherical hinge structure was 0.031–1.131, which was approximately consistent with the results of the rotation friction coefficient test;
- (2)
- The self-developed rotation friction coefficient test results showed that the optimal content of four lubrication additives, namely polytetrafluoroethylene powder, graphene, carbon nanotubes, and tungsten disulfide, was 1.0%, 0.1%, 0.1%, and 2.3%, respectively;
- (3)
- The four-ball machine test results indicated that the friction coefficient of GPG was 9.1% lower than that of PTG, and the maximum non-seize load of GPG was 8.1% higher than that of PTG. Adding a small amount of graphene to the base grease could reduce the friction coefficient and increase the wear resistance of lubrication coating;
- (4)
- The rheological performance test results showed that the apparent viscosity of GPG was 1.78 Pa·s, which was 6.6% higher than PTG. The strain at the phase transition point of GPG was 12.7%, which was 8.8% higher than PTG, and had better rheological properties and thixotropic performance. GPG is an ideal lubrication coating for swivel bridges;
- (5)
- Compressive and shear property test results demonstrated that the maximum compressive stress of PEEK was 171 MPa, which was 87.7% higher than PTFE, and the shear strength of PEEK was 215 MPa, 6.07 times higher than that of PTFE. PEEK exhibits good compressive and shear properties, making it suitable for sliders of large span and large tonnage swivel bridges.
Author Contributions
Data curation, Z.C.; formal analysis, Y.L.; funding acquisition, Y.G.; investigation, Y.L., X.H. and Z.C.; methodology, W.G.; project administration, Y.G.; Resources, X.H.; software, Y.L. and W.G.; supervision, X.H.; writing—original draft, Y.L. and Z.C.; writing—review and editing, Y.G. All authors have read and agreed to the published version of the manuscript.
Funding
This research was funded by the Science and Technology Plan of the Shandong Transportation Department (Grant No. 2023B25) and National Key R&D Program of China (Grant No. 2021YFB2600600).
Data Availability Statement
The raw data supporting the conclusions of this article will be made available by the authors on request.
Conflicts of Interest
The authors declare that they have no known competing financial interests or personal relationships that could have appeared to influence the work reported in this paper.
References
- Feng, Y.; Qi, J.N.; Wang, J.Q.; Zhang, W.X.; Zhang, Q.F. Rotation construction of heavy swivel arch bridge for high-speed railway. Structures 2020, 26, 755–764. [Google Scholar] [CrossRef]
- Liu, S.; Liu, J.; Huang, Y.F.; Zheng, Y.X. Optimization of Swivel Spherical Hinge Structure Design Based on the Response Surface Method. Sustainability 2023, 15, 356. [Google Scholar] [CrossRef]
- Su, M.; Wang, J.; Peng, H.; Cai, C.S.; Dai, G. State-of-the-art review of the development and application of bridge rotation construction methods in China. Sci. China Technol. Sci. 2021, 64, 1137–1152. [Google Scholar] [CrossRef]
- Zhou, X.; Zhang, X. Thoughts on the Development of Bridge Technology in China. Engineering 2019, 5, 1120–1130. [Google Scholar] [CrossRef]
- Zhang, J.; El-Diraby, T.E. Constructability analysis of the bridge superstructure rotation construction method in China. J. Constr. Eng. Manag. 2006, 132, 353–362. [Google Scholar] [CrossRef]
- Siwowski, T.; Wysocki, A. Horizontal rotation via floatation as an accelerated bridge construction for long-span footbridge erection: Case study. J. Bridge Eng. 2015, 20, 05014014. [Google Scholar] [CrossRef]
- Sun, Q.; Guo, X.; Zhang, D.; Guan, X.; Zheng, Y. Research on the application of horizontal rotation construction method with flat hinge in cable-stayed Bridge construction. In Proceedings of the 2011 International Conference on Civil Engineering and Building Materials, CEBM 2011, Kunming, China, 29–31 July 2011; Trans Tech Publications Ltd.: Stafa-Zurich, Switzerland, 2011; pp. 856–860. [Google Scholar]
- Niu, Y.-Z.; Li, H.-Y.; Quan, W.; Zhang, L. The type research on super large tonnage hinge of horizontal rotating stayed bridge. J. Railw. Eng. Soc. 2015, 32, 34–39, 56. [Google Scholar]
- Jia, F.X.; Chen, D.W.; Wu, Y.Y. Fine-analysis for the concrete upper rotation table and pier of a bridge using rotation construction method. In Proceedings of the 3rd International Conference on Civil, Architectural and Hydraulic Engineering, ICCAHE 2014, Hangzhou, China, 30–31 July 2014; Trans Tech Publications Ltd.: Stafa-Zurich, Switzerland, 2014; pp. 1099–1102. [Google Scholar]
- Jiang, L.; Gao, R. Deformation monitoring during removal of the supporting of T-type rigid frame bridge constructed by rotation method. In Proceedings of the 1st International Symposium on Archimedes Bridge, ISAB-2010, Qiandao Lake, China, 17–20 October 2010; Elsevier Ltd.: Amsterdam, The Netherlands, 2010; pp. 355–360. [Google Scholar]
- Hu, J.; Sun, X.; Jiao, S. Monitoring of long-span self-anchored arch bridge constructed with rotation method. In Proceedings of the 2nd International Conference on Civil Engineering, Architecture and Building Materials, CEABM 2012, Yantai, China, 25–27 May 2012; Trans Tech Publications Ltd.: Stafa-Zurich, Switzerland, 2012; pp. 1977–1982. [Google Scholar]
- Wang, J.; Cao, B.; Huang, B. Stability monitoring method of UHPC spherical hinge horizontal rotation system. Arch. Civ. Eng. 2022, 68, 601–616. [Google Scholar] [CrossRef]
- Guo, W.; Guo, X.D.; Wang, Z.W.; Li, Z. Investigation on Moisture Damage Prevention of a Spherical Hinge Structure of a Swivel Bridge. Coatings 2020, 10, 955. [Google Scholar] [CrossRef]
- Watanabe, E.; Ueda, S.; Maruyama, T.; Takeda, S. Construction of Yumemai bridge—A floating swing arch bridge in Osaka, Japan Konstruktion der Yumemai-brücke-Schwimmende bogenbrücke in Osaka. Stahlbau 2003, 72, 323–330. [Google Scholar] [CrossRef]
- Li, W.W.; Zhang, Z.; Huang, C.L. Application of Dynamic Unstressed State Method in Vertical Rotation Construction of Bridges. Adv. Civ. Eng. 2011; 255–260, Pts 1–6, 988–992. [Google Scholar] [CrossRef]
- Wang, J.W.; Sun, Q.S. Experimental Study on Improving the Compressive Strength of UHPC Turntable. Adv. Mater. Sci. Eng. 2020, 2020, 3820756. [Google Scholar] [CrossRef]
- Xu, C.; Xu, X.; Huang, J.; Zhang, T.; Gong, Y.; Zhao, C.; Song, Z. Study on mechanical performance of spherical hinge of unbalanced swivel bridge. J. Railw. Sci. Eng. 2022, 19, 3063–3069. [Google Scholar] [CrossRef]
- Wang, J.W.; Sun, Q.S. Parameter sensitivity analysis of stability of -shaped rigid frame bridge by adopting swivel construction method. Multidiscip. Model. Mater. Struct. 2020, 16, 1203–1231. [Google Scholar] [CrossRef]
- Peng, C.; Wang, J.; Chen, H.; Tang, R. Application of Fuzzy-ISM-MICMAC in the Risk Analysis Affecting Swivel Bridge Construction Spanning Existing Railway Lines: A Case Study. Buildings 2024, 14, 52. [Google Scholar] [CrossRef]
- Niu, S.; Ouyang, X.; Liu, Y. Experimental study on the influence of temperature on the wear performance of polymer sliding plate materials for bridge bearings. In Proceedings of the 2020 3rd International Symposium on Traffic Transportation and Civil Architecture, ISTTCA 2020, Dali, China, 6–8 November 2020; IOP Publishing Ltd.: Bristol, UK, 2021. [Google Scholar]
- Ala, N.; Power, E.H.; Azizinamini, A. Experimental Evaluation of High-Performance Sliding Surfaces for Bridge Bearings. J. Bridge Eng. 2016, 21, 04015034. [Google Scholar] [CrossRef]
- Quaglini, V.; Tavecchio, C.; Dubini, P.; Cuminetti, D.; Ferroni, D. New high endurance sliding material for bridge bearings. In Proceedings of the 5th International Conference on Bridge Maintenance, Safety and Management (IABMAS), Philadelphia, PA, USA, 11–15 July 2010; Lehigh University’s Advanced Technology for Large Structural Systems (ATLSS) Engineering Research Center: Bethlehem, PA, USA, 2010; pp. 3491–3497. [Google Scholar]
- Deng, R.S.; Huang, A.M.; Zhu, Z.Y.; Jiang, W.D.; Liu, Y. Study on Properties and Application of UHMWPE Wear-Resisting Composite Material. In Proceedings of the 7th National Conference on Functional Materials and Applications, Changsha, China, 15–18 October 2010; pp. 2203–2209. [Google Scholar]
- Dorafshan, S.; Johnson, K.R.; Maguire, M.; Halling, M.W.; Barr, P.J.; Culmo, M. Friction Coefficients for Slide-In Bridge Construction Using PTFE and Steel Sliding Bearings. J. Bridge Eng. 2019, 24, 04019045. [Google Scholar] [CrossRef]
Disclaimer/Publisher’s Note: The statements, opinions and data contained in all publications are solely those of the individual author(s) and contributor(s) and not of MDPI and/or the editor(s). MDPI and/or the editor(s) disclaim responsibility for any injury to people or property resulting from any ideas, methods, instructions or products referred to in the content. |
© 2024 by the authors. Licensee MDPI, Basel, Switzerland. This article is an open access article distributed under the terms and conditions of the Creative Commons Attribution (CC BY) license (https://creativecommons.org/licenses/by/4.0/).