1. Introduction
Planetary nebula M 1–92, also known as Minkowski’s Footprint nebula, is a well-studied pre-planetary nebula (pPN) first discovered by Minkowsi [
1]. The source has a luminosity of 10,000
for a distance of 2.5 kpc (see the discussion by Bujarrabal et al. [
2] and references therein). The central post-AGB star shows a spectrum compatible with a temperature of 18,000–25,000 K, plus an F5 component that has been attributed to a possible companion, though the binary nature of the source is still under debate [
3,
4,
5].
Optically, M 1–92 shows a typical bipolar reflection nebula appearance, with a clear axis of symmetry oriented at PA 310
in the plane of the sky and about 35
with respect to this plane—the northwest lobe pointing to us (see HST images by Trammell, Goodrich [
6] and Bujarrabal et al. [
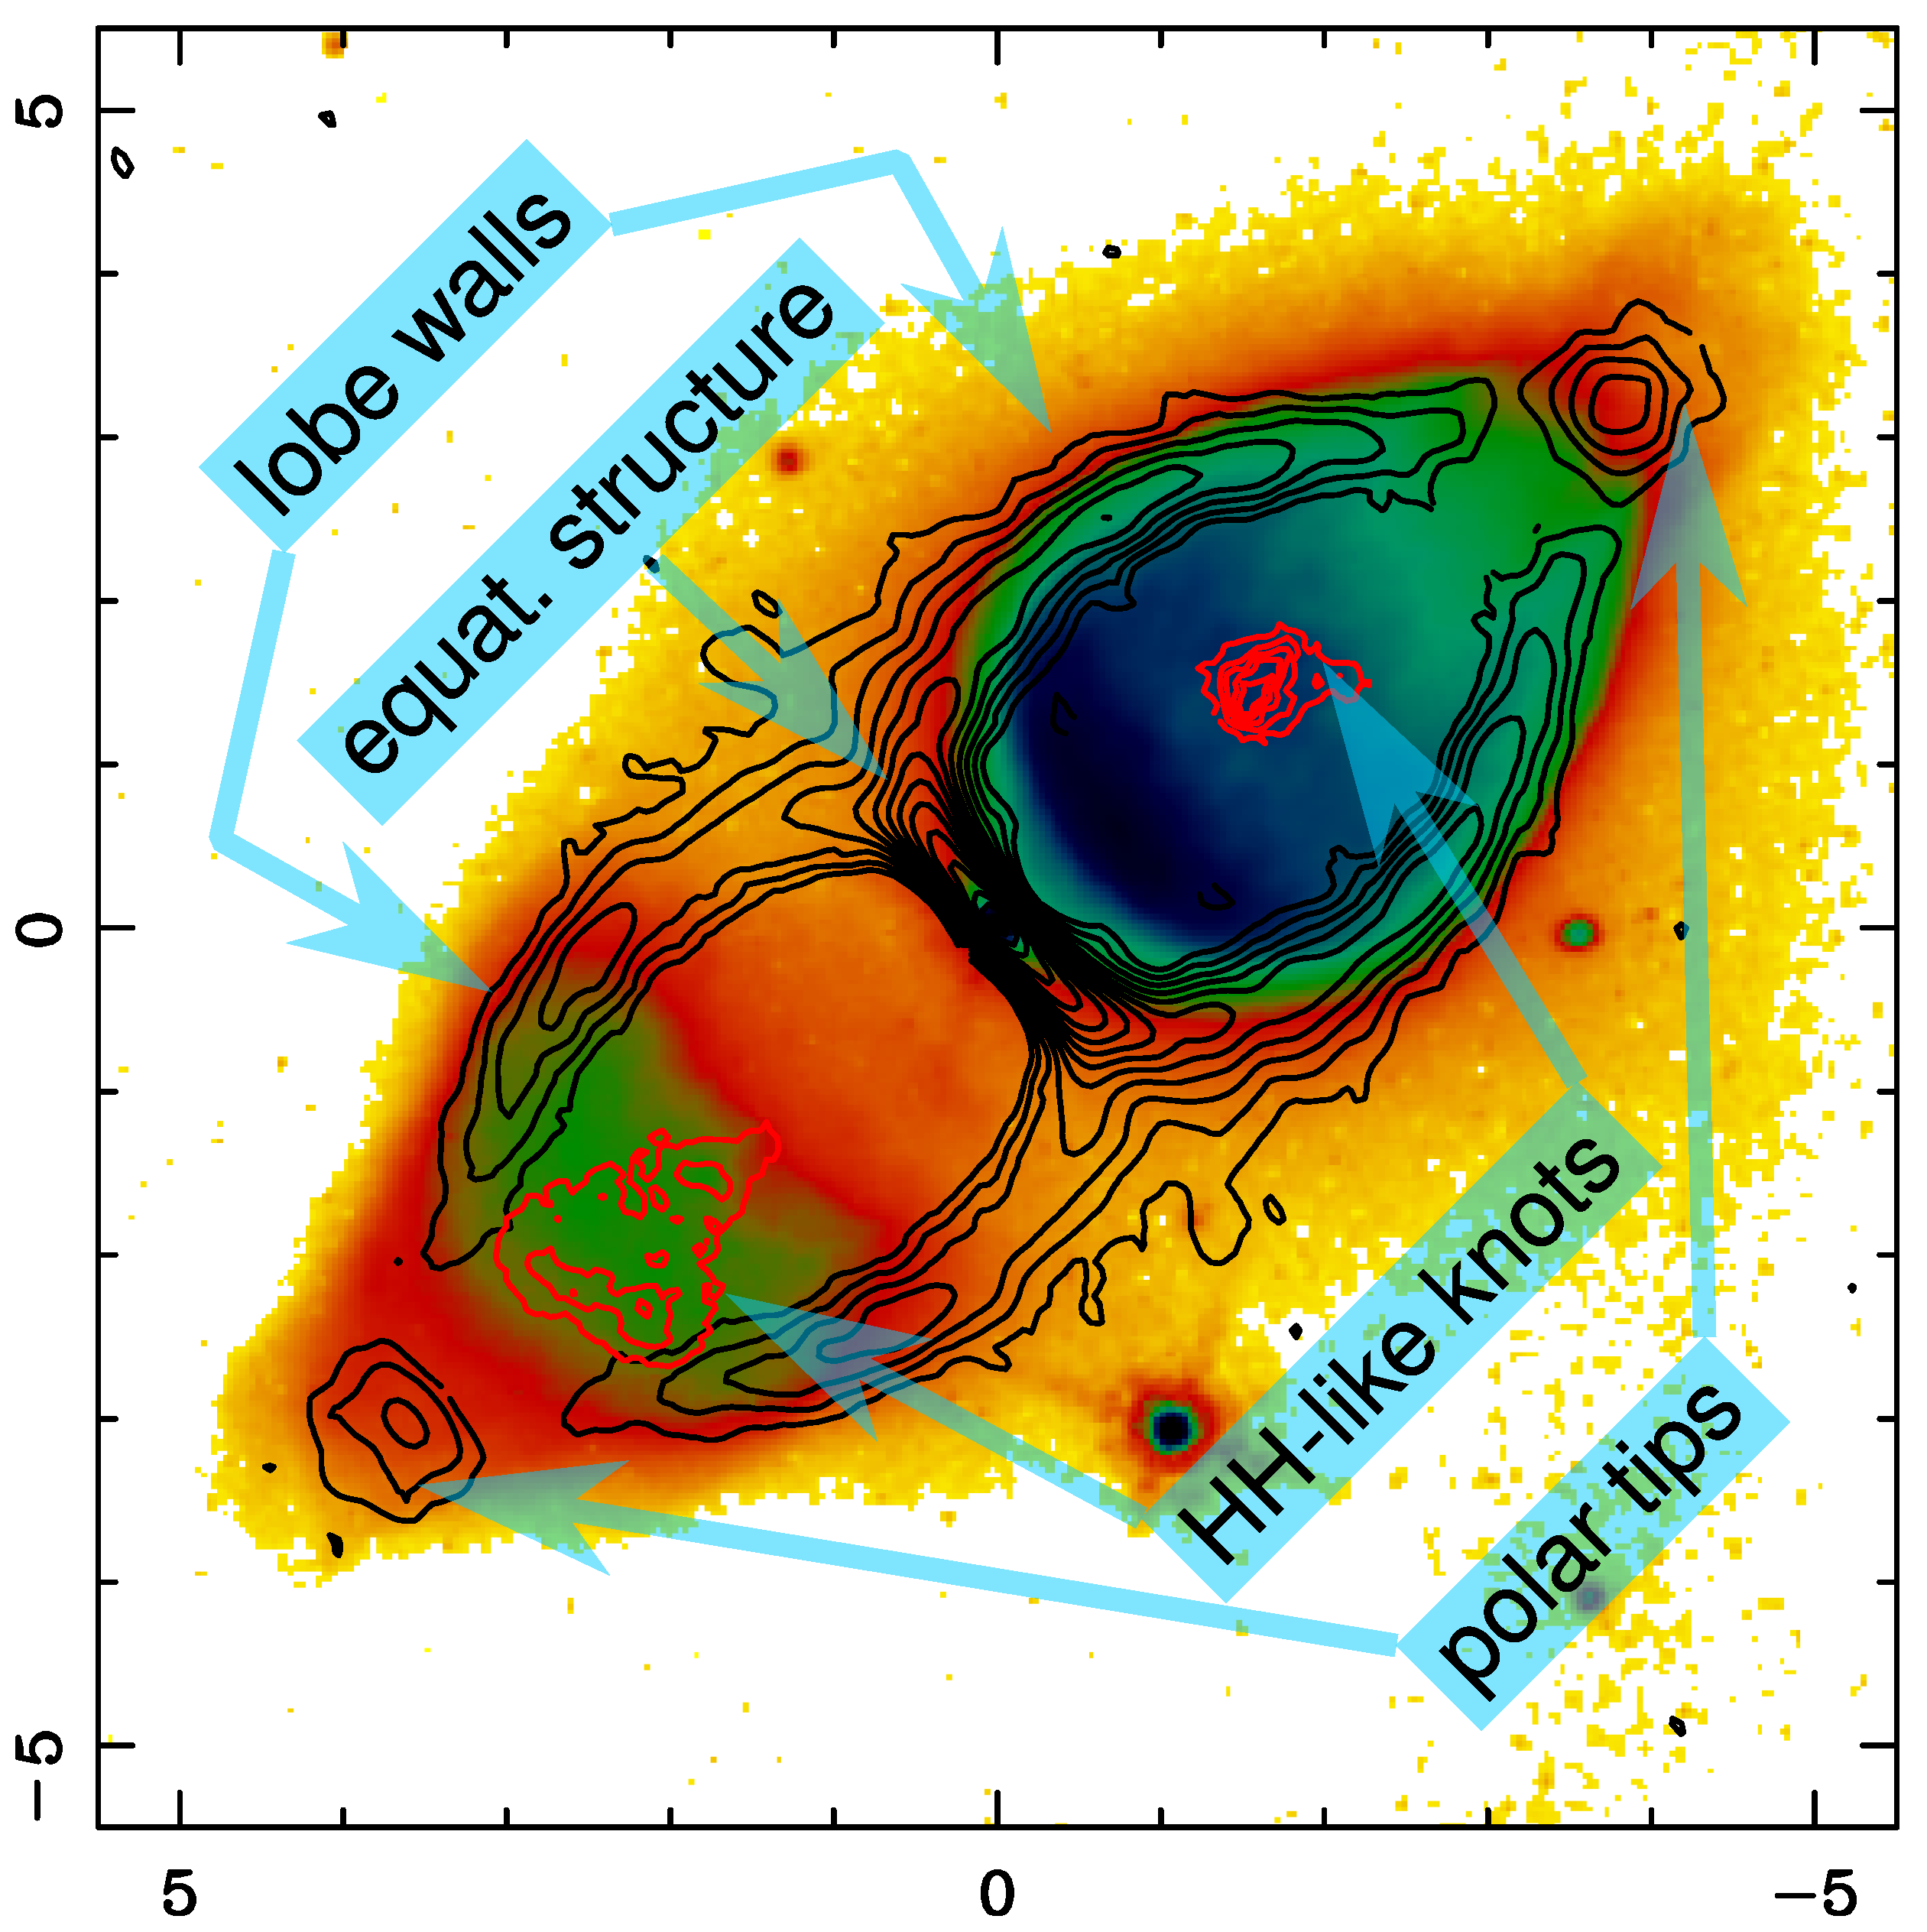
7]). This reflection nebula has a size of 5″ × 10″, the furthest (southeast) lobe being slightly smaller and fainter due to its partial obscuration by a dusty equatorial component. In addition to the reflection nebula, there is a compact knot in the middle of each lobe where emission from optical forbidden lines is detected, denoting the presence of shocked ionised gas [
7,
8]. These lines show de-projected expansion velocities up to 170 km s
and trace a total ionised mass of ∼10
. These HH-like knots are also detected in the NIR in vibrationally excited H
; however, they show much fewer expansion velocities, up to 70 km s
[
7,
9]. In addition, H
emission is found at the core of the nebula, presenting expansion velocities up to 750 km s
. This fast but tenuous wind is the result of the present mass loss, which amounts to 3 × 10
a
[
3]. See
Figure 1 for an image montage showing the main components of the nebula.
The molecular gas component of the nebula has been studied through interferometric observations of low-
J transitions of both
CO and
CO [
2,
10,
11,
12]. These observations, with spatial resolutions between 0.
5 and 1.
0, showed that the molecular gas is located in the equatorial structure dividing the two lobes, in the walls of the two lobes, and at the two ends of the nebula (the polar tips). At these mm-wavelengths, in addition to the axial symmetry, the nebula also displays a remarkable equatorial mirror symmetry, i.e., both lobes are very similar to each other. The gas displays a linear velocity gradient of 7.4 km s
per arc-sec., with expansion velocities up to 50 km s
(70 km s
if de-projected), which for the adopted values for the distance and inclination of the symmetry axis with respect to the plane of the sky, results in a kinematic age of 1200 a. This velocity gradient seems to hold in all directions, as in a self-similar growing structure, suggesting that all of the molecular gas was accelerated to its present velocities in a single short duration (<100 a) event [
10]; see also [
13,
14] for hydrodynamical simulations trying to reproduce this kinematics for the particular case of M 1–92.
Gas densities and temperatures in the molecular envelope are in the range of 5 × 10
to 1.5 × 10
cm
and 10 to 30 K, respectively [
2]. The total mass of the nebula is dominated by this cold neutral molecular component, which accounts for 0.9
. The radial linear momentum and kinetic energy of the molecular gas are also impressive, with values of 22
km s
and 530
km
s
respectively, imposing very stringent constraints on the mechanism responsible for the formation of the nebula 1200 a ago. In fact, M 1–92 is the first source in which the Momentum Excess Problem, so characteristic of most pPNe, was described [
12,
15]. (In the previous AGB phase, the expansion of the envelopes can be explained by the radiation pressure of the stellar photons onto the circumstellar dust grains. On the contrary, in the pPN phase, the radial averaged linear momentum measured in these sources is orders of magnitude larger than what radiation pressure can provide during the characteristic kinetic age,
, of these post-AGB sources:
, where
L is the luminosity of the central star,
c is the speed of light, and
is the efficiency of this process, which cannot take values larger than 2–3. This result, known as the Momentum Excess Problem, pointed out the need for an alternative mechanism for explaining the kinematics of these sources. See [
15] for a detailed study of the prevalence of this phenomenon in the pPN population.
2. The New NOEMA Observations
The new data presented in this paper were acquired using the IRAM NOrthern Extended Millimetre Array, also known as NOEMA mm-wave interferometer, located at the Plateau de Bure (French Alps). The observations were carried out in Spring 2018 using eight to nine antennas in A and C configurations. The data include baselines ranging from 18 to 760 m, which at the observed frequencies, results in spatial resolutions of 0.″6 to 0.″8. We used the new PolyFix correlator, which provides simultaneous observations of an 8+8 GHz baseband in dual-polarisation with a spectral resolution of 2 MHz (2.5 to 3.0 km s at the observed frequencies). We observed two frequency setups, for a total baseband coverage of 32 GHz divided into four continuous chunks within the 2 mm and 1.3 mm NOEMA bands: 156,204.7–164,310.9, 171,690.6–179,797.3, 219,188.8–227,303.8, and 234,930.9–242,795.8 MHz.
We have detected (and mapped) the J = 2–1 lines of CO, CO, and CO (which are good tracers of the bulk of the molecular gas); the J = 2–1 lines of HCO, HCO, HCN, HCN, HNC, NH, and CN (which are tracers of the presence of shocks and/or photon-dominated regions); and four lines of SO and several lines of SO (which are tracers of shocked and dense-gas environments). In addition to these spectral lines, we have also detected the continuum emission from the nebula at the four observed sub-bands. Here, we will present some of the results obtained for the CO isotopologues, SO, and HCO.
3. Results on the CO Isotopologues
The maps obtained for
CO
J = 2–1 are comparable to those presented by Alcolea, Neri, Bujarrabal [
10]. In addition, we have also detected the
J = 2–1 emission from C
O and C
O. In these latter cases, the emission is relatively weak, and the maps per velocity channel (for a 3.75 km s
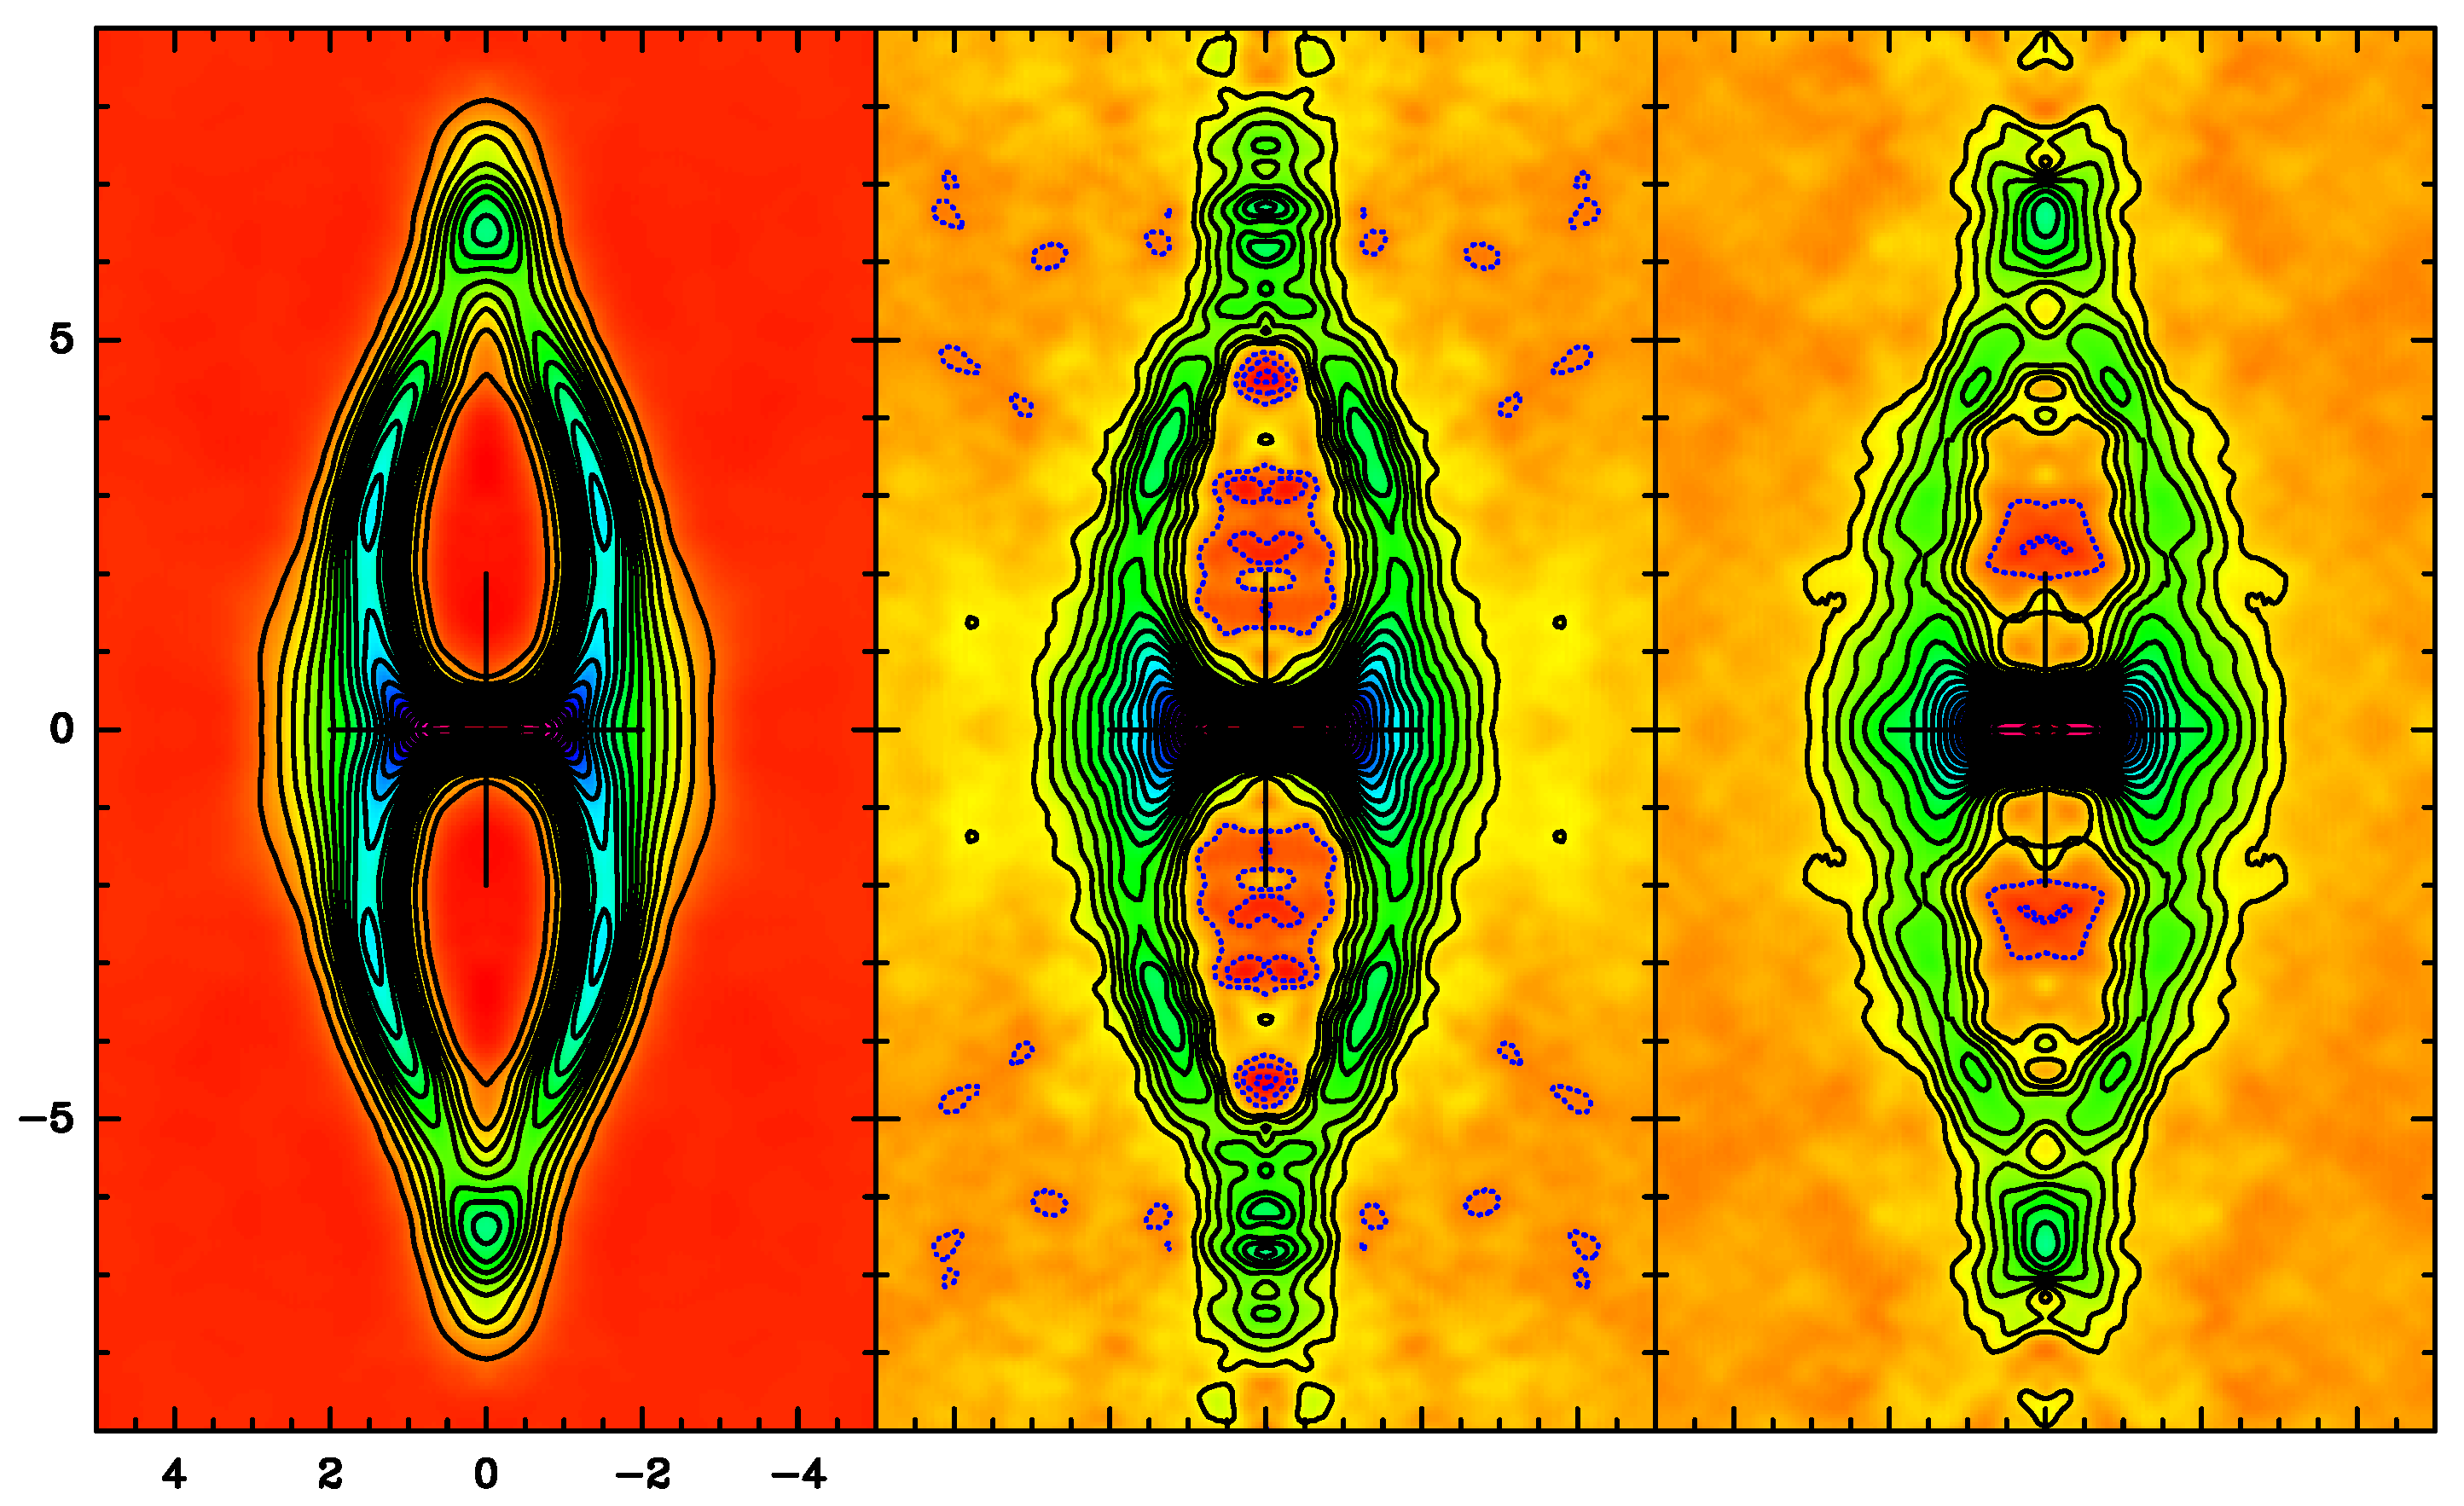
resolution) are noisy. To ease the comparison between the different CO species, we have taken advantage of the velocity field in M 1–92 to produce a 3D-image reconstruction of the nebula. Later on, we performed axial and mirror averages with respect to the symmetry axis and equatorial plane, respectively, resulting in improved S/N images of the mapped lines.
The 3D-image reconstruction process can be described as follows. If we assume that the velocity field in M 1–92 is perfectly described by a self-similar law, we have that
where
is the expansion velocity field at a point
(measured from the nebula centre), and
is the kinetic age of the nebula. Hence, we can recover the position along the line of sight,
z, of an emitting parcel of gas by simply measuring the observed Doppler shift of the emission
The observed velocity gradient
, i.e., the ratio between the observed velocities projected along the line of sight,
, and the observed positions in the plane of the sky in angular units,
, is given by the expression
where
V is the modulus of the true expansion velocity,
is the inclination of the symmetry axis with respect to the plane of the sky, and
D is the distance to the source. Knowing
and
D, we can derive
from the observed velocity gradient, and using Equation (
2), the position (in arc-sec.) along the line of sight,
z, of the emitting gas. Once we retrieve the position along the line of sight for all pixels in the data cube, we can perform axial averaging around the symmetry axis and mirror averaging with respect to the equatorial plane by simply assuming that these two symmetries are well preserved in the nebula, as the real observational data suggest. In fact, the value of the inclination
can be determined by maximising the cylindrical symmetry in the resulting 3D models for the nebula. In our case, the
CO data yield an
value of 40
5
. The result of applying this procedure to the three observed
J = 2–1 CO lines can be seen in
Figure 2.
The results agree very well with previous models for the nebula [
2,
12], which reinforces the idea that the real velocity field cannot be far from the simple self-similar law assumed in this 3D-image reconstruction. Furthermore, note the narrow width of the walls of the two lobes and the equatorial structure dividing them. The distribution of all isotopologues is very similar: they all come from the same regions. The intensity map ratios between
CO and either C
O or C
O suggest that
CO
J = 2–1 is not optically thin at the centre of the nebula. On the contrary, the C
O/C
O ratio is quite uniform for regions with high S/N. This ratio is fully compatible with that obtained from single-dish observations [
16], confirming that it can be safely used to derive [
O]/[
O] abundance ratios (no selective photo-dissociation of fractionation effects are detected).
This result is important because, for AGB and post-AGB sources, the [
O]/[
O] isotopic ratio can be used to derive the initial mass of the star (see [
17] and references therein). The value obtained for M 1–92, [
O]/[
O] = 1.6 ± 0.15, corresponds to an initial mass of 1.7 ± 0.1
. This result may look a bit surprising because, for such initial mass, stellar evolution models for solar metallicities predict the star to become C-rich at some point during its AGB evolution (as the result of the successive 3rd dredge-up events, see Karakas, Lugaro [
18]). However, M 1–92 shows a typical O-rich chemistry: the detection of SO, SO
, and OH masers [
16,
19], crystalline H
O [
20], and a low value of the [
C]/[
C] abundance ratio [
2,
12]. This apparent contradiction can be sorted out if we assume that the AGB evolution of the central star in M 1–92 was prematurely ended before turning into C-rich by the sudden mass loss that occurred 1200 a ago. Note that for an initial mass of 1.7
, models predict a final white dwarf mass of 0.57
[
21]. Therefore, the present nebula represents ∼80% of the stellar envelope to be lost by the end of the AGB evolution [
16].
4. Results on the SO Molecule
We have mapped six lines of SO
v = 0 in the 32 GHz covered by the observations. A summary of the properties of the observed transitions is displayed in
Table 1. We have detected all of them except for the two with very low Einstein coefficients (
). All the detected lines show a similar structure, consisting of a central unresolved core plus a detached torus. This torus has a radius of 1.″5 and a height/width of 0.″5. No SO emission is detected outside the equatorial plane of the nebula.
Since the observed transitions cover a fair range of excitation energies, from 15 to 65 K, for the temperatures expected for the molecular gas in M 1–92, we have used the rotational diagram formalism for directly deriving the excitation temperature and column density for SO. The method was first described by Goldsmith, Langer [
22] and is widely used for species with a simple excitation mechanism that can be described by a single excitation temperature,
, provided that the lines are optically thin. Under these assumptions, both
and the total column density of the species,
N, can be derived by fitting a straight line to the relationship between the integrated line intensity,
W, and the energy of the upper level,
, for two or more transitions. The relationship
can be expressed as
where
Z is the partition function,
and
are the frequency and A-Einstein coefficient of the transition,
is the multiplicity of the upper level, and
k,
h, and
c are, respectively, the Boltzmann, Planck, and speed of light constants.
As for the case of the CO isotopologues, to increase the S/N of the maps, we have first applied the 3D-image reconstruction and averaging process to the SO data cubes (using the same clean beam for all the transitions). Then, we fit straight lines to Equation (
4) for each pixel in the resulting images. The upper limits for the non-detected lines have been taken into account in this fitting by using a Markov-Chain Monte-Carlo method [
23]. The results for
and
N can be seen in
Figure 3. We derive excitation temperatures in between 10 and 50 K, in line with what was previously found for CO (but beware of possible under-excitation in the case of SO). We also derive SO densities of 0.05–0.2 molecules per cm
. Assuming the previously derived values of 1.5 × 10
cm
[
2] for the total molecular densities in these equatorial regions, our findings result in fractional abundances with respect to H
, i.e., [SO]/[H
], of 3.0 × 10
to 1.3 × 10
.
We can see that at the centre of the nebula, there is a dense warm clump. Because this clump is practically unresolved in the observations, both its temperature and density can be considered as lower limits. Such a highly contrasted central clump is not seen in the CO observations, but this cannot be due to opacity effects since it is present neither in C
O nor in C
O. The nature of the detached torus seen in SO is even more enigmatic. This detached structure is not seen in CO either. In fact, the SO torus is located just at the outskirts of the equatorial structure in the CO maps (see
Figure 3 (right). The location of the SO torus is coincident with the ring seen in OH masers at 1667 MHz by Seaquist, Plume and Davis [
19], suggesting a chemical link between OH and SO. Such a toroidal structure 3.″7 in diameter) was also detected by Eiroa, Hodapp [
24] in the [H–K] colour image of the nebula, and a slightly wider (5.″0 in diameter) doughnut-like component was detected in the NOEMA continuum observations. Given all these findings, we conclude that the SO torus must be related to an increase in the SO abundance, probably as result of the presence of shocks due to the acceleration of the molecular gas in the equatorial directions.
5. Results on HCO and HCN
Finally, we present some of the results obtained for HCO
and HCN, which may also hold for H
CO
, H
CN, HNC, CN, and N
H
, as all these species show very similar and characteristic profiles in single-dish observations [
16]. Both HCO
and HCN show emission from a compact central core and a detached torus, as in the case of SO, as already discussed. However, at the highest expansion velocities, these species also show emission not only from the polar tips as expected (as this is the case for CO) but also from the compact knots detected in optical forbidden lines and vibrationally excited H
(see
Section 1 and
Figure 1). This is clearly shown in
Figure 4, where we compare an [SII] image of the nebula with the emission of HCO
at expansion velocities ±30–55 km s
. In fact, the velocities observed at these two HH-like knots are the highest seen in molecular lines in the nebula, reaching values larger than those attained at the polar tips.
These knots do not share the linear velocity gradient characteristic of the rest of the nebula. They present a typical projected expansion velocity of 40 km s
, but they are located just 3″ away from the nebula centre. For an inclination
of 40
, this results in a kinetic age of 850 a. In addition, they present a large velocity dispersion, with expansion velocities between 0 and 55 km s
, almost identical to those of vibrationally excited H
[
9] but much smaller than what is seen in optical lines [
8]. We do not detect
CO in these clumps, i.e., we do not see emission at these positions at such large expansion velocities. If we assume that the cylindrical symmetry is well preserved, we can put the upper limit to the
CO
J = 2–1 emission of ≤25 mJy beam
to be compared with the 40 and 60 mJy beam
detected in HCN and HCO
J = 2–1, respectively. On the polar tips, where all three species are detected, we have detected 120 mJy beam
in
CO and 15 and 55 mJy beam
in HCN and HCO
, respectively. Assuming that the excitation conditions are similar in the HH-like knots and the polar tips, we can conclude that the relative abundances of HCN and HCO
with respect to
CO in the knots are ≥13 and ≥6 times larger than those in the polar tips. The emission of HCN and HCO
must be due to the presence of a photon-dominated region-like environment associated with the shocked, ionised gas seen in optical lines. It seems that these shocks are not only exciting the atoms but also fostering the production of these two species [
25,
26].
6. Discussion
The observations presented here provide new clues to understand the formation of M 1–92 and, probably, of many other pPNe. This is not a surprise since previous observations in molecular lines were only restricted to low-
J lines of
CO and
CO. These two species are, in general, excellent tracers of the total molecular content, but they are not very sensitive to high-density, high-temperature, or peculiar chemical regimes, such as shock-driven or photon-driven ones. Apart from confirming the previous value for the [
O]/[
O] isotopic ratio, the similar extent of
CO, and of the much less self-shielded species C
O and C
O, tells us that the size and shape of the molecular envelope is not controlled by photo-dissociation, as in the case of AGB envelopes. On the contrary, here, the morphology is just the result of the velocity field and the dynamical age of the nebula: i.e., it is self-similar structure. Bujarrabal, Alcolea, Neri [
12] suggested that this geometry and kinematics is the result of a two-wind (AGB and post-AGB) interaction. However, there is still no clear evidence of the existence of an undisturbed previous AGB mass loss, in contrast to what happens in other well-studied post-AGB sources, such CRL 618, CRL 2688, and NHC 7027. Therefore, in the case of M 1–92, we cannot rule out the possibility that the whole envelope we now see was lost in a sort of quasi-explosive isolated event: a common-envelope system [
10] or an intermediate-luminosity optical transient (ILOT) [
27]. We cannot assure that all the molecular mass we see was lost in a single event, but we can at least confirm that it was accelerated and shaped after a short acceleration process requiring such a large amount of energy that there are few candidate mechanisms left [
28], which all require the presence of a companion.
Data on molecules other than CO have proven to be powerful indicators of very active and special chemical regimes in M 1–92. SO, HCN, and HCO trace the existence of a torus rich in these molecules very well, but not in CO, which is probably the result of some wind interaction taking place along the equatorial plane. A similar shock activity must be present both at the nebular tips and the HH-knots in the middle of the lobes; however, SO is not detected here, meaning that the densities are probably lower. Furthermore, the detection of HCO and HCN but not of CO in the HH-like knots reveals the effects of the ionisation on their chemical composition. Here, we are probably witnessing an efficient transformation of CO into HCO and the formation of other C-rich molecules as a result of chemical reactions involving ions and radicals.
Finally, the detection of a warm compact component at the centre of the nebula opens up the possibility of performing higher-spatial resolution observations (using ALMA), looking for the existence of rotating structures at the heart of the nebula. Note that such detailed observations typically require brightness temperatures of several tens of K. To date, no evidence for gas in rotation has been found in M 1–92. The detection of a rotating disk, as in the case of the Red Rectangle and other similar sources [
26,
29], or OH 231.8 + 4.2 (see the contribution by Sánchez Contreras et al. in these proceedings), will provide a clear indication of the binary nature of the central star. Currently, although the details are not well understood yet, the most plausible mechanism for the formation of non-spherical pre-planetary and planetary nebulae require the presence of binary systems [
30].


 ,
, 


