Abstract
Background/Objectives: Deep cerebral vein thrombosis (DCVT) is a rare cerebrovascular condition that can result in absence of major venous sinuses. This study uses patient-specific computational fluid dynamics (CFD) to quantify hemodynamic changes in acquired DCVT, focusing on venous outflow redistribution, pressure, and wall shear stress (WSS). Methods: Three-dimensional models of cerebral venous sinuses were reconstructed from magnetic resonance venography (MRV) for a DCVT patient and normal control. Steady-state CFD simulations used physiological inflows with laminar flow assumptions. Sensitivity analyses tested hyperemic conditions and blood rheology effects. Results: In normal anatomy, flow split 70% through superior sagittal sinus and 30% through straight sinus. In DCVT, all flow was rerouted through the superior sagittal sinus. Surprisingly, pressure drop was lower in DCVT (0.67 mmHg vs. 1.3 mmHg in normal). WSS increased moderately in the DCVT superior sagittal sinus (~2.5 Pa peak) but remained within physiological ranges. Under hyperemic conditions, pressures and WSS stayed below pathological thresholds. Conclusions: DCVT redirects venous outflow without pathological pressure or WSS elevations, demonstrating remarkable venous system resilience through collateral compensation. This patient-specific CFD framework enables individualized hemodynamic assessment, contributing to personalized medicine approaches for rare cerebrovascular conditions.
1. Introduction
The cerebral venous system drains deoxygenated blood from brain parenchyma through the following two main pathways: superficial cortical veins emptying into dural sinuses (primarily the superior sagittal sinus) and deep veins converging into the great vein of Galen and straight sinus [,,]. These pathways normally converge at the torcular Herophili, distributing blood into transverse and sigmoid sinuses toward the internal jugular veins [].
Deep cerebral vein thrombosis (DCVT) is a rare cerebrovascular condition accounting for 0.5% of strokes []. While traditionally attributed to congenital variations, emerging evidence suggests many cases of absent straight sinus result from acquired thrombotic conditions [,,]. DCVT leads to absence of the straight sinus, internal cerebral veins, and vein of Galen, triggering hemodynamic changes and collateral development distinct from congenital variants [].
Patient-specific computational fluid dynamics (CFD) provides unique insights into cerebral hemodynamics by reconstructing vascular anatomy from imaging and simulating blood flow [,,]. CFD enables quantification of velocity fields, pressure distributions, and wall shear stresses difficult to measure in vivo, particularly valuable for rare conditions like DCVT where clinical data are limited [].
This study applies CFD to quantify cerebral venous outflow changes when the straight sinus is absent due to thrombosis. We hypothesize that while the absence of the straight sinus will alter flow patterns, the venous network may compensate through alternative pathways to maintain drainage. Key questions include: How is flow redistributed when deep venous drainage is rerouted? What changes occur in pressure and wall shear stress distribution?
The patient-specific model represents a 35-year-old female presenting with headaches and visual disturbances. MRV confirmed DCVT with absence of straight sinus, internal cerebral veins, and vein of Galen, accompanied by a prominent falcine sinus as collateral pathway []. Conservative management with anticoagulation resulted in asymptomatic recovery at 6-month follow-up with normal intracranial pressure [].
2. Materials and Methods
2.1. Imaging and Geometric Modeling
Patient-specific venous sinus geometry was obtained from high-resolution 3D phase-contrast MRV (0.9 × 0.9 × 1.6 mm3 resolution, ~500 slices). The patient showed absent straight sinus and deep veins consistent with DCVT. All imaging data were anonymized with appropriate institutional review.
Segmentation employed combined automatic and manual techniques using the Vascular Modeling Toolkit (VMTK) in 3D Slicer (v5.8.0, Slicer community, www.slicer.org; developed by the surgical planning laboratory Brigham and Women’s Hospital, Boston, MA, USA) []. Vessel enhancement filters highlighted tubular structures, followed by intensity thresholding to capture major venous channels. Manual segmentation added missing portions through slice-by-slice inspection.
A normal venous anatomy model from an adult without abnormalities served as control, featuring intact internal cerebral veins, vein of Galen, and straight sinus. Surface models underwent smoothing to remove artifacts, with inlets defined at superior sagittal sinus (and straight sinus for normal model) and outlets at internal jugular veins. Comparison of the two reconstructed geometries of the two patients is shown in (Figure 1).
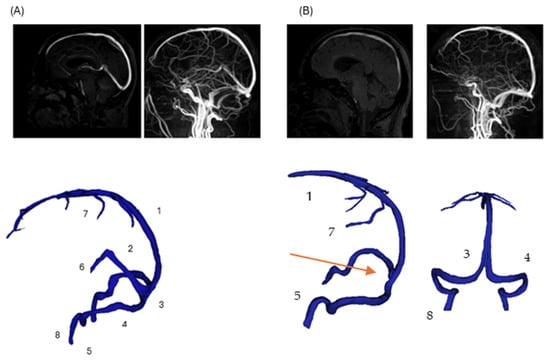
Figure 1.
Comparison of normal and pathological cerebral venous anatomy. (Panel A): Three-dimensional reconstruction of normal cerebral venous anatomy, with major veins labeled (1—superior sagittal sinus; 2—straight sinus; 3—confluence of sinuses; 4—transverse sinus; 5—sigmoid sinus; 6—internal cerebral veins; 7—superior cerebral veins; 8—jugular vein). (Panel B): Corresponding 3D reconstruction of the patient-specific model with DCVT case. The straight sinus (2) and internal cerebral veins (6) are thrombosed and not visualized; their anatomical locations are indicated with arrow for reference. Other veins remain intact and are labeled consistently with (Panel A).
This illustration reflects the structural disruption caused by DCVT, consistent with typical MRI findings in venous sinus thrombosis (e.g., absence of flow void on MRI due to thrombosis) []. Notably, venous collaterals are preserved, highlighting post-thrombotic remodeling and collateral adaptation seen in acute DCVT cases []. The overall pipeline to prepare the final geometries is presented in Figure 2.
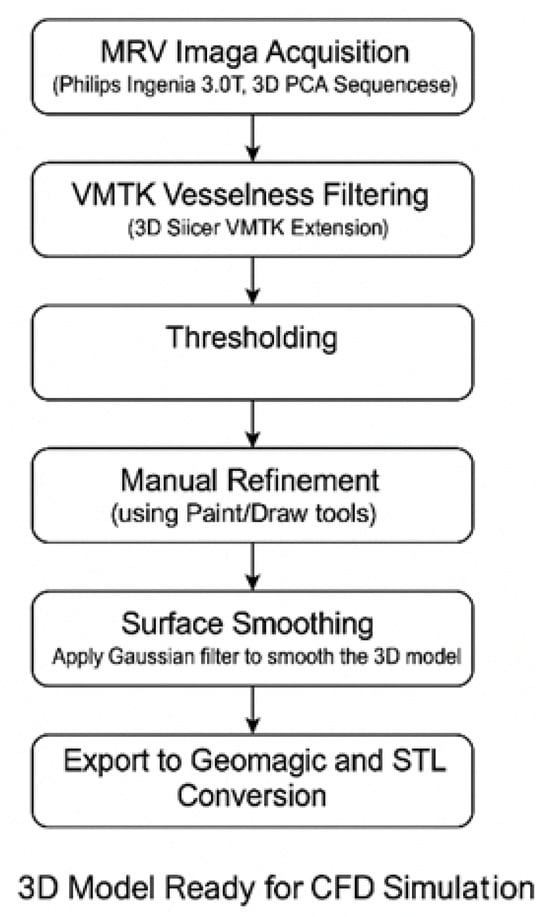
Figure 2.
Visual summary of the image-based modeling workflow used for 3D reconstruction of cerebral venous anatomy. MRV data were processed using a hybrid segmentation pipeline: VMTK and intensity thresholding were followed by manual refinement to ensure anatomical completeness. Surface smoothing and mesh preparation were then applied to produce CFD-compatible geometries for both normal and DCVT cases.
2.2. Computational Setup
Unstructured tetrahedral meshes captured complex sinus geometries with refined resolution in narrow channels and high-curvature regions. Mesh independence studies confirmed convergence at ~790,000 elements, providing optimal accuracy–efficiency balance. Final meshes contained 600–800 k cells with high quality (minimum angles > 20°, aspect ratios < 5) []. CFD simulations used ANSYS Fluent, v 2025, Canonsburg, PA, USA with steady-state Navier–Stokes equations under laminar flow assumptions, validated by comparison with turbulence models. Convergence criteria required residuals < 1 × 10⁻⁴ and mass imbalances < 0.1% [,].
2.3. Boundary Conditions and Blood Flow Parameters
Inlet Conditions: Based on phase-contrast MRI studies, physiological flow rates were 4.16 mL/s at superior sagittal sinus and 1.5 mL/s at straight sinus for normal anatomy (70:30 split, total 5.66 mL/s) []. For DCVT, all 5.66 mL/s entered through superior sagittal sinus only, simulating deep venous rerouting via collaterals [].
In additional simulations, we explored a more detailed inlet condition by distributing flow among multiple smaller tributary veins in the normal anatomy (e.g., adding separate inflows for cortical veins, internal cerebral veins, etc.). This “full-network” inlet configuration was used to verify that lumping the inflow into the main sinuses (as performed in the primary simulations) did not significantly alter the results. The total flow was kept the same, only split into more entry points according to the literature values. The simplified two-inlet approach was found to be sufficient for capturing the major hemodynamics, as validated by comparing it with the full-network model.
Outlet Conditions: Constant pressure (5 mmHg) at both internal jugular veins represented normal venous pressure, allowing natural flow distribution based on anatomical resistance [].The outlet pressure of 5 mmHg was selected based on physiological jugular venous pressure values (3–7 mmHg) reported in the literature for supine subjects [,,]. Although a formal sensitivity sweep was not performed, previous modeling studies and preliminary tests indicate that moderate variations within this range have minimal influence on relative flow distribution and pressure gradients. Therefore, symmetric outlet pressures were used to isolate the geometric effects of deep cerebral vein thrombosis (DCVT) while maintaining physiologically realistic boundary conditions.
Blood Properties: Newtonian fluid with density 1060 kg/m3 and viscosity 3.5 cP, appropriate for low-shear venous flows. Sensitivity analyses tested non-Newtonian rheology using Carreau–Yasuda and Cross models. Vessel walls were treated as rigid no-slip boundaries [], a common assumption in steady-state venous CFD that isolates geometric effects while recognizing limitations discussed in Section 4.4.
Sensitivity Analysis: Flow was increased by ~39% to simulate hyperemic conditions and assess system capacity under increased cerebral blood flow [].
2.4. Numerical Solution and Solver Setup
The CFD simulations were carried out in ANSYS Fluent (ANSYS Inc., Canonsburg, PA, USA). Steady-state flow was solved with second-order discretization schemes. Convergence criteria required residuals < 1 × 10⁻⁴ and mass imbalances < 0.1%.
Since venous pulsatility is damped compared to arterial flow, the steady-state assumption is commonly adopted in cerebral venous CFD []. Additionally, a turbulence model (k–ω SST) was tested for baseline conditions but yielded essentially identical results, confirming that flow remained laminar (Reynolds numbers in the SSS on the order of a few hundred) [].
3. Results
3.1. Baseline Flow Distribution
Normal anatomy exhibited expected flow division with superior sagittal sinus (SSS) and straight sinus (STS) streams meeting at torcular Herophili. The flow split approximately 70:30 between superficial and deep routes, with right-dominant outflow (60–65% right vs. 35–40% left transverse sinus), consistent with clinical observations []. In DCVT anatomy, entire venous return routed through superior sagittal sinus alone. Without straight sinus contribution, flow pattern simplified to unidirectional streamlines from SSS bifurcating toward transverse sinuses (Figure 3). This produced more symmetrical flow distribution, actually favoring left side (55% left vs. 45% right), opposite to normal dominance pattern. Table 1 presents a comparison between the two anatomies.
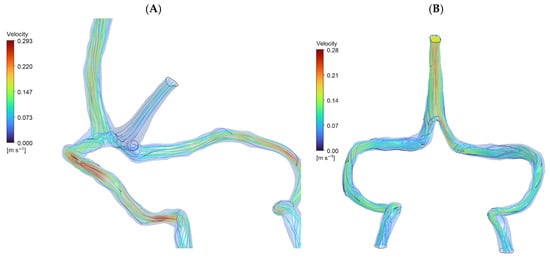
Figure 3.
CFD streamlines (A): Normal Cerebral Anatomy showing venous blood flow entering from the superior sagittal sinus and straight sinus (approximately 70:30 distribution), converging at the torcular Herophili to form a stable recirculation zone. Outflow proceeds predominantly to the right transverse sinus (60–65%). Peak velocity: 0.293 m/s. (B): Deep Cerebral Vein Thrombosis (DCVT) showing flow entering exclusively via the superior sagittal sinus (no straight sinus inflow). This yields unidirectional flow without recirculation. Flow is split with a slight leftward bias (~55% left vs. ~45% right). Peak velocity: 0.281 m/s.

Table 1.
Key baseline hemodynamic metrics in the normal vs. DCVT anatomy. (Values in parentheses are approximate from simulation).
Peak velocity in DCVT was higher in SSS region (0.28 m/s vs. 0.11 m/s normal) due to entire output channeling through single sinus initially, then decreasing as flow divided downstream.
3.2. Pressure and Wall Stress Distribution
Surprisingly, DCVT anatomy showed lower overall pressure drop (0.67 mmHg vs. 1.3 mmHg normal) (Figure 4). This counter-intuitive finding resulted from more streamlined single-stream flow eliminating energy losses from stream mixing at confluence. The absence of colliding flows reduced turbulence and viscous losses, making the singular pathway more hydraulically efficient.
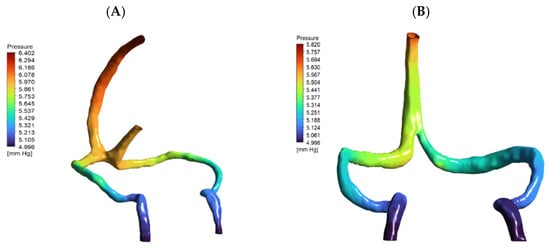
Figure 4.
Pressure distribution maps (mmHg) for (A) normal and (B) DCVT venous anatomies under baseline flow (5.4 mL/s), rendered from the same viewpoint. Both panels are color-coded by pressure. In (A) (normal anatomy), flow enters via both the superior sagittal and straight sinuses, yielding a total pressure drop (ΔP) of 1.319 mmHg. In (B) (DCVT anatomy), flow enters only via the superior sagittal sinus; this configuration produces a more streamlined single-stream flow with reduced viscous losses and near-symmetric outlet pressures, and a lower ΔP of 0.674 mmHg.
Wall shear stress remained within physiological limits in both anatomies. Normal model showed peak WSS ~3.9 Pa in sigmoid regions, while DCVT peak was ~2.5 Pa at SSS-transverse sinus bifurcation (Figure 5). Importantly, none of the observed WSS values approached pathological thresholds (>15–20 Pa) reported to cause endothelial activation [].
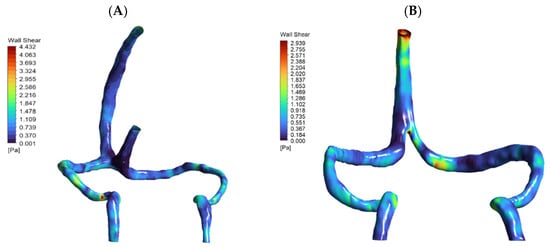
Figure 5.
Contour maps of wall shear stress (WSS) on the inner walls of patient-specific cerebral venous sinuses for (A) the normal anatomy and (B) the DCVT case with an absent straight sinus. The color bar shows local WSS in Pascals (Pa). In the normal model, the highest shear (~4.4 Pa) occurs in the sigmoid sinus (at the curvature/narrowing). In the DCVT model (no straight sinus), all flow is rerouted through the superior sagittal sinus (SSS), so the WSS peak (~2.9 Pa) shifts to the SSS–transverse sinus bifurcation. In both cases the WSS values remain low (only a few Pascals), consistent with physiological venous shear stress levels. Thus, these maps illustrate how loss of the straight sinus modestly raises shear in the SSS and redistributes flow, without producing abnormally high WSS.
3.3. Effect of Increased Flow (Hyperemia)
Under a 39% flow increase, normal anatomy pressure drop rose from 1.3 to 1.8 mmHg, while DCVT rose from 0.67 to 1.05 mmHg (Table 2). Although the DCVT model showed slightly greater sensitivity, absolute values remained well below intracranial hypertension thresholds.

Table 2.
DCVT model pressure drop vs. flow.
Peak WSS under hyperemia reached ~12 Pa in DCVT (Figure 6), which is elevated but still below the 15 Pa threshold known to trigger endothelial dysfunction []. This indicates that the venous system can tolerate flow increases without entering pathological ranges.
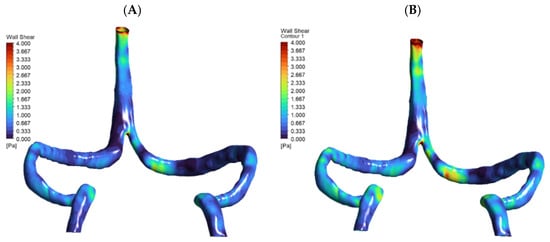
Figure 6.
Wall shear stress (WSS) distribution at baseline and +30% flow. Two-panel WSS maps for the DCVT model are shown: (A) baseline flow and (B) after a 30% flow increase, using a 0–4 Pa color scale. The higher-flow case produces noticeably elevated WSS in the superior sagittal sinus and at the torcular (confluence) junction, reflecting the hyperemic loading.
3.4. Comprehensive Cerebral Venous Network Analysis
To see how much smaller tributaries affect our results, we ran an extended simulation of the normal anatomy that included the superficial middle cerebral veins, internal cerebral veins, and basal veins of Rosenthal, with flow distributed realistically among these vessels [,].
Adding these smaller tributaries did increase wall shear stress locally by about 27%, with peaks around 1.3 Pa at the junctions where these veins meet (see Figure 7 and Table 3). Interestingly though, the big-picture pressure patterns stayed quite stable, varying by less than 0.3 mmHg. This makes sense given how the venous network naturally equalizes pressure. What this tells us is that while including detailed tributary anatomy matters for understanding local hemodynamic hotspots, our simplified two-inlet approach used in the main simulations does a good job of capturing the overall flow behavior and pressure distribution in the major sinuses []. Velocity streamlines are presented in Figure 8.
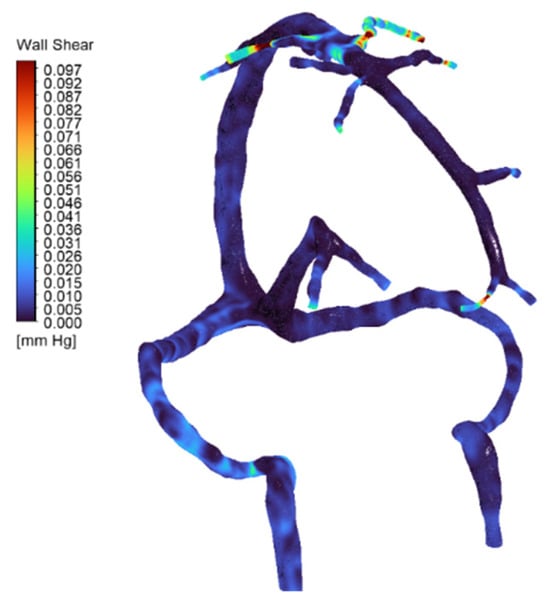
Figure 7.
Wall shear stress (WSS) distribution in the full cerebral venous network for the normal anatomy (full-network CFD simulation). The map (color-coded with blue for low values) shows generally low venous shear stress throughout most of the network. Localized high-shear regions appear at the junctions of the superficial middle cerebral veins (SMCVs), where inflow is greatest and vessel caliber is reduced—values reach on the order of ~1.3 Pa at these SMCV junctions. These peaks (indicated by warmer colors) correspond to the elevated flow and possible geometric narrowing at those tributaries.

Table 3.
Pressure distribution across major cerebral venous tributaries in the normal full-network model. Values represent average static pressures at the outlet of each tributary under baseline inflow. The data highlight minor inter-tributary pressure differences, with generally uniform values across the network, reflecting stable drainage conditions. This confirms efficient pressure equalization in the healthy cerebral venous system under physiologic flow.
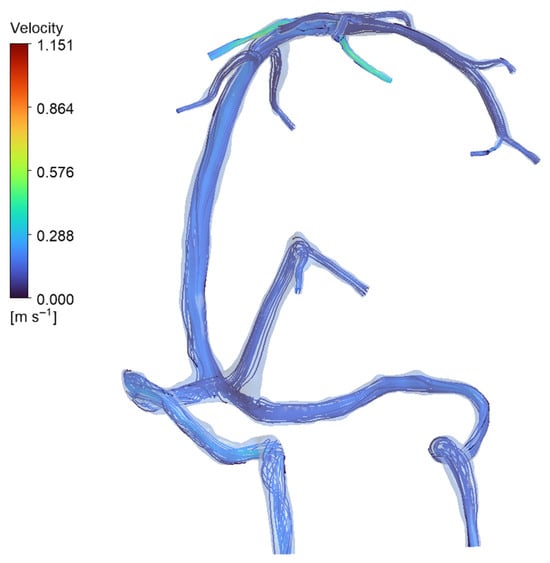
Figure 8.
Streamline visualization of venous inflow in the normal anatomy (full-network simulation). Streamlines (plotted from the inlet tributaries) show how blood enters via multiple veins and is carried into the dural sinuses. In the normal model, inflow is distributed among the major tributaries—specifically the superior cerebral veins (SCVs), internal cerebral veins (ICVs), and basal veins of Rosenthal (BVRs)—rather than coming from a single source. The map confirms the parallel contributions of these SCVs, ICVs, and BVRs to overall venous drainage in the healthy anatomy, with each major vein supplying flow into the sinus network.
3.5. Rheological Effects
Newtonian and mild shear-thinning (Cross) models yielded physiologically realistic results differing by only a few percent. However, aggressive shear-thinning (Carreau–Yasuda) produced unrealistic values (pressure drops > 4 mmHg, WSS > 60 Pa), highlighting sensitivity to rheological assumptions in venous CFD []. The results are presented in Table 4 and Figure 9.

Table 4.
Summary of hemodynamic parameters under Newtonian, Carreau–Yasuda, and Cross models (DCVT).
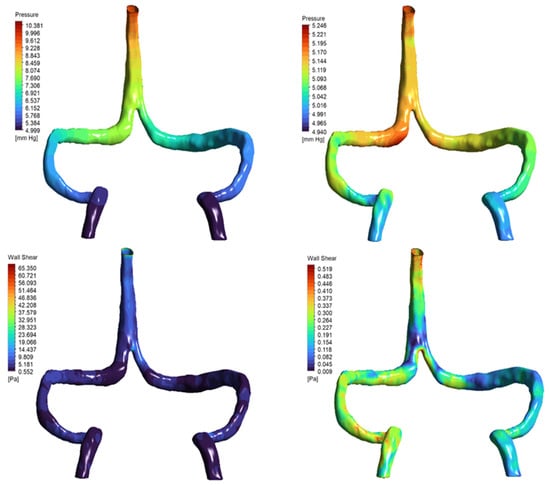
Figure 9.
Pressure and wall shear stress distributions under non-Newtonian rheology models. Top row: Static pressure distribution in the DCVT model using Carreau–Yasuda (left) and Cross (right) viscosity models. The Carreau–Yasuda simulation shows a steeper pressure gradient (ΔP ≈ 4.7 mmHg) compared to the more uniform gradient observed with the Cross model (ΔP ≈ 0.2 mmHg). Bottom row: Wall shear stress (WSS) fields reveal localized high shear concentrations in the Carreau–Yasuda case (peak WSS ≈ 65 Pa), in contrast to the smoother, physiologically consistent distribution seen with the Cross model (peak WSS < 0.5 Pa). These results illustrate the impact of rheological assumptions on local hemodynamic metrics in venous CFD simulations.
4. Discussion
4.1. Hemodynamic Adaptation Mechanism
Our patient-specific CFD simulations highlight the remarkable adaptability of the cerebral venous system in deep cerebral vein thrombosis (DCVT). Complete rerouting of deep venous return through collateral pathways into the superior sagittal sinus occurred without evidence of system overload. The lower pressure drop in DCVT compared to normal anatomy suggests that a singular collateralized pathway can be as hydraulically efficient as dual venous routes when adequate compensatory channels are present [,]. The fluid-mechanical basis for this efficiency involves three factors. First, eliminating flow convergence removes the dissipative mixing zone that forms when opposing streams meet at the confluence (analogous to T-junction losses in pipe networks). Second, the pressure drop (ΔP) in the DCVT model scales only with SSS resistance, while the normal model experiences additive losses from both inflow paths plus mixing. Third, unidirectional flow maintains laminar profiles (Reynolds number ~200 in SSS), whereas confluence turbulence (even mild) increases viscous dissipation. These mechanisms collectively explain why complete occlusion with collateral bypass can paradoxically reduce overall venous resistance compared to the dual-pathway normal anatomy.
This adaptation underscores a critical physiological principle: collateral remodeling is not merely an anatomical curiosity, but an effective safeguard for maintaining venous outflow capacity [,]. The patient’s favorable clinical recovery, despite severe anatomical disruption, aligns with our CFD prediction of preserved hemodynamic stability.
4.2. Clinical Significance
The absence of pathological pressure elevations or excessive wall shear stress (WSS) in the DCVT model provides mechanistic insight into why many patients with adequate collaterals recover without neurological decline. Even under simulated hyperemic conditions, venous pressures and WSS remained below thresholds known to trigger endothelial activation or intracranial hypertension []. These findings suggest that hemodynamic resilience, rather than thrombosis alone, may determine outcomes in DCVT.
Such observations support the role of patient-specific CFD as a potential prognostic tool. Quantitative metrics such as predicted pressure drop, collateral flow distribution, and local WSS may improve risk stratification in patients with venous sinus thrombosis [,]. While conservative anticoagulation remains first-line therapy for most DCVT cases, recent meta-analyses indicate that endovascular thrombectomy may benefit severe presentations with worsening symptoms despite medical management []. The present CFD framework could potentially inform patient selection by identifying cases with hemodynamic reserve capacity that may respond to conservative treatment versus those requiring aggressive intervention.
4.3. Comparison to Prior Studies
Previous CFD investigations of cerebral venous flow have largely focused on transverse or sigmoid sinus stenosis, where partial narrowing elevates venous pressures [,]. In contrast, our study addresses the underexplored scenario of complete straight sinus occlusion, demonstrating that when effective collateral bypass routes exist, global hemodynamics can remain within safe limits. This finding bridges an important knowledge gap between stenosis-driven impedance and collateral-mediated compensation.
4.4. Limitations
This study has several limitations. While this N = 1 study limits population-level conclusions, it establishes proof of concept for patient-specific venous CFD in rare pathologies. The rigorous sensitivity analyses (mesh independence, rheology testing, hyperemia simulation) ensure the methodology is reproducible when applied to larger cohorts. Venous walls and bridging veins were modeled as rigid. In reality, bridging veins behave as Starling resistors with partial collapsibility and compliance on the order of 2–3% area change per mmHg, which buffers intracranial pressure fluctuations []. Neglecting this mechanism may overestimate local pressure and wall shear stress. Future fluid–structure interaction (FSI) extensions could explicitly model this compliant behavior to enhance physiological realism. The present model omits vertebral and emissary venous routes, which in vivo may contribute up to 30% of total cranial venous drainage in the supine position []. Their omission could slightly overestimate jugular velocities and wall shear stress, yet overall pressure gradients (<2 mmHg) remain within physiological ranges. Incorporating these pathways in future CFD frameworks will improve the completeness of cerebral venous modeling.
Third, the exclusion of smaller bridging and cortical collaterals represents a limitation worth addressing. We tested the impact of this simplification in the normal anatomy (see Section 3.4), where adding smaller tributaries increased local wall shear stress by approximately 27% at junctions while overall pressure patterns remained stable. However, we did not perform analogous testing on the DCVT model due to imaging resolution constraints that prevented reliable segmentation of collateral pathways in the patient. Consequently, our DCVT simulations may underestimate true drainage capacity and localized hemodynamic phenomena at collateral junctions. Nevertheless, the model captures the major venous drainage pathways responsible for bulk flow dynamics, and the patient’s favorable clinical outcome suggests these pathways provided adequate drainage. Future studies with higher-resolution imaging or idealized collateral geometries would better quantify collateral contributions in DCVT hemodynamics. Fourth, the assumption of steady-state flow neglects venous pulsatility, which may influence local hemodynamic fluctuations. Assuming normal jugular function and fixed outlet pressures may overlook the effects of asymmetric or impaired outflow, which should be explored in future work.
4.5. Future Directions
Future work should incorporate multiple patient-specific geometries to establish statistical robustness. Pulsatile simulations combined with 4D phase-contrast MRI validation would allow closer alignment with in vivo physiology. In addition, fluid–structure interaction (FSI) modeling could capture the role of bridging vein compliance as Starling resistors, which buffer sudden changes in pressure and flow. Incorporating FSI modeling and coupling 3D/with lumped-parameter Starling-resistor elements [] could further capture venous wall compliance and dynamic pressure buffering. Such enhancements would strengthen the translational potential of CFD in cerebrovascular medicine.
5. Conclusions
This patient-specific CFD analysis demonstrates that cerebral venous drainage remains highly efficient despite severe DCVT, owing to collateral compensation. Compared to normal anatomy, the DCVT model showed a halved pressure drop and WSS values within physiological limits, reflecting the resilience of the venous network.
These findings provide a mechanistic explanation for the favorable outcomes observed in patients with well-developed collaterals and highlight the value of CFD in assessing hemodynamic reserve. Beyond descriptive imaging, CFD enables individualized prediction of pressure and shear stress responses under variable flow conditions, which could guide prognosis and therapy planning.
By establishing that complete venous sinus occlusion with collateral pathways does not necessarily lead to pathological hemodynamics, our study reframes the clinical interpretation of DCVT from one of inevitable risk to one of conditional resilience. Clinically, these findings suggest that anatomical imaging alone, showing absent straight sinus, is insufficient for risk stratification. CFD-derived metrics (pressure drop, WSS distribution, hyperemic reserve) may identify which patients can be safely managed conservatively versus those requiring intervention. As computational tools become clinically accessible, integration of patient-specific hemodynamic assessment into diagnostic workflows may enable truly personalized treatment decisions in rare cerebrovascular pathologies. Integration of CFD metrics into prognostic models may enable precision medicine approaches, allowing clinicians to tailor treatment based not only on anatomy but also on predicted hemodynamic consequences.
From a broader perspective, this work demonstrates how computational modeling can bridge the gap between rare clinical observations and mechanistic understanding, offering a pathway toward personalized cerebrovascular care.
Author Contributions
Conceptualization, A.M.A.; methodology, A.M.A. and G.B.; software, A.M.A.; validation, L.P.; formal analysis, A.S.; investigation, L.P.; data curation, L.P. and A.M.A.; writing—original draft preparation, A.M.A.; writing—review and editing, A.M.A.; supervision, G.B. and A.S.; project administration, A.S. All authors have read and agreed to the published version of the manuscript.
Funding
This research was conducted as part of the Erasmus Mundus Joint Master Degree in Biomedical Engineering (EMMBIOME). The first author received financial support through an Erasmus Mundus scholarship funded by the European Union (EACEA—Education, Audiovisual, and Culture Executive Agency). This paper has also been financed by the funding programme “MEDICUS”, of the University of Patras (ΝΕΑ ΔΡΑΣΗ [3.19]).
Institutional Review Board Statement
The study was conducted in accordance with the Declaration of Helsinki, and the protocol was approved by the Ethics Committee of the University Hospital Attikon (Approval code: Β’ΝΕΥΡ, ΕΒΔ31/19-1-2023. Date of approval: 7 February 2023).
Informed Consent Statement
Informed consent was waived due to the retrospective use of anonymized clinical data, in accordance with the approval of the institutional ethics committee.
Data Availability Statement
The original contributions presented in this study are included in the article. Further inquiries can be directed to the corresponding author.
Conflicts of Interest
The authors declare no conflicts of interest.
Abbreviations
The following abbreviations are used in this manuscript:
| ICVs | Internal Cerebral Veins |
| DCVT | Deep Cerebral Vein Thrombosis |
| ICP | Intracranial Pressure |
| IIH | Idiopathic Intracranial Hypertension |
| CSF | Cerebrospinal Fluid |
| IJVs | Internal Jugular Veins |
| MRV | Magnetic Resonance Venography |
| SCVs | Superior Cerebral Veins |
| SSS | Superior Sagittal Sinus |
| STS | Straight Sinus |
| WSS | Wall Shear Stress |
| CFD | Computational Fluid Dynamics |
References
- Schaller, B. Physiology of cerebral venous blood flow: From experimental data in animals to normal function in humans. Brain Res. Brain Res. Rev. 2004, 46, 243–260. [Google Scholar] [CrossRef]
- Bousser, M.-G.; Ferro, J.M. Cerebral venous thrombosis: An update. Lancet Neurol. 2007, 6, 162–170. [Google Scholar] [CrossRef]
- Kiliç, T.; Akakin, A. Anatomy of cerebral veins and sinuses. Front. Neurol. Neurosci. 2008, 23, 4–15. [Google Scholar] [PubMed]
- Agarwal, N.; Carare, R.O. Cerebral Vessels: An Overview of Anatomy, Physiology, and Role in the Drainage of Fluids and Solutes. Front. Neurol. 2021, 11, 611485. [Google Scholar] [CrossRef] [PubMed]
- Ferro, J.M.; Canhão, P.; Stam, J.; Bousser, M.-G.; Barinagarrementeria, F. Prognosis of Cerebral Vein and Dural Sinus Thrombosis. Stroke 2004, 35, 664–670. [Google Scholar] [CrossRef] [PubMed]
- Liu, L.; Wu, Y.; Zhang, K.; Meng, R.; Duan, J.; Zhou, C.; Ji, X. Anatomy, imaging and hemodynamics research on the cerebral vein and venous sinus among individuals without cranial sinus and jugular vein diseases. Front. Neurosci. 2022, 16, 999134. [Google Scholar] [CrossRef]
- Sadik, J.-C.; Jianu, D.C.; Sadik, R.; Purcell, Y.; Novaes, N.; Saragoussi, E.; Obadia, M.; Lecler, A.; Savatovsky, J. Imaging of Cerebral Venous Thrombosis. Life 2022, 12, 1215. [Google Scholar] [CrossRef]
- Bateman, A.R.; Bateman, G.A.; Barber, T. The relationship between cerebral blood flow and venous sinus pressure: Can hyperemia induce idiopathic intracranial hypertension? Fluids Barriers CNS 2021, 18, 5. [Google Scholar] [CrossRef]
- Kouzmitcheva, E.; Andrade, A.; Muthusami, P.; Shroff, M.; MacGregor, D.L.; deVeber, G.; Dlamini, N.; Moharir, M. Anatomical Venous Variants in Children With Cerebral Sinovenous Thrombosis. Stroke 2019, 50, 178–180. [Google Scholar] [CrossRef]
- Shen, Y.; Wei, Y.; Bokkers, R.P.H.; Uyttenboogaart, M.; Van Dijk, J.M.C. Patient-Specific Cerebral Blood Flow Simulation Based on Commonly Available Clinical Datasets. Front. Bioeng. Biotechnol. 2022, 10, 835347. [Google Scholar] [CrossRef]
- Ma, L.; Chen, Y.; Chen, P.; Ma, L.; Yan, D.; Li, R.; Li, Z.; Zhang, H.; Han, H.; Yuan, K.; et al. Quantitative hemodynamics of draining veins in brain arteriovenous malformation: A preliminary study based on computational fluid dynamics. Front. Neurol. 2024, 15, 1474857. [Google Scholar] [CrossRef]
- Luisi, C.A.; Witter, T.L.; Nikoubashman, O.; Wiesmann, M.; Steinseifer, U.; Neidlin, M. Evaluating the accuracy of cerebrovascular computational fluid dynamics modeling through time-resolved experimental validation. Sci. Rep. 2024, 14, 8194. [Google Scholar] [CrossRef]
- Calandrelli, R.; Colò, F.; Broccolini, A.; Della Marca, G.; Frisullo, G.; Colosimo, C.; Pilato, F. Deep cerebral venous system involvement in patients with cerebral sinus thrombosis. A proposal of neuroradiological score systems useful for clinical assessment. Neurol. Sci. 2023, 44, 2049–2060. [Google Scholar] [CrossRef]
- He, Y.; Northrup, H.; Le, H.; Cheung, A.K.; Berceli, S.A.; Shiu, Y.T. Medical Image-Based Computational Fluid Dynamics and Fluid-Structure Interaction Analysis in Vascular Diseases. Front. Bioeng. Biotechnol. 2022, 10, 855791. [Google Scholar] [CrossRef]
- Saposnik, G.; Bushnell, C.; Coutinho, J.M.; Field, T.S.; Furie, K.L.; Galadanci, N.; Kam, W.; Kirkham, F.C.; McNair, N.D.; Singhal, A.B.; et al. Diagnosis and Management of Cerebral Venous Thrombosis: A Scientific Statement From the American Heart Association. Stroke 2024, 55, e77–e90. [Google Scholar] [CrossRef]
- Stoquart-Elsankari, S. A Phase-Contrast MRI Study of Physiologic Cerebral Venous Flow. J. Cereb. Blood Flow Metab. 2009, 29, 1208–1215. [Google Scholar] [CrossRef] [PubMed]
- Dai, C.; Wang, C.; Zhang, Y.; Zhuo, Y.; Zhu, T.; Fan, S.; Yuan, J. Cerebral sinus hemodynamics in adults revealed by 4D Flow MRI. J. Magn. Reson. Imaging 2024, 60, 1706–1717. [Google Scholar] [CrossRef] [PubMed]
- Brambila-Solórzano, A.; Méndez-Lavielle, F.; Naude, J.L.; Martínez-Sánchez, G.J.; García-Rebolledo, A.; Hernández, B.; Escobar-del Pozo, C. Influence of Blood Rheology and Turbulence Models in the Numerical Simulation of Aneurysms. Bioengineering 2023, 10, 1170. [Google Scholar] [CrossRef]
- Taebi, A.; Berk, S.; Roncali, E. Realistic boundary conditions in SimVascular through inlet catheter modeling. BMC Res. Notes 2021, 14, 215. [Google Scholar] [CrossRef]
- Hattori, Y.; Imada, S.; Usui, R.; Yamamoto, A.; Nakamura, M.; Ihara, M. High Middle Cerebral Artery Wall Shear Stress in Branch Atheromatous Disease: A Computational Fluid Dynamics Analysis. J. Atheroscler. Thromb. 2025, 32, 994–1005. [Google Scholar] [CrossRef] [PubMed]
- Stahl, J.; Abou-Mrad, T.; Stone McGuire, L.; Janiga, G.; Saalfeld, S.; Alaraj, A.; Berg, P. Flow-based simulation in transverse sinus stenosis pre- and post-stenting: Pressure prediction accuracy, hemodynamic complexity, and relationship to pulsatile tinnitus. J. Neurointerv. Surg. 2025, online ahead of print. [Google Scholar] [CrossRef] [PubMed]
- Huang, S.-L.; Xin, H.-Y.; Wang, X.-Y.; Feng, G.-G.; Wu, F.-Q.; Feng, Z.-P.; Xing, Z.; Zhang, X.-H.; Xin, H.-W.; Luo, W.-Y. Recent Advances on the Molecular Mechanism and Clinical Trials of Venous Thromboembolism. J. Inflamm. Res. 2023, 16, 6167–6178. [Google Scholar] [CrossRef]
- Bivard, A.; Parsons, M. Normal and Abnormal Physiology of Cerebral Blood Flow. Radiology Key. 2018. Available online: https://radiologykey.com/normal-and-abnormal-physiology-of-cerebral-blood-flow/ (accessed on 13 September 2025).
- Liu, X.; Lan, L.; Lin, Y.; Zeng, C.; Liu, J.; Cao, W.; Fan, Y.; Yang, X. Quantitative analysis of blood flow in cerebral venous sinus with stenosis by patient-specific CFD modeling. IEEE Access 2019, 7, 3848–3854. [Google Scholar] [CrossRef]
- Ghozy, S.; Orscelik, A.; Tolba, H.; Abdelghaffar, M.; Kobeissi, H.; Ghaith, H.S.; Abbas, A.S.; Kadirvel, R.; Brinjikji, W.; Kallmes, D.F. Endovascular thrombectomy for severe cerebral venous thrombosis: A comprehensive meta-analysis assessing safety and efficacy. Interv. Neuroradiol. 2024, online ahead of print. [Google Scholar] [CrossRef]
- Han, Y.; Xia, J.; Jin, L.; Qiao, A.; Su, T.; Li, Z.; Xiong, J.; Wang, H.; Zhang, Z. Computational fluid dynamics study of the effect of transverse sinus stenosis on the blood flow pattern in the ipsilateral superior curve of the sigmoid sinus. Eur. Radiol. 2021, 31, 6286–6294. [Google Scholar] [CrossRef]
- Zhu, Y.; Wang, F.; Deng, X. Hemodynamics of cerebral bridging veins connecting the superior sagittal sinus based on numerical simulation. Biomed. Eng. OnLine 2018, 17, 35. [Google Scholar] [CrossRef] [PubMed]
- Chabannes, V.; Ismail, M.; Prud’homme, C.; Szopos, M. Hemodynamic simulations in the cerebral venous network: A study on the influence of different modeling assumptions. J. Coupled Syst. Multiscale Dyn. 2015, 3, 23–37. [Google Scholar] [CrossRef]
Disclaimer/Publisher’s Note: The statements, opinions and data contained in all publications are solely those of the individual author(s) and contributor(s) and not of MDPI and/or the editor(s). MDPI and/or the editor(s) disclaim responsibility for any injury to people or property resulting from any ideas, methods, instructions or products referred to in the content. |
© 2025 by the authors. Licensee MDPI, Basel, Switzerland. This article is an open access article distributed under the terms and conditions of the Creative Commons Attribution (CC BY) license (https://creativecommons.org/licenses/by/4.0/).