Abstract
Detection of cephalometric landmarks has contributed to the analysis of malocclusion during orthodontic diagnosis. Many recent studies involving deep learning have focused on head-to-head comparisons of accuracy in landmark identification between artificial intelligence (AI) and humans. However, a human–AI collaboration for the identification of cephalometric landmarks has not been evaluated. We selected 1193 cephalograms and used them to train the deep anatomical context feature learning (DACFL) model. The number of target landmarks was 41. To evaluate the effect of human–AI collaboration on landmark detection, 10 images were extracted randomly from 100 test images. The experiment included 20 dental students as beginners in landmark localization. The outcomes were determined by measuring the mean radial error (MRE), successful detection rate (SDR), and successful classification rate (SCR). On the dataset, the DACFL model exhibited an average MRE of 1.87 ± 2.04 mm and an average SDR of 73.17% within a 2 mm threshold. Compared with the beginner group, beginner–AI collaboration improved the SDR by 5.33% within a 2 mm threshold and also improved the SCR by 8.38%. Thus, the beginner–AI collaboration was effective in the detection of cephalometric landmarks. Further studies should be performed to demonstrate the benefits of an orthodontist–AI collaboration.
1. Introduction
In orthodontics, detection of cephalometric landmarks refers to the localization of anatomical landmarks of the skull and surrounding soft tissues on lateral cephalograms. Since the introduction of lateral cephalograms by Broadbent and Hofrath in 1931, this approach has contributed to the analysis of malocclusion and has become a standardized diagnostic method in orthodontic practice and research [1]. In the last decade, an advanced machine-learning method called “deep learning” has received attention. Several studies have been conducted to improve the accuracy of landmark identification using lateral cephalograms. Deep learning-based reports using convolutional neural networks (CNNs) have achieved remarkable results [2,3,4,5]. These results suggest that deep learning using CNNs can assist dentists to reducing clinical problems related to orthodontic diagnosis such as tediousness, time wastage, and inconsistencies within and across orthodontists.
For the detection of anatomical landmarks, the Institute of Electrical and Electronics Engineers (IEEE) International Symposium on Biomedical Imaging (ISBI) 2015 released an open dataset for training and testing of cephalograms. Despite the limited number of annotated cephalograms, many CNN-based approaches have been proposed to solve the problem associated with the detection of anatomical landmarks. In 2017, Arik et al. introduced a framework that employed a CNN to recognize landmark appearance patterns and subsequently combined it with a statistical shape model to refine the optimal positions of all landmarks [6]. To address the restricted availability of medical imaging data for network learning with respect to the localization of anatomical landmarks, Zhang et al. proposed a two-stage task-oriented deep neural network method [7]. In addition, Urschler et al. proposed a unified framework that incorporated the image appearance information as well as geometric landmark configuration into a unified random forest framework, which was optimized iteratively to refine joint landmark predictions using a coordinate descent algorithm [8]. Recently, Oh et al. proposed the deep anatomical context feature learning (DACFL) model, which employs a Laplace heatmap regression method based on a fully convolutional network. Its main mechanism is accomplished using two main schemes: local feature perturbation (LFP) and anatomical context (AC) loss. LFP can be considered a data augmentation method based on prior anatomical knowledge. It perturbs the local pattern of the cephalogram, forcing the network to seek relevant features globally. AC loss can result in a large cost when the predicted anatomical configuration of landmarks differs from the ground-truth configuration. The anatomical configuration considers the angles and distances between all landmarks. Since the proposed system follows an end-to-end learning method, only a single feed-forward execution is required in the test phase to localize all landmarks [2].
Most research to date has focused on head-to-head comparisons between artificial intelligence (AI)-based systems and dentists for the localization of cephalometric landmarks [2,3,4,5,6,9,10,11,12,13,14,15,16]. Previous studies have shown that AI is equivalent or even superior to experienced orthodontists under experimental conditions [11,13]. Rapid developments in AI-based diagnosis have made it imperative to consider the opportunities and risks of new diagnostic paradigms. In fact, competition between humans and AI is against the nature and purpose of AI. Therefore, AI support for human diagnosis may be more useful and practical. The competitive view about AI is evolving based on studies indicating that a human–AI collaboration approach is more promising. The impact of human–AI collaboration on the accuracy of cephalometric landmark detection has not been evaluated to date. This leads to the following question: can a human–AI collaboration perform better than humans or AI alone in cephalometric landmark detection?
Among the previous CNN models, DACFL outperformed other state-of-the-art methods and achieved high performance in landmark identification on the IEEE ISBI 2015 dataset [2]. Therefore, our study aimed to evaluate the effect of DACFL-based support on the clinical skills of beginners in cephalometric diagnosis. Furthermore, we used a private dataset to evaluate the performance of the DACFL model in clinical applications.
2. Materials and Methods
2.1. Data Preparation
Altogether, 1293 lateral cephalograms were collected from the Picture-Aided Communication System server (INFINITT Healthcare Co., Ltd., Seoul, Korea) at Jeonbuk National University Dental Hospital, South Korea. Furthermore, images were collected from children and adolescents aged 6–18 years who visited the Department of Pediatric Dentistry for orthodontic treatment between 2008 and 2018. All applicable data protection laws were respected. During images collection, patient information was removed from the cephalograms. This study was approved by the Institutional Review Board of Jeonbuk National University Hospital (No. CUH2019-05-057).
Lateral cephalograms were acquired for diagnostic purposes and exported in the JPG format, with resolutions varying between 550 × 550 and 4066 × 4345 pixels. The dataset was built without any restrictions in terms of sex, craniofacial or dental surgery, and treatment. In the first step, 1193 images were randomly selected as training data and 100 images were used as test data. The characteristics of data are listed in Table 1.

Table 1.
Descriptive summary of study data.
Data are expressed mean ± standard deviation (SD) for age and N (%) for gender, class I, II division 1, II division 2, and III.
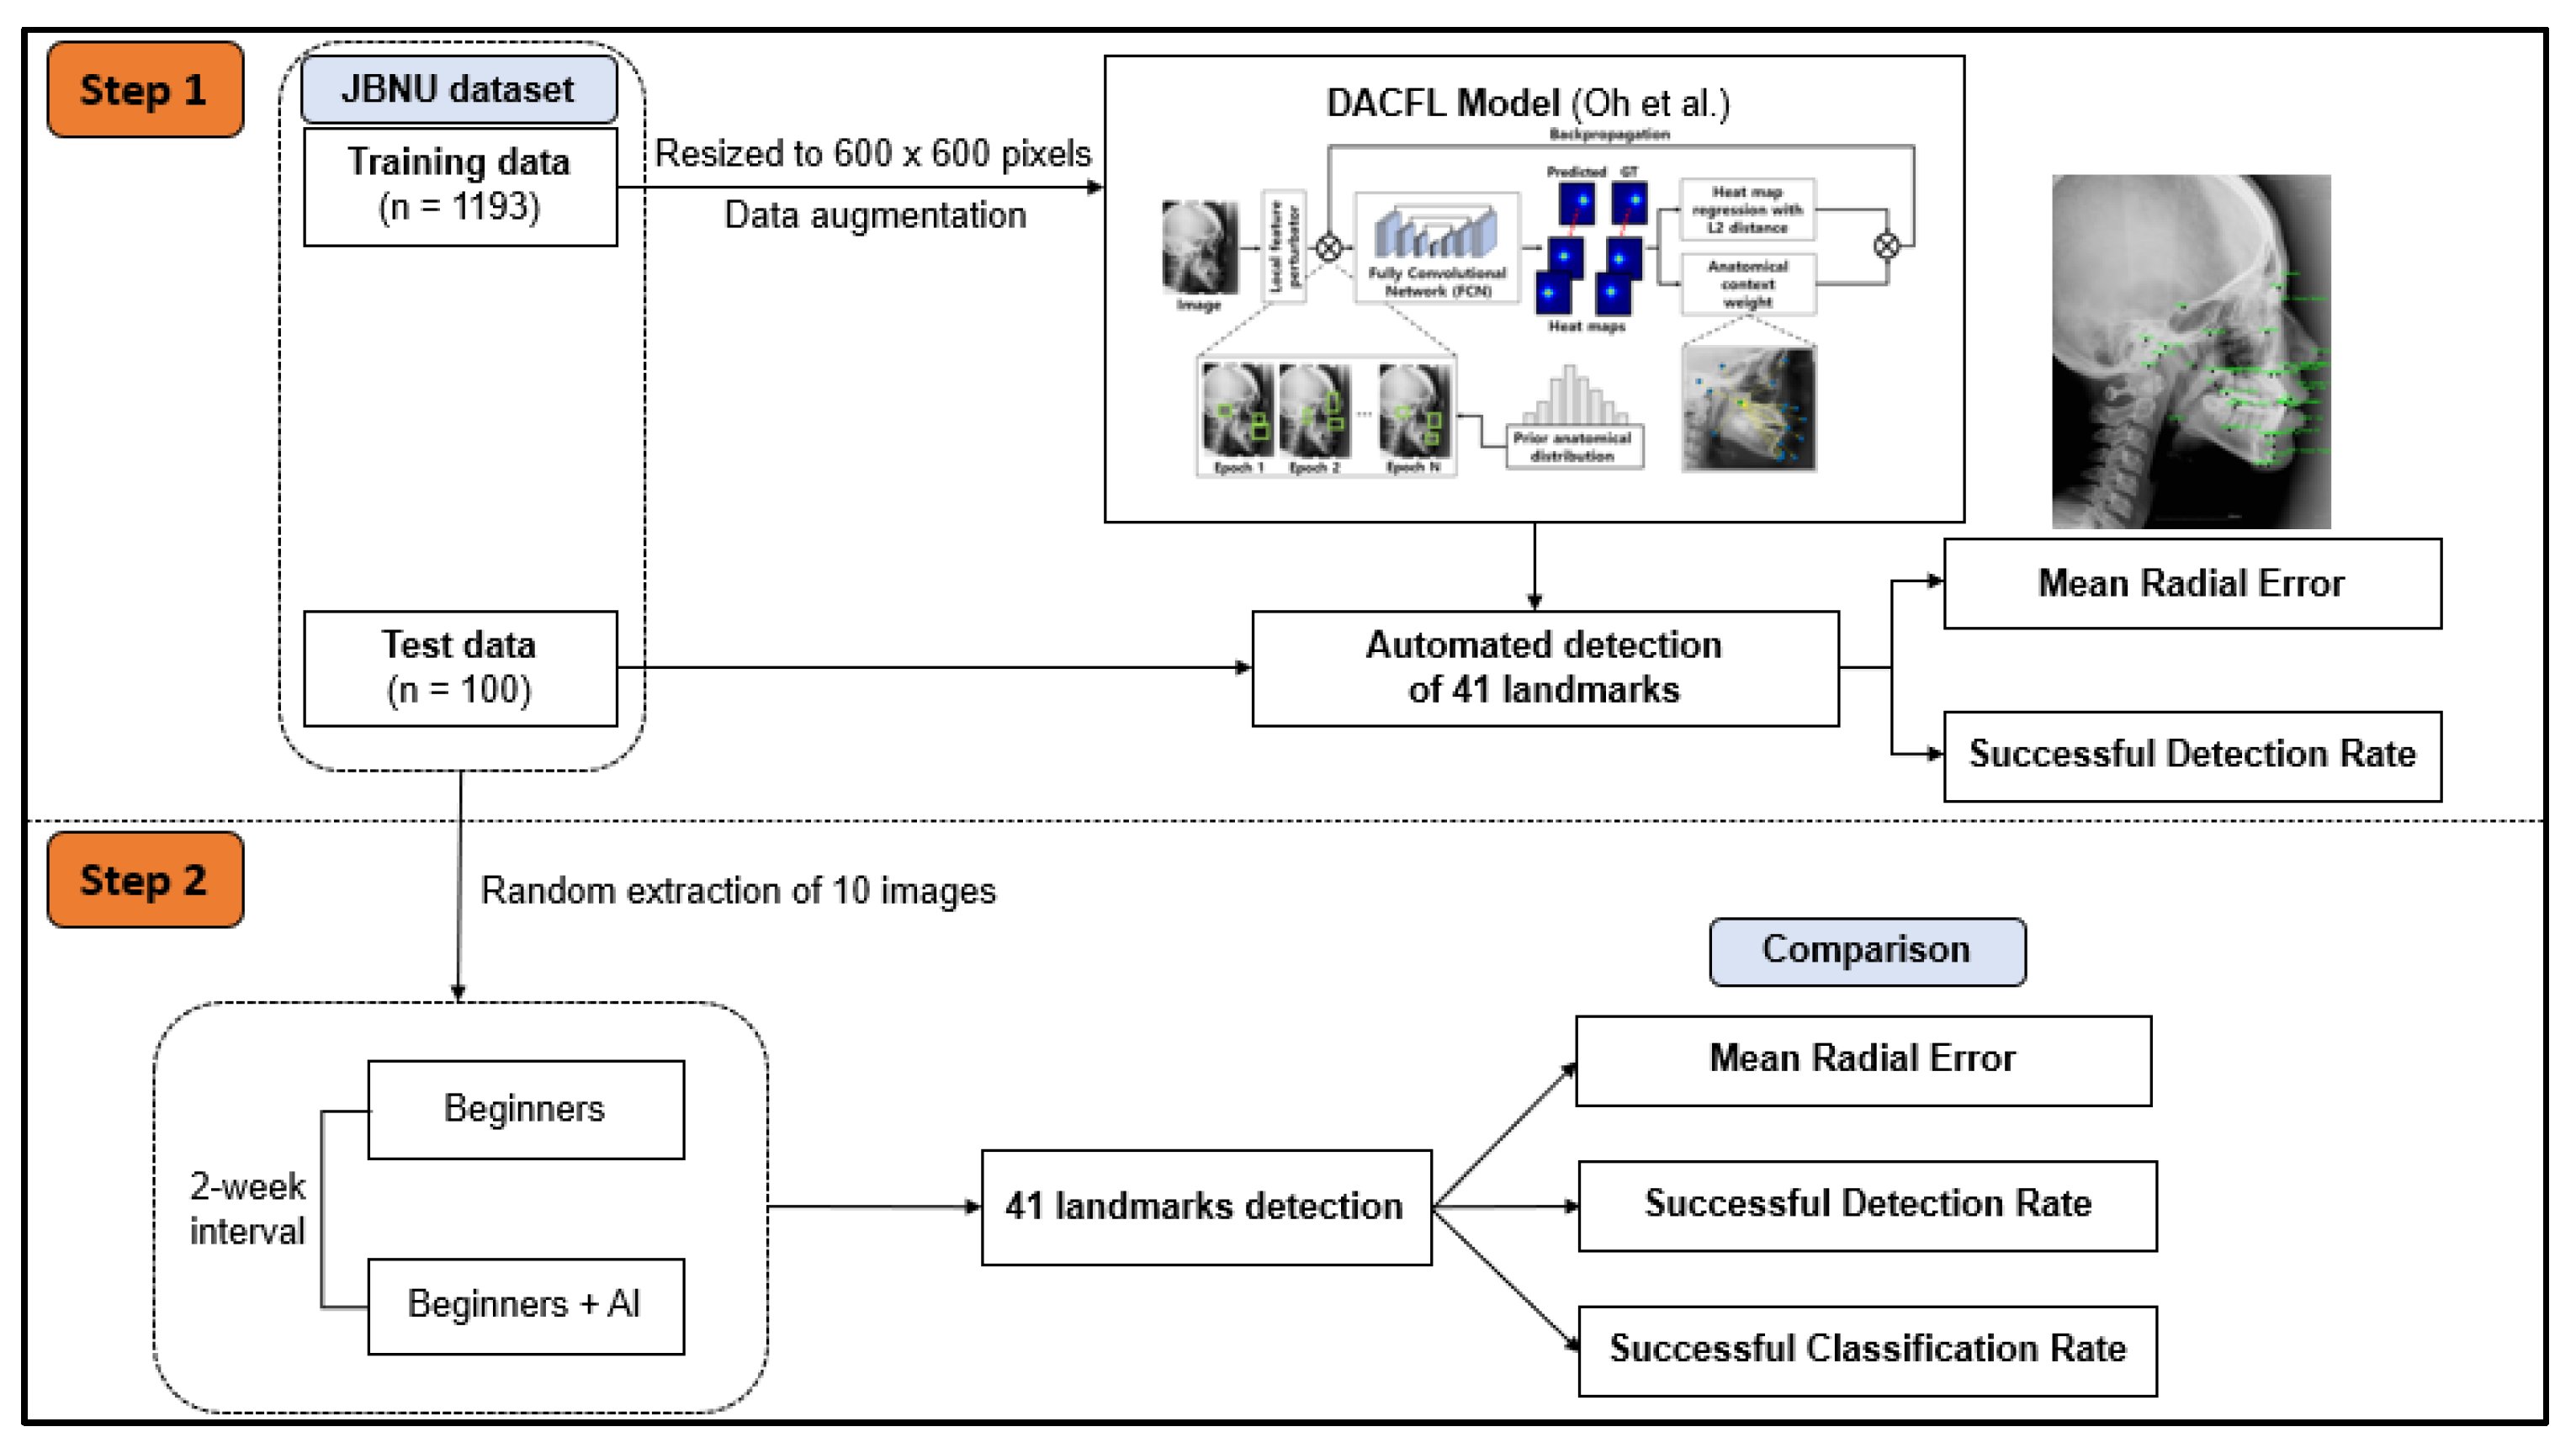
In the subsequent step, 10 images from the test data were extracted randomly to evaluate the impact of human–AI collaboration on the detection of cephalometric landmarks (Figure 1).

Figure 1.
Workflow diagram of the study plan. In step 1, JBNU dataset including 1193 images for training and 100 images for testing was used to evaluate the performance of the DACFL model in clinical applications. In step 2, 10 images were extracted randomly from JBNU test data to evaluate the effect of DACFL-based support on the clinical skills of beginners in cephalometric diagnosis. Abbreviations: AI, artificial intelligence; DACFL, deep anatomical context feature learning; JBNU, Jeonbuk National University.
2.2. Manual Identification of Cephalometric Landmarks
Altogether, 41 landmarks were manually identified by dental residents at the Department of Pediatric Dentistry, Jeonbuk National University Dental Hospital, South Korea (Supplementary Table S1). A modified version of a commercial cephalometric analysis software (V-Ceph version 7, Osstem Implant Co., Ltd., Seoul, Korea) was used to digitize the records of the 41 cephalometric landmarks. This software displayed the cephalograms and obtained the coordinates of each landmark.
In this experiment, 20 final-year students from the School of Dentistry, Jeonbuk National University, South Korea were selected as beginners. Ten cephalograms that had been analyzed twice (at a 1-week interval) were used to evaluate the support ability of AI. Analyses of cephalograms were performed at the following two timepoints.
- (1)
- Twenty dental students were educated regarding the definitions of cephalometric landmarks and the use of the V-Ceph software before the experiment. All students traced the positions of anatomical landmarks without AI support. After tracing, the ground truth was not provided for the students.
- (2)
- After 1 week, all students traced the anatomical landmarks on 10 randomly arranged images while going through the answers provided by the AI model. The students were not reported about reusing the images from the previous experiment. These answers were displayed separately from the actual screen of landmarks. If the students changed their answers by replacing them with the answers provided by AI, the changes were recorded.
2.3. Network Architecture and Implementation Details
Our architecture was based on the attention U-Net [17]. The contracting path and the expansive path consisted of repeated applications of two 3 × 3 convolutions, each followed by LeakyReLU activation and 2 × 2 max pooling (for the contracting path) or up-sampling (for the expansive path) [18]. The number of feature channels increased from 64 to 128, 256, and 512 in the contracting path and decreased from 512 to 256, 128, and 64 in the expansive path. We used AC loss [2] as a cost function and minimized it by using an Adam optimizer. The initial learning rate was 1 × 10⁻⁴, and the learning rate was set by cosine annealing schedule.
Additionally, we performed data augmentation by rotating the input images randomly by [−25, 25], rescaling by [0.9, 1.1], and translating by [0, 0.05] for both the x-axis and y-axis. We changed the brightness, contrast, and hue of the input images randomly in the ranges [−1, 1], [−1, 1], and [−0.5, 0.5], respectively. The ranges are the ones given by PyTorch. With a 1/10 probability, we did not apply a data augmentation procedure to the input images to ensure that the deep learning model could learn the original image [2].
We trained and tested the network using an Intel Xeon Gold 6126 2.6 GHz CPU with 64 GB memory and a RTX 2080 Ti GPU with an 11 GB RAM. The average size of the input images was 2067 × 1675 pixels, and each image had a different pixel size. Therefore, we calculated the pixel length of a 50 mm X-ray ruler to calculate the pixel size for each test image. We resized the input images to 800 × 600 pixels with a mini-batch size of two to reduce the computing time. In the test phase, we resized the result to the original input size to obtain the correct result.
2.4. Evaluation Matrices
We used different measurement methods to measure the performance of the landmark-detection model. The positions of the landmarks were identified using the x- and y-coordinates. The mean radial error (MRE) and standard deviation (SD) are calculated as follows:
In these equations, N denotes the set size. The radial error (R) is the Euclidean distance and is defined as the distance between the predicted and actual coordinates.
The successful detection rate (SDR) is an important measure for this problem. The estimated coordinates are considered correct if the error between the estimated coordinates and the correct position is less than a precision range. The SDR was calculated as follows:
In this equation, z means the precision ranges of 2, 2.5, 3, and 4 mm.
For the classification of anatomical types, the eight clinical measurements set in the IEEE ISBI 2015 challenge were analyzed (Supplementary Table S2) [19,20]. The measurement values and classification results derived by the dental residents were set as the reference values, while the classification results by the AI, beginners, and beginner–AI collaboration were compared using the successful classification rate (SCR).
2.5. Statistical Analysis
The benefits of the beginner–AI collaboration were analyzed for each landmark. A t-test was applied to compare the average SDR between the beginner-only and beginner–AI groups within 2, 2.5, 3, and 4 mm thresholds. All data were analyzed using IBM SPSS Statistics (version 20; IBM Corp., Armonk, NY, USA) and PRISM (version 8.0.2; GraphPad Software, Inc.; San Diego, CA, USA). Statistical significance was set at a p-value < 0.05.
3. Results
3.1. Performance of the DACFL Model on the Private Dataset
3.1.1. Mean Radial Error
The DACFL model showed an average MRE of 1.87 ± 2.04 mm (Table 2). Among the 41 landmarks, the sella exhibited the lowest MRE (0.76 ± 0.44 mm), while the glabella exhibited the highest MRE (5.18 ± 5.13 mm).
Table 2.
Results of landmark detection in terms of mean radial error.
3.1.2. Successful Detection Rate
The model achieved average SDRs of 73.32%, 80.39%, 85.61%, and 91.68% within 2, 2.5, 3, and 4 mm thresholds, respectively. Across all ranges, the sella exhibited the highest SDR, while the glabella exhibited the lowest SDR. In addition, the SDRs of maxilla 1 root (38%), mandible 6 root (36%), glabella (32%), and soft tissue nasion (38%) were low within the 2 mm threshold (Table 3).
Table 3.
Results of landmark detection in terms of successful detection rate.
3.2. Impact of Artificial Intelligence-Based Assistance on the Performance of Beginners in the Detection of Cephalometric Landmarks
3.2.1. Mean Radial Error and Successful Detection Rate
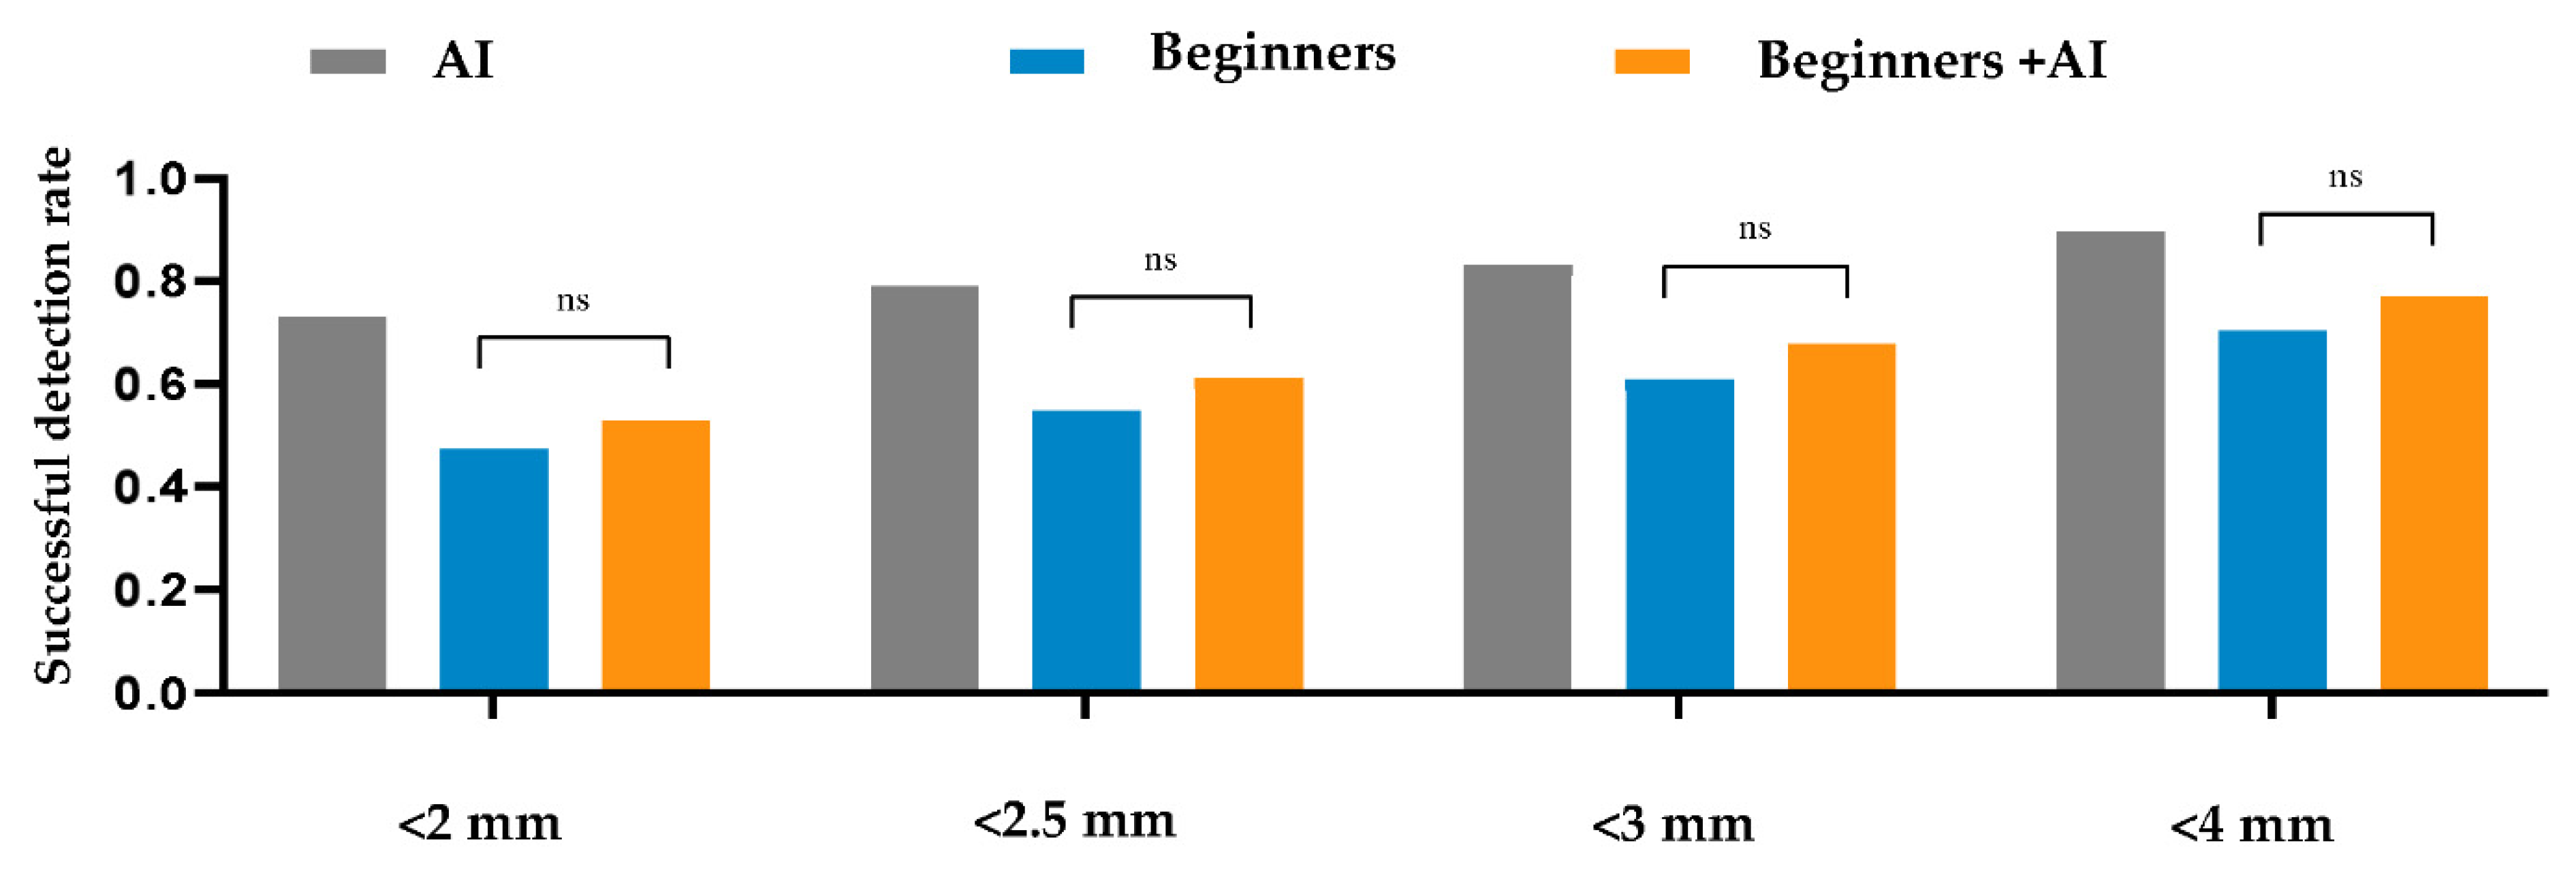
Within a 2 mm threshold, the AI, beginner–AI, and beginner-only groups achieved SDRs of 73.17%, 52.73%, and 47.4%, respectively. Furthermore, the average MREs and SDs of AI, beginner–AI, and beginner-only groups were 1.89 ± 2.63 mm, 3.14 ± 4.06 mm, and 3.72 ± 4.52 mm, respectively. Details are reported in Table 4. Furthermore, a comparison between beginner-only and beginner–AI groups in terms of the SDR is shown in Figure 2.
Table 4.
Quantitative comparison by average successful detection rate and mean radial error.
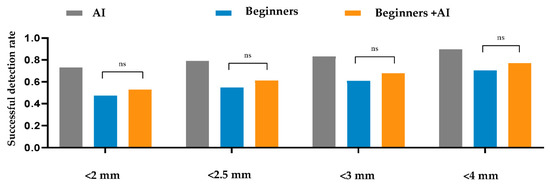
Figure 2.
Comparison between the beginner-only and beginner–artificial intelligence groups in terms of the successful detection rate. A t-test was applied to compare the average successful detection rates between the beginner-only and beginner–AI groups within 2, 2.5, 3, and 4 mm thresholds. The beginner–AI collaboration improved the successful detection rates within 2, 2.5, 3, and 4 mm thresholds. Abbreviations: AI, artificial intelligence; ns, not significant.
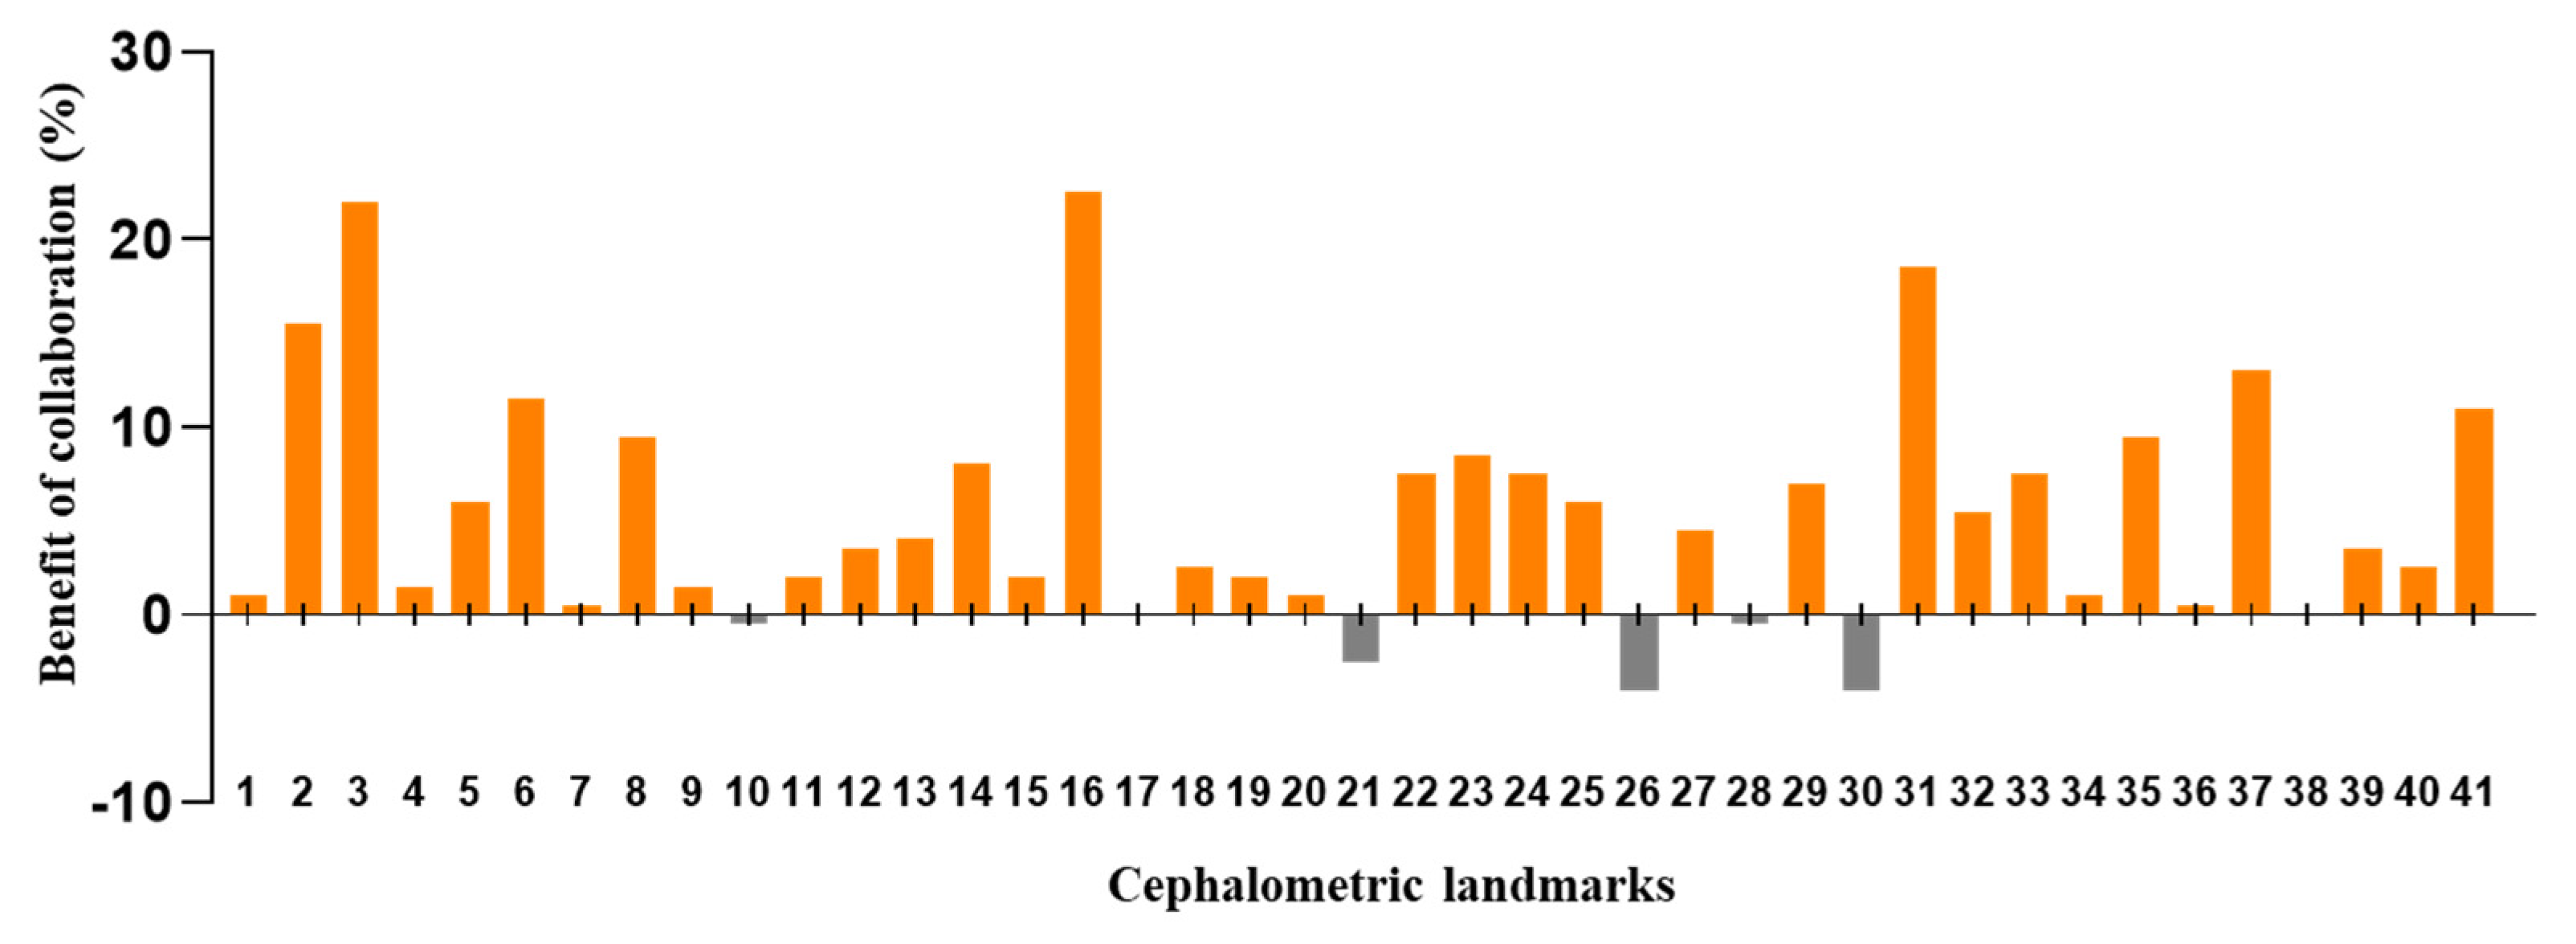
The DACFL model showed that the lower lip exhibited the lowest MRE (0.62 ± 0.35 mm) and the highest SDR (100%) while the glabella exhibited the highest MRE (5.72 ± 3.54 mm) and lowest SDR (20%) (Table 5). In the beginner-only group, mandible 1 crown exhibited the lowest MRE (1.31 ± 2.99 mm) and highest SDR (93%), while the glabella exhibited the highest MRE (8.9 ± 7.05 mm) and lowest SDR (20%). In the beginner–AI group, mandible 1 crown exhibited the lowest MRE (1.23 ± 2.96 mm) and highest SDR (94%), while the glabella exhibited the highest MRE (7.31 ± 5.42 mm) and lowest SDR (16%). The benefits of AI– beginner collaboration in the localization of anatomical landmarks and the number of decision changes among the beginners across 41 landmarks are presented in Figure 3 and Figure 4.
Table 5.
Successful detection rate and mean radial error for each landmark within a 2 mm threshold.

Figure 3.
Benefit of beginner–AI collaboration in the detection of cephalometric landmarks. Based on successful detection rate for each landmark within a 2 mm threshold, the benefits of beginner–AI collaboration were analyzed. In general, this collaboration showed a positive impact on the majority of cephalometric landmarks.
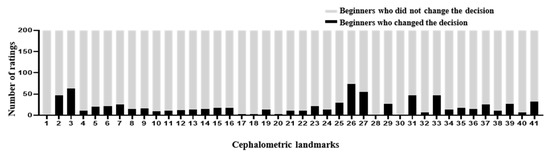
Figure 4.
Number of decision changes among beginners across 41 landmarks. In the second experiment, the beginners traced the anatomical landmarks on 10 images with the AI’s answer view. The recorded changes are represented as number of ratings. In general, the number of decision changes was small despite being shown at most anatomical landmarks.
3.2.2. Successful Classification Rate
The AI, beginner–AI, and beginner-only groups achieved SCRs of 83.75%, 69.69%, and 61.31%, respectively (Table 6). In the AI group, the SNA (100%) and FHA (100%) exhibited the highest SCR, while the ANB (60%) exhibited the lowest SCR. In the beginner-only group, the MW (81%) exhibited the highest SCR, while the ANB (47%) exhibited the lowest SCR. Among beginner–AI group, the FHA (88%) exhibited the highest SCR while ANB (52%) exhibited the lowest SCR. A comparison between beginner-only and beginner–AI groups in terms of eight measurement parameters is shown in Figure 5.
Table 6.
Successful classification rate for eight clinical measurements.
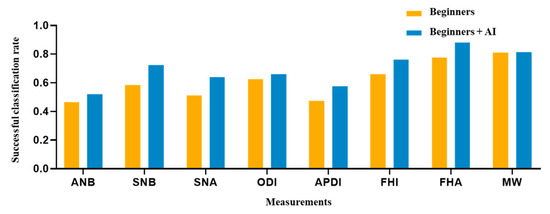
Figure 5.
Comparison of eight clinical measurements between the beginner-only and beginner–AI groups. From the SCRs of two groups, a figure was presented to demonstrate the AI’s support. As a result, the beginner–AI collaboration improved the SCRs of eight clinical measurements. Abbreviation: SCR, successful classification rate.
4. Discussion
4.1. Performance of the DACFL Model on the Private Dataset
Most previous studies have tested the accuracy of anatomical landmark detection on IEEE ISBI 2015 lateral cephalograms [2,3,4,5,6,9,15], possibly showing high comparability, but limited generalizability. Therefore, testing broad data can demonstrate the generalizability and robustness of the model. Among the previous models, the DACFL model showed a high SDR as a state-of-the-art model for cephalometric landmark detection [2]. In the case of private cephalograms, the model showed a slight reduction in the SDR within a 2 mm threshold. This result was superior or similar to those from previous studies [3,4,12]. In a previous study, an even more dramatic drop in the accuracy was observed when the models were tested on a fully external dataset [3,4]. Overall, the results for the private dataset were inferior to those for the public dataset with standardized images [2,3,4,5,6,9,15].
In the present study, the private dataset was associated with difficulties in landmark detection in children. These difficulties were probably due to low bone density, size and shape variability of anatomical structures, and the existence of primary teeth and permanent tooth germs. In addition to maxillofacial anatomy, patients’ heads vary in shape. Although we selected a reference cephalogram that was closely matched to the one from training data for each test, there were still missed situations. Correct head positioning of the patient during the procedure is important to avoid errors in the identification and measurement of landmarks [4,21,22]. It is difficult to maintain the heads of children in standard positions. In addition to the quality of dataset, the number of images and cephalometric landmarks also influence the results. A previous study showed that the accuracy of AI increased linearly with an increasing number of learning datasets and decreased with an increasing number of detection targets [23]. Our study used an insufficiently large number of images and detected 41 anatomical landmarks. The training data should be increased to an optimal number of images between 2300 and 5400 to improve the performance of landmark detection.
For clinical applications, a mean error within a 2 mm threshold has been suggested to be acceptable in many related studies [2,3,4,5,6,9,10,11,13,14,15,16,24]. Therefore, the MRE in the present study was clinically acceptable. However, while assessing which specific landmarks were prone to incorrect detection, the maxilla 1 root, mandible 6 root, glabella, and soft tissue nasion showed greater deviations. These findings are not consistent with those from previous studies [3,4,12]. This discrepancy can be explained by the fact that maxilla 1 root was affected by the existence of maxillary anterior tooth germs. The location of the apex was based on general knowledge of the expected taper perceived from the crown and visible portion of the root. This problem was also encountered during previous research on reliability [10,11,25,26,27,28]. Furthermore, the mandible 6 root was affected by overlapping structures, which is a common problem in the lateral cephalograms. Dental landmarks usually tend to have poorer validity than skeletal landmarks [10,11,27]. Soft tissue nasion and the glabella were located in areas with considerably higher dark. Thus, it was difficult to identify these soft tissue landmarks precisely, even in a magnified view.
4.2. Impact of AI-Based Assistance on the Performance of Beginners in Cephalometric Landmark Detection
The AI group had the highest average SDR, followed by the beginner–AI and beginner-only groups. With AI support, the average SDR increased by up to 5.33% within a 2 mm threshold, while the average MRE decreased. Detection of porion, basion, nasion, articulare, soft tissue A, soft tissue pogonion, and PPOcc improved over 10% in terms of SDR. The remaining landmarks were detected with little or no improvement in the SDR (Figure 2). In general, AI aids beginners in improving landmark detection. This was demonstrated by the impact of the beginner–AI collaboration on each landmark (Figure 3). However, the improvement was insignificant, since there were small changes in the positions of the landmarks (Figure 4).
In addition to the SDR, we calculated the SCR to evaluate the classification performance. The DACFL model showed better results than previous models [6,12,29]. As expected, measurements consisting of landmarks with higher SDRs yielded higher SCR values. The average SCRs of the three groups showed a descending trend similar to that observed in case of average SDRs (highest in the AI group, followed by the beginner–AI group and the beginner-only group). With AI support, the average SCR increased by 8.38%, but the increase was not statistically significant. This may be explained by the low increase in the SDRs with AI support. The SCRs for the measurement of SNA, SNB, APDI, FHI, and FHA improved over 10%, while the SCR showed little improvement for the remaining measurements (Table 6).
In the present study, beginners were the final-year dental students with little experience in the detection of cephalometric landmarks. The precision of landmark identification can be affected by various factors such as the level of knowledge, individual understanding of the definitions of landmarks, and quality of cephalometric images [30,31]. Among the soft tissue landmarks, glabella, soft tissue nasion, columella, soft tissue A, and stms showed low SDRs due to higher dark in these regions. Problems with image quality influenced the ability of dental students who lacked experience in cephalometric landmark detection. In a previous study, dental students showed a high variability in landmark identification results [32]. This finding is consistent with the results of the present study (Table 5). Furthermore, inexperienced annotators exhibited a lower accuracy of landmark detection than AI for lateral cephalograms, which was consistent with the results of a previous study involving frontal cephalograms [33].
Our study has several limitations. The private dataset was small and had fewer variations. The patients were children and adolescents. This might have influenced the detection of cephalometric landmark. Thus, private datasets for adults should be investigated to confirm the performance of the DACFL model. The number of cephalometric landmarks was not sufficiently large to examine the full ability the of model. Moreover, landmark identification was performed by beginners. A previous study showed that experienced orthodontists exhibited lower variability in landmark detection than dental students. Further studies are necessary to demonstrate the benefits of a collaboration between AI and experienced orthodontists.
5. Conclusions
Our study showed that the DACFL model achieved an SDR of 73.17% within a 2 mm threshold on a private dataset. Furthermore, the beginner–AI collaboration improved the SDR by 5.33% within a 2 mm threshold and also improved the SCR by 8.38% when compared with beginners. These results suggest that the DACFL model is applicable to clinical orthodontic diagnosis. Further studies should be performed to demonstrate the benefits of a collaboration between AI and experienced orthodontists.
Supplementary Materials
The following supporting information can be downloaded at: https://www.mdpi.com/article/10.3390/jpm12030387/s1, Table S1, List of anatomical landmarks; Table S2, Classification criteria for anatomical types.
Author Contributions
Conceptualization, V.N.T.L., I.-S.O. and D.-W.L.; methodology, V.N.T.L. and D.-W.L.; software, V.N.T.L. and D.-W.L.; validation, J.-G.K., Y.-M.Y. and D.-W.L.; formal analysis, V.N.T.L. and J.K.; investigation, V.N.T.L. and D.-W.L.; resources, J.-G.K. and Y.-M.Y.; data curation, V.N.T.L.; writing—original draft preparation, V.N.T.L.; writing—review and editing, all authors; visualization, V.N.T.L. and D.-W.L.; supervision, all authors; project administration, I.-S.O. and D.-W.L.; funding acquisition, I.-S.O. and D.-W.L. All authors have read and agreed to the published version of the manuscript.
Funding
This research was funded by a National Research Foundation of Korea (NRF) grant funded by the Korean Government (MSIT) (No. 2019R1F1A1063522 and No. 2020R1F1A1072484). This study was also supported by the Fund of the Biomedical Research Institute, Jeonbuk National University Hospital.
Institutional Review Board Statement
This study was approved by the Institutional Review Board of Jeonbuk National University Hospital (No. CUH2019-05-057).
Informed Consent Statement
The requirement for patient consent was waived since the present study was not a human subject research project specified in the Bioethics and Safety Act. Moreover, it was practically impossible to obtain the consent of the research subjects and the risk to these subjects was extremely low, since existing data were used in this retrospective study.
Data Availability Statement
The datasets used and/or analyzed during the present study can be obtained from the corresponding author upon reasonable request.
Acknowledgments
We are extremely grateful to Cheol-Hyeon Bae and the 20 final-year dental students at the School of Dentistry, Jeonbuk National University for supporting this study.
Conflicts of Interest
The authors declare no conflict of interest.
References
- Leonardi, R.; Giordano, D.; Maiorana, F.; Spampinato, C. Automatic cephalometric analysis. Angle Orthod. 2008, 78, 145–151. [Google Scholar] [CrossRef] [Green Version]
- Oh, K.; Oh, I.S.; Le, V.N.T.; Lee, D.W. Deep Anatomical Context Feature Learning for Cephalometric Landmark Detection. IEEE J. Biomed. Health Inform. 2021, 25, 806–817. [Google Scholar] [CrossRef] [PubMed]
- Zeng, M.; Yan, Z.; Liu, S.; Zhou, Y.; Qiu, L. Cascaded convolutional networks for automatic cephalometric landmark detection. Med. Image Anal. 2021, 68, 101904. [Google Scholar] [CrossRef] [PubMed]
- Song, Y.; Qiao, X.; Iwamoto, Y.; Chen, Y.-W. Automatic Cephalometric Landmark Detection on X-ray Images Using a Deep-Learning Method. Appl. Sci. 2020, 10, 2547. [Google Scholar] [CrossRef] [Green Version]
- Qian, J.; Luo, W.; Cheng, M.; Tao, Y.; Lin, J.; Lin, H. CephaNN: A Multi-Head Attention Network for Cephalometric Landmark Detection. IEEE Access 2020, 8, 112633–112641. [Google Scholar] [CrossRef]
- Arik, S.; Ibragimov, B.; Xing, L. Fully automated quantitative cephalometry using convolutional neural networks. J. Med. Imaging 2017, 4, 014501. [Google Scholar] [CrossRef] [PubMed]
- Zhang, J.; Liu, M.; Shen, D. Detecting Anatomical Landmarks From Limited Medical Imaging Data Using Two-Stage Task-Oriented Deep Neural Networks. IEEE Trans. Image Process. 2017, 26, 4753–4764. [Google Scholar] [CrossRef]
- Urschler, M.; Ebner, T.; Štern, D. Integrating geometric configuration and appearance information into a unified framework for anatomical landmark localization. Med. Image Anal. 2018, 43, 23–36. [Google Scholar] [CrossRef]
- Lee, J.-H.; Yu, H.-J.; Kim, M.-j.; Kim, J.-W.; Choi, J. Automated cephalometric landmark detection with confidence regions using Bayesian convolutional neural networks. BMC Oral Health 2020, 20, 270. [Google Scholar] [CrossRef] [PubMed]
- Park, J.-H.; Hwang, H.-W.; Moon, J.-H.; Yu, Y.; Kim, H.; Her, S.-B.; Srinivasan, G.; Aljanabi, M.N.A.; Donatelli, R.E.; Lee, S.-J. Automated identification of cephalometric landmarks: Part 1—Comparisons between the latest deep-learning methods YOLOV3 and SSD. Angle Orthod. 2019, 89, 903–909. [Google Scholar] [CrossRef] [PubMed] [Green Version]
- Hwang, H.-W.; Park, J.-H.; Moon, J.-H.; Yu, Y.; Kim, H.; Her, S.-B.; Srinivasan, G.; Aljanabi, M.N.A.; Donatelli, R.E.; Lee, S.-J. Automated Identification of Cephalometric Landmarks: Part 2-Might It Be Better Than human? Angle Orthod. 2019, 90, 69–76. [Google Scholar] [CrossRef] [PubMed] [Green Version]
- Hwang, H.-W.; Moon, J.-H.; Kim, M.-G.; Donatelli, R.E.; Lee, S.-J. Evaluation of automated cephalometric analysis based on the latest deep learning method. Angle Orthod. 2021, 91, 329–335. [Google Scholar] [CrossRef] [PubMed]
- Kunz, F.; Stellzig-Eisenhauer, A.; Zeman, F.; Boldt, J. Artificial intelligence in orthodontics: Evaluation of a fully automated cephalometric analysis using a customized convolutional neural network. J. Orofac. Orthop. 2020, 81, 52–68. [Google Scholar] [CrossRef]
- Nishimoto, S.; Sotsuka, Y.; Kawai, K.; Ishise, H.; Kakibuchi, M. Personal Computer-Based Cephalometric Landmark Detection With Deep Learning, Using Cephalograms on the Internet. J. Craniofacial Surg. 2019, 30, 91–95. [Google Scholar] [CrossRef] [PubMed]
- Payer, C.; Štern, D.; Bischof, H.; Urschler, M. Integrating spatial configuration into heatmap regression based CNNs for landmark localization. Med. Image Anal. 2019, 54, 207–219. [Google Scholar] [CrossRef] [PubMed]
- Dai, X.; Zhao, H.; Liu, T.; Cao, D.; Xie, L. Locating Anatomical Landmarks on 2D Lateral Cephalograms Through Adversarial Encoder-Decoder Networks. IEEE Access 2019, 7, 132738–132747. [Google Scholar] [CrossRef]
- Oktay, O.; Schlemper, J.; Folgoc, L.L.; Lee, M.J.; Heinrich, M.P.; Misawa, K.; Mori, K.; McDonagh, S.G.; Hammerla, N.Y.; Kainz, B.; et al. Attention U-Net: Learning Where to Look for the Pancreas. arXiv 2018, arXiv:1804.03999. [Google Scholar]
- Ronneberger, O.; Fischer, P.; Brox, T. U-Net: Convolutional Networks for Biomedical Image Segmentation. In Proceedings of the International Conference on Medical Image Computing and Computer-Assisted Intervention, Munich, Germany, 5–9 October 2015; pp. 234–241. [Google Scholar]
- Wang, C.W.; Huang, C.T.; Hsieh, M.C.; Li, C.H.; Chang, S.W.; Li, W.C.; Vandaele, R.; Maree, R.; Jodogne, S.; Geurts, P.; et al. Evaluation and Comparison of Anatomical Landmark Detection Methods for Cephalometric X-Ray Images: A Grand Challenge. IEEE Trans. Med. Imaging 2015, 34, 1890–1900. [Google Scholar] [CrossRef] [PubMed]
- Wang, C.W.; Huang, C.T.; Lee, J.H.; Li, C.H.; Chang, S.W.; Siao, M.J.; Lai, T.M.; Ibragimov, B.; Vrtovec, T.; Ronneberger, O.; et al. A benchmark for comparison of dental radiography analysis algorithms. Med. Image Anal. 2016, 31, 63–76. [Google Scholar] [CrossRef] [PubMed]
- Ahlqvist, J.; Eliasson, S.; Welander, U. The effect of projection errors on cephalometric length measurements. Eur. J. Orthod. 1986, 8, 141–148. [Google Scholar] [CrossRef] [PubMed]
- Houston, W.J.; Maher, R.E.; McElroy, D.; Sherriff, M. Sources of error in measurements from cephalometric radiographs. Eur. J. Orthod. 1986, 8, 149–151. [Google Scholar] [CrossRef] [PubMed]
- Moon, J.H.; Hwang, H.W.; Yu, Y.; Kim, M.G.; Donatelli, R.E.; Lee, S.J. How much deep learning is enough for automatic identification to be reliable? Angle Orthod. 2020, 90, 823–830. [Google Scholar] [CrossRef] [PubMed]
- Tong, W.; Nugent, S.T.; Gregson, P.H.; Jensen, G.M.; Fay, D.F. Landmarking of cephalograms using a microcomputer system. Comput. Biomed. Res. Int. J. 1990, 23, 358–379. [Google Scholar] [CrossRef]
- Baumrind, S.; Frantz, R.C. The reliability of head film measurements. 1. Landmark identification. Am. J. Orthod. 1971, 60, 111–127. [Google Scholar] [CrossRef]
- Stabrun, A.E.; Danielsen, K. Precision in cephalometric landmark identification. Eur. J. Orthod. 1982, 4, 185–196. [Google Scholar] [CrossRef] [PubMed]
- Tng, T.T.; Chan, T.C.; Hägg, U.; Cooke, M.S. Validity of cephalometric landmarks. An experimental study on human skulls. Eur. J. Orthod. 1994, 16, 110–120. [Google Scholar] [CrossRef] [PubMed]
- Vincent, A.M.; West, V.C. Cephalometric landmark identification error. Aust. Orthod. J. 1987, 10, 98–104. [Google Scholar]
- Wang, S.; Li, H.; Li, J.; Zhang, Y.; Zou, B. Automatic Analysis of Lateral Cephalograms Based on Multiresolution Decision Tree Regression Voting. J. Healthc. Eng. 2018, 2018, 1797502. [Google Scholar] [CrossRef] [PubMed]
- Gravely, J.F.; Benzies, P.M. The clinical significance of tracing error in cephalometry. Br. J. Orthod. 1974, 1, 95–101. [Google Scholar] [CrossRef] [PubMed]
- Lau, P.Y.; Cooke, M.S.; Hägg, U. Effect of training and experience on cephalometric measurement errors on surgical patients. Int. J. Adult Orthod. Orthognath. Surg. 1997, 12, 204–213. [Google Scholar]
- Kvam, E.; Krogstad, O. Variability in tracings of lateral head plates for diagnostic orthodontic purposes. Amethodologic study. Acta Odontol. Scand. 1969, 27, 359–369. [Google Scholar] [CrossRef] [PubMed]
- Muraev, A.A.; Tsai, P.; Kibardin, I.; Oborotistov, N.; Shirayeva, T.; Ivanov, S.; Ivanov, S.; Guseynov, N.; Aleshina, O.; Bosykh, Y.; et al. Frontal cephalometric landmarking: Humans vs artificial neural networks. Int. J. Comput. Dent. 2020, 23, 139–148. [Google Scholar] [PubMed]


Publisher’s Note: MDPI stays neutral with regard to jurisdictional claims in published maps and institutional affiliations. |
© 2022 by the authors. Licensee MDPI, Basel, Switzerland. This article is an open access article distributed under the terms and conditions of the Creative Commons Attribution (CC BY) license (https://creativecommons.org/licenses/by/4.0/).