Automated Breast Cancer Detection in Digital Mammograms of Various Densities via Deep Learning


Abstract

1. Introduction
2. Methods
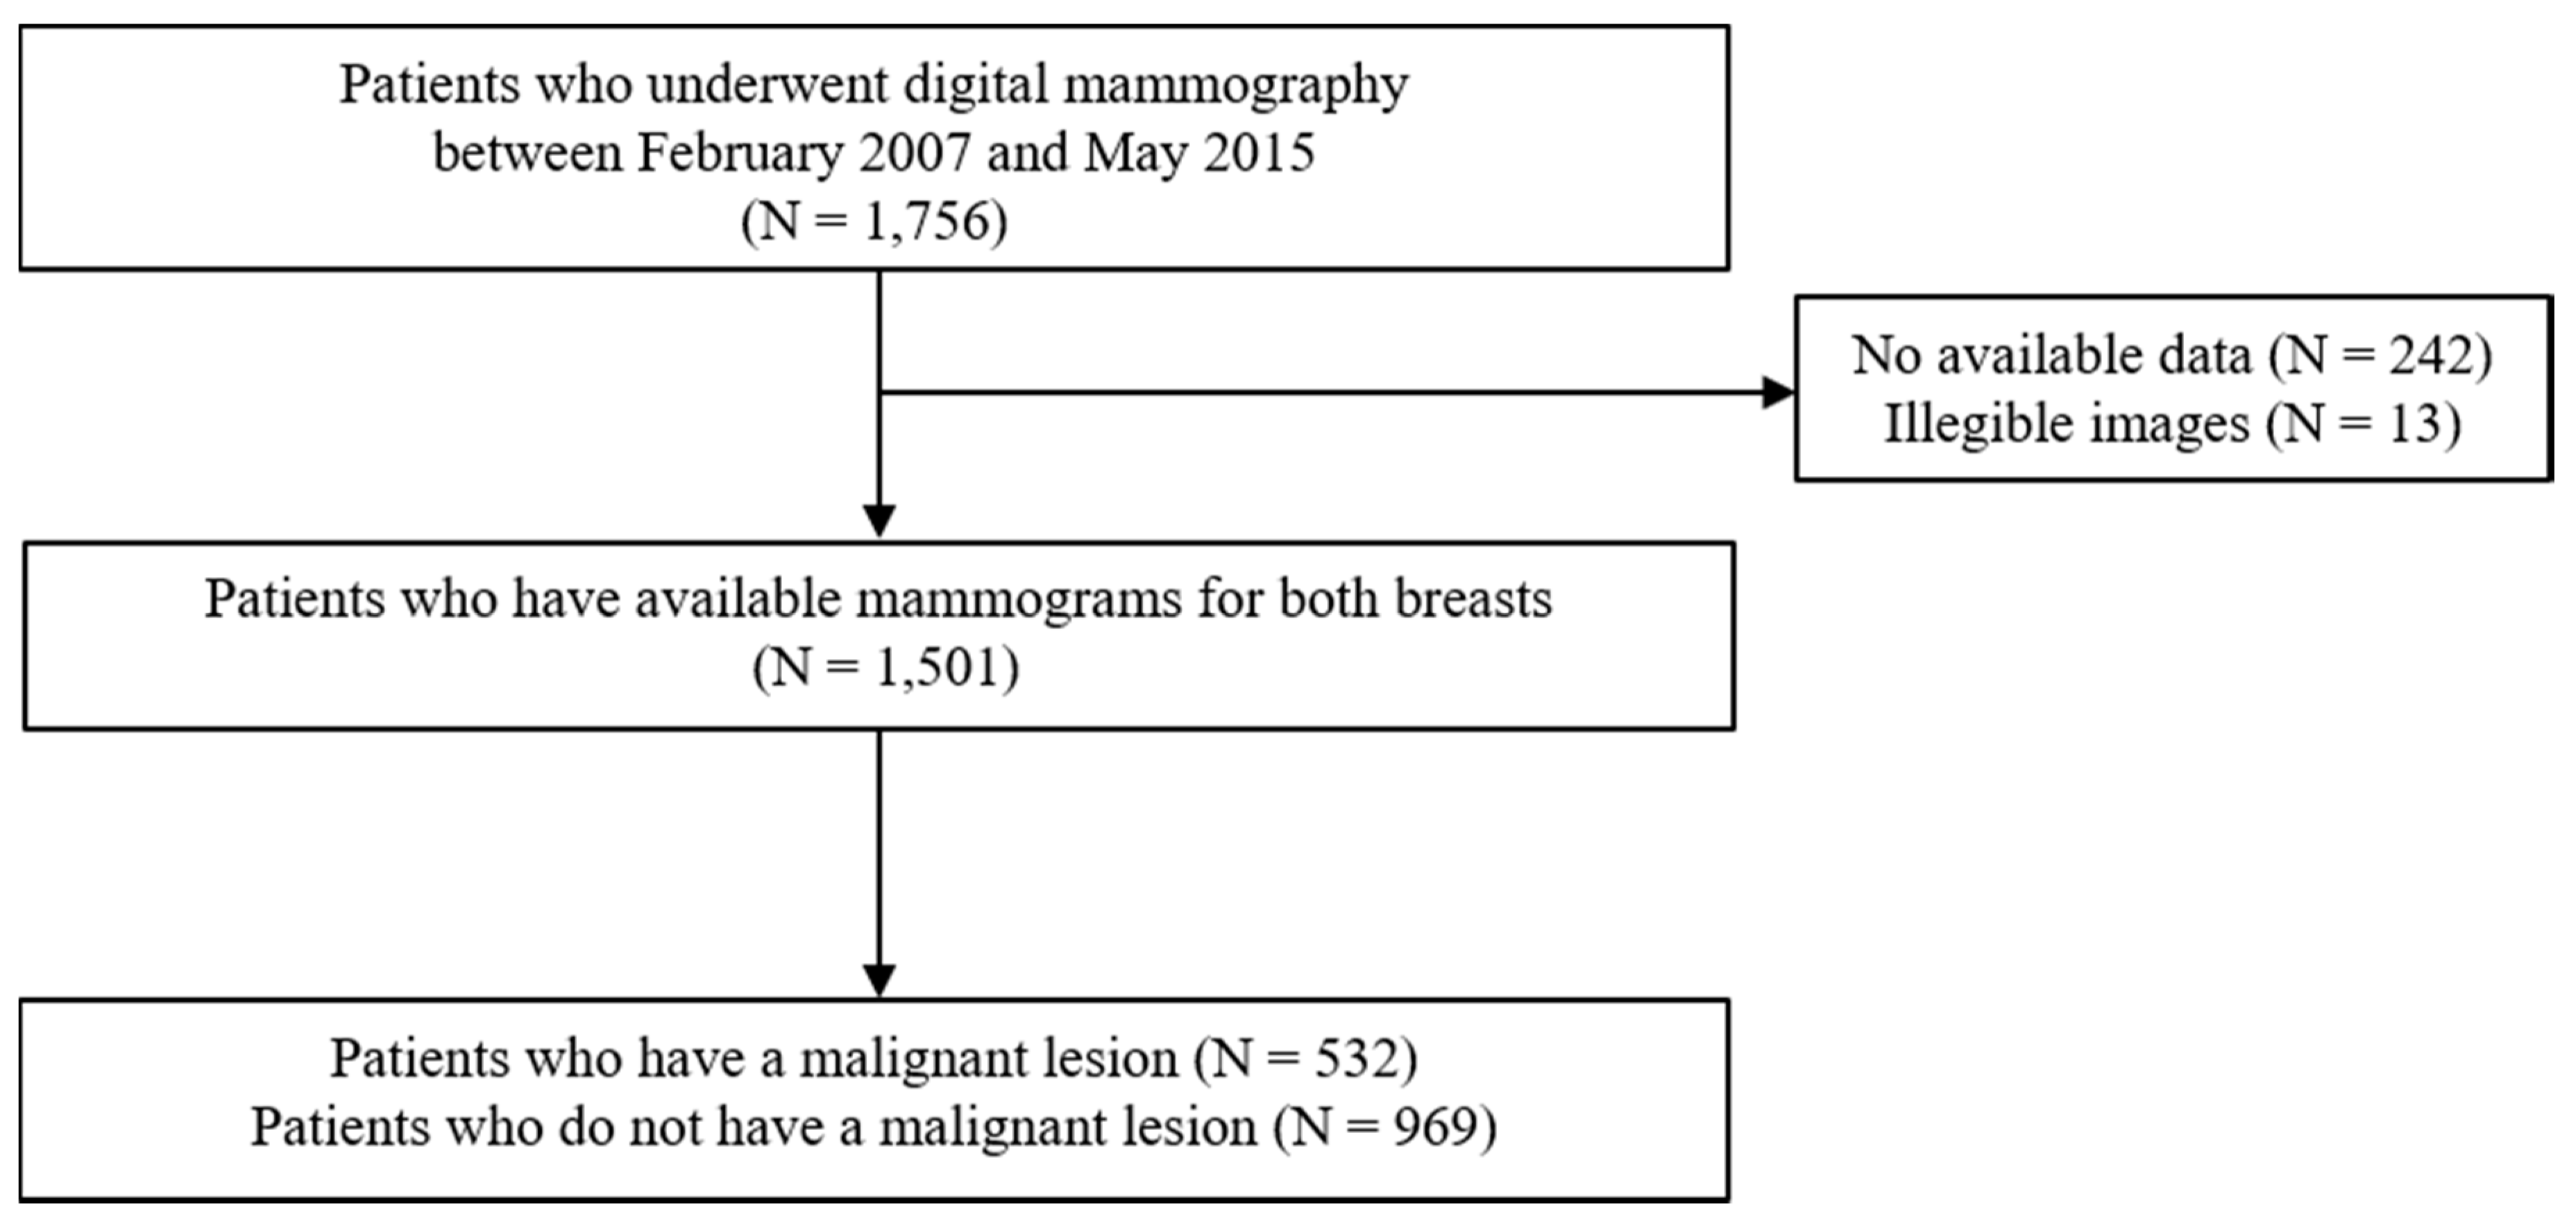
2.1. Study Subjects
2.2. Data Preprocessing
2.3. Dataset Construction
2.4. Training Convolutional Neural Networks (CNNs)
2.5. Gradient-Weighted Class Activation Mapping (Grad-CAM)
2.6. Meta-Analysis
2.7. Statistical Analysis
3. Results
3.1. Clinical Demographics of Subjects
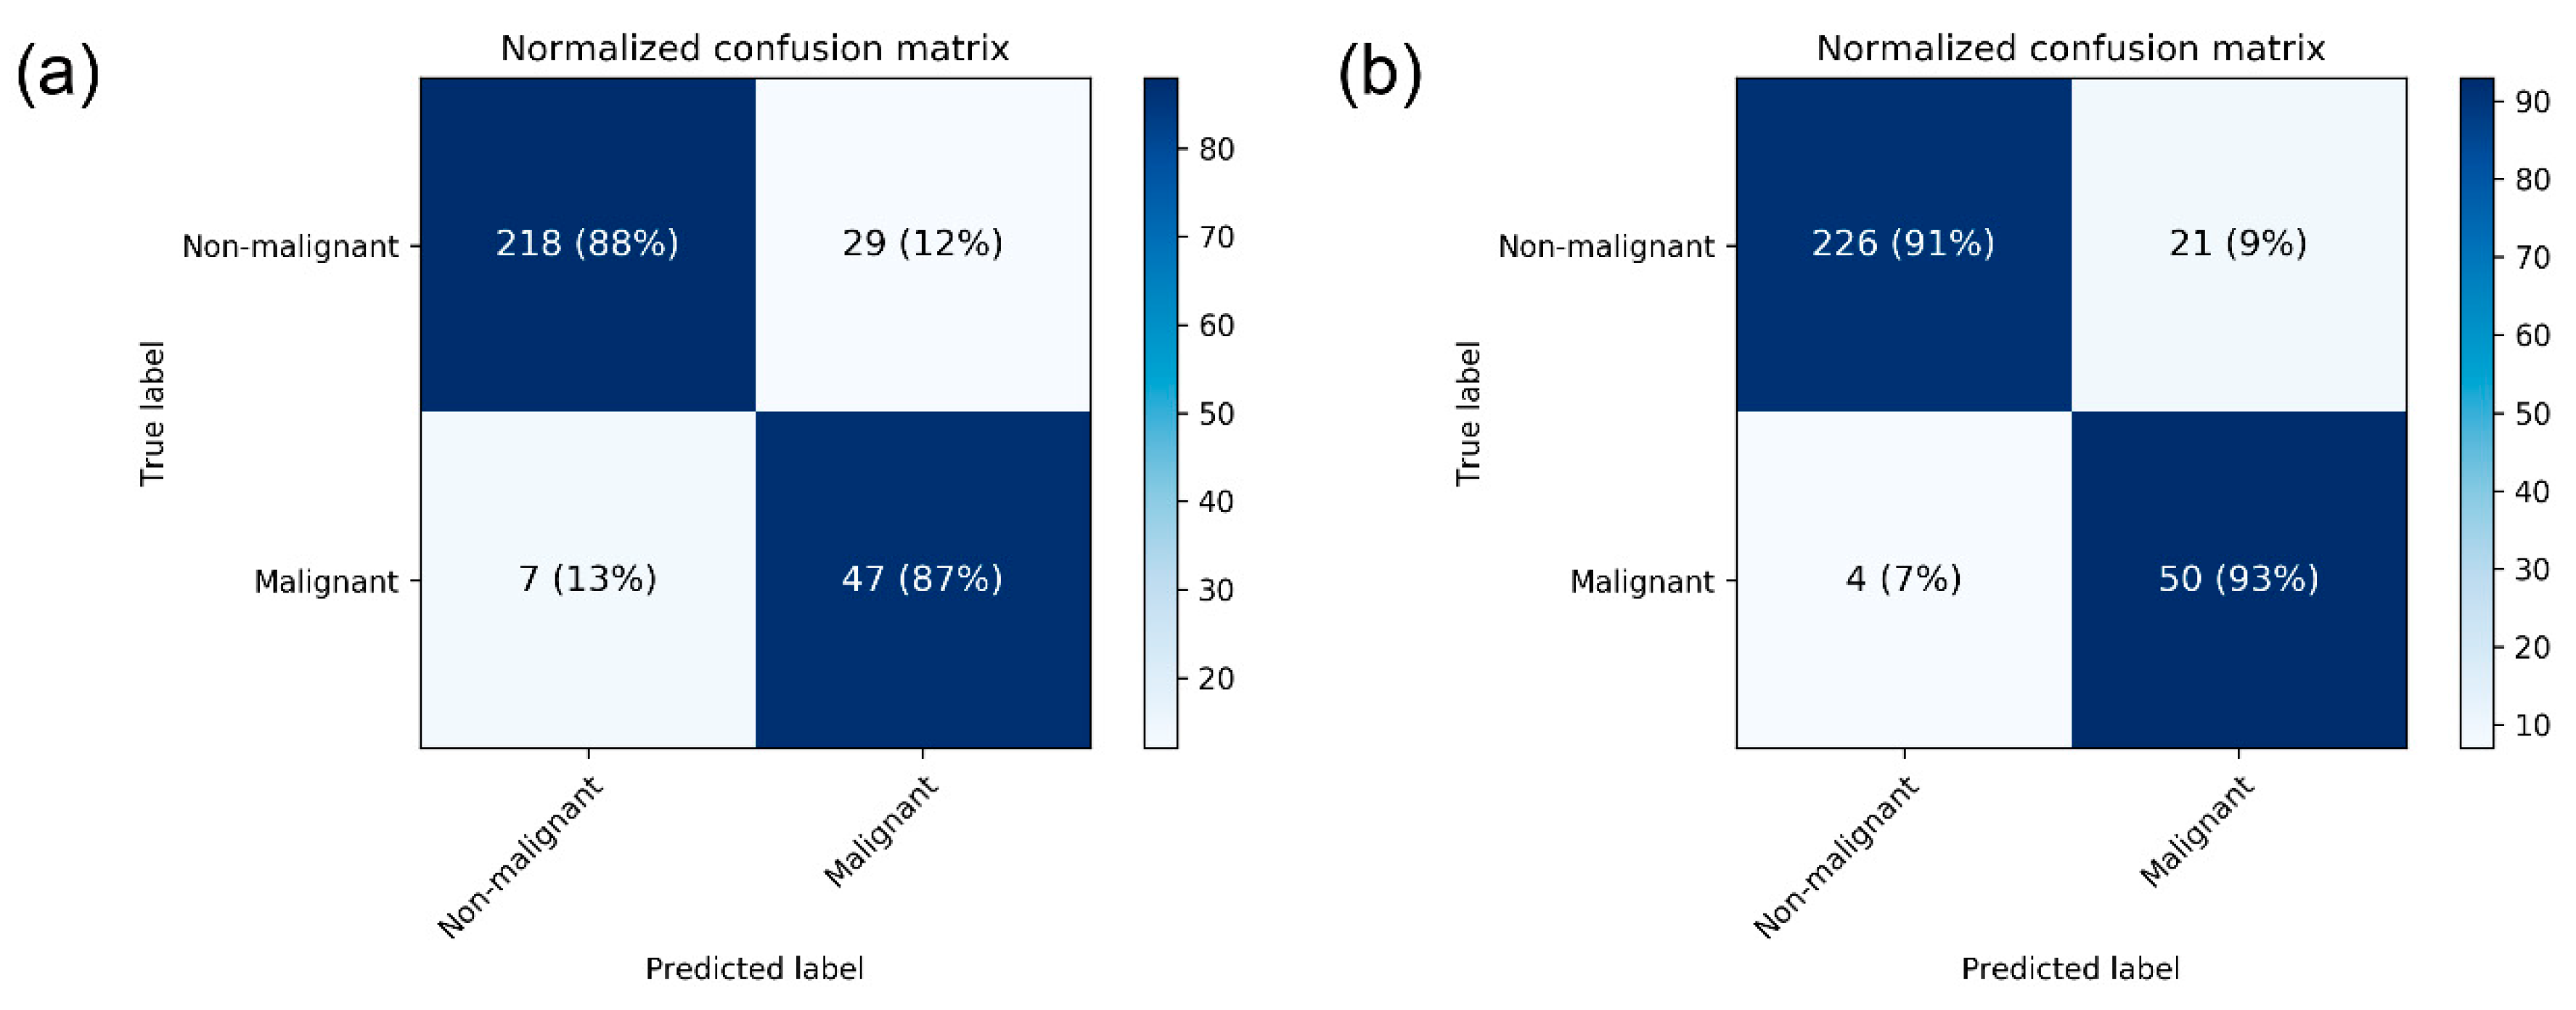
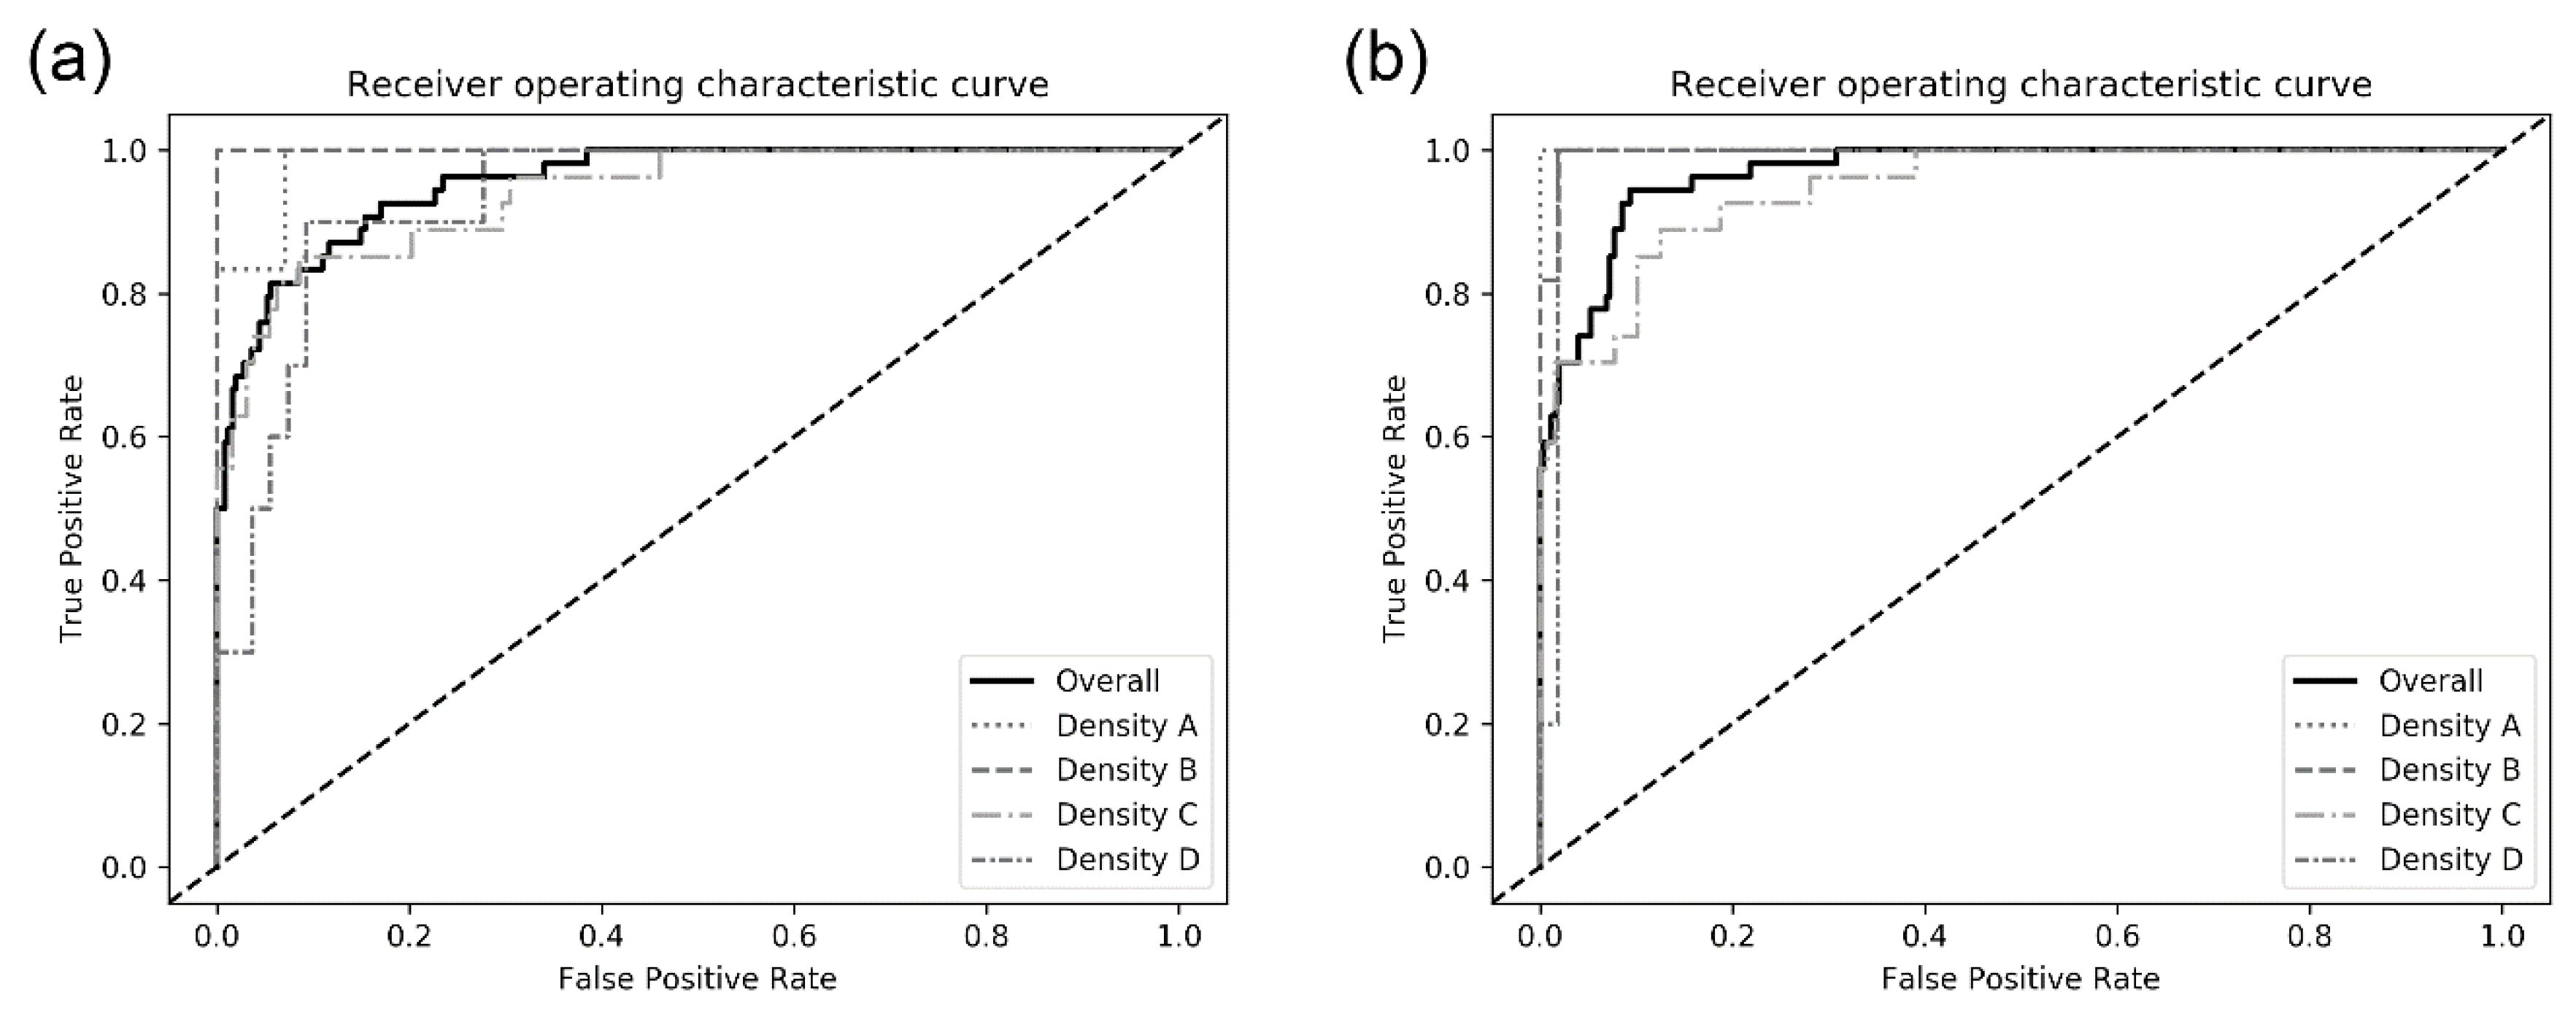
3.2. Performance of CNN Models for Breast Cancer Detection
3.3. Sub-Group Analyses
3.4. Grad-CAM
3.5. Meta-Analysis
4. Discussion
5. Conclusions
Supplementary Materials
Author Contributions
Funding
Conflicts of Interest
References
- Harbeck, N.; Gnant, M. Breast cancer. Lancet 2017, 389, 1134–1150. [Google Scholar] [CrossRef]
- Kelder, A.; Lederman, D.; Zheng, B.; Zigel, Y. A new computer-aided detection approach based on analysis of local and global mammographic feature asymmetry. Med. Phys. 2018, 45, 1459–1470. [Google Scholar] [CrossRef] [PubMed]
- Gardezi, S.J.S.; Elazab, A.; Lei, B.; Wang, T. Breast Cancer Detection and Diagnosis Using Mammographic Data: Systematic Review. J. Med. Internet Res. 2019, 21, e14464. [Google Scholar] [CrossRef] [PubMed]
- Arevalo, J.; Gonzalez, F.A.; Ramos-Pollan, R.; Oliveira, J.L.; Guevara Lopez, M.A. Representation learning for mammography mass lesion classification with convolutional neural networks. Comput. Methods Programs Biomed. 2016, 127, 248–257. [Google Scholar] [CrossRef] [PubMed]
- Hamidinekoo, A.; Denton, E.; Rampun, A.; Honnor, K.; Zwiggelaar, R. Deep learning in mammography and breast histology, an overview and future trends. Med. Image Anal. 2018, 47, 45–67. [Google Scholar] [CrossRef] [PubMed]
- Le, E.P.V.; Wang, Y.; Huang, Y.; Hickman, S.; Gilbert, F.J. Artificial intelligence in breast imaging. Clin. Radiol. 2019, 74, 357–366. [Google Scholar] [CrossRef]
- Ribli, D.; Horvath, A.; Unger, Z.; Pollner, P.; Csabai, I. Detecting and classifying lesions in mammograms with Deep Learning. Sci. Rep. 2018, 8, 4165. [Google Scholar] [CrossRef] [PubMed]
- Saba, L.; Biswas, M.; Kuppili, V.; Cuadrado Godia, E.; Suri, H.S.; Edla, D.R.; Omerzu, T.; Laird, J.R.; Khanna, N.N.; Mavrogeni, S.; et al. The present and future of deep learning in radiology. Eur. J. Radiol. 2019, 114, 14–24. [Google Scholar] [CrossRef]
- Niazi, M.K.K.; Parwani, A.V.; Gurcan, M.N. Digital pathology and artificial intelligence. Lancet Oncol. 2019, 20, e253–e261. [Google Scholar] [CrossRef]
- Cho, B.J.; Bang, C.S.; Park, S.W.; Yang, Y.J.; Seo, S.I.; Lim, H.; Shin, W.G.; Hong, J.T.; Yoo, Y.T.; Hong, S.H.; et al. Automated classification of gastric neoplasms in endoscopic images using a convolutional neural network. Endoscopy 2019. [Google Scholar] [CrossRef]
- Yang, Y.J.; Cho, B.J.; Lee, M.J.; Kim, J.H.; Lim, H.; Bang, C.S.; Jeong, H.M.; Hong, J.T.; Baik, G.H. Automated Classification of Colorectal Neoplasms in White-Light Colonoscopy Images via Deep Learning. J. Clin. Med. 2020, 9, 1593. [Google Scholar] [CrossRef] [PubMed]
- Shen, L.; Margolies, L.R.; Rothstein, J.H.; Fluder, E.; McBride, R.; Sieh, W. Deep Learning to Improve Breast Cancer Detection on Screening Mammography. Sci. Rep. 2019, 9, 12495. [Google Scholar] [CrossRef] [PubMed]
- Rodriguez-Ruiz, A.; Krupinski, E.; Mordang, J.J.; Schilling, K.; Heywang-Kobrunner, S.H.; Sechopoulos, I.; Mann, R.M. Detection of Breast Cancer with Mammography: Effect of an Artificial Intelligence Support System. Radiology 2019, 290, 305–314. [Google Scholar] [CrossRef]
- Ragab, D.A.; Sharkas, M.; Marshall, S.; Ren, J. Breast cancer detection using deep convolutional neural networks and support vector machines. PeerJ 2019, 7, e6201. [Google Scholar] [CrossRef] [PubMed]
- Wang, J.; Yang, X.; Cai, H.; Tan, W.; Jin, C.; Li, L. Discrimination of Breast Cancer with Microcalcifications on Mammography by Deep Learning. Sci. Rep. 2016, 6, 27327. [Google Scholar] [CrossRef]
- Boyd, N.F.; Guo, H.; Martin, L.J.; Sun, L.; Stone, J.; Fishell, E.; Jong, R.A.; Hislop, G.; Chiarelli, A.; Minkin, S.; et al. Mammographic density and the risk and detection of breast cancer. N. Engl. J. Med. 2007, 356, 227–236. [Google Scholar] [CrossRef]
- Al-Masni, M.A.; Al-Antari, M.A.; Park, J.M.; Gi, G.; Kim, T.Y.; Rivera, P.; Valarezo, E.; Choi, M.T.; Han, S.M.; Kim, T.S. Simultaneous detection and classification of breast masses in digital mammograms via a deep learning YOLO-based CAD system. Comput. Methods Programs Biomed. 2018, 157, 85–94. [Google Scholar] [CrossRef]
- Rajaram, N.; Mariapun, S.; Eriksson, M.; Tapia, J.; Kwan, P.Y.; Ho, W.K.; Harun, F.; Rahmat, K.; Czene, K.; Taib, N.A.; et al. Differences in mammographic density between Asian and Caucasian populations: A comparative analysis. Breast Cancer Res. Treat. 2017, 161, 353–362. [Google Scholar] [CrossRef]
- Freer, P.E. Mammographic breast density: Impact on breast cancer risk and implications for screening. Radiographics 2015, 35, 302–315. [Google Scholar] [CrossRef] [PubMed]
- Brentnall, A.R.; Cuzick, J.; Buist, D.S.M.; Bowles, E.J.A. Long-term Accuracy of Breast Cancer Risk Assessment Combining Classic Risk Factors and Breast Density. JAMA Oncol. 2018, 4, e180174. [Google Scholar] [CrossRef]
- Pizer, S.M.; Johnston, R.E.; Ericksen, J.P.; Yankaskas, B.C.; Muller, K.E. Contrast-Limited Adaptive Histogram Equalization: Speed and Effectiveness. Proc. First Conf. Vis. Biomed. Comput. 1990, 337–345. [Google Scholar] [CrossRef]
- Pizer, S.M.; Amburn, E.P.; Austin, J.D.; Robert, C.; Geselowitz, A.; Greer, T.; Romeny, B.T.H.; Zimmerman, J.B.; Zuiderveld, K. Adaptive Histogram Equalization and Its Variations. Comput. Vis. Graph. Image Process. 1987, 39, 355–368. [Google Scholar] [CrossRef]
- Ketcham, D.J.; Lowe, R.; Weber, W. Real-Time Image Enhancement Techniques. Semin. Image Process. 1976, 74, 1–6. [Google Scholar] [CrossRef]
- Huang, G.; Liu, Z.; van der Maaten, L.; Weinberger, K.Q. Densely Connected Convolutional Networks. arXiv 2016, arXiv:1608.06993. [Google Scholar]
- Tan, M.; Le, Q.V. EfficientNet: Rethinking Model Scaling for Convolutional Neural Networks. arXiv 2019, arXiv:1905.11946. [Google Scholar]
- Selvaraju, R.R.; Cogswell, M.; Das, A.; Vedantam, R.; Parikh, D.; Batra, D. Grad-CAM: Visual Explanations from Deep Networks via Gradient-based Localization. arXiv 2016, arXiv:1610.02391. [Google Scholar]
- Zhou, B.; Khosla, A.; Lapedriza, A.; Oliva, A.; Torralba, A. Learning Deep Features for Discriminative Localization. arXiv 2015, arXiv:1512.04150. [Google Scholar]
- Gastounioti, A.; Oustimov, A.; Hsieh, M.K.; Pantalone, L.; Conant, E.F.; Kontos, D. Using Convolutional Neural Networks for Enhanced Capture of Breast Parenchymal Complexity Patterns Associated with Breast Cancer Risk. Acad. Radiol. 2018, 25, 977–984. [Google Scholar] [CrossRef]
- Kim, E.K.; Kim, H.E.; Han, K.; Kang, B.J.; Sohn, Y.M.; Woo, O.H.; Lee, C.W. Applying Data-driven Imaging Biomarker in Mammography for Breast Cancer Screening: Preliminary Study. Sci. Rep. 2018, 8, 2762. [Google Scholar] [CrossRef]
- Becker, A.S.; Marcon, M.; Ghafoor, S.; Wurnig, M.C.; Frauenfelder, T.; Boss, A. Deep Learning in Mammography: Diagnostic Accuracy of a Multipurpose Image Analysis Software in the Detection of Breast Cancer. Investig. Radiol. 2017, 52, 434–440. [Google Scholar] [CrossRef]
- Teare, P.; Fishman, M.; Benzaquen, O.; Toledano, E.; Elnekave, E. Malignancy Detection on Mammography Using Dual Deep Convolutional Neural Networks and Genetically Discovered False Color Input Enhancement. J. Digit. Imaging 2017, 30, 499–505. [Google Scholar] [CrossRef]
- Akselrod-Ballin, A.; Chorev, M.; Shoshan, Y.; Spiro, A.; Hazan, A.; Melamed, R.; Barkan, E.; Herzel, E.; Naor, S.; Karavani, E.; et al. Predicting Breast Cancer by Applying Deep Learning to Linked Health Records and Mammograms. Radiology 2019, 292, 331–342. [Google Scholar] [CrossRef]
- Cai, H.; Huang, Q.; Rong, W.; Song, Y.; Li, J.; Wang, J.; Chen, J.; Li, L. Breast Microcalcification Diagnosis Using Deep Convolutional Neural Network from Digital Mammograms. Comput. Math. Methods Med. 2019, 2019, 2717454. [Google Scholar] [CrossRef]
- Casti, P.; Mencattini, A.; Salmeri, M.; Ancona, A.; Lorusso, M.; Pepe, M.L.; Natale, C.D.; Martinelli, E. Towards localization of malignant sites of asymmetry across bilateral mammograms. Comput. Methods Programs Biomed. 2017, 140, 11–18. [Google Scholar] [CrossRef]
- Sun, W.; Tseng, T.B.; Zhang, J.; Qian, W. Enhancing deep convolutional neural network scheme for breast cancer diagnosis with unlabeled data. Comput. Med. Imaging Graph. 2017, 57, 4–9. [Google Scholar] [CrossRef] [PubMed]
- Yassin, N.I.R.; Omran, S.; El Houby, E.M.F.; Allam, H. Machine learning techniques for breast cancer computer aided diagnosis using different image modalities: A systematic review. Comput. Methods Programs Biomed. 2018, 156, 25–45. [Google Scholar] [CrossRef] [PubMed]
- Lee, R.S.; Gimenez, F.; Hoogi, A.; Miyake, K.K.; Gorovoy, M.; Rubin, D.L. A curated mammography data set for use in computer-aided detection and diagnosis research. Sci. Data 2017, 4, 170177. [Google Scholar] [CrossRef]
- Kooi, T.; Litjens, G.; van Ginneken, B.; Gubern-Merida, A.; Sanchez, C.I.; Mann, R.; den Heeten, A.; Karssemeijer, N. Large scale deep learning for computer aided detection of mammographic lesions. Med. Image Anal. 2017, 35, 303–312. [Google Scholar] [CrossRef]
- Yala, A.; Lehman, C.; Schuster, T.; Portnoi, T.; Barzilay, R. A Deep Learning Mammography-based Model for Improved Breast Cancer Risk Prediction. Radiology 2019, 182716. [Google Scholar] [CrossRef] [PubMed]
- Garcia-Manso, A.; Garcia-Orellana, C.J.; Gonzalez-Velasco, H.M.; Gallardo-Caballero, R.; Macias-Macias, M. Study of the effect of breast tissue density on detection of masses in mammograms. Comput. Math. Methods Med. 2013, 2013, 213794. [Google Scholar] [CrossRef]
- Balleyguier, C.; Ayadi, S.; Van Nguyen, K.; Vanel, D.; Dromain, C.; Sigal, R. BIRADS classification in mammography. Eur. J. Radiol. 2007, 61, 192–194. [Google Scholar] [CrossRef]
- Bandeira Diniz, J.O.; Bandeira Diniz, P.H.; Azevedo Valente, T.L.; Correa Silva, A.; de Paiva, A.C.; Gattass, M. Detection of mass regions in mammograms by bilateral analysis adapted to breast density using similarity indexes and convolutional neural networks. Comput. Methods Programs Biomed. 2018, 156, 191–207. [Google Scholar] [CrossRef]


| Whole Dataset | Training Set | Test Set | |||||
|---|---|---|---|---|---|---|---|
| Breast n | Patient n | Breast n | Patient n | Breast n | Patient n | ||
| Overall | 3002 | 1501 | 2701 | 1484 | 301 | 284 | |
| Non-malignant | 2465 | 1496 | 2218 | 1427 | 247 | 235 | |
| Malignant | 537 | 532 | 483 | 478 | 54 | 54 | |
| Breast density | A | 152 | 76 | 132 | 74 | 20 | 18 |
| B | 594 | 297 | 532 | 292 | 62 | 57 | |
| C | 1560 | 780 | 1405 | 774 | 155 | 149 | |
| D | 696 | 348 | 632 | 344 | 64 | 60 | |
| Breast Density/Model | Accuracy (%) | Sensitivity (%) | Specificity (%) | PPV (%) | NPV (%) | AUC |
|---|---|---|---|---|---|---|
| Overall | ||||||
| DenseNet-169 | 88.1 ± 0.2 | 87.0 ± 0.0 | 88.4 ± 0.2 | 62.1 ± 0.5 | 96.9 ± 0.0 | 0.952 ± 0.005 |
| EfficientNet-B5 | 87.9 ± 4.7 | 88.3 ± 4.7 | 87.9 ± 4.7 | 62.1 ± 9.9 | 97.2 ± 1.3 | 0.954 ± 0.020 |
| Density A | ||||||
| DenseNet-169 | 95.0 ± 0.0 | 100 ± 0.0 | 92.9 ± 0.0 | 85.7 ± 0.0 | 100.0 ± 0.0 | 0.984 ± 0.007 |
| EfficientNet-B5 | 96.7 ± 2.9 | 100.0 ± 0.0 | 95.3 ± 4.1 | 90.5 ± 8.3 | 100.0 ± 0.0 | 0.988 ± 0.012 |
| Density B | ||||||
| DenseNet-169 | 96.2 ± 4.1 | 97.0 ± 5.3 | 96.1 ± 3.9 | 85.3 ± 14.3 | 99.3 ± 1.2 | 0.962 ± 0.041 |
| EfficientNet-B5 | 95.2 ± 4.3 | 97.0 ± 5.3 | 94.8 ± 4.1 | 81.0 ± 12.9 | 99.3 ± 1.2 | 0.990 ± 0.009 |
| Density C | ||||||
| DenseNet-169 | 86.4 ± 6.2 | 87.7 ± 4.3 | 86.2 ± 6.7 | 58.8 ± 13.5 | 97.0 ± 1.1 | 0.950 ± 0.014 |
| EfficientNet-B5 | 81.9 ± 5.1 | 84.0 ± 5.7 | 81.5 ± 5.2 | 49.6 ± 9.1 | 96.0 ± 1.6 | 0.940 ± 0.016 |
| Density D | ||||||
| DenseNet-169 | 84.3 ± 5.4 | 83.3 ± 5.8 | 84.6 ± 5.3 | 51.0 ± 11.5 | 96.5 ± 1.3 | 0.902 ± 0.033 |
| EfficientNet-B5 | 85.9 ± 10.9 | 86.7 ± 11.5 | 85.8 ± 10.8 | 58.4 ± 28.2 | 97.1 ± 2.5 | 0.925 ± 0.055 |
| (a) Sensitivity | |||
|---|---|---|---|
| Sensitivity (95% CI) | |||
 | Regab (2019) | 0.86 | (0.79–0.91) |
| Rodriguez–Ruiz (2019) | 0.86 | (0.78–0.92) | |
| Gastounioti (2018) | 0.81 | (0.72–0.88) | |
| Kim (2018) | 0.76 | (0.72–0.79) | |
| Becker (2017) | 0.71 | (0.63–0.79) | |
| Teare (2017) | 0.91 | (0.86–0.95) | |
| Akselrob-Ballin (2019) | 0.80 | (0.79–0.81) | |
| Cai (2019) | 0.89 | (0.86–0.92) | |
| Al-Masni (2018) | 0.99 | (0.96–1.00) | |
| Casti (2017) | 0.84 | (0.64–0.95) | |
| Sun (2017) | 0.81 | (0.79–0.83) | |
| Wang (2016) | 0.89 | (0.81–0.94) | |
| Pooled sensitivity = 0.81 (0.80–0.82) | |||
| I2 = 0.927 | |||
| (b) Specificity | |||
| Specificity (95% CI) | |||
 | Regab (2019) | 0.88 | (0.82–0.92) |
| Rodriguez–Ruiz (2019) | 0.79 | (0.72–0.86) | |
| Gastounioti (2018) | 0.98 | (0.96–0.99) | |
| Kim (2018) | 0.90 | (0.88–0.92) | |
| Becker (2017) | 0.70 | (0.62–0.77) | |
| Teare (2017) | 0.80 | (0.76–0.84) | |
| Akselrob-Ballin (2019) | 0.82 | (0.80–0.83) | |
| Cai (2019) | 0.87 | (0.83–0.90) | |
| Al-Masni (2018) | 1.00 | (0.98–1.00) | |
| Casti (2017) | 0.77 | (0.55–0.92) | |
| Sun (2017) | 0.72 | (0.70–0.74) | |
| Wang (2016) | 0.90 | (0.82–0.95) | |
| Pooled specificity = 0.82 (0.81–0.82) | |||
| I2 = 0.967 | |||
Publisher’s Note: MDPI stays neutral with regard to jurisdictional claims in published maps and institutional affiliations. |
© 2020 by the authors. Licensee MDPI, Basel, Switzerland. This article is an open access article distributed under the terms and conditions of the Creative Commons Attribution (CC BY) license (http://creativecommons.org/licenses/by/4.0/).
Share and Cite
Suh, Y.J.; Jung, J.; Cho, B.-J. Automated Breast Cancer Detection in Digital Mammograms of Various Densities via Deep Learning. J. Pers. Med. 2020, 10, 211. https://doi.org/10.3390/jpm10040211
Suh YJ, Jung J, Cho B-J. Automated Breast Cancer Detection in Digital Mammograms of Various Densities via Deep Learning. Journal of Personalized Medicine. 2020; 10(4):211. https://doi.org/10.3390/jpm10040211
Chicago/Turabian StyleSuh, Yong Joon, Jaewon Jung, and Bum-Joo Cho. 2020. "Automated Breast Cancer Detection in Digital Mammograms of Various Densities via Deep Learning" Journal of Personalized Medicine 10, no. 4: 211. https://doi.org/10.3390/jpm10040211
APA StyleSuh, Y. J., Jung, J., & Cho, B.-J. (2020). Automated Breast Cancer Detection in Digital Mammograms of Various Densities via Deep Learning. Journal of Personalized Medicine, 10(4), 211. https://doi.org/10.3390/jpm10040211