Abstract
Background/Objectives: This study aimed to analyze critical limit and critical value test lists from major US medical centers, identify changes in quantitative critical limit thresholds since 1990, document notification priorities for qualitative and new listings, and visualize information alongside clinical thresholds and pathophysiological trends. Methods: A systematic search was conducted, acquiring 50 lists of critical limits and critical values from university hospitals, Level 1 trauma centers, centers of excellence, and high-performing hospitals across the US. Lists were obtained through direct contact or web-accessible postings. Statistical analysis used the Kruskal–Wallis non-parametric test and Student’s t-test to determine significant differences between 1990 and 2024 critical limits. Results: Statistically significant differences were identified in various clinical tests between 1990 and 2024, comprising glucose, calcium, magnesium, CO2 content, blood gas parameters, hematology, and coagulation tests. Ranges for critical limits narrowed for several tests, and new measurands were added. Cardiac biomarkers were infrequently listed. Point-of-care testing (POCT) listings were sparse and showed significant differences from main lab values in the high median critical limit for glucose Conclusions: Visualizing this information has potential benefits, including ease of interpretation, which can improve patient care, reduce inconsistencies, and enhance the efficiency and quality of healthcare delivery.
1. Introduction
The urgent communication of abnormal test results is a critical aspect of clinical care, ensuring timely and potentially life-saving interventions. This practice, which began decades ago with the use of lists of critical limits and critical values to trigger clinical warnings, has evolved significantly over the years. The first national surveys published in Journal of the American Medical Association (JAMA), Pediatrics, Archives of Pathology and Laboratory Medicine, and Medical Laboratory Observer (MLO) between 1990 and 1993 codified this important practice in the United States [1,2,3,4]. Recent summaries of critical limits and critical values for adults have been annually compiled in the MLO Clinical Laboratory Reference (CLR) from 1992 through 2025 [5].
Our goals are to report the findings of a comprehensive search for critical limit and critical value test lists used by major US medical centers, identify changes in quantitative critical limit thresholds since 1990, and document notification priorities for qualitative and new listings. Institutions adjust quantitative critical limits and select qualitative critical values to identify extremely abnormal findings that trigger life-saving treatment. Caregivers then use critical notifications to facilitate rapid response and therapeutic decisions at the bedside, in emergency rooms, and when performing POCT. Accreditation agencies, such as the US Joint Commission, require hospitals to create and maintain policies for the urgent notification of critical test results.
By examining the evolution of critical limits and values between 1990 and 2024 and by visualizing critical decision thresholds and professional recommendations, we aim to enhance accessibility and clarity of diagnostic criteria for critical conditions and better illustrate observed changes. Visualization of critical limits may also benefit expeditious decision-making and increasing quality of patient care [6,7,8].
2. Materials and Methods
2.1. Definitions
A critical limit is defined as a low or high quantitative threshold of a life-threatening diagnostic test result. A critical value is defined as a qualitative result (such as a positive COVID-19 rapid antigen test) warranting urgent notification. Both demand rapid response, and potentially life-saving treatment, isolation of the patient, or other timely medical interventions [9,10].
2.2. Acquiring Lists
Lists of critical limits and critical values were acquired from university hospitals, Level 1 trauma centers, centers of excellence, and high-performing hospitals. Centers of excellence have specialized programs within healthcare institutions known for their high levels of expertise and resources, focusing on specific medical areas and providing comprehensive care [11,12]. High performing hospitals were defined as those ranked in the top ten percent nationally in at least three metrics according to the US News & World Report’s Best Hospitals ranking. These rankings are based on metrics including factors such as positive organizational culture, adaptable and attentive senior management, effective performance monitoring, competent workforce, exceptional leadership, expertise-driven practice, and interdisciplinary network [12]. Medical centers were selected across four US Census Bureau regions: Northeast, Midwest, South, and West. These regions were further divided into nine census divisions (New England, Middle Atlantic, East North Central, West North Central, South Atlantic, East South Central, West South Central, Mountain, and Pacific). Notification lists and policies were obtained through direct contact and web-accessible postings [13]. Initial contact with potential hospitals was made via email with the IRB approval number, followed by phone calls using a standardized interview guide.
PubMed articles and internet postings were identified using browser keywords such as “critical limits”, “critical values”, “critical-risk results”, “significant-risk results”, “alert values”, “hypercritical results”, and “panic values”. Multiple search hits zeroed in on the same hospital documents, providing assurance that none were missed. Results from institutions that fell within the inclusion criteria outlined previously were included in the final compilation of critical notifications lists examined.
2.3. POCT Specific Methods
We analyzed the n = 50 dataset of critical notifications lists and identified the listings specific to POCT. 13 hospitals’ POCT listings were either located in dedicated sections within these lists or embedded throughout. A list serve posted to the Association of Diagnostic and Laboratory Medicine yielded listings from 4 additional hospitals, bringing the total to 17.
2.4. Databases
Raw data from the 1990–1993 US National Surveys archived by Knowledge Optimization were used for comparison with our findings. Changes in raw data from 1990 to 1993 were compared with web-listed and directly collected raw data in 2024.
2.5. Changes over Time
Changes in quantitative critical limits were determined by comparing the means and medians of quantitative critical limits in 1990–1993 national surveys to the lists found on the internet or shared directly. In addition to clinical chemistry, hematology, and other laboratory disciplines, notifications studied in detail included cardiac biomarkers—for their importance in emergency and crisis care- and highly infectious diseases to update actionable tests used during the pandemic.
2.6. Statistical Analysis
The Shapiro–Wilk Test was used to determine the normality of the data, which was confirmed by inspecting histograms. Most quantitative critical limits did not have a normal distribution. Therefore, we primarily used the Kruskal–Wallis non-parametric test to determine if differences over three decades were statistically significant. Differences were considered significant if p < 0.05 (denoted by *), or if p < 0.01, highly significant 01 (denoted by **). Cell entries in the tables are boldface when significantly different. Please note that the Kruskal–Wallis test does not directly compare medians, but instead the raw distributions of data and therefore can generate a significant p-value even if two medians are equal. In the case where both 1990 and 2024 data were normally distributed, significant differences were determined using Student’s t-test for means with unequal variances.
The order of the measurands in the tables was determined from frequencies of the 2024 listings. Listing frequencies were determined by dividing by 50 (2024 listings), 92 (1990 adult national survey [1]), or 100 (1993 national survey of ionized calcium critical limits [3]).
2.7. Decision Thresholds and Professional Recommendations
Decision thresholds and professional recommendations were identified by reviewing recent guidelines by organizations such as the American Diabetes Association (ADA) and peer-reviewed articles. Recommendations made by government agencies including the Centers for Disease Control and Prevention (CDC), National Institute of Health (NIH), World Health Organization (WHO), and Infectious Disease Society of America (IDSA) for qualitative critical values were also considered.
2.8. Ethics
The UC Davis IRB deemed this research exempt (ID 2078118-1). Reporting of notification lists and research results is anonymous.
3. Results
The median number of tests on each critical notifications lists was 72. Significant differences (p < 0.05) were observed in chemistry (glucose, calcium, magnesium, and CO2 content), blood gas (arterial pCO2 and arterial pO2), hematology and coagulation (platelets, partial thromboplastin time, white blood cell count, and prothrombin time), newborns (glucose, potassium, hematocrit, and arterial pO2), and point-of-care (glucose). Chemistry, blood gas, and hematology and coagulation listings were expanded from 1990.
3.1. Chemistry Tests
Table 1 summarizes statistically significant differences in chemistry tests between 1990 and 2024. Significant changes were observed in glucose (low median critical limit, p < 0.01), calcium (low and high median critical limit, p < 0.01), magnesium (high critical limit, p < 0.01), and CO2 content (high critical limit, p < 0.01). Chemistry tests also expanded to include ammonia.

Table 1.
Clinical chemistry critical limits.
Figure 1 and Figure 2 summarize significant changes in glucose. The low median critical limit for adult glucose (50 mg/dL) remains below the 54 mg/dL threshold for neuroglycopenic symptoms as recommended by the American Diabetes Association (ADA) [14] and is still below the threshold for hypoglycemia [14]. A total of 6 hospitals of the n = 54 dataset reported low critical limits of 54 mg/dL. Six additional hospitals listed low critical limits of 55 mg/dL or higher. The high critical limit for glucose (500 mg/dL) is above the 110 mg/dL threshold for fasting plasma glucose measurement consistent with diabetes [15] and lower than the 600 mg/dL threshold associated with hyperosmolar coma [16]. The ranges for both low and high critical limits for adults narrowed.
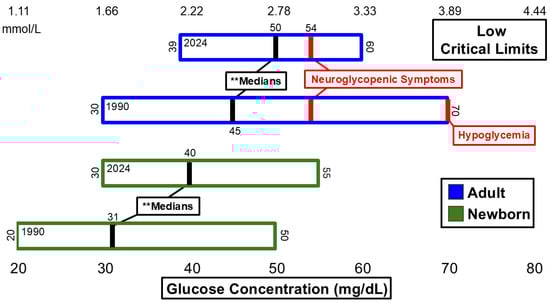
Figure 1.
Glucose low critical limits. ** Significant difference in medians at p <0.01.
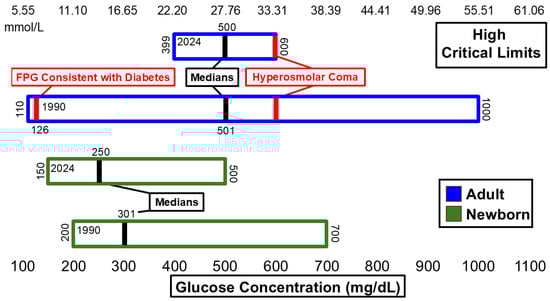
Figure 2.
Glucose high critical limits.
3.2. Blood Gas Tests
Statistically significant differences in blood gas tests are summarized in Table 2. Significant differences (p < 0.05) observed in blood gas tests included the low median critical limits for arterial pCO2 and arterial pO2. It should be noted that significant differences were identified in the raw data that caused dissimilar histograms. Compared to 1990’s national surveys, blood gas measurands expanded to include carboxyhemoglobin, methemoglobin, venous pCO2, and venous pH.
Table 2.
pH and blood gas critical limits.
Figure 3 and Figure 4 illustrate changes in arterial pH, arterial pCO2, and arterial pO2 critical values. Between 1990 and 2024, the ranges for both low and high critical limits for arterial pH narrowed. However, neither the low nor high critical limit for arterial pH showed significant differences during this time frame. The median critical limits for low and high arterial pH remained consistent across 1990 and 2024. The low median critical limit was higher than the 7.0 pH threshold associated with mortality [17] and lower than the 7.35 pH threshold associated with acidemia [18]. The high median critical limit was higher than the 7.45 pH threshold associated with alkalemia [18]. The low and high median critical limits for arterial pCO2 and low median critical limit for arterial pO2 did not change between 1990 and 2024. However, the distribution of raw data for these critical limits did change significantly within this timeframe. The low critical limit for arterial pCO2 (20 mmHg) was lower than the 35mmHg threshold associated with hypocapnia [19]. The high median critical limit for arterial pCO2 (70 mmHg) was higher than the 45 mmHg threshold for hypercapnia [20]. The low median critical limit for arterial pO2 (40 mmHg) was higher than the 30 mmHg measurement associated with loss of consciousness [20] and lower than the 60 mmHg threshold associated with hypoxemia [20].
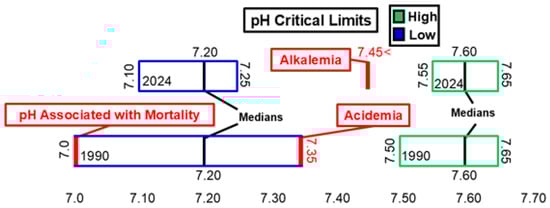
Figure 3.
pH low and high critical limits.
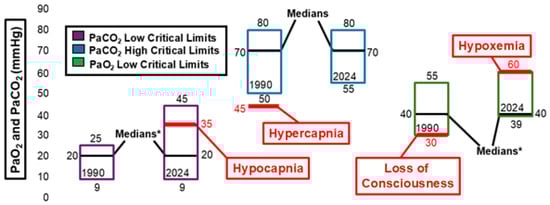
Figure 4.
Arterial pCO2 (PaCO2) and arterial pO2 (PaO2) critical limits. * Significant difference in medians at p< 0.05.
3.3. Hematology and Coagulation Tests
Table 3 summarizes statistically significant differences identified in hematology and coagulation. Significant changes were seen in the following measurands: platelets (low median critical limit, p < 0.01), partial thromboplastin time (PTT) (high median critical limit, p < 0.01), white blood cell (WBC) count (low and high median critical limits, p < 0.01), and prothrombin time (high mean critical limit, p < 0.01). Hematology and coagulation listings also expanded to include absolute neutrophil count (ANC), band count, blast cells, international normalized ratio (INR), and WBC count in cerebrospinal fluid (CSF).
Table 3.
Hematology and coagulation critical limits.
Figure 5 illustrates hemoglobin critical limits. Neither the low median critical limit nor the high median critical limit changed significantly between 1990 and 2024. The low median critical limit changed from 7 g/dL to 6 g/dL, and the range narrowed from 4 g/dL–15 g/dL in 1990 to 5 g/dL–7 g/dL in 2024. This is a shift away from the following clinical thresholds: 9 g/dL associated with a need for transfusion [21], 12 g/dL associated with anemia in women [21,22], and 13 g/dL associated with anemia in men [21,22]. The high critical limit range narrowed from 17 g/dL–30 g/dL to 19 g/dL–22.5 g/dL. However, the medians remained 20 g/dL. This is higher than the 16 g/dL and 16.5 g/dL [23,24,25] thresholds associated with the diagnosis of polycythemia vera in women and men, respectively.
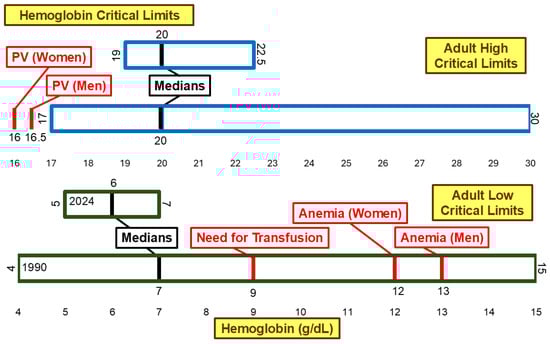
Figure 5.
Hemoglobin low and high critical limits. PV, Polycythemia Vera.
Figure 6 illustrates the critical limits for platelet count. The low median critical limit changed significantly (p < 0.01) from 30 × 109/L to 20 × 109/L between 1990 and 2024. This shifted the low median critical limit further away from the 50 × 109/L [26] and 100 × 109/L [26] thresholds associated with severe thrombocytopenia and thrombocytopenia, respectively. While the range for high critical limit narrowed from 100 × 109/L–1000 × 109/L to 600 × 109/L–1000 × 109/L, the median high critical limit remained 1000 × 109/L. This is higher than the 450 × 109/L [27] threshold associated with thrombocytosis.
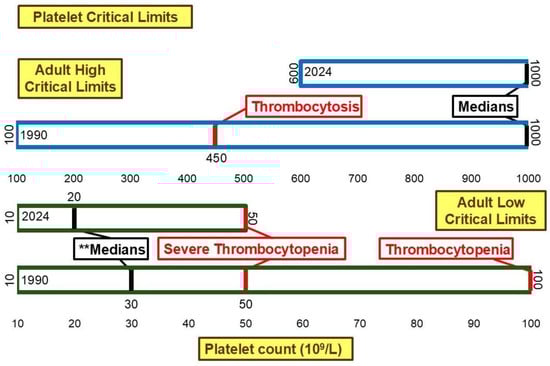
Figure 6.
Platelet low and high critical limits. ** Significant difference in medians at p <0.01.
3.4. Newborn Critical Limits
Table 4 summarizes statistically significant differences identified in newborn tests including: glucose (low median critical limit, p < 0.01), potassium (low and high median critical limits, p < 0.01), hematocrit (low median and high mean critical limits, p < 0.05), and arterial pO2 (low median critical limit, p < 0.05).
Table 4.
Newborn critical limits.
3.5. Cardiac Biomarkers
Table 5 summarizes listings of cardiac biomarkers. 34 hospitals listed cardiac biomarkers: Troponin I (TnI) (12), high-sensitivity Troponin I (hs-TnI) (10), Creatine Kinase (CK) (6), Troponin (6), Creatine Kinase MB (3), Troponin T (3), high-sensitivity Troponin (2), Brain Natriuretic Peptide (1), and high-sensitivity Troponin T (1). Among the cardiac biomarkers, TnI and hs-TnI were listed most frequently, while 16 hospitals listed no cardiac biomarkers at all. CK was listed by six hospitals, with four using it to diagnose rhabdomyolysis. Figure 7 illustrates listings of cardiac biomarkers.
Table 5.
Cardiac biomarker listings.
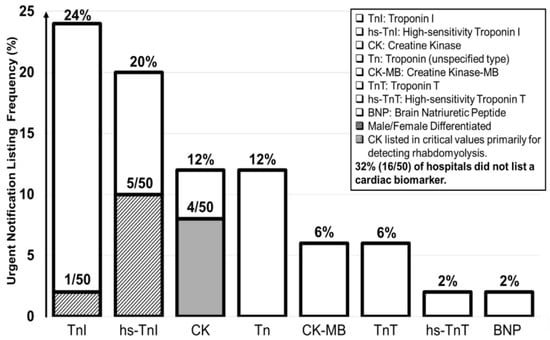
Figure 7.
Cardiac biomarker listings.
3.6. Ranges and Median Numbers of Tests
Figure 8 illustrates the ranges and median number of tests for each laboratory discipline. The ranges for listed chemistry, toxicology, microbiology, newborn, qualitative, quantitative, and total tests were especially wide.
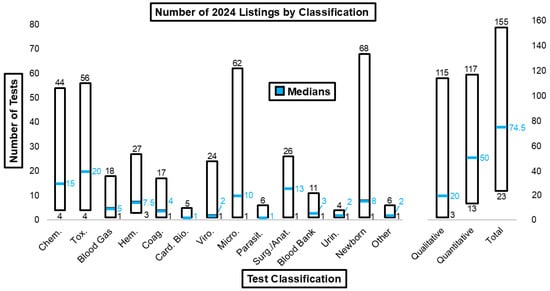
Figure 8.
Number of 2024 listings by test classification.
3.7. Bioterrorism Threats and Pathogens
Table 6 summarizes pathogens that most frequently appear as critical values. The figure also highlights pathogens deemed to warrant urgent notification by the NIH [28], CDC [29], WHO [30], and IDSA [31].
Table 6.
Listing frequencies of critical pathogens.
3.8. Critical Values
Table 7 summarizes critical values identified in 2024. Additional frequent critical values included: positive culture (82%) or Gram stain (60%) from sterile body fluid, positive Acid-Fast Bacillus (AFB) (68%), and pathogenic fungus in invasive space (44%).
Table 7.
Qualitative critical values.
3.9. POCT
We acquired POCT listings from 17 institutions. These results are summarized in Table 8. Only the high median critical limit showed a significant difference between POCT and main lab glucose measurements.
Table 8.
POCT critical limits.
4. Discussion
Medical centers rely on multiple sources to determine appropriate critical limits and critical values for their institutions. Sources may include national surveys, such as the one published in MLO CLR in 2024 [5] and studies conducted by the institutions themselves regarding the effectiveness of current critical notification thresholds [32] and the potential effect of changing critical limits on call volume and patient outcomes [33].
Only 3 pathogens listed in the n = 50 dataset—Vibrio cholerae, COVID-19, and the Influenza viruses—were deemed urgent notifications by the CDC, NIH, WHO, and IDSA, but were listed by only 4% of the institutions in our survey. Collaboration between government agencies and medical centers may help identify a more comprehensive and concise list of pathogens that warrant immediate intervention [34]. Establishing standardized lists of pathogens that are universally deemed as warranting urgent notification may help ensure consistency across different institutions, further enhancing standards of patient care [9]. Hospitals could establish standard formats for web-based postings of critical limits and critical values. Web-based postings would allow hospitals to better assess critical limit and critical value notification lists and policies across the country and set the stage for future harmonization [35,36]
Tests displaying significant changes between 1990 and 2024, such as glucose (adults and newborns), total calcium, magnesium, CO2 content, platelet count, partial thromboplastin time (PTT), white cell count, prothrombin time (PT), and potassium (newborns), were among the top 15 tests associated with patient death within 24 hours of reporting test results [37].
Although the low median critical limit for blood glucose increased significantly between 1990 and 2024, it remains lower than the ADA-recommended threshold for neuroglycopenic symptoms. This may be because hospitals are basing their critical limits on factors such as laboratory alerts and call volume [38]. This highlights the need for ongoing evaluation and updating of critical notifications lists in healthcare institutions. Adopting standardized approaches for identifying and treating pathophysiological trends can enhance consistency and timeliness, thereby improving patient care [10].
The ranges for arterial pCO2 low and high critical limits and arterial pO2 low critical limits showed significant changes, although the median critical limits for these measurands did not change. This lack of consensus across institutions indicates uncertainty and may result in patients being treated with different standards of care. This variability is not consistent with the national standard of care [39]. For hospitals whose listed critical limits for these measurands fall below or above the median (for low and high critical limits, respectively), there is an added risk of interventions being enacted too late.
The median low critical limits for hemoglobin and platelet count have shifted away from thresholds associated with blood transfusion needs and severe thrombocytopenia in both men and women. Some institutions may set lower critical limits to reduce unnecessary transfusions and their associated risks [40,41,42]. However, shifting critical limits away from severe clinical thresholds, while decreasing risk for some patients, may delay detection of life-threatening conditions and the delivery of life-saving care for others [43]. Institutions could adopt less conservative critical limits, further from the clinical thresholds such as those identified in Figure 5 and Figure 6, by implementing specific policies that outline testing and critical values for transfusion need indicators prior to major events, such as surgery [21].
Troponin I and High-sensitivity Troponin I are crucial for the timely diagnosis of acute myocardial infarctions (AMIs) and other cardiac conditions due to their high specificity for cardiac muscle damage [43]. The omission of cardiac biomarkers from critical notifications lists entirely can lead to delays in diagnosing and treating cardiac emergencies [44]. Institutions without cardiac biomarkers listed should consider adding hs-TnI to their critical notifications lists due to its sensitivity and cost-effectiveness [45].
While six hospitals listed CK as a cardiac biomarker, four hospitals used it specifically to diagnose rhabdomyolysis. CK is less sensitive than other listed tests, such as troponin, in detecting cardiac muscle damage [46]. Reserving CK as a tool for monitoring muscle damage, such as in cases of rhabdomyolysis, is recommended due to its sensitivity and specificity in indicating severe muscle damage [47,48]
The variability in the number of listed tests across different categories, including chemistry, toxicology, microbiology, newborn screening, and both qualitative and quantitative tests, is notably wide. This wide range can lead to inconsistencies in patient care and inefficiencies in treatment delivery [49]. Collaboration between medical centers aimed at reaching a consensus on standardized lists of tests could significantly enhance efficiency, cost-effectiveness, and the overall quality of patient care [9].
COVID-19 is listed as a critical value by only two hospitals. This is a significant omission, as urgent notification of this pandemic threat can enhance awareness, accelerate infection control, and mitigate contagion [50,51]. Institutions should monitor new notifications, such as positive COVID-19 test results, to speed up infection control in the event of future pandemic threats.
Analysis of our dataset found that, with only six exceptions, urgent notification lists specific to POCT were not present. This finding is noteworthy and contrary to the global expansion of POCT for COVID-19 detection following the pandemic [52]. The absence of dedicated POCT notifications lists may increase liability due to delays in therapeutic care after detection of critical results at the bedside [53]. Furthermore, there is a risk that actionable bedside critical results may not be consistently communicated to the appropriate healthcare professionals who can assess and treat patients effectively [51]. Delineating POCT into concise, separate lists could mitigate these issues and contribute to cost-effectiveness by streamlining the testing and notification process [54]. Clear documentation of policy surrounding collecting and reporting POC values will ensure patient safety and the institution’s compliance with accreditation standards [55].
The use of visual logistics in representing significant changes in qualitative tests will help contextualize critical limits against professional recommendations [8], allowing identification of discrepancies in what national organizations recommend. Visual logistics can also substantially increase the accessibility and clarity of this information and serve as an educational tool for health personnel [56]. The implementation of visual logistics may lead to faster communication and thereby improve patient care by allowing healthcare providers to quickly identify and respond to critical changes [57].
There are limitations to our study. The sample of seventeen institutions with POCT listings represented all that were accessible online, with the addition of comprehensive efforts to acquire additional lists. Furthermore, our results include tests such as INR and Troponin, that were not present in the 1990 datasets, as indicated in Table 3, Table 4 and Table 5 and Figure 7. Several new qualitative listings and infectious threats were found. However, we did not contact hospital staff to determine why they were listed.
5. Conclusions
These findings underscore the importance of regularly updating and standardizing critical limits and critical values lists to align with decision thresholds. The visualization of this information alongside clinical thresholds offers potential benefits for ease of interpretation and clinical decision-making.
Our study provides an analysis of critical limit and critical value test lists used by major US medical centers, revealing significant changes in quantitative critical limit thresholds since 1990 and documenting notification priorities for qualitative and new listings. Statistically significant differences were observed in clinical tests between 1990 and 2024, including glucose, calcium, magnesium, CO2 content, blood gas parameters, hematology, and coagulation tests. Cardiac biomarkers were infrequently listed, suggesting potential areas for improvement of standardization. POCT listings were sparse and showed a significant difference from main lab values in the high median critical limit for glucose. Only three pathogens—Vibrio cholerae, COVID-19, and the Influenza viruses—were consistently deemed as requiring urgent notification by the NIH, WHO, CDC, and IDSA.
Our research highlights the need for enhanced collaboration between government agencies and medical centers to establish universally accepted lists of critical values. Collaboration could lead to more consistent and timely patient care and ultimately improve patient outcomes. Future research should focus on developing standardized protocols for updating critical value lists and exploring the impact of these changes on patient care quality and efficiency.
Author Contributions
Conceptualization, A.S., J.D., K.C., M.G., G.J.K.; data collection, A.S., J.D., K.C., M.G., G.J.K.; writing—original draft preparation, A.S.; writing—review and editing, A.S., J.D., K.C., M.G., G.J.K. All authors have read and agreed to the published version of the manuscript.
Funding
This research was funded in part by an Edward A. Dickson Emeritus Professorship, by the Point-of-Care Testing Center for Teaching and Research (POCT•CTR), and by Kost, its Director, who held a US Fullbright Scholar Award, ASEAN Program during the early development of the project.
Institutional Review Board Statement
Ethical review and approval were waived for this study by the UC Davis IRB (ID 2078118-1). Data for the Web survey were extracted from public domain open sources accessible on the internet. Reporting of notification lists and research results is anonymous.
Informed Consent Statement
Not applicable.
Data Availability Statement
The datasets presented in this article are not readily available due to confidentiality of sources and direct collection of many lists. Requests to access the datasets should be directed to geraldkost@gmail.com.
Acknowledgments
Figures and tables are provided courtesy and permission of Knowledge Optimization, Davis, California.
Conflicts of Interest
The authors declare no conflicts of interest.
Abbreviations
The following abbreviations are used in this manuscript:
| POCT | Point-of-care testing |
| JAMA | Journal of the American Medical Association |
| MLO | Medical Laboratory Observer |
| CLR | Clinical Laboratory reference |
| CDC | Centers for Disease Control and Prevention |
| NIH | National Institutes of Health |
| WHO | World Health Organization |
| IDSA | Infectious Diseases Society of America |
| ADA | American Diabetes Association |
| ACNL | Adult Critical limits Not Listed |
| PTT | Partial thromboplastin time |
| PT | Prothrombin time |
| AMI | Acute myocardial infarction |
| WBC | White blood cell |
| ANC | Absolute neutrophil count |
| INR | International normalized ratio |
| CSF | Cerebrospinal fluid |
| TnI | Troponin I |
| hs-TnI | High-sensitivity Troponin I |
| CK | Creatine Kinase |
| AFB | Acid-Fast Bacillus |
| COVID-19 | Coronavirus infectious disease-2019 |
| PCR | Polymerase Chain reaction |
| RAgT | Rapid Antigen Test |
| RBC | Red blood cells |
| RPR | Rapid plasma reagin |
| SARS-CoV-2 | Severe acute respiratory syndrome-coronavirus-2 |
References
- Kost, G.J. Critical Limits for Urgent Clinician Notification at US Medical Centers. JAMA 1990, 263, 704–707. [Google Scholar] [CrossRef]
- Kost, G.J. Critical Limits for Emergency Clinician Notification at United States Children’s Hospitals. Pediatrics 1991, 88, 597–603. [Google Scholar] [CrossRef] [PubMed]
- Kost, G.J. The Significance of Ionized Calcium in Cardiac and Critical Care: Availability and Critical Limits at US Medical Centers and Children’s Hospitals. Arch. Pathol. Lab. Med. 1993, 117, 890–896. [Google Scholar] [PubMed]
- Kost, G.J. Using Critical Limits to Improve Patient Outcome. MLO Med. Lab. Obs. 1993, 25, 22–27. [Google Scholar] [PubMed]
- Kost, G.J. Medical Laboratory Observer Clinical Laboratory Reference. Table of critical limits; 2024–2025. MLO Med. Lab. Obs. 2024, 56, 10–13. [Google Scholar]
- Saposnik, G.; Goyal, M.; Majoie, C.; Dippel, D.; Roos, Y.; Demchuk, A.; Menon, B.; Mitchell, P.; Campbell, B.; Dávalos, A.; et al. Visual Aid Tool to Improve Decision Making in Acute Stroke Care. Int. J. Stroke 2016, 11, 868–873. [Google Scholar] [CrossRef]
- Durand, M.; Selby, K.; Okan, Y. Visualisation of Evidence for Shared Decision Making. BMJ Evid. Based Med. 2024, 29, 117–120. [Google Scholar] [CrossRef]
- Hafner, C.; Schneider, J.; Schindler, M.; Braillard, O. Visual Aids in Ambulatory Clinical Practice: Experiences, Perceptions and Needs of Patients and Healthcare Professionals. PLoS ONE 2022, 17, e0263041. [Google Scholar] [CrossRef]
- Jha, P.K.; Agarwal, R. Quality Tools and Strategy for Critical Alerts Process Improvements to Ensure Patient Safety. J. Lab. Physicians 2022, 14, 471–478. [Google Scholar] [CrossRef]
- Adhyaru, B.B.; Hilburn, G.; Oberg, M.; Mann, K.; Wu, D. Push Notifications for Critical Lab Results: A Pilot Study in the Intensive Care Unit (ICU). JAMIA Open 2023, 6, ooad058. [Google Scholar] [CrossRef]
- Elrod, J.K.; Fortenberry, J.L., Jr. Centers of Excellence in Healthcare Institutions: What They Are and How to Assemble Them. BMC Health Serv. Res. 2017, 17, 425. [Google Scholar] [CrossRef] [PubMed]
- Ahluwalia, S.C.; Damberg, C.L.; Silverman, M.; Motala, A.; Shekelle, P.G. What Defines a High-Performing Health Care Delivery System: A Systematic Review. Jt. Comm. J. Qual. Patient Saf. 2017, 43, 450–459. [Google Scholar] [CrossRef] [PubMed]
- Kost, G.J.; Dohner, J.; Liu, J.; Ramos, D.; Haider, N.; Thalladi, V. Web-accessible critical limits and critical values for urgent clinician notification. Clin. Chem. Lab. Med. 2024, 62, 2294–2306. [Google Scholar] [CrossRef] [PubMed]
- American Diabetes Association Professional Practice Committee. Glycemic Goals and Hypoglycemia: Standards of Care in Diabetes—2024. Diabetes Care 2024, 47, S111–S124. [Google Scholar] [CrossRef]
- American Diabetes Association Professional Practice Committee. Diagnosis and Classification of Diabetes: Standards of Care in Diabetes—2024. Diabetes Care 2024, 47, S20–S34. [Google Scholar] [CrossRef]
- Pasquel, F.J.; Umpierrez, G.E. Hyperosmolar Hyperglycemic State: A Historic Review of the Clinical Presentation, Diagnosis, and Treatment. Diabetes Care 2014, 37, 3124–3131. [Google Scholar] [CrossRef]
- Samuel, R.W.; Thomas, B.W.; Christmas, A.B.; Cunningham, K.W.; Sing, R.F. Returning from the Acidotic Abyss: Mortality in Trauma Patients with a pH < 7.0. Am. J. Surg. 2017, 214, 1067–1072. [Google Scholar]
- Kaufman, D.A. Interpretation of Arterial Blood Gases (ABGs). American Thoracic Society 2024. Available online: https://www.thoracic.org/professionals/clinical-resources/critical-care/clinical-education/abgs.php (accessed on 27 December 2024).
- Tang, W.J.; Xie, B.K.; Liang, W.; Zhou, Y.Z.; Kuang, W.L.; Chen, F.; Wang, M.; Yu, M. Hypocapnia is an Independent Predictor of In-Hospital Mortality in Acute Heart Failure. ESC Heart Fail. 2023, 10, 1385–1400. [Google Scholar] [CrossRef]
- Roussos, C.; Koutsoukou, A. Respiratory Failure. Eur. Respir. J. Suppl. 2003, 22, 3s–14s. [Google Scholar] [CrossRef]
- Cinnella, G.; Pavesi, M.; De Gasperi, A.; Ranucci, M.; Mirabella, L. Clinical standards for patient blood management and perioperative hemostasis and coagulation management. Position Paper of the Italian Society of Anesthesia, Analgesia, Resuscitation and Intensive Care (SIAARTI). Minerva Anestesiol. 2019, 85, 635–664. [Google Scholar] [CrossRef]
- Raphael, J.; Mazer, C.D.; Subramani, S.; Schroeder, A.; Abdalla, M.; Ferreira, R.; Roman, P.E.; Patel, N.; Welsby, I.; Greilich, P.E.; et al. Society of Cardiovascular Anesthesiologists Clinical Practice Improvement Advisory for Management of Perioperative Bleeding and Hemostasis in Cardiac Surgery Patients. Anesth. Analg. 2019, 129, 1209–1221. [Google Scholar] [CrossRef]
- Barbui, T.; Thiele, J.; Gisslinger, H.; Kvasnicka, H.M.; Vannucchi, A.M.; Guglielmelli, P.; Orazi, A.; Tefferi, A. The 2016 WHO classification and diagnostic criteria for myeloproliferative neoplasms: Document summary and in-depth discussion. Blood Cancer J. 2018, 8, 15. [Google Scholar] [CrossRef] [PubMed]
- Iurlo, A.; Cattaneo, D.; Bucelli, C.; Baldini, L. New Perspectives on Polycythemia Vera: From Diagnosis to Therapy. Int. J. Mol. Sci. 2022, 21, 5805. [Google Scholar] [CrossRef] [PubMed]
- Shaw, G.; Berg, R. Beyond Hemoglobin: When and How to Work Up Possible Polycythemia Vera. Clin. Med. Res. 2020, 18, 11–20. [Google Scholar] [CrossRef] [PubMed]
- Drews, R.E.; Weinberger, S.E. Thrombocytopenic disorders in critically ill patients. Am. J. Respir. Crit. Care Med. 2000, 162, 347–351. [Google Scholar] [CrossRef]
- Bleeker, J.S.; Hogan, W.J. Thrombocytosis: Diagnostic evaluation, thrombotic risk stratification, and risk-based management strategies. Thrombosis 2011, 2011, 536062. [Google Scholar] [CrossRef]
- Bioterrorism Agents/Diseases (by Category)|Emergency Preparedness & Response. Available online: https://emergency.cdc.gov/agent/agentlist-category.asp (accessed on 29 October 2024).
- CDC Current Outbreak List. Available online: https://www.cdc.gov/outbreaks/index.html (accessed on 29 October 2024).
- Managing Epidemics: Key Facts About Major Deadly Diseases. Available online: https://www.who.int/publications/i/item/managing-epidemics-key-facts-about-major-deadly-diseases (accessed on 29 October 2024).
- IDSA Practice Guidelines. Available online: https://www.idsociety.org/practice-guideline/practice-guidelines/#/+/0/date_na_dt/desc/?status_na_str=Current (accessed on 27 December 2024).
- Doering, T.A.; Plapp, F.; Crawford, J.M. Establishing an Evidence Base for Critical Laboratory Value Thresholds. Am. J. Clin. Pathol. 2014, 142, 617–628. [Google Scholar] [CrossRef]
- Karin, A.; Kulasingam, V.; Chartier, L.B.; Ejumudo, A.; Wolff, T.; Brinc, D. Recurring Critical Results and Their Impact on the Volume of Critical Calls at a Tertiary Care Center. J. Appl. Lab. Med. 2021, 6, 962–968. [Google Scholar] [CrossRef]
- Vora, N.M.; Hannah, L.; Walzer, C.; Vale, M.M.; Lieberman, S.; Emerson, A.; Jennings, J.; Alders, R.; Bonds, M.H.; Evans, J.; et al. Interventions to Reduce Risk for Pathogen Spillover and Early Disease Spread to Prevent Outbreaks, Epidemics, and Pandemics. Emerg. Infect. Dis. 2023, 29, e221079. [Google Scholar] [CrossRef]
- Kost, G.J. Co-creating critical limits for enhanced acute care: Proven need and web knowledge base. Part 1: A call to action. Med. Lab. Obs. 2015, 47, 36–37. [Google Scholar]
- Kost, G.J. Co-creating critical limits for enhanced acute care: Proven need and web knowledge base. Part 2: Standard of care, what it means, and how it is applied. Med. Lab. Obs. 2016, 48, 28–29. [Google Scholar]
- Yang, Z.; Tan, E.H.; Li, Y.; Lim, B.; Metz, P.; Loh, T.P. Relative criticalness of common laboratory tests for critical value reporting. J. Clin. Pathol. 2019, 72, 325–328. [Google Scholar] [CrossRef]
- Hart, S.A.; Pogue, E.; Wiencek, J.R.; Nelson, S.D.; Schell, R.F. Standardizing Hypoglycemic Critical Values Across United States Hospitals. Am. J. Clin. Pathol. 2024, 162, S1–S187. [Google Scholar] [CrossRef]
- The Joint Commission. National Patient Safety Goals® Effective January 2025 for the Hospital Program. Available online: https://www.jointcommission.org/-/media/tjc/documents/standards/national-patient-safety-goals/2025/hap-npsg-chapter-2025.pdf (accessed on 27 December 2024).
- Vincent, J.L.; Baron, J.F.; Reinhart, K.; Gattinoni, L.; Thijs, L.; Webb, A.; Meier-Hellmann, A.; Nollet, G.; Peres-Bota, D.; ABC investigators. Anemia and Blood Transfusion in Critically Ill Patients. JAMA 2002, 288, 1499–1507. [Google Scholar] [CrossRef] [PubMed]
- Carson, J.L.; Stanworth, S.J.; Dennis, J.A.; Trivella, M.; Roubinian, N.; Fergusson, D.A.; Triulzi, D.; Dorée, C.; Hébert, P.C. Transfusion thresholds for guiding red blood cell transfusion. Cochrane Database Syst. Rev. 2021, 12, CD002042. [Google Scholar] [PubMed]
- Blumberg, N.; Heal, J.M.; Phillips, G.L. Platelet transfusions: Trigger, dose, benefits, and risks. F1000 Med. Rep. 2010, 2, 5. [Google Scholar] [CrossRef]
- Elrobaa, I.H.; Khan, K.; Mohamed, E. The Role of Point-of-Care Testing to Improve Acute Care and Health Care Services. Cureus 2024, 16, e55315. [Google Scholar] [CrossRef]
- Hachey, B.J.; Kontos, M.C.; Newby, L.K.; Christenson, R.H.; Peacock, W.F.; Brewer, K.C.; McCord, J. Trends in Use of Biomarker Protocols for the Evaluation of Possible Myocardial Infarction. J. Am. Heart Assoc. 2017, 6, e005852. [Google Scholar] [CrossRef]
- Sandoval, Y.; Apple, F.S.; Mahler, S.A.; Body, R.; Collinson, P.O.; Jaffe, A.S. International Federation of Clinical Chemistry and Laboratory Medicine Committee on the Clinical Application of Cardiac Biomarkers. High-Sensitivity Cardiac Troponin and the 2021 AHA/ACC/ASE/CHEST/SAEM/SCCT/SCMR Guidelines for the Evaluation and Diagnosis of Acute Chest Pain. Circulation 2022, 146, 569–581. [Google Scholar]
- Sahadeo, P.A.; Dym, A.A.; Berry, L.B.; Bahar, P.; Singla, A.; Cheta, M.; Bhansali, R.; LaVine, S.; Laser, J.; Richman, M. The Best of Both Worlds: Eliminating Creatine Kinase-Muscle/Brain (CK-MB) Testing in the Emergency Department Leads to Lower Costs Without Missed Clinical Diagnoses. Cureus 2021, 13, e15150. [Google Scholar] [CrossRef]
- Torres, P.A.; Helmstetter, J.A.; Kaye, A.M.; Kaye, A.D. Rhabdomyolysis: Pathogenesis, diagnosis, and treatment. Ochsner J. 2015, 15, 58–69. [Google Scholar]
- Wang, X.Y.; Zhang, F.; Zhang, C.; Zheng, L.R.; Yang, J. The Biomarkers for Acute Myocardial Infarction and Heart Failure. Biomed. Res. Int. 2020, 2020, 2018035. [Google Scholar] [CrossRef]
- Florkowski, C.; Don-Wauchope, A.; Gimenez, N.; Rodriguez-Capote, K.; Wils, J.; Zemlin, A. Point-of-Care Testing (POCT) and Evidence-Based Laboratory Medicine (EBLM)—Does it Leverage Any Advantage in Clinical Decision Making? Crit. Rev. Clin. Lab. Sci. 2017, 54, 471–494. [Google Scholar] [CrossRef] [PubMed]
- Kost, G.J. The Coronavirus Disease 2019 Spatial Care Path: Home, Community, and Emergency Diagnostic Portals. Diagnostics 2022, 12, 1216. [Google Scholar] [CrossRef] [PubMed]
- Kost, G.J. Diagnostic Strategies for Endemic Coronavirus Disease 2019 (COVID-19): Rapid Antigen Tests, Repeated Testing, and Prevalence Boundaries. Arch. Pathol. Lab. Med. 2022, 146, 16–25. [Google Scholar] [CrossRef] [PubMed]
- Fernandes, R.S.; de Oliveira Silva, J.; Gomes, K.B.; Azevedo, R.B.; Townsend, D.M.; de Paula Sabino, A.; Branco de Barros, A.L. Recent advances in point of care testing for COVID-19 detection. Biomed. Pharmacother. 2022, 153, 113538. [Google Scholar] [CrossRef]
- Hanna, D.; Griswold, P.; Leape, L.L.; Bates, D.W. Communicating Critical Test Results: Safe Practice Recommendations. Jt. Comm. J. Qual. Patient Saf. 2005, 31, 68–80. [Google Scholar] [CrossRef]
- Schifman, R.B.; Howanitz, P.J.; Souers, R.J. Point-of-Care Glucose Critical Values: A Q-Probes Study Involving 50 Health Care Facilities and 2349 Critical Results. Arch. Pathol. Lab. Med. 2016, 140, 119–124. [Google Scholar] [CrossRef]
- Documenting Critical Values at the Point of Care. Available online: https://myadlm.org/cln/articles/2022/september/documenting-critical-values-at-the-point-of-care (accessed on 6 November 2024).
- Macdonald, A.S.; Macduff, C.; Loudon, D.; Wan, S. Evaluation of a visual tool co-developed for training hospital staff on the prevention and control of the spread of healthcare associated infections. Infect. Dis. Health 2017, 22, 105–116. [Google Scholar] [CrossRef]
- Craft, M.; Dobrenz, B.; Dornbush, E.; Hunter, M.; Morris, J.; Stone, M.; Barnes, L. An Assessment of Visualization Tools for Patient Monitoring and Medical Decision Making. In Proceedings of the 2015 Systems and Information Engineering Design Symposium, Charlottesville, VA, USA, 24 April 2015. [Google Scholar]
Disclaimer/Publisher’s Note: The statements, opinions and data contained in all publications are solely those of the individual author(s) and contributor(s) and not of MDPI and/or the editor(s). MDPI and/or the editor(s) disclaim responsibility for any injury to people or property resulting from any ideas, methods, instructions or products referred to in the content. |
© 2025 by the authors. Licensee MDPI, Basel, Switzerland. This article is an open access article distributed under the terms and conditions of the Creative Commons Attribution (CC BY) license (https://creativecommons.org/licenses/by/4.0/).