Abstract
Background/Objectives: Tuberculosis (TB), caused by Mycobacterium tuberculosis (M. tuberculosis), remains a leading cause of death from infectious diseases globally. The treatment of active TB relies on first- and second-line drugs, however, the emergence of drug resistance poses a significant challenge to global TB control efforts. Recent advances in whole-genome sequencing combined with machine learning have shown promise in predicting drug resistance. This study aimed to evaluate the performance of four machine learning models in classifying resistance to ethambutol, isoniazid, and rifampicin in M. tuberculosis isolates. Methods: Four machine learning models—Extreme Gradient Boosting Classifier (XGBC), Logistic Gradient Boosting Classifier (LGBC), Gradient Boosting Classifier (GBC), and an Artificial Neural Network (ANN)—were trained using a Variant Call Format (VCF) dataset preprocessed by the CRyPTIC consortium. Three datasets were used: the original dataset, a principal component analysis (PCA)-reduced dataset, and a dataset prioritizing significant mutations identified by the XGBC model. The models were trained and tested across these datasets, and their performance was compared using sensitivity, specificity, Precision, F1-scores and Accuracy. Results: All models were applied to the PCA-reduced dataset, while the XGBC model was also evaluated using the mutation-prioritized dataset. The XGBC model trained on the original dataset outperformed the others, achieving sensitivity values of 0.97, 0.90, and 0.94; specificity values of 0.97, 0.99, and 0.96; and F1-scores of 0.93, 0.94, and 0.92 for ethambutol, isoniazid, and rifampicin, respectively. These results demonstrate the superior accuracy of the XGBC model in classifying drug resistance. Conclusions: The study highlights the effectiveness of using a binary representation of mutations to train the XGBC model for predicting resistance and susceptibility to key TB drugs. The XGBC model trained on the original dataset demonstrated the highest performance among the evaluated models, suggesting its potential for clinical application in combating drug-resistant tuberculosis. Further research is needed to validate and expand these findings for broader implementation in TB diagnostics.
1. Introduction
TB is an infectious disease caused by bacteria from the M. tuberculosis complex. While primarily affecting the lungs, TB can manifest in other sites, such as the nervous system, bones, skin, intestines, genitals, and lymph nodes. Airborne transmission, like COVID-19, is the primary mode of spread, occurring through droplets expelled by TB patients. Approximately one-third of the global population is infected with M. tuberculosis. In 2023, TB led to 10.6 million illnesses and 1.6 million deaths, equivalent to 4500 daily fatalities [1]. The World Health Organization (WHO) estimated that globally, 558,000 cases (ranging from 483,000 to 639,000) of rifampicin-resistant TB (RR-TB), a potent first-line drug, occurred in 2021. Of these, 82% were multidrug-resistant TB (MDR-TB), indicating resistance to at least the second most crucial drug, isoniazid (H). Drug-resistant TB (DR-TB) cases have surged over the past 15 years, resulting in strains of M. tuberculosis resistant to all existing drugs, termed extensively drug-resistant TB (XDR-TB). DR-TB is transmitted similarly to drug-sensitive TB but is more complex to treat and expensive, and improperly managed cases can be potentially fatal [1].
Conventional DR-TB diagnosis relies on drug susceptibility testing (DST) through microbiological cultures, which takes 4 to 6 weeks to yield results. During this time, patients continue to transmit the bacteria due to a lack of appropriate drug treatment. Globally, only 64% of TB cases are diagnosed, leaving 3.6 million people untreated out of 10 million new cases, thereby contributing to further transmission [2]. Many countries, including Mexico, use acid-fast bacilli microscopy for TB diagnosis. This technique has been used for over a century but does not detect DR-TB.
Modern molecular methods offer significant advantages in scaling up DR-TB management and surveillance, providing rapid, standardized diagnostic assays with the potential for high performance and reduced laboratory biosafety requirements [3]. Molecular assays offer results within hours, with high sensitivity and specificity. The Xpert MTB/RIF assay is widely used for rapid M. tuberculosis identification and rifampicin (R) resistance detection, requiring just two hours; nevertheless, it only assesses R resistance. The new Xpert® MTB/XDR version identifies mutations linked to H, fluoroquinolones, second-line injectable drugs (amikacin, kanamycin, capreomycin), and ethionamide resistance in a single test [4].
Furthermore, recent advances in Next-Generation Sequencing (NGS) for M. tuberculosis have expedited the assay to 2–5 days, significantly lowering costs. This allows physicians to obtain a more comprehensive drug resistance (DR) profile within hours rather than weeks or months. Timely access to such information would facilitate tailored drug treatment and, consequently, earlier interruption of disease transmission [5]. Considering the above, an alternative to targeted mutation detection methods is NGS, which can identify common and rare mutations associated with anti-tuberculosis drug resistance [6]. Genes linked to drug resistance have been extensively studied, demonstrating that single-nucleotide polymorphisms (SNPs), deletions, and insertions (INDELs) lead to drug-resistant strains [7].
One promising path to tackle DR-TB is take advantage of machine learning (ML) and Deep Learning (DL) models for M. tuberculosis isolate classification and the prediction of drug resistance [8,9,10,11,12]. These models utilize algorithms capable of analyzing vast datasets and discerning intricate patterns, enabling more accurate identification of drug-resistant isolates from data sources like NGS.
This research aims to harness NGS-derived data of M. tuberculosis strains to train ML models for DR classification, surpassing the performance of whole-genome association studies (WGASs), in order to predict R, H, and ethambutol (E) drug resistance information.
2. Materials and Methods
2.1. Training Matrix
2.1.1. Database
The dataset used for this study is derived from the Comprehensive Resistance Prediction for Tuberculosis: An International Consortium (CRyPTIC) and comprises genomic sequences from 12,289 M. tuberculosis clinical isolates collected globally [13]. These isolates, obtained from 23 countries, were selected to represent a broad spectrum of drug-resistant phenotypes, ensuring coverage across different lineages of the bacterium. The isolates underwent whole-genome sequencing and were tested for susceptibility to 13 anti-tubercular drugs, including first-line drugs such as R and H, second-line drugs like levofloxacin (Lfx) and amikacin (Am), and new or repurposed drugs such as bedaquiline (Bdq) and delamanid (Dlm).
The minimum inhibitory concentration (MIC) for each isolate was measured using a standardized microscale assay, ensuring uniform data collection across different laboratories. These phenotypic data were matched with whole-genome sequencing results, generating a VCF file for each isolate, facilitating in-depth genomic analysis. Notably, the dataset is enriched for rare resistance-associated variants, especially those linked to newly introduced drugs, allowing the exploration of resistance mechanisms beyond conventional drugs. In total, the dataset contains 6814 isolates resistant to at least one drug, including 2129 samples classified as R-resistant, multidrug-resistant, pre-extensively drug-resistant, or extensively drug-resistant.
2.1.2. Data Preprocressing
The original VCF file contained mutation data for each isolate; however, its structure was not optimal for efficiently creating a training matrix. To address this issue and ensure computational feasibility, a preprocessing step was performed, which involved extracting a subset of 929 unique IDs from the original dataset of 12,289 isolates. This subset was selected as the maximum number of samples that could be processed within the available computational resources. While the selection was not based on specific sampling criteria, it aimed to maintain a balance that reasonably represented the diversity and variability of the original dataset.
During preprocessing, mutation information was reorganized to represent each mutation as a binary presence/absence indicator rather than a nucleotide change (Figure 1). Following this extraction, additional filtering was performed to exclude isolates lacking complete drug susceptibility data for E, H, and R. This refinement resulted in a final dataset of 847 IDs, representing a reduction of 8.8% from the initially extracted subset.
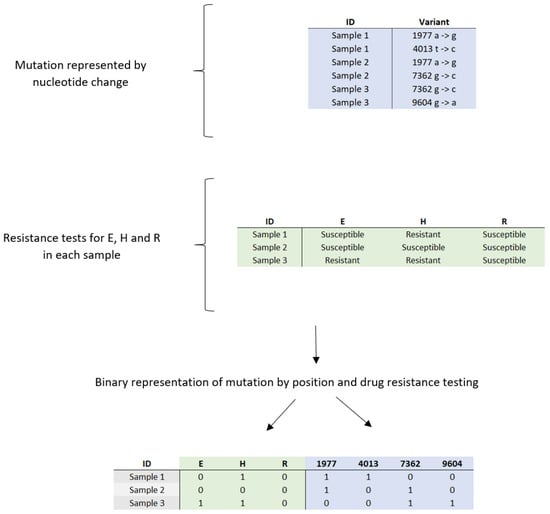
Figure 1.
Conversion of categorical data on genetic mutations and drug sensitivity and resistance profiles in clinical samples to binary values: E = ethambutol; H = isoniazid; R = rifampicin.
The final dataset comprised 79,256 unique mutations, which were carefully filtered to ensure accuracy and reliability for model training. Prioritizing data quality over quantity was essential, as models trained on incomplete or inaccurate data could produce unreliable predictions in clinical applications. Ultimately, the resulting training matrix consisted of 847 isolates, of which 589 were susceptible and 258 were resistant. A breakdown of the resistance data revealed 155 isolates resistant to E, 244 to H, and 200 to R.
The training matrix was structured as (847 × 79,259), where the first three columns represented the drug resistance labels, serving as the target variables, while the remaining columns contained the unique mutations identified as predictors. This carefully curated dataset was used for training the machine learning models in this study, ensuring both computational manageability and high-quality data for predictive modeling tasks (Figure 2).
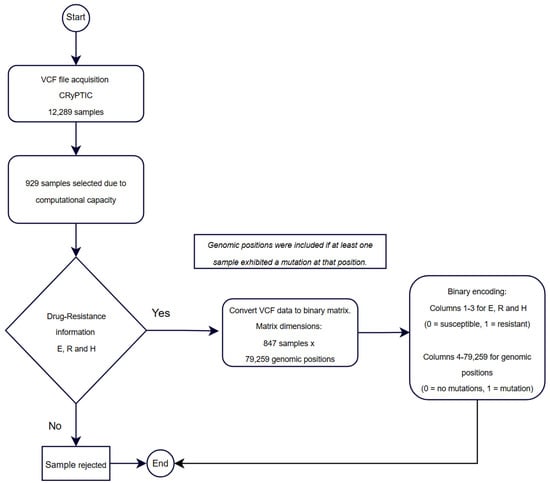
Figure 2.
Workflow for sample selection, data processing, and binary representation for training matrix construction.
2.1.3. Data Splitting: Training and Testing
To evaluate model performance and ensure its ability to generalize to unseen data, cross-validation was implemented. This technique is crucial for preventing issues such as overfitting, as it allows the model to be tested on different subsets of the original dataset.
Specifically, the cross_val_score() function from the Scikit-learn library (version 1.6.0) was used to perform cross-validation, implemented in Python 3.10.12. The dataset was initially divided into 677 training samples and 170 test samples. Cross-validation was applied exclusively to the 677 training samples. The process involved splitting this training set into 10 subsets or “folds” (k = 10). In each iteration, one fold (approximately 68 samples) was used as the test set while the remaining nine folds (approximately 609 samples) were used for training. This procedure was repeated 10 times, ensuring that each subset of the data was used as the test set once.
After all iterations, performance metrics, such as accuracy or loss, were averaged across the 10 iterations, providing a more robust and reliable evaluation of the model. Beyond performance evaluation, cross-validation also optimized the model’s hyperparameters, ensuring the best possible performance without sacrificing generalization ability.
2.1.4. Dimensionality Reduction
Principal component analysis (PCA) was employed as an optimal transformation method for dimensionality reduction, minimizing squared errors. PCA focuses on identifying the features with the greatest variance and retaining the lower-order principal components that are most relevant to the dataset. In this study, 470 principal components were retained, representing 95% of the cumulative variance in the dataset (Figure 3). This approach allowed for a more compact representation of the data while preserving the most important features for analysis. The dataset reduced by PCA was subsequently used for all models evaluated in this study.
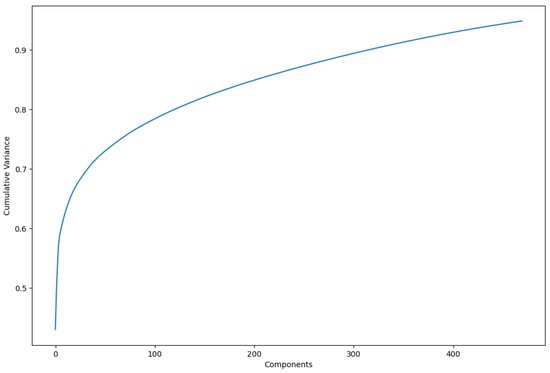
Figure 3.
Increase in cumulative variance by using more principal components. In total, 470 were used to represent variance of 0.95.
2.1.5. Arbitrary Variant Reduction
The XGBC and LGBC models utilize the importance_type parameter, defined as ‘weight’, which measures how often a feature (in this case, a mutation) is used to split the data across decision trees. This analysis allowed for the identification of the most critical mutations, which were then compared against known resistance mutation catalogs. The feature reduction was performed based on these key mutations, generating a new dataset that prioritized the most important mutations identified by the best-performing model, XGBC, which outperformed the LGBC in predictive capability. This new dataset, referred to as RA (where ‘RA’ stands for ‘reducción arbitraria’ in Spanish), highlighting the arbitrary reduction in variants, was exclusively utilized with the XGBC model.
2.2. Machine Learning Models
This study employs a range of models, including the XGBoost Classifier (XGBC), LightGBM Classifier (LGBC), Gradient Boosting Classifier (GBC), and Multi-layer Perceptron Classifier (MLPClassifier, referred to as an artificial neural network or ANN). The XGBC model was applied to the original dataset as well as to PCA-reduced and RA datasets. In contrast, the other models were tested exclusively on the original and PCA-reduced datasets. These selections were made based on the models’ capabilities to process complex datasets and their effectiveness in addressing non-linear relationships.
XGBC and LGBC are gradient-boosting algorithms that exhibit exceptional performance in classification tasks, particularly when utilized with large datasets. These algorithms effectively address overfitting and enhance predictive accuracy through the application of advanced boosting techniques. In this context, a binary representation for mutations was employed, which does not account for the specific nucleotide changes associated with each mutation. Therefore, these models are particularly well suited for this analysis due to their decision tree-based framework. By leveraging the strengths of decision trees, XGBC and LGBC are capable of identifying significant mutations as they consistently appear across multiple decision paths within the ensemble. This capability provides valuable insights into the most critical genomic positions [14].
The inclusion of GBC is warranted due to its robust predictive performance and flexibility in optimizing various loss functions. The MLPClassifier, a neural network-based model, was chosen for its ability to capture intricate patterns through its multi-layer architecture, rendering it suitable for both linear and non-linear problems. Detailed parameters for each model are presented in Table 1.

Table 1.
Parameters of the Machine Learning Models Implemented in the Study (XGBC, LGBC, GBC, and ANN).
2.3. Multioutput Prediction
The MultiOutputClassifier class from the Scikit-learn library was employed in this study to handle multi-label classification, with the goal of predicting resistance to three different drugs simultaneously. This approach allowed for efficient multi-label classification, as it enabled the models to predict all outputs at once without the need for separate training for each drug.
Several ML models were used as base estimators within the MultiOutputClassifier. Specifically, XGBoost (XGBClassifier), LightGBM (LGBMClassifier), Gradient Boosting (GradientBoostingClassifier), and a neural network model (MLPClassifier) were applied. The models were configured with optimized hyperparameters, such as a high number of estimators (2000) and a learning rate of 0.001, to ensure robust performance. The use of MultiOutputClassifier ensured that predictions were made efficiently across all three drugs for each model, while also capturing any potential correlations between drug resistance patterns.
2.4. Performance Metrics
The confusion matrix played a crucial role in evaluating the performance of the models, particularly in detecting drug resistance. It distinguishes between true positives, true negatives, false positives, and false negatives, and optimal results are reflected when the majority of values are concentrated along the diagonal of the matrix. To provide a more detailed evaluation, several metrics were calculated based on the confusion matrix.
2.4.1. Accuracy
Accuracy measures the fraction of correct predictions (both true positives and true negatives) made by the model across the entire dataset. This metric is useful when the dataset is balanced between positive and negative cases.
2.4.2. Sensitivity (Recall or True Positive Rate)
Sensitivity evaluates the model’s ability to correctly identify positive cases, making it particularly important for detecting drug resistance.
2.4.3. Specificity (True Negative Rate)
This metric measures the model’s ability to correctly identify negative cases, or those that are susceptible to the drugs. High specificity indicates the model’s effectiveness in avoiding false positives.
2.4.4. Precision
Precision represents the proportion of true positive predictions among all positive predictions made by the model. It is a key metric for evaluating the accuracy of the model in identifying drug-resistant isolates.
2.4.5. F1-Score
The F1-score combines both precision and sensitivity into a single metric, providing a balanced view of the model’s performance, especially when the class distribution is imbalanced. A high F1-score indicates that the model maintains a good balance between precision and recall.
These metrics were calculated for each model to provide a comprehensive assessment of their performance in predicting drug resistance. Confusion matrices for each model and dataset are provided in the Supplementary Materials.
2.5. Statistical Analysis Method
To assess the statistical significance of differences in model performance, a Kruskal–Wallis test was conducted. This non-parametric test was chosen because it is suitable for comparing performance metrics across multiple models, especially when the data do not follow a normal distribution, as is often the case with machine learning performance metrics. The test was performed on the four models (XGBC, LGBC, GBC, and ANN), using sensitivity, specificity, precision, F1-score, and accuracy as the performance metrics. The Kruskal–Wallis test was selected because it allows for the evaluation of whether there are significant differences in model performance without making assumptions about the underlying distribution of the data, which is crucial when dealing with complex datasets like those used in this study. Based on these results, follow-up analyses were performed to examine the models further, focusing on those with comparable performance (excluding the ANN model in subsequent analyses).
3. Results
3.1. Data Overview
This study demonstrated the ability to predict drug resistance in M. tuberculosis by training a model on a matrix incorporating genome-wide mutations and drug resistance data in binary form (1 for presence/resistance, 0 for absence/susceptibility). Mutations included in the training matrix were found in both intergenic regions and coding regions previously associated with drug resistance, as well as in genes not previously implicated in this context. This expanded dataset allows for a more comprehensive analysis of mutations and their potential impact on drug resistance.
3.2. Model Performance and Statistical Analysis
Four machine learning models—XGBC, LGBC, GBC, and ANN—were implemented to predict resistance to E, H, and R. The XGBC model, trained on the original dataset, achieved high sensitivity values of 0.97, 0.90, and 0.94, and specificity values of 0.97, 0.99, and 0.96 for E, H, and R, respectively.
The LGBC model also performed well, achieving sensitivity values of 0.85, 0.90, and 0.94 for E, H, and R, respectively. While slightly lower than XGBC in sensitivity for ethambutol, LGBC achieved competitive specificity values of 0.98, 0.98, and 0.94 for the same drugs. Similarly, the GBC model demonstrated consistent performance with sensitivity values of 0.80, 0.86, and 0.94 for E, H, and R, and it excelled in specificity, achieving 1.00, 0.94, and 0.98 for the same drugs. The ANN model, however, exhibited poorer results, particularly in sensitivity, which was significantly lower than the other models.
To address the dataset imbalance favoring drug-susceptible isolates, sensitivity, specificity, and F1-score metrics were analyzed and compared (Figure 4). Models trained on the original dataset consistently outperformed those trained on a dataset reduced by principal component analysis (PCA), indicating better classification accuracy without dimensionality reduction.
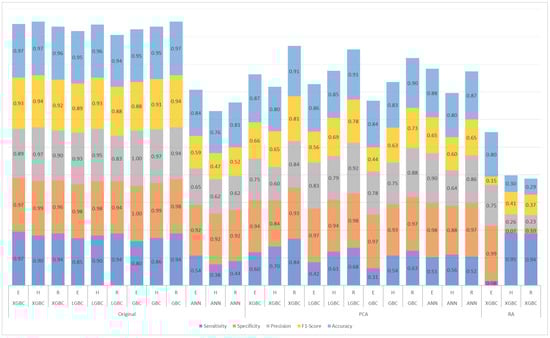
Figure 4.
Results for ethambutol (E), isoniazid (H), and rifampicin (R) of the models trained with the original dataset, the dataset reduced by principal component analysis (PCA), and the dataset with arbitrary reduction (RA) with the most important features in the XGBC model.
A Kruskal–Wallis test was conducted on all four models (XGBC, LGBC, GBC, and ANN) to evaluate significant differences in performance across various metrics (sensitivity, specificity, precision, F1-score, and accuracy) (Table 2). Statistically significant differences were found in specificity (p = 0.043), precision (p = 0.047), and accuracy (p = 0.039), primarily due to the lower performance of the ANN model (Figure 4).
Table 2.
Kruskal–Wallis test for performance metrics across prediction models (XGBC, LGBC, GBC, and ANN; XGBC, LGBC, and GBC).
Given the ANN model’s suboptimal performance, a secondary analysis was conducted, excluding it to focus on the remaining models (XGBC, LGBC, and GBC) (Table 2). In this follow-up test, no significant differences were observed across any evaluated metric (p > 0.17 across all metrics), suggesting that the ANN model’s lower sensitivity (0.55 compared to values above 0.90 for the other models) was the primary factor driving statistical significance in the initial analysis.
3.3. Feature Importance
Extracting the most important features from the XGBC model enabled a direct comparison with resistance mutations cataloged by the WHO for M. tuberculosis. Table 3 highlights that a significant portion of the features identified by the XGBC model correspond to mutations listed in the WHO catalog, specifically within resistance-associated genes such as katG, rpoB, rpsL, and gyrA.
Table 3.
Key features used in the XGBC model for ethambutol (E), isoniazid (H), and rifampicin (R).
The table provides detailed information about each mutation, including its index in the training matrix, genomic position (G. Position), associated gene, and whether it is present in the WHO catalog (indicated by a checkmark in the “Catalog” column). Additionally, the “Feature Importance” column quantifies how often each mutation was utilized across the decision trees within the XGBC model for predicting resistance to E, H, and R.
Further analysis of the XGBC-PCA model, which incorporated principal components derived from the PCA-transformed dataset, revealed a similar alignment with WHO-reported resistance mutations. Table 4 details the contributions of the top five PCs for each drug’s classification. Each PC represents a weighted combination of mutations, and the table lists the top five contributing mutations along with their genomic positions, associated genes, catalog status, and “PC Importance” values.
Table 4.
Key features used in the XGBC-PCA model for ethambutol (E), isoniazid (H), and rifampicin (R).
These observations indicate that the XGBC model emphasizes mutations cataloged by the WHO as critical markers of resistance. However, the XGBC-PCA model, while retaining key features within its top PCs, may obscure individual mutations by combining them into broader components, potentially explaining the model’s reduced sensitivity for H and R.
The disparity in sensitivity and specificity between the models underscores the influence of dataset characteristics and feature selection on model performance. For H and R, the XGBC-RA model demonstrated high sensitivity values (0.95 and 0.94, respectively), likely due to its emphasis on critical resistance mutations. However, this sensitivity came at the cost of specificity (0.07 and 0.10), possibly because the reduced feature set underrepresented mutations relevant to susceptibility. For E, the model exhibited the opposite pattern, achieving high specificity (0.99) but low sensitivity (0.08) (Figure 4).
This trade-off reflects the inherent class imbalance in the dataset, where susceptible samples were more prevalent than resistant ones. In this context, the RA dataset’s reduced feature set prioritized resistance-related mutations, which improved sensitivity for resistant cases but compromised the model’s ability to identify susceptible ones reliably. These findings emphasize the importance of balancing sensitivity and specificity when designing predictive models for clinical applications.
4. Discussion
This study demonstrates the potential of ML models, particularly the XGBC model, to predict drug resistance against R, H, and E in M. tuberculosis using a binary matrix of genome-wide mutations. The XGBC model performed as well as or better than direct association methods and other ML models reported in previous research [8,9,10,11,12]. However, it is important to acknowledge that other models, such as LGBC and GBC, also showed strong performance, with results comparable to those of XGBC. Notably, there was no significant difference in performance among these three models, further supporting the effectiveness of decision tree-based methods for this type of binary training and classification task.
Despite the strong performance of XGBC with the original dataset, its performance significantly decreased when trained on the RA dataset, which was derived by selecting the most important features identified by XGBC. The disparity in sensitivity and specificity between the models trained on the original and RA datasets underscores the influence of feature selection on model performance. For H and R, the XGBC-RA model demonstrated high sensitivity values (0.95 and 0.94, respectively), likely due to its focus on critical resistance mutations. However, this came at the cost of specificity (0.07 and 0.10), suggesting that the reduced feature set underrepresented mutations relevant to susceptibility. For E, the XGBC-RA model exhibited the opposite pattern, achieving high specificity (0.99) but low sensitivity (0.08), which highlights the trade-off between sensitivity and specificity when reducing features.
These results can be attributed to the inherent class imbalance in the dataset, where susceptible samples are more prevalent than resistant ones. In this scenario, the model becomes biased towards predicting the majority class, leading to a trade-off between sensitivity and specificity depending on the drug. The RA dataset, with its reduced feature set, probably emphasized critical mutations to predict resistance, thereby improving the sensitivity for resistant cases. However, this emphasis may have come at the cost of reducing the model’s ability to accurately identify susceptible cases, particularly for INH and RIF, where relevant mutations for susceptibility may not have been adequately represented in the reduced dataset.
The performance of models trained on datasets with dimensionality reduction (using PCA) also exhibited decreased sensitivity and specificity compared to those trained on the original dataset. This further reinforces the challenges of using PCA with binary data, as while PCA can simplify data, it may not always preserve the critical features necessary for accurate prediction. The reduced dimensionality, both in the RA and PCA datasets, may have led to the loss of mutations important for susceptibility classification, ultimately compromising the model’s ability to accurately predict resistant and susceptible cases.
Significant differences were observed in the statistical analysis performed when comparing the performance metrics among the four models (Table 2). The ANN model exhibited lower sensitivity, likely contributing to these observed differences. However, it is essential to highlight that the ANN needed to be thoroughly optimized in this study; instead, the primary focus was on enhancing the performance of the other models, specifically XGBC, LGBC, and GBC. It has been demonstrated, however, that ANNs can achieve good predictive results in drug resistance studies when thoroughly optimized and explored in depth [16].
As a result, when the ANN was excluded from the analysis, the remaining models (XGBC, LGBC, and GBC) demonstrated no significant differences in their performance metrics. This indicates that, while the ANN may have impacted the overall comparative results, the performance of the other models remained consistent.
Despite the lack of significant differences among them, the sensitivity values of the XGBC model still showcased its predictive solid power for drug resistance, reinforcing its position as a preferred choice for clinical applications.
Despite a reduced dataset (847 IDs selected from 12,289 original datasets), the XGBC model achieved favorable results, suggesting that the selected isolates may contain significant and representative mutations critical for predicting drug resistance. This implies that relevant and informative features can still drive effective model performance even with a smaller dataset. However, increasing computational power and using a more comprehensive training matrix could enhance the accuracy and generalizability of the model. Larger datasets would likely capture a wider variety of genetic diversity and drug resistance profiles, leading to more robust predictions.
The study also highlights the importance of intergenic regions in predicting drug resistance, with the XGBC model incorporating these regions into its classification. This aligns with previous studies that identified significant mutations in intergenic regions, such as embC-embA and oxyR-ahpC, related to resistance to E and H [17,18]. These regions, though non-coding, could harbor mutations that affect the regulation of resistance genes, possibly influencing drug susceptibility. Given the complexity of the M. tuberculosis genome, the inclusion of intergenic mutations in future analyses could enhance the accuracy of resistance predictions, providing a more comprehensive understanding of resistance mechanisms. Further investigation into these regions would be valuable in improving predictive models and clinical applications.
As the field evolves, using more advanced ML techniques and algorithms could help make better use of larger datasets, allowing models to identify more detailed patterns related to drug resistance. This would improve their predictive accuracy. While this study highlights the effectiveness of the XGBC model, it also emphasizes the need for larger datasets and improved computational resources to enhance performance. Future research could also benefit from more complex datasets that take into account mutation types, as well as nucleotide changes, which would provide deeper insights into the bacterial mechanisms behind drug resistance. This will be crucial for applying these models in clinical settings. This study not only shows the potential of ML for predicting drug resistance but also provides insights into the genomic factors involved, reinforcing the need for better computational resources and broader datasets in future studies.
5. Conclusions
The study shows that a machine learning model called XGBC, which uses a binary training matrix containing information on drug resistance and genome-wide mutation data in M. tuberculosis, is highly accurate in predicting drug resistance. It performs better than other methods previously reported. While the XGBC model is a promising tool for classifying drug resistance, there is potential for further refinement and optimization, which presents opportunities for future research. This advancement in the fight against drug-resistant TB offers ML models that can accurately predict resistance patterns, potentially improving treatment strategies and outbreak prevention efforts.
The research establishes a machine learning framework that predicts first-line drug resistance in M. tuberculosis, particularly for R, H, and E. The XGBC model demonstrates high specificity and sensitivity, showing its potential as a valuable tool in combating drug-resistant TB. By enhancing our understanding of resistance mechanisms and identifying connections between cases, this work significantly contributes to public health efforts. Implementing XGBC models and considering intergenic mutations and previously unrecognized genes could lead to more efficient strategies in combating drug resistance in TB. Leveraging these insights can enhance our understanding of resistance mechanisms and improve treatment outcomes, ultimately addressing the critical challenge of drug-resistant TB.
Supplementary Materials
The following supporting information can be downloaded at: https://www.mdpi.com/article/10.3390/diagnostics15030279/s1.
Author Contributions
Conceptualization, D.-L.F. and R.M.-S.; methodology, G.P.-G. and R.P.-J.; investigation, G.P.-G., R.P.-J. and M.-Á.G.-C.; writing—original draft preparation, G.P.-G.; writing—review and editing, R.M.-S., D.-L.F., M.-Á.G.-C., H.-G.A.-M., E.M.-M., J.L.M.R. and R.Z.-C.; supervision, D.-L.F. and R.M.-S. All authors have read and agreed to the published version of the manuscript.
Funding
This research was funded by the Universidad Autónoma de Baja California (UABC) and CONACYT (GPG: 2021-000018-02NACF-15002; RPJ: 2020-000026-02NACF-07298; MAGC: 2022-000018-02NACF-15485). The sponsors had no role in the study’s design, the collection and analysis of data, the decision to publish, or the preparation of the manuscript. This research was funded by the UNAM-Huawei Innovation Space under the project “Identification and Prediction of Drug Resistance in the Pangenome of Mycobacterium tuberculosis Using Machine Learning Methods”. Access to high-performance computing resources was provided as part of this collaboration.
Institutional Review Board Statement
Not applicable.
Data Availability Statement
The data supporting the findings of this study are available upon reasonable request from the corresponding author. Due to privacy and ethical considerations, access to certain portions of the dataset may be restricted.
Conflicts of Interest
The authors declare no conflicts of interest.
References
- World Health Organization (WHO). Global Tuberculosis Report 2022; World Health Organization: Geneva, Switzerland, 2022. Available online: https://www.who.int/publications/i/item/9789240061729 (accessed on 10 February 2023).
- World Health Organization (WHO). Global Tuberculosis Report 2021; World Health Organization: Geneva, Switzerland, 2021. Available online: https://www.who.int/publications/i/item/9789240037021 (accessed on 10 October 2022).
- Sistema de Información en Salud. DGIS. Subsistema Epidemiológico y Estadístico de Defunciones. 2020. Available online: http://www.dgis.salud.gob.mx/contenidos/sinais/s_seed.html (accessed on 10 November 2022).
- Katamba, A.; Ssengooba, W.; Sserubiri, J.; Semugenze, D.; Kasule, G.W.; Nyombi, A.; Byaruhanga, R.; Turyahabwe, S.; Joloba, M.L. Evaluation of Xpert MTB/XDR test for susceptibility testing of Mycobacterium tuberculosis to first and second-line drugs. PLoS ONE 2023, 18, e0284545. [Google Scholar] [CrossRef]
- Weissfeld, J.L.; Lin, Y.; Lin, H.M.; Kurland, B.F.; Wilson, D.O.; Fuhrman, C.R.; Pennathur, A.; Romkes, M.; Nukui, T.; Yuan, J.M.; et al. Lung cancer risk prediction using common SNPs located in GWAS-identified susceptibility regions. J. Thorac. Oncol. 2015, 10, 1538–1545. [Google Scholar] [CrossRef] [PubMed]
- Chen, M.L.; Doddi, A.; Royer, J.; Freschi, L.; Schito, M.; Ezewudo, M.; Kohane, I.S.; Beam, A.; Farhat, M. Beyond multidrug resistance: Leveraging rare variants with machine and statistical learning models in Mycobacterium tuberculosis resistance prediction. EBioMedicine 2019, 43, 356–369. [Google Scholar] [CrossRef] [PubMed]
- Roberts, M.R.; Asgari, M.M.; Toland, A.E. Genome-wide association studies and polygenic risk scores for skin cancer: Clinically useful yet? Br. J. Dermatol. 2019, 181, 1146–1155. [Google Scholar] [CrossRef]
- Murphy, S.G.; Smith, C.; Lapierre, P.; Shea, J.; Patel, K.; Halse, T.A.; Dickinson, M.; Escuyer, V.; Rowlinson, M.C.; Musser, K.A. Direct detection of drug-resistant Mycobacterium tuberculosis using targeted next-generation sequencing. Front. Public Health 2023, 11, 1206056. [Google Scholar] [CrossRef]
- Mahé, P.; El Azami, M.; Barlas, P.; Tournoud, M. A large-scale evaluation of TBProfiler and Mykrobe for antibiotic resistance prediction in Mycobacterium tuberculosis. PeerJ 2019, 7, e6857. [Google Scholar] [CrossRef]
- Deelder, W.; Christakoudi, S.; Phelan, J.; Benavente, E.D.; Campino, S.; McNerney, R.; Palla, L.; Clark, T.G. Machine learning predicts accurately Mycobacterium tuberculosis drug resistance from whole genome sequencing data. Front. Genet. 2019, 10, 922. [Google Scholar] [CrossRef] [PubMed]
- Deelder, W.; Napier, G.; Campino, S.; Palla, L.; Phelan, J.; Clark, T.G. A modified decision tree approach to improve the prediction and mutation discovery for drug resistance in Mycobacterium tuberculosis. BMC Genom. 2022, 23, 46. [Google Scholar] [CrossRef] [PubMed]
- Gröschel, M.I.; Owens, M.; Freschi, L.; Vargas, R.; Marin, M.G.; Phelan, J.; Iqbal, Z.; Dixit, A.; Farhat, M.R. GenTB: A user-friendly genome-based predictor for tuberculosis resistance powered by machine learning. Genome Med. 2021, 13, 138. [Google Scholar] [CrossRef] [PubMed]
- The CRyPTIC Consortium. A data compendium associating the genomes of 12,289 Mycobacterium tuberculosis isolates with quantitative resistance phenotypes to 13 antibiotics. PLoS Biol. 2022, 20, 25. [Google Scholar] [CrossRef]
- Rahman, A.; Zaman, S.; Das, D. Cracking the Genetic Codes: Exploring DNA Sequence Classification with Machine Learning Algorithms and Voting Ensemble Strategies. In Proceedings of the 2024 International Conference on Advances in Computing, Communication, Electrical, and Smart Systems (iCACCESS), Dhaka, Bangladesh, 8–9 March 2024; pp. 1–6. [Google Scholar] [CrossRef]
- World Health Organization. Catalogue of Mutations in Mycobacterium tuberculosis Complex and Their Association with Drug Resistance; World Health Organization: Geneva, Switzerland, 2021; Available online: https://www.who.int/publications/i/item/9789240028173 (accessed on 10 February 2021).
- Évora, L.H.R.A.; Seixas, J.M.; Kritski, A.L. Neural network models for supporting drug and multidrug-resistant tuberculosis screening diagnosis. Neurocomputing 2017, 265, 116–126. [Google Scholar] [CrossRef]
- Cui, Z.; Li, Y.; Cheng, S.; Yang, H.; Lu, J.; Hu, Z.; Ge, B. Mutations in the embC-embA intergenic region contribute to Mycobacterium tuberculosis resistance to ethambutol. Antimicrob. Agents Chemother. 2014, 58, 6837–6843. [Google Scholar] [CrossRef]
- Safi, H.; Lingaraju, S.; Amin, A.; Kim, S.; Jones, M.; Holmes, M.; McNeil, M.; Peterson, S.N.; Chatterjee, D.; Fleischmann, R.; et al. Evolution of high-level ethambutol-resistant tuberculosis through interacting mutations in decaprenylphosphoryl-β-D-Arabinose biosynthetic and utilization pathway genes. Nat. Genet. 2013, 45, 1190–1197. [Google Scholar] [CrossRef]
Disclaimer/Publisher’s Note: The statements, opinions and data contained in all publications are solely those of the individual author(s) and contributor(s) and not of MDPI and/or the editor(s). MDPI and/or the editor(s) disclaim responsibility for any injury to people or property resulting from any ideas, methods, instructions or products referred to in the content. |
© 2025 by the authors. Licensee MDPI, Basel, Switzerland. This article is an open access article distributed under the terms and conditions of the Creative Commons Attribution (CC BY) license (https://creativecommons.org/licenses/by/4.0/).