Abstract
Background/Objectives: The study aimed to evaluate the most significant factors that impact arterial blood gas parameters: pH, pO2, pCO2, and concentration of lactates. Methods: The study was a retrospective analysis of clinical data obtained from the patients’ records hospitalized at the Department of Pediatric Anesthesiology and Intensive Care. A total of 71 patients were enrolled in the study. A total of 479 measurements were performed for arterial blood, 41 were excluded. The analysis was performed for 438 results. The artificial neural network (ANN) regression models were applied, and the Least Absolute Shrinkage and Selection Operator (LASSO) regression was used. ANNs were built considering the following activation functions: hyperbolic tangent, linear, exponential, and logistic. The following three sets were separated: training, testing, and validation. In the case of LASSO regression, the regularization was applied, excluding insignificant variables from the model. Besides the machine learning techniques, the correlation between the variables was calculated. Results: The correlation coefficients for regression ANN models exceeded the value for testing set of 0.92. According to the sensitivity analysis, the most significant variable for pH was cCl−, for pO2 it was pO2/FiO2, for pCO2 it was Fshunt, and for concentration of lactates it was pH. In the case of LASSO regression for pH, the most significant factor was pCO2, for pO2 it was pO2/FiO2, for pCO2 it was cCl−, and for concentration of lactates it was pCO2. Conclusions: The results show the usefulness of machine learning methods in analyzing complex physiological relationships. Such techniques can help improve diagnostic accuracy and optimize therapeutic management in pediatric patients.
1. Introduction
Maintaining acid–base balance is one of the most crucial aspects of preserving the body’s homeostasis. This phenomenon has been extensively studied for over 70 years since the research of John Severinghaus and Leland Clark [1]. Nowadays, their groundbreaking achievements are part of the foundation of pathophysiology, which is vital for the understanding of patients’ conditions, not only in intensive care, but also in almost every other field of health studies. The body tightly controls the regulation of proper pH levels by adjusting the ventilation rate, buffers such as , and renal mechanisms. pH should be kept within the range 7.35–7.45. Disturbances in acid–base balance can lead to serious clinical consequences. On the other hand, they are common in the intensive care units and may be divided into the following categories: metabolic (acidosis and alkalosis) and respiratory (acidosis and alkalosis). They contribute significantly to higher morbidity and mortality [2,3,4].
The mathematical formula, such as the Henderson–Hasselbalch equation, describes the relationship between pH and the concentration of an ionized salt and a nonionized acid molecule. The other is the Stewart approach, which states that whole body acid–base balance can be estimated quantitatively regarding pCO2, net strong ion charge, and total weak acids (albumins, inorganic phosphorus). It is regulated by the lungs, kidneys, gut, and liver [5].
There has been growing interest in using various machine learning techniques as analytical methods in recent years. These approaches enable rapid analysis of large clinical databases and modeling complex, nonlinear relationships between different physiological parameters that may be potentially interconnected. Such techniques include artificial neural networks (ANNs) and Least Absolute Shrinkage and Selection Operator (LASSO) regression. Neural network deep-learning models might be useful in identifying diabetic retinopathy, cardiovascular risk, or moles from melanomas [6].
The operation of ANN is modeled on the functioning of biological nerve cells. By enabling various activation functions and adjusting the network architecture, they allow for modeling complex relationships between individual parameters [7].
The study aims to evaluate the factors that influence the following parameters: pH, pCO2, pO2, and lactate concentration (cLac) in arterial blood in patients from the pediatric intensive care unit. We integrated the following computational paradigms—specifically, ANN for their nonlinear modeling capabilities, LASSO regression for its robust feature selection and regularization properties. We also applied classical correlation for its foundational interpretability of linear relationships—to analyze the influence of various blood gasometry parameters on acid–base balance. To our knowledge, this is the first investigation to employ such a hybrid, multi-model analytical framework specifically designed to elucidate the relative contributions of blood gas variables in maintaining acid–base homeostasis. This innovative approach promises a nuanced and holistic understanding of pathophysiological mechanisms, which can ultimately guide more precise and personalized therapeutic interventions for patients with acid–base balance disorders.
2. Material and Methods
2.1. Characteristics of Patients and Analyzed Parameters
The conducted study was a retrospective one. It was based on the anonymized patients’ data extracted from patients’ records [8]. According to the statement of the Local Ethics Committee at Poznan University of Medical Sciences, approval was not necessary (S59/25).
The study cohort consisted of patients admitted to the Pediatric Intensive Care Unit at the Karol Jonscher Clinical Hospital of the Poznan University of Medical Sciences between 1 October 2024 and 31 March 2025. A total of 71 patients aged 0–17 years old were enrolled in the study. The mean age was 4.83 ± 5.27 years old (median 2 years old). The M/F ratio was 41/30. In total, 479 measurements were performed. A total of 41 measurements were excluded from the analysis—the Fshunt fraction was below 0, which indicates the measurement error. The analysis was performed for 438 arterial blood measurements. In the case of patients, there were no inclusion and exclusion criteria.
The following parameters were taken into consideration: FiO2—fraction of inspired oxygen, ctHb—total concentration of hemoglobin, sO2—saturation, cK+—concentration of potassium, cNa+—sodium concentration, cCl−—chloride concentration, cLac, Fshunt—fraction of the measured transpulmonary shunt, pO2, pCO2, pH, and pO2/FiO2. The dependent variables in the models were pO2, pCO2, pH, and cLac.
2.2. The Statistical Analysis
The correlation factor was estimated between the dependent variables, which were pO2, pCO2, pH, cLac, and the following variables: FiO2, ctHb, sO2, cK+, cNa+, cCl−, cLac, Fshunt, pO2, pCO2, pH, and pO2/FiO2. The statistical analysis was performed with Statistica 13.3 Software (Tibco Software Inc., Palo Alto, CA, USA).
2.3. Artificial Neural Network Modeling and Biological Testing
ANN is a computational approach capable of modeling nonlinear and intricate relationships among multiple physiological variables. It is advantageous in arterial blood gas analysis, where interactions between factors such as pH, pO2, pCO2, and cLac exhibit complex dependencies. Traditional linear models might fail to capture effectively. The flexibility of ANN to learn from data without assuming any specific parametric form allows the uncovering of hidden patterns and improves predictive accuracy in clinical settings [9].
The arterial blood gasometry results from patients described in Section 2.1 were analyzed with ANN. The multilayer perceptron (MLP) was applied. It is vastly applied in numerous practical regression and classification scenarios [10]. The applied ANN consists of the input, the output layer, and one hidden layer. The ANN was trained in feed-forward, backpropagation, and a supervised learning algorithm. The training was conducted in the following steps described by Imai et al. [11]: the provision of the data to the input layer, the obtained result in the output layer and evaluation of the error, backpropagation to the hidden layer, and the process starts again until the error takes the lowest value and 300 training epochs as the maximal number of trainings. The following activation functions for the hidden and output layers were considered during the ANN modeling: linear, exponential, logistic, hyperbolic tangent, and sinus. The dataset was divided into three subsets to prevent overfitting: training, testing, and validation. The training set contained 70% of the cases. Both testing and validation sets contained 15% of the cases each. The model quality was evaluated with the correlation coefficient value, which should approach the value of 1.0000 for training, testing, and validation set. The neural modeling was performed with Statistica 13.3 software (Tibco Software Inc., Palo Alto, CA, USA).
2.4. LASSO Regression Analysis
LASSO regression was used to account for the need to select variables and regularize the model. By imposing a penalty on the absolute magnitude of regression coefficients, LASSO effectively reduces insignificant predictors to zero, thereby eliminating redundant or irrelevant variables. This feature reduces the risk of overfitting, improves model interpretability, and facilitates the identification of factors that have the greatest impact on blood gas parameters.
The LASSO regression coefficients were estimated by minimizing the residual sum of squares subject to an L1 penalty on the coefficients, effectively shrinking some coefficients to zero and thus selecting a subset of predictors most relevant to each dependent variable. Model tuning was conducted using cross-validation to identify the optimal regularization parameter (λ), balancing model complexity and predictive accuracy. This approach allowed us to identify key predictors influencing each blood gas parameter while controlling for potential confounding effects of correlated variables.
The LASSO regression was applied to find the best predictors for the analyzed dependent variables pO2, pCO2, pH, cLac. The independent variables were FiO2, ctHb, sO2, cK+, cNa+, cCl−, cLac, Fshunt, pO2, pCO2, pH, and pO2/FiO2. It was calculated using Statistica 13.3 software (Tibco Software Inc., Palo Alto, CA, USA).
2.5. Key Steps in the Machine Learning Analysis
To create a risk factor classifier, we analyzed arterial blood gas data from 71 pediatric intensive care unit patients using two complementary modeling methods. First, we used ANN to evaluate the factors that influence key physiological variables (pO2, pCO2, pH, cLac). The ANN consisted of a single hidden layer, was trained using supervised backpropagation for up to 300 epochs, and was optimized by testing multiple activation functions. The dataset was divided into training, test, and validation subsets to minimize overfitting, and model performance was evaluated using correlation coefficients across all subsets.
Second, we used LASSO regression for variable selection and regularization. By applying the L1 penalty, LASSO reduced insignificant coefficients to zero and identified the most influential predictors among parameters such as FiO2, ctHb, sO2, cK+, cNa+, cCl−, cLac, Fshunt, pO2, pCO2, pH, and pO2/FiO2. Cross-validation was used to determine the optimal value of λ. The combination of these methods allowed us to construct a classifier that highlights the strongest risk factors while ensuring both prediction accuracy and interpretability.
The methodology consists of the following key steps:
Data Collection: retrospective extraction of clinical data from pediatric patients’ arterial blood gas records.
Data Preprocessing: cleaning the dataset.
Dataset Splitting: division into training (70%), testing (15%), and validation (15%) subsets to ensure robust model evaluation and prevent overfitting.
ANN Modeling: Construction of MLP structure with input layer (physiological variables), one hidden layer, and output layer (blood gas parameters). Training using feed-forward backpropagation with supervised learning. Testing different activation functions (linear, exponential, logistic, hyperbolic tangent, sinus). Training stops upon minimum error or maximum of 300 epochs.
LASSO Regression Analysis: application for variable selection and regularization to identify the most significant predictors.
Model Evaluation: performance measured by correlation coefficient, and identification of influential variables by sensitivity analysis.
Result Interpretation and Application: understanding physiological relevance, and potential clinical application in diagnostics and management.
3. Results
3.1. Gasometric Parameters
The results for the gasometric parameters analysis for arterial blood are presented in Table 1.

Table 1.
The gasometric parameters for arterial blood.
3.2. The Correlation Analysis
The correlation coefficients for the analyzed variables were calculated. The results for arterial blood are presented in Table 2.
Table 2.
The correlation analysis between pH, pCO2, pO2, cLac, and the independent variables for arterial blood.
3.3. Neural Network Modeling and Biological Testing
The ANNs are based on the MLP algorithm. The impact of the independent variables on the analyzed response was evaluated using sensitivity analysis. The value higher than 1.0000 implied the significance of the analyzed variable. A value lower than 1.0000 implies a lack of significance, and the variable should be removed from the model (Table 3).
Table 3.
The results of the sensitivity analysis for the variables analyzed.
3.3.1. pH
In case of pH, the impact of the following variables was considered: FiO2, ctHb, pO2, pCO2, sO2, cK+. cNa+, cCl−, cLac, pO2/FiO2, and Fshunt. The best parameters for pH were obtained for the following network MLP 11-30-1. The correlation coefficient was 0.9322. It implies a strong correlation between the observed and simulated values. The network was found in the 50th epoch. The following activation functions were applied: hyperbolic tangent for the hidden layer and the exponential for the output layer.
cCl− and pCO2 exert the greatest influence on pH value. Subsequently, the following factors are ranked in order of their descending impact: cNa+, cLac, pO2/FiO2, sO2, Fshunt, FiO2, pO2, cK+, and ctHb. The results of the sensitivity analysis are presented in Table 3. The learning curve chart for pH is presented in Figure 1a.
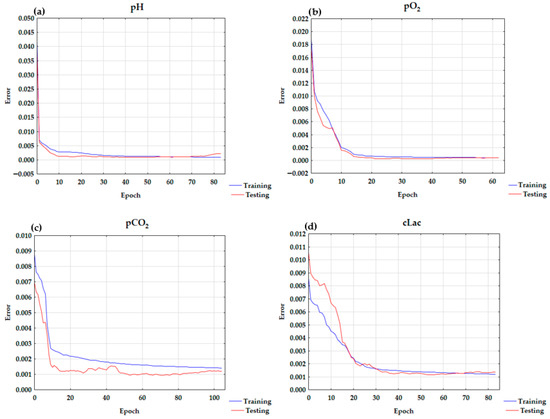
Figure 1.
The learning curve charts for (a) pH, (b) pO2, (c) pCO2, and (d) cLac.
3.3.2. pO2
In pO2, the impact of the following variables was considered: FiO2, ctHb, pH, pCO2, sO2, cK+, cNa+, cCl, cLac, pO2/FiO2, and Fshunt. The best parameters for the neural network were observed for MLP 11-13-1 with the logistic function in both the hidden and output layer. The correlation coefficient was 0.9884. It implies high correlation between the observed and simulated data for the analyzed network. The network was found in the 32nd epoch.
The greatest influence on pO2 was exerted by pO2/FiO2. The other factors are ranked in descending order of their impact: FiO2, Fshunt, sO2, pH, pCO2, cCl−, cNa+, cK+, cLac, and ctHb. The learning curve for pO2 is presented in Figure 1b. The results of the sensitivity analysis are presented in Table 3.
3.3.3. pCO2
For pCO2, the following independent variables were taken into consideration: FiO2, pH, ctHb, pO2, sO2, K+, Na+, Cl−, cLac, pO2/FiO2, and Fshunt. The best network parameters were observed for MLP 11-28-1 with the logistic function as an activation function in both the hidden and output layers. The correlation coefficient was 0.9261. It implies high correlation between the observed and simulated data for the analyzed network. The network was found in the 53rd epoch.
The greatest influence on pCO2 was observed for Fshunt. The other factors were in the following descending order of importance: pO2/FiO2, cCl−, pH, cNa+, FiO2, cLac, sO2, pO2, ctHb, and cK+.
3.3.4. cLac
For neural network modeling of the dependent variable cLac for data obtained from arterial blood analysis: FiO2, pH, ctHb pO2, pCO2, sO2, K+, Na+, cCl−, pO2/FiO2, and Fshunt were used as quantitative independent variables.
The best parameters for pH were obtained for the following network MLP 11-7-1. The correlation coefficient was 0.9327. The value confirms the high correlation between the observed and simulated data. The network was found in the 53rd epoch. The activation function was the hyperbolic tangent for the hidden and output layers.
The ANN analysis indicated that pH was the most significant factor influencing cLac. Subsequently, the following factors are ranked in order of their descending impact: pCO2, Fshunt, pO2/FiO2, FiO2, cK+, cCl−, sO2, pO2, cNa+, and ctHb. The learning chart curve for cLac is presented in Figure 1d. The results of the sensitivity analysis are presented in Table 3.
3.4. LASSO Regression
The results for LASSO regression are presented in Table 4. LASSO (or any regression) shows association, not causation. The number of corresponding variables for pH, pO2, pCO2, and cLac screened out by the model is listed in Figure 2a–d. A LASSO regression model was used to build a risk factor classifier (Figure 3a–d). The low values of L1 indicate strong regularization (high λ values). High values of L1 indicate weak regularization, and low λ values. The analysis indicated the significant factors for the analyzed dependent variables. In the case of pH, (λ = 0.0645) and the following variables were significant: pCO2, pO2, cK+, cNa+, cCl−, and cLac. For pO2 (λ = 0.0504), FiO2, pH, pCO2, sO2, cCl−, and pO2/FiO2 were included in the model. For pCO2 (λ = 0.0270), the following variables were significant: pH, cNa+, cCl−, cLac, and pO2/FiO2. In the case of cLac (λ = 0.0642), the following parameters were included in the model: FiO2, pH, pCO2, sO2, cK+, and cNa+.
Table 4.
The coefficients for LASSO regression for arterial blood.
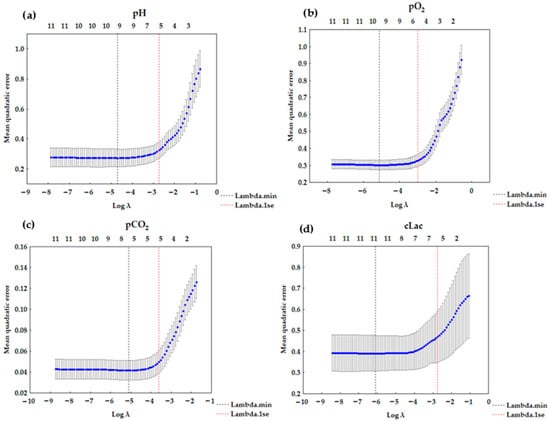
Figure 2.
LASSO regression graph (a) for pH—6 variables (λ = 0.0645); (b) for pO2—6 variables (λ = 0.0504); (c) for pCO2—5 variables (λ = 0.0270); (d) for cLac—6 variables (λ = 0.0642).
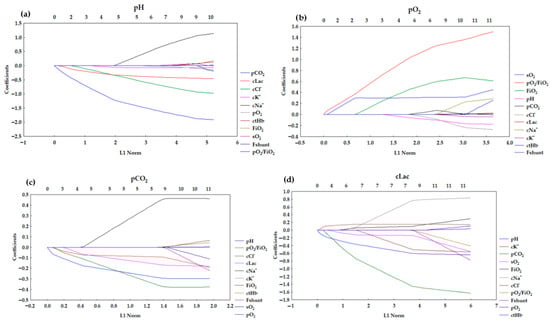
Figure 3.
Lasso coefficient profiles of 11 variables for (a) pH, (b) pO2, (c) pCO2, (d) cLac.
4. Discussion
The study aimed to apply machine learning techniques such as ANN and LASSO regression in analyzing factors affecting arterial blood gas parameters in pediatric patients in the intensive care unit. The analysis was performed for the following dependent variables: pH, pO2, pCO2, and cLac.
4.1. pH
In the ANN analysis, model with high testing quality, minimal differences between testing and learning quality, and low error was obtained. The structure of the ANN was as follows: MLP 11-30-1 model with a hyperbolic tangent in the hidden layer and an exponential function in the output layer. As seen in the learning chart in Figure 1a, the overtraining was not observed. The correlation coefficient was 0.9322. It confirms the model is a good fit.
A sensitivity analysis was conducted to assess the influence of each independent variable on the response. This analysis presents the influence of each parameter hierarchically (Table 3). According to the sensitivity analysis (Table 3), cCl− strongly influences pH (4.0085) as well as pCO2 (3.9872). This implies that Cl− is a key anion strongly affecting plasma pH [12]. This is related to the Stewart model but cannot be easily explained using the Henderson–Hasselbach equation. Hyperchloremia is a common contributor to metabolic acidosis in critically ill patients. In pediatric cases of diabetic ketoacidosis, hyperchloremia emerges as the predominant metabolic factor driving acidosis after 12 h of treatment. It accounts for approximately 98% of the base deficit and frequently delays the resolution of metabolic acidosis in these patients. Hyperchloremic acidosis may lead to hypotension or renal dysfunction [13,14].
The second influential factor is pCO2. It affects pH through the bicarbonate buffer system and follows the Henderson–Hasselbalch equation. It is a hydrogen producer in H2CO3 reaction [12]. cNa+ is ranked in third place (2.1979). Sodium is a major plasma cation affecting the ion difference and pH [12]. In the case of cLac, the effect is moderate (1.9464). It reflects its role as an acid–base status indicator, which increases in acidosis [15]. This interpretation aligns with recent research demonstrating that the independent variables of pH include electrolytes (Na+, K+, Cl−), CO2, lactate, and other factors, all evaluated separately for accurate acid–base assessment [12]. Other variables such as pO2, cK+, sO2, pO2/FiO2 ratio, FiO2, Fshunt, and ctHb have smaller but measurable impacts (all <1.5), indicating secondary or indirect influences on pH likely through metabolic or respiratory interactions.
The correlation analyses for the arterial blood parameters, presented in Table 2, showed that pH has the strongest negative correlation with pCO2. This means that an increase in pCO2 leads to a decrease in pH (respiratory acidosis), while a decrease in pCO2 results in an increase in pH (respiratory alkalosis). It may be explained by the equation:
The increase in pCO2 shifts the reaction to the right, which results in an increase in H+ ions. This relationship is explained by the Henderson–Hasselbalch equation, which describes how pH depends on the concentration of hydrogen ions and carbon dioxide in blood plasma. The increase in pCO2 causes the buffer equation to shift towards producing H+ ions, lowering the blood pH and making it more acidic. On the other hand, the decrease in pCO2 raises pH, making the blood more alkaline [16,17,18].
The negative correlation was observed between pH and Fshunt (Table 2). Which could be related to the amount of carbon dioxide that bypasses the lungs and therefore remains in the blood, causing an exacerbation of acidosis. However, pH often decreases in the state of significant shunting (as Fshunt increases). It results in acidemia. This results from the impaired gas exchange, which is an immediately life-threatening condition, and the accumulation of CO2, which leads to lower pH. However, the compensatory mechanisms such as renal compensation or increased compensatory drive can influence it in the patient [19,20]. It is worth noting that these mechanisms are significantly slower and metabolic compensation may take hours or days or even longer.
Correlation analysis of the effect of FiO2 on pH revealed a negative correlation between these parameters (Table 2). The correlation reflects the severity of respiratory failure, not the pH regulation by FiO2 itself.
A positive correlation was shown between sO2 and pH (Table 2). This is directly related to the Bohr effect, whereby a decrease in pH reduces oxygen binding to hemoglobin (Hb), thereby lowering sO2 [21].
Our study shows a negative correlation between pH and cK+ and cCl− (Table 2). The low pH (acidosis) results in a higher cK+. A similar trend is observed for cCl−, which causes hyperchloremic acidosis. In our studied population, the observed correlation between pH and cNa+ was negative. Iatrogenic hypernatremia may be caused by an extensive use of normal saline. In these situations, it is accompanied by a more pronounced increase in chloride concentration, and the net effect would be metabolic acidosis. Hypernatremia can accompany both alkalosis and metabolic acidosis. The more frequent condition is alkalosis. However, hypernatremia may be observed alongside metabolic acidosis in specific clinical situations, such as diabetic ketoacidosis, which may be combined with a hyperosmolar hyperglycemic state. The effect on pH is indirect and depends on other compensatory mechanisms (such as water loss or ion shifts in broader water and electrolyte metabolism) [22,23,24].
Lactates are formed in the body mainly by anaerobic glycolysis. According to the Stewart model, they constitute a significant part of the measurable strong anions. The production of lactates increases H+ concentration. It leads to decreased pH, which results in a negative correlation (−0.421) (Table 2).
The LASSO regression eliminated the non-significant values to the model. In our analysis it indicated pCO2, pO2, cK+, cNa+, cCl−, and cLac (Table 4). The largest negative values for the coefficients were noted for pCO2 and for cCl−. The signs of the coefficients in the LASSO regression were consistent with those of the correlation coefficients, except for cNa+. The correlation analysis indicated a negative correlation (Table 2), and the LASSO regression indicated a positive coefficient value for cNa+ (Table 4).
In the study of Gucyetmez et al., the multivariate analysis indicated that pH was significantly increased by Na+ and K+ [12]. The coefficient value for LASSO regression for cNa+ was 0.3990, indicating a strong impact. In the case of cK+, the coefficient was negative and took a low value (Table 4). LASSO regression is a model that considers multiple variables simultaneously. The LASSO regression coefficient results from optimization with an L1 penalty, which can reduce some coefficients to zero or change their sign relative to simple correlation. This is especially true when the variables are closely correlated or interdependent. Thus, in a multivariate regression model, regression may attribute a positive effect to a variable on the dependent variable despite a negative direct correlation with it. This can be indirectly explained by correlation, referring to two variables. Considering regularization and interdependence, LASSO regression looks for the best fit, which can change the sign of the regression coefficient. Positive effect of sodium on pH—an increase in sodium is associated with an increase in pH (a change in acidity/alkalosis). This may reflect, for example, compensatory mechanisms of water–electrolyte balance and the influence of sodium on ionic balance (the alkaline effect of sodium) [25].
The negative coefficient for pCO2 (−1.4616) indicates that an increase in pCO2 results in a decrease in pH, which results in acidosis (Table 4). In the case of cCl−, an increase in chloride levels causes a compensatory decrease in pH (e.g., hyperchloremic acidosis) [26]. The negative coefficient for cLac proves that the decrease in pH results from increased cLac (Table 4). Which—again—can be easily explained with Stewart’s approach, but not the Henderson–Hasselbach equation. The negative coefficient indicates that an increase in blood cK+ is associated with a slight decrease in pH, i.e., acidosis. Acidosis can lead to the shift in potassium from cells to the extracellular space (hyperkalemia) [27].
The pH model (Figure 3a) presented distinct negative associations for pCO2, cLac, and cCl− with their coefficients decreasing rapidly. The coefficients for these variables start to change right after the L1 starts to grow, which implies that they are the strongest predictors. Other predictors showed relatively stable or weak contributions. It suggests that pH regulation is dominantly affected by respiratory (pCO2) and metabolic (cLac) acid–base disturbances. The overall pathway is characterized by early shrinkage of key variables with minor contributions from auxiliary predictors.
4.2. pO2
The MLP 11-13-1 model has a logistic activation function for both the hidden and output layers. The learning curve is presented in Figure 1b. The correlation coefficient was 0.9884.
For the pO2 variable, the impact of the pO2/FiO2 ratio was the most influential (29.7513) (Table 3). The pO2/FiO2 ratio directly reflects oxygenation efficiency and lung function, which explains the highest impact. Villar et al. [28] indicated that pO2/FiO2 beside positive end-expiratory pressure (PEEP) at 24 h after moderate/severe acute respiratory distress syndrome (ARDS) appear to be critical for distinguishing distinct ARDS subgroups. The other factor is FiO2 (22.6468). It is the oxygen concentration that the patient inhales, which directly affects arterial oxygen pressure. Fshunt is also a significant factor (2.8196). It reflects the amount of blood bypassing oxygenation in the lungs, thus decreasing pO2. Other variables have sensitivity values close to 1, indicating minor or baseline influence on pO2 in this model context. The relationship between the sO2 and pO2 is presented in Figure 4. The graph’s trend line corresponds to the hemoglobin dissociation curve found in the literature [16]. It demonstrates the good fit of the obtained networks. When pO2 reaches values above 75–83 mmHg, the sO2 parameter is greater than 95%. Conversely, when pO2 is below 75 mmHg, sO2 decreases, indicating a blood oxygen-carrying capacity decline.
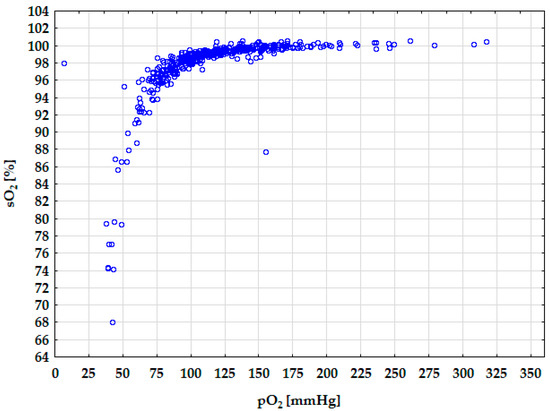
Figure 4.
Diagram of the hemoglobin dissociation curve.
The correlation analysis of pO2 variable in Table 2 showed that the parameters showing the highest positive correlation for arterial blood pO2 are pO2/FiO2 (0.591) and sO2 (0.567) (Table 2). The highest negative correlation was observed for Fshunt (−0.533). The positive correlation between pO2 and sO2 implies that with an increase in pO2, the amount of oxygen dissolved also increases, increasing sO2. In the case of pO2/FiO2, if FiO2 is set as a constant value, the increase in pO2 results in the increase in pO2/FiO2. For FiO2, a negative correlation was observed with pO2 [29,30]. Mayor et al. proved that Fshunt negatively correlates with admission oxygen saturation [31]. Our study confirmed that the observed correlation between pO2 and Fshunt is negative. As the Fshunt fraction increases, more deoxygenated blood bypasses ventilated alveoli, thereby reducing arterial pO2 due to a higher proportion of deoxygenated blood entering systemic circulation [31,32]. In the case of pO2, the negative correlation is observed with pCO2, which is caused by the fact that the removal of pCO2 leads to higher pO2 and an increase in alveolar ventilation.
The LASSO regression indicated that the significant variables for the model were pH, sO2, FiO2, pO2/FiO2, pCO2, and cCl−. For FiO2, the positive value of the coefficient was observed for LASSO regression (Table 4), contrary to the negative correlation (Table 2). The positive coefficient for FiO2 implies that increased FiO2 results in higher pO2. In the case of the correlation analysis, the coefficient was negative (−0.074) (Table 2). However, this correlation was weak. LASSO regression is a multivariate model that simultaneously considers multiple variables and their interdependence and applies regularization. In the LASSO model, the FiO2 coefficient is interpreted assuming that other variables in the model remain constant. The presence of collinearity and complex relationships may cause the bivariate correlation to differ from the coefficient obtained in multivariate regression. In the case of correlation analysis, the simple relationship is analyzed without control of the other variables. The other independent variables in the model are considered in the case of LASSO regression. The bivariate correlation does not reflect complex relationships and indirect effects that are only visible in a multivariate regression model.
The highest positive coefficient value for pO2 for LASSO regression was noted for pO2/FiO2 (1.0699) (Table 4). It implies that this variable has the greatest impact on pO2. The positive coefficient is observed for FiO2 (0.4827) and sO2 (0.3066). It indicates that increased saturation results in increased pO2. The saturation of hemoglobin with oxygen accompanies the high pO2. They are included in the model. It means that blood with a higher pH (alkalosis) can cause an increased affinity of hemoglobin for oxygen (a leftward shift in the O2-Hb dissociation curve, which means that the Hb has higher affinity to oxygen), which may lead to a slight decrease in the arterial blood pO2 at the same saturation level. It is caused by the Bohr effect. Negative coefficients for several variables emerge but remain low—for pH (−0.0640) and for cCl− (−0.0115).
In clinical practice, FiO2 often correlates with disease severity, which may contribute to decreased pO2 (a negative association observed in linear correlation). This relationship reflects that patients with more severe illness frequently require higher FiO2, while their arterial oxygen partial pressure (pO2) tends to decrease, usually due to impaired respiratory function (examples of an exception would be cyanotic cardiac defects or patients on ECMO). However, after considering saturation, pH, and pO2/FiO2 ratio, which are key mediators and covariates, the effect of FiO2 alone on pO2 is positive. The role of regularization in LASSO regression causes the coefficients to be “shrunk,” better reflecting the realistic influence of variables in a multivariate model. In clinical practice, FiO2 often correlates with disease severity, which may contribute to decreased pO2 (a negative association observed in linear correlation). This relationship reflects that patients with more severe illness frequently require higher FiO2, while their arterial pO2 tends to decrease due to impaired respiratory function.
The profile presented in Figure 3b is differentiated by a markedly positive association for pO2/FiO2. FiO2 and sO2 also rise, but not as significantly as for pO2/FiO2. However, the profiles for pO2/FiO2 and sO2 start to grow right after the L1 starts to change. This pattern is consistent with the physiology of oxygenation, primarily determined by oxygen delivery and saturation. Other variables contribute marginally.
4.3. pCO2
The MLP 11-28-1 model with a logistic activation function for the hidden and output layers best describes pCO2 in arterial blood. The correlation coefficient was 0.9261. The learning curve chart is presented in Figure 1c.
The sensitivity analysis for ANN indicated that Fshunt was the most significant factor (8.8687) influencing pCO2 in arterial blood (Table 3). Wagner et al. investigated whether the identification of pulmonary vascular obstruction is possible, when pneumonia is present at the same time [33]. In this study, the measurements of alveolar (exhaled) pO2 and pCO2, and arterial pO2 and pCO2 (from a blood sample) were collected. The values were converted to the physiological shunt and physiological dead space. The results in our study indicated and confirmed the impact of Fshunt on pCO2.
pO2/FiO2 is ranked in second place (4.5329) (Table 3). A low pO2/FiO2 indicates impaired gas exchange, which often correlates with changes in pCO2, since carbon dioxide elimination is closely linked to alveolar ventilation. cCl− is in third place (3.9112). Cl− levels are important for maintaining acid–base balance, which is closely linked to blood CO2 levels. Blood pH was ranked fourth (3.5341), which is strongly related to pCO2 because CO2 dissolved in plasma forms carbonic acid, affecting the blood’s acidity. The ANN analysis indicated cNa+ (2.2918) and FiO2 (2.1653) had a significant impact, as did cLac (1.6521). cLac is a critical parameter in emergencies. High cLac levels can indicate metabolic acidosis, which affects respiratory compensation and pCO2 levels. The remaining variables: sO2 (1.5504), pO2 (1.1285), ctHb (1.1140), cK+ (1.0577) have a lower but still significant influence on pCO2. cNa+ and cK+ concentrations relate to fluid balance and acid–base status. sO2, FiO2, pO2, and ctHb provide context on oxygen delivery and respiratory status, which may indirectly affect CO2 retention and elimination. The ANN sensitivity analysis shows that impaired lung function (high Fshunt, low pO2/FiO2) and acid–base balance parameters (cCl−, pH) are the primary drivers influencing pCO2 levels in the model. This aligns well with clinical physiology, where ventilation–perfusion (V/Q) mismatch and compensatory respiratory changes to acid–base disturbances govern arterial CO2. Secondary variables related to oxygenation and electrolytes modulate these effects to a lesser extent. All variables considered were significant for the model—the value of the factor exceeded 1.0000.
According to the correlation analysis, pCO2 is strongly influenced by pH. A negative correlation was observed (−0.489) (Table 2). The negative correlation was observed also for cCl−, pO2, sO2, pO2/FiO2, and cLac. A positive correlation was observed for Fshunt and FiO2. The decrease in cCl− resulting from an increase in pCO2 is caused by the chloride shift, which is one of the mechanisms of pH regulation [34]. The positive correlation between Fshunt and pCO2 is caused by the fact that as Fshunt increases, pCO2 also increases. The increased Fshunt can lead to hypoxic blood [16]. In our study, a positive correlation was observed between pCO2 and FiO2. It might be explained that in patients with chronic CO2 retention, the respiratory drive may rely more on hypoxia than hypercapnia. Administering high FiO2 reduces hypoxic drive, leading to hypoventilation and retention of CO2. It raises pCO2 levels. In addition, high FiO2 can reduce areas of hypoxic pulmonary vasoconstriction, increasing blood flow to poorly ventilated alveoli. It worsens V/Q mismatch and leads to increased CO2 retention. The positive correlation might also be explained by oxygen administration displacing CO2 from hemoglobin (the Haldane effect), increasing the amount of dissolved CO2 in the blood, and thus measuring pCO2 [35,36,37]. The normal blood pH is in the range of 7.35–7.45. Increased pCO2 (hypercapnia) means decreased alveolar ventilation and leads to respiratory acidosis (decreased pH), while decreased pCO2 (hypocapnia) leads to respiratory alkalosis (increased pH).
The results for LASSO regression indicated that the pH, cNa+, cCl−, cLac, and pO2/FiO2 are significant to the model (Table 4). The negative values of the coefficients for the following variables imply that higher values for blood pH (more alkalotic), cCl−, cLac (reflecting metabolic acidosis), pO2/FiO2 (better oxygenation) are associated with lower pCO2. Higher cNa+ is associated with higher pCO2 (positive correlation). The coefficients for pCO2 exhibit pronounced negative associations for pH, cCl−, and cLac, echoing the interplay between respiratory and metabolic compensation (Figure 3c). The coefficient shrinkage is less abrupt. It suggests a more distributed dependence on multiple acid–base parameters. However, it is still physiologically consistent.
4.4. cLac
The MLP 11-7-1 model with the hyperbolic tangent for both hidden and output layers best describes cLac. The correlation coefficient was 0.9327.
The sensitivity analysis conducted for the ANN indicated that the most significant factors that influence cLac are pH, pCO2, Fshunt, pO2/FiO2, FiO2, and cK+ (Table 3). The remaining variables were significant to the model. However, their impact was not as significant as in the case of the abovementioned ones. The strongest influence on cLac is blood pH (value 3.0156). This reflects the close physiological link between cLac levels and acid–base status. Elevated cLac often accompanies metabolic acidosis, and changes in pH affect cellular metabolism and lactate production. Lactate accumulation contributes to lowering pH, while acidosis may also impair lactate clearance. pCO2 (2.4469) influences cLac, likely through its effects on acid–base balance and tissue perfusion. Elevated pCO2 (respiratory acidosis) may exacerbate metabolic acidosis, affecting lactate metabolism. Conversely, lactate accumulation can stimulate hyperventilation, reducing pCO2 as a compensatory mechanism. cK+ is also significant (1.5499). It is closely tied to cellular metabolism and acid–base balance. Acidosis and increased lactate often lead to potassium shifts from intracellular to extracellular fluid, raising serum potassium levels. Thus, cK+ changes and lactate concentrations are physiologically interrelated. Fshunt (2.0705), pO2/FiO2 (1.8647), and FiO2 (1.8644) have a similar impact. Inspired oxygen fraction and shunt fraction relate to tissue oxygen delivery. Hypoxia or inadequate oxygenation (high shunt, low FiO2) promotes anaerobic metabolism and elevated lactate production. These variables reflect the respiratory and circulatory status that influence lactate generation. In the case of sO2 and pO2, oxygen saturation and oxygen partial pressure impact oxidative metabolism. Lower oxygen availability results in anaerobic glycolysis, increasing lactate production [38].
Correlation analysis of the cLac variable revealed that pH primarily influences it (Table 2). The correlation between these parameters was discussed earlier in the context of pH. Negative correlations were also observed between cLac and sO2, pCO2, and pO2/FiO2. According to a study by Bisarya et al. on 2062 patients, the correlation between cLac and sO2 was strong only in patients at or below the critical oxygen delivery threshold, and only 3% of patients met this criterion. In the general population, cLac is a poor predictor for sO2 [39]. For larger populations, these parameters do not correlate with each other.
The positive correlation with cLac was observed for cK+, Fshunt, FiO2, cCl−, and cNa+. In the case of lactic acidosis, there is an elevated cLac in the blood, resulting in a decrease in pH (metabolic acidosis). It causes the movement of K+ ions from cells into the extracellular space, resulting in hyperkalemia [40]. Toledo et al. noted a positive correlation between cLac concentration and cCl− [41]. Hyperchloremia and hyperlactemia contributed to metabolic acidosis. The study by Barker has shown that a high saline supply can cause hyperchloremia, leading to acidosis, which may favor higher cLac in states of perfusion disorders [26]. The positive correlation between cLac and Fshunt implies that increased Fshunt results in decreased oxygenation caused by the blood bypass of the alveolar oxygenation sites. That results in the increased anaerobic metabolism–lactate production. It causes the elevated cLac, which results from increased Fshunt [42]. The positive correlation between cNa+ and cLac may result from the administration of intravenous solutions containing both lactate and sodium. The increase in both patients’ parameters is more often related to severe metabolic disorders and treatment (sodium lactate-containing infusions) than to a direct, interdependent mechanism. cLac is most strongly influenced by parameters related to acid–base balance (pH, pCO2) and cellular electrolyte status (K+), reflecting metabolic disturbances typically present in anaerobic metabolism and tissue hypoxia. Additionally, variables related to oxygen delivery and respiratory function (FiO2, Fshunt, sO2, pO2) significantly affect lactate levels by modulating the balance between aerobic and anaerobic metabolism.
The LASSO regression indicated that the following variables were significant to the model: FiO2, pH, pCO2, sO2, cK+, and cNa+ (Table 4). The results of the LASSO regression imply that the growth in FiO2 is associated with a slight increase in cLac. It may reflect that patients requiring more oxygen have more severe metabolic disturbances. In cK+, hyperkalemia is associated with higher cLac, which is linked to the acute metabolic states (hyperkalemia in acidosis). In the case of cNa+, the coefficient is lower, which implies that higher sodium may accompany dehydration or electrolyte imbalances that accompany higher cLac. The negative correlation is observed in pH, which is physiologically consistent—higher pH (alkalosis) is associated with lower cLac. A strong negative correlation is observed for pCO2. In the case of sO2, negative correlation was also observed. It implied that higher sO2 relates to lower cLac. It is consistent with less hypoxia and better tissue perfusion. The cLac model stands out for complex coefficient dynamics and broad divergence from zero. Multiple variables, including FiO2, pH, pCO2, sO2, cK+, and cNa+, emerge as significant predictors, with both positive and negative associations. Coefficient paths traverse a wider range compared to the other parameters, denoting a multifactorial character and less dominance by a single predictor (Figure 3). This reflects the integrative nature of lactate as a marker of systemic metabolic stress, respiratory dysfunction, and electrolyte imbalance. The LASSO regression plot for cLac (Figure 3d) is visibly different from the other three (pH, pO2, pCO2) (Figure 3a–c) because the pattern of coefficient selection and shrinkage is distinct: multiple variables show strong negative or positive coefficients that diverge more rapidly as the L1 norm increases. The coefficients reach substantial values compared to the other parameters analyzed. This suggests that cLac may have a more complex, multifactorial relationship with the predictors in the model, resulting in more prominent regularization effects and variable selections. This pattern may reflect underlying clinical realities: blood lactate levels are influenced by diverse metabolic, respiratory, and circulatory processes, often making it more difficult to model sparsely with LASSO, whereas pH, pO2, and pCO2 can sometimes be predicted with fewer key variables due to their dominant physiological mechanisms.
4.5. Clinical Impact
The application of ANN and LASSO regression in this study offers significant enhancement in the decision-making process. ANNs can model complex nonlinear relationships that are attributed to the clinical data. The properly trained models may accurately predict the outcome based on the provided data. This capacity allows for the earlier identification of physiological abnormalities and more precise monitoring of the patient’s state of health. They help to stratify the risk and mitigate possible complications. In the study by Gray et al., the prediction of patients at low risk of critical postoperative adverse events can be made based on an individual level due to the application of machine learning models [43]. It results in support for the clinical decision-making process.
LASSO regression, by employing regularization to penalize less relevant features, effectively reduces model complexity and multicollinearity. It is useful in selecting the most pertinent clinical variables. It facilitates the generation of simpler and more interpretable models that highlight the key determinants impacting patient parameters. Clinicians benefit from clearer insights into critical physiological factors. It may streamline diagnostic evaluation and optimize treatment strategies [44]. The integration of such techniques with patients’ treatment aligns with the emerging shift towards precision medicine, where timely, data-driven decisions can significantly improve the outcomes of therapy.
4.6. Challenges and Limitations
ANNs demonstrated their potential in modeling complex physiological relationships. They provide accurate predictions and practical insights into patient monitoring and therapeutic management in pediatric intensive care [43,45]. LASSO regression complements ANN by enabling robust feature selection, improving model interpretability, and directing clinical attention to key variables that influence arterial blood gas parameters.
However, translating such models into routine clinical use is challenging. A main limitation is that the model must be thoroughly clinically validated in diverse patient populations. It is essential for ensuring generalizability, reducing bias, and confirming clinical utility before widespread adoption [46]. The integration of such models requires real-time data acquisition and processing capabilities. It demands robust electronic health record systems and interoperability infrastructures. That might be a potential obstacle because many healthcare environments lack such an infrastructure [47].
The other very important issues are ethical and operational challenges. They include maintaining patient privacy, ensuring the explainability of the generated ANN models, and ensuring trust and acceptance by physicians by providing understandable risk assessments and recommendations [48]. Furthermore, continuous monitoring and updating the model is crucial to adapt it to changing clinical practices and patient populations, while preventing model degradation over time.
Overall, although ANN and LASSO provide an effective framework for improving clinical decision support, their successful implementation requires interdisciplinary collaboration between researchers, data scientists, IT specialists, and regulators to overcome these barriers and fully realize their potential to improve patient care.
4.7. Biological Testing
Biological testing was performed using ANN to model the following acid–base balance parameters—pH, pO2, pCO2, and cLac—based on arterial blood data. For each parameter, multiple relevant physiological and biochemical variables were included as inputs to MLP models. The network architectures, activation functions, and training epochs were optimized to achieve high predictive accuracy, evidenced by correlation coefficients typically exceeding 0.92 in for testing phase.
The ANN models demonstrated strong correlations between observed and predicted values, confirming their robustness. Variable importance analysis revealed physiologically plausible influences: cCl− and pCO2 most strongly affected pH; pO2/FiO2 ratio was the main determinant of pO2; Fshunt fraction had the greatest impact on pCO2; and pH was the dominant factor influencing cLac. The applied biological testing highlights the capability of ANN to capture complex nonlinear interactions among acid–base parameters, providing a valuable tool for clinical data interpretation and supporting precision monitoring in critical care. These findings confirm that the ANN models not only perform well statistically but also respect the physiological constraints inherent to arterial blood gas analysis. The biological testing phase demonstrates that the neural network captures meaningful biomedical patterns rather than relying solely on mathematical correlations, supporting its potential for clinical application and decision support.
5. Conclusions
Machine learning techniques are useful in creating the models that indicate the factors influencing the ventilation parameters. The ANN and LASSO regression indicated the most significant factors influencing pH, pCO2, pO2, and cLac. The created ANN models were well-trained and avoided overfitting. The correlation coefficients exceeded the value of 0.92. In the case of LASSO regression, it excluded the insignificant values and indicated that the most significant variables for pH were pCO2, cCl−. In the case of pO2, it was FiO2 and pO2/FiO2. In the case of cLac, it was pCO2 and pH. Similar factors were pointed out in the sensitivity analysis conducted for ANN. For pCO2, it was pH, cNa+, and cCl−. The ANN indicated Fshunt and pO2/FiO2 as the most significant. The difference may be the result of the characteristics of the model. ANN is based on the nonlinear model, contrary to LASSO regression, which is linear and eliminates the non-significant variables. Variables with higher sensitivity values in the ANN are more critical contributors to the analyzed parameters and should be prioritized when interpreting acid–base status or in clinical monitoring. Lower-ranked variables might represent indirect or modulatory effects on pH and may be less impactful independently but still relevant in a combined physiological context. LASSO regression indicated that pH and pCO2 models are dominated by their reciprocal acid–base predictors. In the case of pO2, it is strongly influenced by oxygen saturation and delivery metrics. cLac is predicted by a broad spectrum of interacting variables, illustrating its clinical complexity.
In recent years, more and more papers have been published indicating the potential application of machine learning techniques in medicine. Geng et al. described the potential use of ANNs in predicting the occurrence of hypoxemia during sedation, based on the patient’s BMI, snoring, and neck circumference [49]. Radhakrishnan et al. [4] developed the model using an MLP to predict ventilation parameters. According to the study of Vaghefi et al. [10], the promising tool for analysis are the multidimensional neural maps. They enhance prediction performance due to their capability to represent complex, high-dimensional data structures visually and cluster data effectively. Incorporating such networks could improve feature extraction and dimensionality reduction prior to regression modeling, or act as standalone predictive models.
The applied techniques in the study such as ANNs and LASSO regression offer complementary advantages for clinical data analysis. LASSO regression simplifies models by selecting only the most important variables. It enhances interpretability and reduces overfitting. ANNs provide powerful nonlinear modeling and sensitivity analysis that reveal priorities among clinical parameters and help to exclude the not significant ones. Together, they offer a robust framework combining high predictive performance with transparent information on variable importance.
For clinicians, it implies a better ability to quickly identify critical factors affecting ventilation parameters such as pH, pCO2, pO2, and cLac. High-sensitivity variables indicated by ANN should be prioritized clinically. LASSO’s variable selection helps exclude less relevant factors. This integrated approach supports faster, more reliable decision-making and increases understanding of complex physiology of acid–base balance and respiratory system, ultimately facilitating patient monitoring and therapy optimization. Machine learning thus has potential to transform clinical practice by efficiently analyzing large datasets and revealing key physiological insights.
The analyses conducted using machine learning techniques demonstrate the feasibility of using regression models to analyze the influence of individual factors on the values of arterial and venous blood gas parameters. Combining LASSO with ANN provides a robust framework that leverages the high predictive power of ANN while preserving model simplicity and offering insight into variable importance through regularization. They allow us to analyze the degree of influence of individual independent variables on dependent variables and to determine whether it is significant. Neural networks and LASSO regression allow the prediction of events based on the data provided. Machine learning techniques are useful in analysis of a large amount of information. They can help to estimate the impact of individual variables, which can improve clinical decision-making, and it allows for a significant shortening of time needed to study and understand pathophysiology.
Author Contributions
Conceptualization, A.C. and A.B.-Ś.; methodology, A.C.; software, M.D., A.C., T.P. and A.O.; validation, A.C., A.B.-Ś. and M.D.; formal analysis, A.C. investigation, A.C., A.B.-Ś., M.D., K.P., A.W. and J.R.-K.; resources, A.B.-Ś. and A.C.; data curation, A.C. and M.D.; writing—original draft preparation, A.C.; writing—review and editing, A.B.-Ś., A.C. and K.P.; visualization, A.C. and M.D.; supervision, A.C.; project administration, A.C.; funding acquisition, A.C. All authors have read and agreed to the published version of the manuscript.
Funding
This research received no external funding.
Institutional Review Board Statement
Not applicable.
Informed Consent Statement
Patient consent was waived due to the fact that it was retrospective study based on patient’s records. The data were anonymized. According to the statement of the Local Ethic Committee, for this kind of studies the consent was not obligatory.
Data Availability Statement
The original contributions presented in this study are included in the article. Further inquiries can be directed to the corresponding author.
Conflicts of Interest
The authors declare no conflicts of interest.
Abbreviations
The following abbreviations are used in this manuscript:
| ANN | Artificial Neural Network |
| ARDS | Acute respiratory distress syndrome |
| cCl− | Chloride concentration |
| cK+ | Concentration of potassium |
| ctHb | Total concentration of hemoglobin |
| cLac | Concentration of lactate |
| cNa+ | Sodium concentration |
| FiO2 | Fraction of inspired oxygen |
| Fshunt | Fraction of the measured transpulmonary shunt |
| Hb | Hemoglobin |
| LASSO | Least Absolute Shrinkage and Selection Operator |
| MLP | Multilayer Perceptron |
| pCO2 | Partial pressure of CO2 |
| PEEP | Positive end-expiratory pressure |
| pO2 | Partial pressure of O2 |
| sO2 | Saturation |
References
- Severinghaus, J.W. The Invention and Development of Blood Gas Analysis Apparatus. Anesthesiology 2002, 97, 253–256. [Google Scholar] [CrossRef] [PubMed]
- Achanti, A.; Szerlip, H.M. Acid-Base Disorders in the Critically Ill Patient. Clin. J. Am. Soc. Nephrol. 2023, 18, 102–112. [Google Scholar] [CrossRef] [PubMed]
- Al-Jaghbeer, M.; Kellum, J.A. Acid-Base Disturbances in Intensive Care Patients: Etiology, Pathophysiology and Treatment. Nephrol. Dial. Transplant. 2015, 30, 1104–1111. [Google Scholar] [CrossRef]
- Radhakrishnan, S.; Nair, S.G.; Isaac, J. Multilayer Perceptron Neural Network Model Development for Mechanical Ventilator Parameters Prediction by Real Time System Learning. Biomed. Signal Process. Control 2022, 71, 103170. [Google Scholar] [CrossRef]
- Stewart, P.A. Modern Quantitative Acid-Base Chemistry. Can. J. Physiol. Pharmacol. 1983, 61, 1444–1461. [Google Scholar] [CrossRef]
- Esteva, A.; Robicquet, A.; Ramsundar, B.; Kuleshov, V.; DePristo, M.; Chou, K.; Cui, C.; Corrado, G.; Thrun, S.; Dean, J. A Guide to Deep Learning in Healthcare. Nat. Med. 2019, 25, 24–29. [Google Scholar] [CrossRef]
- Sznek, B.; Stasiak, A.; Czyrski, A. Design of Experiments and Artificial Neural Networks as Useful Tools in the Optimization of Analytical Procedure. Polim. Med. 2024, 54, 113–116. [Google Scholar] [CrossRef]
- Nowak, D. Study Designs in Medical Research and Their Key Characteristics. J. Med. Sci. 2024, 92, e928. [Google Scholar] [CrossRef]
- Ozdemir, H.; Sasmaz, M.I.; Guven, R.; Avci, A. Interpretation of Acid-Base Metabolism on Arterial Blood Gas Samples via Machine Learning Algorithms. Ir. J. Med. Sci. 2025, 194, 277–287. [Google Scholar] [CrossRef]
- Monir Vaghefi, S.Y.; Safi-Esfahani, F.; Fekri-Ershad, S.; Monir Vaghefi, S.M. From One-Dimensional to Multidimensional Map Neural Networks. Appl. Soft Comput. 2024, 167, 112457. [Google Scholar] [CrossRef]
- Imai, S.; Takekuma, Y.; Kashiwagi, H.; Miyai, T.; Kobayashi, M.; Iseki, K.; Sugawara, M. Validation of the Usefulness of Artificial Neural Networks for Risk Prediction of Adverse Drug Reactions Used for Individual Patients in Clinical Practice. PLoS ONE 2020, 15, e0236789. [Google Scholar] [CrossRef]
- Gucyetmez, B.; Gucyetmez, K.; Sarikaya, Z.T.; Telci, L. Independent Variables of pH: Ten Knights of the Hydrogen Ion Kingdom-Part I. A Prospective Observational Study. PLoS ONE 2024, 19, e0306756. [Google Scholar] [CrossRef] [PubMed]
- Szrama, J.; Smuszkiewicz, P. An Acid-Base Disorders Analysis with the Use of the Stewart Approach in Patients with Sepsis Treated in an Intensive Care Unit. Anaesthesiol. Intensive Ther. 2016, 48, 180–184. [Google Scholar] [CrossRef][Green Version]
- Mrozik, L.T.; Yung, M. Hyperchloraemic Metabolic Acidosis Slows Recovery in Children with Diabetic Ketoacidosis: A Retrospective Audit. Aust. Crit. Care 2009, 22, 172–177. [Google Scholar] [CrossRef]
- Seheult, J.; Fitzpatrick, G.; Boran, G. Lactic Acidosis: An Update. Clin. Chem. Lab. Med. 2017, 55, 322–333. [Google Scholar] [CrossRef] [PubMed]
- Seeger, C.; Higgins, C. Acute Care Testing Handbook; Radiometer MedicaL ApS: Copenhagen, Denmark, 2014. [Google Scholar]
- Binks, A. Arterial PCO2 and pH; Virginia Tech: Blacksburg, VA, USA, 2022. [Google Scholar]
- 9.3: Acid-Base Balance. Available online: https://chem.libretexts.org/Courses/Roosevelt_University/General_Organic_and_Biochemistry_with_Problems_Case_Studies_and_Activities/09%3A_Acids_and_Bases/9.03%3A_Acid-Base_Balance (accessed on 17 July 2025).
- Lechner, A.J. Alveolar O2 and CO2 Exchange, Physiological Shunt, and Acid-Base Balance. In Respiratory: An Integrated Approach to Disease; Lechner, A.J., Matuschak, G.M., Brink, D.S., Eds.; McGraw-Hill Education: New York, NY, USA, 2012. [Google Scholar]
- Lango, R.; Szkulmowski, Z.; Maciejewski, D.; Sosnowski, A.; Kusza, K. Revised Protocol of Extracorporeal Membrane Oxygenation (ECMO) Therapy in Severe ARDS. Recommendations of the Veno-Venous ECMO Expert Panel Appointed in February 2016 by the National Consultant on Anesthesiology and Intensive Care. Anaesthesiol. Intensive Ther. 2017, 49, 92–104. [Google Scholar] [CrossRef]
- Benner, A.; Patel, A.K.; Singh, K.; Dua, A. Physiology, Bohr Effect. In StatPearls; StatPearls Publishing: Treasure Island, FL, USA, 2025. [Google Scholar]
- Dhondup, T.; Qian, Q. Acid-Base and Electrolyte Disorders in Patients with and without Chronic Kidney Disease: An Update. Kidney Dis. 2017, 3, 136–148. [Google Scholar] [CrossRef]
- Lindner, G.; Schwarz, C.; Grüssing, H.; Kneidinger, N.; Fazekas, A.; Funk, G.-C. Rising Serum Sodium Levels Are Associated with a Concurrent Development of Metabolic Alkalosis in Critically Ill Patients. Intensive Care Med. 2013, 39, 399–405. [Google Scholar] [CrossRef]
- Choo, S.J.; Lee, H.G.; Kim, C.J.; Yang, E.M. Severe Hypernatremia in Soft Drink Ketoacidosis and Hyperglycemic Hyperosmolar State at the Onset of Type 2 Diabetes Mellitus: A Case Series of Three Adolescents. Clin. Pediatr. Endocrinol. 2022, 31, 81–86. [Google Scholar] [CrossRef]
- Nozawa, H.; Tsuboi, N.; Nariai, R.; Nishimura, N.; Nakagawa, S. Effect of Sodium-Chloride Ion Difference on pH Regulation. Clin. Biochem. 2021, 96, 75–77. [Google Scholar] [CrossRef] [PubMed]
- Barker, M.E. 0.9% Saline Induced Hyperchloremic Acidosis. J. Trauma Nurs. 2015, 22, 111–116. [Google Scholar] [CrossRef]
- Harris, A.N.; Grimm, P.R.; Lee, H.-W.; Delpire, E.; Fang, L.; Verlander, J.W.; Welling, P.A.; Weiner, I.D. Mechanism of Hyperkalemia-Induced Metabolic Acidosis. J. Am. Soc. Nephrol. 2018, 29, 1411–1425. [Google Scholar] [CrossRef]
- Villar, J.; Fernández, C.; González-Martín, J.M.; Ferrando, C.; Añón, J.M.; del Saz-Ortíz, A.M.; Díaz-Lamas, A.; Bueno-González, A.; Fernández, L.; Domínguez-Berrot, A.M.; et al. Respiratory Subsets in Patients with Moderate to Severe Acute Respiratory Distress Syndrome for Early Prediction of Death. J. Clin. Med. 2022, 11, 5724. [Google Scholar] [CrossRef]
- Principles and Practice of Mechanical Ventilation, 3e. Access Medicine. McGraw Hill Medical. Available online: https://accessmedicine.mhmedical.com/book.aspx?bookid=520 (accessed on 17 July 2025).
- DesPrez, K.; McNeil, J.B.; Wang, C.; Bastarache, J.A.; Shaver, C.M.; Ware, L.B. Oxygenation Saturation Index Predicts Clinical Outcomes in ARDS. Chest 2017, 152, 1151–1158. [Google Scholar] [CrossRef] [PubMed]
- Mayor, N.; Knights, H.; Kotwica, A.; Coppola, A.S.J.; Hunter, H.; Jeffreys, N.; Morgan, A.; Gupta, S.; Prentice, J.; Macfarlane, R.; et al. Intrapulmonary Shunting Is a Key Contributor to Hypoxia in COVID-19: An Update on the Pathophysiology. PLoS ONE 2022, 17, e0273402. [Google Scholar] [CrossRef] [PubMed]
- Sarkar, M.; Niranjan, N.; Banyal, P. Mechanisms of Hypoxemia. Lung India 2017, 34, 47–60. [Google Scholar] [CrossRef] [PubMed]
- Wagner, P.D.; Malhotra, A.; Prisk, G.K. Using Pulmonary Gas Exchange to Estimate Shunt and Deadspace in Lung Disease: Theoretical Approach and Practical Basis. J. Appl. Physiol. 2022, 132, 1104–1113. [Google Scholar] [CrossRef]
- Doyle, J.; Cooper, J.S. Physiology, Carbon Dioxide Transport. In StatPearls; StatPearls Publishing: Treasure Island, FL, USA, 2025. [Google Scholar]
- Savi, A.; Gasparetto Maccari, J.; Frederico Tonietto, T.; Peçanha Antonio, A.C.; Pinheiro de Oliveira, R.; de Mello Rieder, M.; Zignani, E.C.; Boschi da Silva, É.; Teixeira, C. Influence of FIO2 on PaCO2 during Noninvasive Ventilation in Patients with COPD. Respir. Care 2014, 59, 383–387. [Google Scholar] [CrossRef]
- Teboul, J.-L.; Scheeren, T. Understanding the Haldane Effect. Intensive Care Med. 2017, 43, 91–93. [Google Scholar] [CrossRef]
- Fuentes, S.; Chowdhury, Y.S. Fraction of Inspired Oxygen. In StatPearls; StatPearls Publishing: Treasure Island, FL, USA, 2025. [Google Scholar]
- Cabrera, M.E.; Saidel, G.M.; Kalhan, S.C. Role of O2 in Regulation of Lactate Dynamics during Hypoxia: Mathematical Model and Analysis. Ann. Biomed. Eng. 1998, 26, 1–27. [Google Scholar] [CrossRef]
- Bisarya, R.; Shaath, D.; Pirzad, A.; Satterwhite, L.; He, J.; Simpson, S.Q. Serum Lactate Poorly Predicts Central Venous Oxygen Saturation in Critically Ill Patients: A Retrospective Cohort Study. J. Intensive Care 2019, 7, 47. [Google Scholar] [CrossRef]
- Adrogué, H.J.; Madias, N.E. Management of Life-Threatening Acid-Base Disorders. Second of Two Parts. N. Engl. J. Med. 1998, 338, 107–111. [Google Scholar] [CrossRef]
- Maciel, A.T.; Park, M. Unmeasured Anions Account for Most of the Metabolic Acidosis in Patients with Hyperlactemia. Clinics 2007, 62, 55–62. [Google Scholar] [CrossRef] [PubMed][Green Version]
- Homilius, C.; Seefeldt, J.M.; Hansen, J.; Nielsen, R.; de Paoli, F.V.; Boedtkjer, E. Lactate Orchestrates Metabolic Hemodynamic Adaptations through a Unique Combination of Venocontraction, Artery Relaxation, and Positive Inotropy. Acta Physiol. 2025, 241, e70037. [Google Scholar] [CrossRef] [PubMed]
- Gray, G.M.; Ahumada, L.M.; Rehman, M.A.; Varughese, A.; Fernandez, A.M.; Fackler, J.; Yates, H.M.; Habre, W.; Disma, N.; Lonsdale, H. A Machine-Learning Approach for Decision Support and Risk Stratification of Pediatric Perioperative Patients Based on the APRICOT Dataset. Paediatr. Anaesth. 2023, 33, 710–719. [Google Scholar] [CrossRef] [PubMed]
- Guo, Y.; Li, L.; Zheng, K.; Du, J.; Nie, J.; Wang, Z.; Hao, Z. Development and Validation of a Survival Prediction Model for Patients with Advanced Non-Small Cell Lung Cancer Based on LASSO Regression. Front. Immunol. 2024, 15, 1431150. [Google Scholar] [CrossRef]
- Antel, R.; Sahlas, E.; Gore, G.; Ingelmo, P. Use of Artificial Intelligence in Paediatric Anaesthesia: A Systematic Review. BJA Open 2023, 5, 100125. [Google Scholar] [CrossRef]
- Mehraeen, E.; Siami, H.; Montazeryan, S.; Molavi, R.; Feyzabadi, A.; Parvizy, I.; Masjedlu, Z.A.; Dehkalani, M.N.; Mahmoudi, S.; Ahmadipour, A. Artificial Intelligence Challenges in the Healthcare Industry: A Systematic Review of Recent Evidence. Healthc. Technol. Lett. 2025, 12, e70017. [Google Scholar] [CrossRef]
- Doyen, S.; Dadario, N.B. 12 Plagues of AI in Healthcare: A Practical Guide to Current Issues with Using Machine Learning in a Medical Context. Front. Digit. Health 2022, 4, 765406. [Google Scholar] [CrossRef]
- Ethical Considerations and Robustness of Artificial Neural Networks in Medical Image Analysis under Data Corruption. Scientific Reports. Available online: https://www.nature.com/articles/s41598-025-15268-2 (accessed on 21 November 2025).
- Geng, W.; Tang, H.; Sharma, A.; Zhao, Y.; Yan, Y.; Hong, W. An Artificial Neural Network Model for Prediction of Hypoxemia During Sedation for Gastrointestinal Endoscopy. J. Int. Med. Res. 2019, 47, 2097–2103. [Google Scholar] [CrossRef]
Disclaimer/Publisher’s Note: The statements, opinions and data contained in all publications are solely those of the individual author(s) and contributor(s) and not of MDPI and/or the editor(s). MDPI and/or the editor(s) disclaim responsibility for any injury to people or property resulting from any ideas, methods, instructions or products referred to in the content. |
© 2025 by the authors. Licensee MDPI, Basel, Switzerland. This article is an open access article distributed under the terms and conditions of the Creative Commons Attribution (CC BY) license (https://creativecommons.org/licenses/by/4.0/).