Abstract
Clinical differentiation between gout, osteoarthritis (OA), and calcium pyrophosphate deposition disease (CPPD) remains a hurdle in daily practice without imaging or arthrocentesis. We performed a retrospective analysis of consecutive patients with gout, CPPD, and OA at a tertiary rheumatology center. A total of 277 patients were enrolled, with 164 suffering from gout, 76 from CPPD, and 37 from OA. We used ANOVA and conditional inference tree analysis (Ctrees) to find associations between clinical, laboratory, and imaging data and gout, OA, and CPPD. The sonographic double contour sign was unable to differentiate gout from CPPD. Ctrees were able to exclude OA and CPPD as possible differentials based on elevated uric acid, C-reactive protein (CRP), presence of arterial hypertension, and sex, diagnosing gout with a sensitivity and specificity of 95.1% and 41.6%, respectively. Elevated CRP was observed using simple linear regressions in patients with type II diabetes, higher cumulative joint scores, increased number of affected joints, as well as elevated uric acid, erythrocyte sedimentation rate, and leukocyte count. Ctrees were able to differentiate gout, OA, and CPPD based on just four characteristics. Inflammatory response correlated with type II diabetes, more or larger joint involvement, and elevated uric acid levels.
1. Introduction
The differentiation between inflammatory osteoarthritis (OA), the most common type of arthropathy, and gout, the most prevalent crystal arthropathy, is often difficult in daily clinical practice without laboratory tests, imaging, or arthrocentesis [1]. To further complicate matters, calcium pyrophosphate deposition disease (CPPD) can manifest with similar symptoms and an overlapping joint pattern.
Osteoarthritis is commonly defined as a heterogeneous group of conditions that lead to arthralgia [2]. Diagnostic criteria are divided into clinically defined OA and radiographically defined OA. Clinical diagnostic criteria are based on symptoms and signs on physical examination, while radiographically defined OA relies on the Kellgren–Lawrence scale [3]. This scale classifies OA according to formation of osteophytes, periarticular ossicles, narrowing of joint space associated with sclerosis of subchondral bone, small pseudocystic areas with sclerotic walls, and altered shape of bone ends [4]. Ultrasound allows the detection of a wide spectrum of pathologic findings indicative of OA, involving articular cartilage, bony cortex, and synovial tissue [5].
The etiology of gout is poorly understood. Simplified, the phagocytosis of monosodium urate crystals by leukocytes in joints and soft tissues results in an inflammatory cascade [6]. Acute attacks may then be provoked by specific triggers, such as excessive alcohol or meat consumption.
CPPD is thought to occur when an imbalance in inorganic pyrophosphate production and pyrophosphatase leads to saturation and precipitation of CPP crystals near the surface of cartilage [7,8]. If these precipitated crystals do not cause any symptoms but are visualized, for example, on radiographs, they are termed as chondrocalcinosis. CPPD was agreed as an umbrella term reserved for acute arthritis caused by CPP crystals, OA with CPPD, and chronic CPP crystal arthritis by the European League Against Rheumatism (EULAR), but the terminology still remains inconsistent across studies [9].
The diagnostic reference standard for gout and CPPD remains arthrocentesis with subsequent crystal visualization under compensated polarized light microscopy as well as leukocyte cell count of the aspirate [6], while radiographs and clinical examination remain the reference standard for diagnosing OA [10]. Musculoskeletal ultrasound can aid in diagnosis of all three diseases via validated findings such as the double contour (DC) sign, aggregates or tophi and erosions in gout, intracartilaginous hyperechogenicities (iHE) in CPPD, and osteophytes in OA as disease hallmarks [5,9,11,12,13].
This study retrospectively analyzed clinical, ultrasound, and laboratory parameters of 277 consecutive patients suffering from gout (n = 164), OA (n = 37), or CPPD (n = 76). The goal of this study was to elucidate reliable prognostic biomarkers for any of the three arthropathies, which could aid in their differentiation when imaging or arthrocentesis are unavailable or outstanding. Secondary goals included observation of the inflammatory response based on C-reactive protein (CRP) in relation to other biomarkers.
2. Materials and Methods
2.1. Patients
All consecutive patients presenting with acute arthralgia of any joint and a diagnosis of gout, CPPD, or OA who sought treatment at the Department of Rheumatology at the Hospital Ludwigshafen, Ludwigshafen, Germany, between 2014 and 2017 were included in this retrospective study. Patients diagnosed with more than one arthropathy were excluded from the final analysis. Analysis included routine laboratory values such as serum concentrations of ferritin, CRP, erythrocyte sedimentation rate (ESR), and serum uric acid. Patients must have had undergone routinely performed ultrasound of the affected joint with assessment regarding the degree of vascularization (DoV), the DC sign, and the iHE sign as defined below. In case of oligoarthritis, all joints underwent sonography but only the most painful joints were aspirated. Each patient must have also had routine arthrocentesis performed with subsequent compensated polarized light microscopy of the most affected joints and, if possible, leukocyte cell count of the joint aspirate. Additional patient characteristics such as sex, age, weight, height, body mass index (BMI), diabetic status, arterial hypertension, renal function, cumulative joint score, and number of affected joints were extracted. Current patient medication was not considered unless it was specific to gout, OA, or CPPD.
Patients were classified as hypertensive or diabetic if the condition had already been documented in previous medical reports. Renal status was classified according to the Kidney Disease Improving Global Outcome (K-DIGO) guidelines into stages of kidney disease based on the glomerular filtration rate (GFR) measured by the chronic kidney disease epidemiology collaboration (CKD-EPI) formula: 1 = GFR >90 mL/min, 2 = GFR 89–60 mL/min, 3 = GFR 59–30 mL/min, 4 = GFR 29–15 mL/min, and 5 = GFR <15 mL/min [14]. The cumulative joint score is an internally developed method to objectively quantify joint involvement and adjust for joint size. All affected joints were rated on a point system of 1 to 3 for each affected joint. One point was assigned to small joints such as the finger and toe joints. Two points were for middle-sized joints such as the ankle, elbow, or wrist. Three points were for large joints such as the hip, shoulder, or knee. A summary of the system used is presented in Table 1. For the number of affected joints, all affected joints, regardless of size, were added together and weighted equally.

Table 1.
Cumulative joint score classification.
2.2. Ultrasound Examination
Musculoskeletal ultrasound examinations were performed by a board-certified musculoskeletal ultrasonographer with German Society for Ultrasound in Medicine (DEGUM) level III (highest level instructor) certification at the Clinic for Internal Medicine, Hematology, Nephrology, Infectiology and Rheumatology, Klinikum Ludwigshafen, Ludwigshafen, Germany, using an Aplio 400 Toshiba (Canon Medical Systems GmbH, Neuss, Germany) machine with linear or hockey stick transducers (5–14 MHz). Ultrasound examinations assessed for the DC sign and DoV as well as noted the presence of an iHE sign. The DC sign was defined as hyperechoic bands adjacent to hyaline cartilage (Figure 1A) [15]. If these hyperechoic signals could be confidently placed inside the cartilage and not on a tangent with it, they were termed as the iHE sign (Figure 1B), an ultrasound finding previously described as specific for CPPD [16]. Figure 1 further clarifies the differentiation between the DC sign and the iHE sign. DoV was graded on a 0–3 scale with 0 having no Doppler signal, grade 1 demonstrating three or less isolated Doppler signals, grade 2 demonstrating three or more distinct Doppler signals, and grade 3 demonstrating multiple converging Doppler signals [17]. Ultrasound was performed prior to arthrocentesis; thus, the examiner was blinded to the final diagnosis.
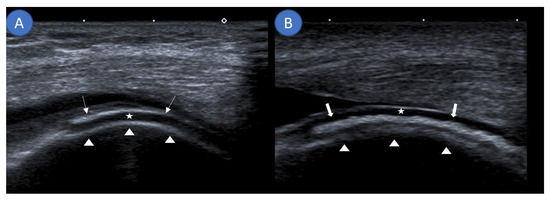
Figure 1.
Differentiating the double contour sign from an intracartilaginous hyperechogenicity. (A) Sagittal ultrasound demonstrating monosodium urate deposits (arrows) as a hyperechoic band running parallel to the echo-free hyaline cartilage (star) at the suprapatellar knee joint. Together with the hyperechoic margin created by the femur (arrow heads), this forms the double contour sign. (B) Sagittal ultrasound along the lateral femoral condyle showing an intracartilaginous hyperechogenicity (thick arrows) visualizing calcium pyrophosphate deposits consistent with the intracartilaginous hyperechogenicity sign.
2.3. Arthrocentesis
Only patients who underwent the reference standard of arthrocentesis with compensated polarized light microscopy were included in the final review. Microscopy was performed by a board-certified rheumatologist. Negatively birefringent needle-shaped crystals were classified as gout and positively birefringent rhomboid-shaped crystals as CPPD. If no crystals were visualized, diagnostic criteria for OA, such as the presence of osteophytes on ultrasound, were checked. Osteoarthritis was diagnosed based on ultrasound, arthrocentesis, and clinical presentation. A low leukocyte count in the joint aspirate (<0.2–2 cells/nL) with a majority lymphocyte/monocyte cell differentiation was indicative of OA [18]. Radiographs were not obtained.
2.4. Laboratory Parameters
Routinely determined laboratory parameters were used in the statistical analysis (laboratory-specific normal values in brackets): ferritin (40–300 ng/mL), uric acid (<7.0 mg/dL), ESR (3–8 mm/h), CRP (<5 mg/L), and leukocyte cell count of the aspirate (3.5–9.8 cells/nL).
2.5. Statistical Analysis
Analysis was performed using the R software environment (version 4.0.2; R Core Team, Vienna, Austria) by a trained statistician (C.B.) [19]. Continuous variables are described as mean and standard deviation and as median and interquartile range (IQR) where normality could not be assumed. Categorical variables are presented as absolute and relative frequencies. Unifactorial two-tailed analyses of variance (ANOVAs) were carried out for continuous variables with Scheffe’s post-hoc test. When normality could not be assumed, data was analyzed using the Mann–Whitney U test. Categorical data was analyzed using the chi-square test. The p-values are reported as part of descriptive analyses. Simple linear regression analyses were performed regarding age, sex, BMI, renal status, arterial hypertension, cumulative joint score, total number of affected joints, DC sign, iHE sign, DoV, serum uric acid concentrations, ESR, ferritin, and leukocyte cell count compared to the x-axis of CRP. Simple linear regressions were performed as complete case analyses. Additionally, conditional inference trees (Ctrees) were used to examine classification rules for gout, OA, and CPPD. This analysis recursively partitions the dataset to form subgroups that are as distinct as possible from each other. To partition the dataset, the cut-off value of an independent variable that provides the best partitioning is chosen. The procedure is repeated until no association with the outcome can be found in a permutation test at a given significance level of alpha = 0.05 [20]. The outcome was set to the diagnosis (OA, CPPD, or gout), confirmed via the respective reference standard. The independent variables included were sex, diabetic status, hypertension status, renal status, BMI, cumulative joint score, number of affected joints, DoV, DC sign, ferritin, uric acid, CRP, and leukocyte count. In case of missing data, the patient was counted to the right side of the splitting criterion. All relevant data is available within the manuscript.
3. Results
3.1. Patient Characteristics
In total, 164 patients suffering from gout, 37 from OA, and 76 from CPPD were included into our study. Patient demographics are summarized in Table 2. Distribution of the affected joints is visualized in Figure 2.
Table 2.
Patient characteristics.
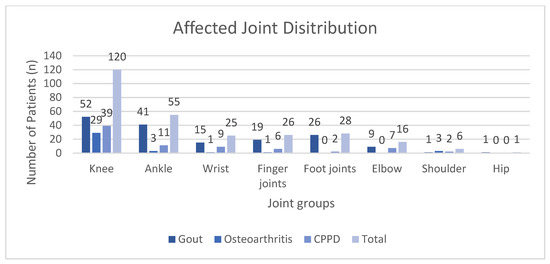
Figure 2.
Distribution of the affected joints for each diagnosis grouped by joint categories. CPPD: calcium pyrophosphate deposition disease.
3.2. Differentiation between Gout, CPPD, and OA by Biomarkers
Overall, 164 cases of gout (59.2%), 37 cases of OA (13.4%), and 76 cases of CPPD (27.4%) were included for analysis. Males comprised roughly 66% of patients, with as high as 76% in the gout group. The mean age of the OA group (64.5 years ± 17.3) was statistically significantly lower than that of the CPPD group (73.1 years ± 11.0), with Scheffe’s post-hoc p-value of 0.003. Approximately 43% of all analyzed joints were knees. Table 3 summarizes the results of the comparative statistical analysis.
Table 3.
Results of comparative statistical analysis of commonly derived clinical, laboratory, and imaging characteristics.
Ctree analysis (Figure 3) was performed to further analyze the biomarkers and split the 277 patients according to their final diagnosis. When using Ctrees for prediction, each patient is assigned to the most frequent diagnosis in the respective end node (leaf). For this study population, a classification based on the conditional inference tree led to a sensitivity of 45.95% and specificity of 97.5% for OA, sensitivity of 26.32% and specificity of 94.03% for CPPD, and sensitivity of 95.12% and specificity of 41.59% for gout. Ctree sensitivity, specificity, positive predictive value, and negative predictive value are summarized in Table 4.
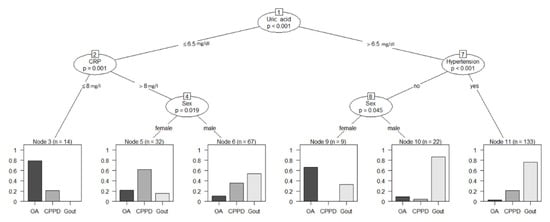
Figure 3.
Conditional inference tree analysis for the classification of diagnoses based on clinical biomarkers. Reliable diagnostic predictions were possible using just the four biomarkers (uric acid, CRP, arterial hypertension, and sex) to differentiate gout (sensitivity 95.1%, specificity 41.6%), CPPD (sensitivity 26.3%, specificity 94.0%), and OA (sensitivity 46.0%, specificity 97.5%) in our patient population. Numbers above biomarkers represent node numbers. CRP: C-reactive protein; OA: osteoarthritis; CPPD: calcium pyrophosphate deposition disease.
Table 4.
Diagnostic performance of conditional inference tree analysis.
3.3. Association of Biomarkers with an Increased Inflammatory Response
Simple linear regressions were performed to find out which biomarkers had the most prominent correlation with the inflammatory response as measured by elevated serum CRP and leukocyte count in the joint aspirate. Table 5 summarizes the results.
Table 5.
Simple linear regression models for C-reactive protein (CRP) and leukocyte count in the aspirate versus biomarkers.
3.4. The Double Contour Sign as a Diagnostic Criterion for Gout
The DC sign on ultrasound was assessed regarding sensitivity and specificity for gout and CPPD. Out of 277 patients, 151 demonstrated a positive DC sign (54.4%), while 7 patients showed signs of an iHE (2.5%) and 16 had signs of both (5.8%). This resulted in a sensitivity and specificity of 71% and 55% for the DC sign in gout. If the DC sign was assumed to be diagnostic for CPPD, it achieved a sensitivity/specificity of 59%/39%. The iHE sign on the other hand demonstrated a high specificity of 99% but a sensitivity of only 26%. Comparative mean analysis (t-test) showed a significantly elevated serum uric acid (p = 0.02; mean 9.5 mg/L ± 3.7) in DC positive patients compared to DC negative patients (mean 8.1 mg/L ± 3.1).
4. Discussion
This study is the first to examine a large cohort of consecutive patients with acute arthralgia due to gout, CPPD, or OA in terms of regularly defined biomarkers identified through physical examination, laboratory tests, and imaging modalities such as ultrasound and polarized microscopy.
Gout affected significantly more males than either OA (76% vs. 38% respectively, p < 0.0001) or CPPD (76% vs. 58% respectively, p = 0.0043). The mean age of the gout group was 69.9 ± 11.9 years, which is comparable to a large study of German patients with an average age of 63.1 ± 13.1 years [21]. Interestingly, the OA group was significantly younger (64.5 ± 17.3 years) than the CPPD cohort (73.1 ± 11.0 years, p = 0.0031) but in line with the national average of 63.3 ± 8.8 years for knee and hip OA [22]. Unfortunately, there is a paucity of data regarding CPPD in the German population; yet, taking into account an American study, we discovered a comparable average age (73.1 ± 11.0 years vs. 68.1 ± 12.3 years) [23]. Unsurprisingly, gout patients also demonstrated statistically significant elevated serum uric acid when compared to OA (mean 9.1 vs. 5.6 mg/L, p < 0.0001) and CPPD (mean 9.1 vs. 6.7 mg/L, p < 0.0001), while no significant difference was observed between OA and CPPD (p = 0.28). The interplay between serum uric acid and hypertension has been described in numerous studies, with serum uric acid linked to increased cardiovascular mortality [24] and the development of hypertension [25,26]. Conversely, antihypertensive medication such as diuretics, beta-blockers, and alpha-1 blockers have been shown to reduce glomerular filtration and thus raise serum uric acid [27]. Unfortunately, due to the retrospective nature of this study, we were unable to explore the effects of current medication on serum uric acid levels, renal function, and hypertension. Furthermore, we were able to demonstrate an association between hypertension and gout in our study, with 81.7% of the patients in the gout group suffering from arterial hypertension (n = 134) compared to only 46% in the OA group (n = 17, p < 0.0001). These results correlate with a previous study from the USA, which demonstrated a high prevalence of 74% for hypertension in gout patients [28], and play an important role in the Ctree analysis to help differentiate gout from CPPD and OA. The rate of chronic kidney disease was also significantly higher in the gout cohort compared to the OA group (p < 0.0022), with a quarter of the gout group suffering from either stage 4 or 5 chronic kidney disease, compared to 15.8% in the CPPD group and 5.4% in the OA group, although no statistical difference was found between gout and CPPD (p = 0.21). The association between gout and chronic kidney disease has been the subject of many debates, but a definitive answer remains to be found [29]. Our work indirectly supports a link between gout and chronic kidney disease as inferred by descriptive statistics. Conflicting studies and meta-analyses have yet to come to a consensus, and a definitive pathomechanism eludes researchers to this day [30,31,32]. Gout affected significantly more joints than either OA (n = 2.2 vs. 1.4; p = 0.002) or CPPD (n = 2.2 vs. 1.6; p = 0.010), but it lacks clinical significance as the differentiation between 2.2 and 1.6 joints in a clinical setting has almost no application in real life scenarios. Cumulative joint score failed to show any significant difference between groups (ANOVA p = 0.07).
We were able to reliably differentiate between inflammatory and noninflammatory arthropathies based on the DoV during ultrasound examinations. Both gout and CPPD demonstrated a significant increase in the DoV on ultrasound vs. OA (both p < 0.0001). Power Doppler ultrasound was shown to demonstrate synovitis with a pooled sensitivity of 77.6% and specificity of 85.2% in a recent metanalysis [33]. As expected, gout and CPPD demonstrated markedly elevated ESR and CRP values. While patients in the OA group also had elevated levels of CRP and a high ESR value, they were statistically significantly lower than the two crystal arthropathies.
Using Ctree analyses, we were able to practically apply the above findings and create a flow chart that could have clinical applications, as demonstrated in Figure 3. Using recursive partitioning, we were able to predict gout with a positive predictive value of 0.70 while simultaneously excluding osteoarthritis (negative predictive value of 0.92) and CPPD (negative predictive value of 0.77) in our patient population using only four biomarkers: serum uric acid, sex, arterial hypertension, and serum CRP. This method could also serve further data analyses, thereby streamlining diagnostic processes by providing a list of differentials and their likelihoods to the attending physician for scrutiny after the input of commonly collected biomarkers.
On ultrasound, the DC sign was able to distinguish crystal arthropathies from OA (gout vs. OA, p < 0.0001; CPPD vs. OA, p < 0.0001) but could not reliably differentiate between gout and CPPD (p = 0.0762). Similar findings have been published in previous studies [17], which showed comparable results (sensitivity of 64% for gout and 52% for CPPD) to our observed sensitivity/specificity of 71%/55% for gout and 59%/39% for CPPD. The iHE sign had a remarkably high specificity of 99% for CPPD but a rather low sensitivity of 26% (n = 20 out of 76) and was only applicable in a few cases as the differentiation between paracartilaginous and intracartilaginous localization was not possible to a confident degree even for experienced sonographers.
Using simple linear regressions, people with type II diabetes, a higher average joint score, a greater number of affected joints, a positive DC sign on ultrasound, increased serum uric acid, and an elevated leukocyte count in the aspirate were seen to have higher CRP levels as a sign of an increased inflammatory response. Elevated CRP levels in type II diabetic patients have been the focus of many studies as it has been shown to be a risk factor for type II diabetes through low-grade inflammation [34,35,36,37,38], although the exact pathomechanism remains unknown. Both an increased joint burden and a higher cumulative joint score were correlated with an increased CRP response. Our joint score system has not yet been validated by other studies but aims to adjust the absolute number of involved joints for size. This approach is constrained by the fact that a larger joint is not always entirely inflamed and does not always elicit a response proportional to size. Few studies are currently available that explore the association of joint size involvement and CRP response in gout or CPPD. A study from 1987 [39] linked increased joint involvement to an increased CRP response in gout, while a more recent study was able to link a higher joint burden to an increased CRP reaction in female OA patients [40]. Similarly, a study from 2017 demonstrated a proportional CRP response based on joint size in rheumatoid arthritis patients [41] when compared to the same number of different sized joints. Current research suggests that serum uric acid contributes to elevated CRP levels. The pathomechanism of this response is thought to be due to binding of CRP to uric acid, leading to an activation of the complement system [42,43]. Uric acid has also been linked to an increased risk of hypertension [44], further complicating the relationship between uric acid, CRP, hypertension, renal function, and metabolic syndrome. To our knowledge, no recent papers have studied the association between a positive DC sign on ultrasound and CRP burden. The DC sign represents a visual confirmation of monosodium urate crystals and its subsequent effects on surrounding structures. An appreciable amount of crystal must be in the blood stream and already precipitated into juxta-articular tissue for its signal to be picked up on ultrasound. Comparative mean analysis confirmed significantly elevated serum uric acid (p = 0.02) in DC positive patients compared to DC negative patients. As a result, one might argue that the DC symbol is essentially a sonographic expression of elevated serum uric acid.
Our study has limitations due to its retrospective nature. Although Ctrees provided reliable predictive information regarding diagnosis, they only apply to the analyzed dataset. Our study was missing a healthy control group. Groups were also not of equal size. Further studies with larger cohorts and a control group are needed to further explore the utility of this tool. Patients presenting with oligoarthritis represent another limitation of our study as only the most symptomatic joints were aspirated. Theoretically, a non-aspirated joint might have been caused by a different pathology than the aspirated joint.
5. Conclusions
We were able to predict gout in our patient population using four biomarkers (serum uric acid, CRP, sex, and arterial hypertension) with a predictive value of 0.70 and rule out OA (negative predictive value of 0.92) and CPPD (negative predictive value 0.77). The sonographic double contour sign was not able to reliably differentiate between gout and CPPD with a sensitivity and specificity of 71% and 55% for gout and 59%/39% for CPPD. The inflammatory response based on serum CRP levels correlated with patients suffering from type II diabetes, a higher cumulative joint score, an increased number of affected joints, positive DC sign on ultrasound, elevated serum uric acid, and elevated leukocyte count in the joint aspirate.
Author Contributions
Conceptualization, R.B. and V.S.S.; data curation, D.K. and R.B.; formal analysis, D.K., C.B., and V.S.S.; investigation, D.K., R.B., and V.S.S.; methodology, C.B. and V.S.S.; project administration, R.B. and V.S.S.; software, C.B.; supervision, V.S.S.; writing—original draft, D.K. and V.S.S.; writing—review and editing, D.K., R.B., and V.S.S. All authors have read and agreed to the published version of the manuscript.
Funding
This research received no external funding.
Institutional Review Board Statement
Ethical review and approval were waived for this study due to the retrospective nature of this study.
Informed Consent Statement
Patient consent was waived due to the retrospective nature of this study.
Data Availability Statement
Raw data is available upon request.
Conflicts of Interest
The authors declare no conflict of interest.
References
- Lawrence, R.C.; Felson, D.T.; Helmick, C.G.; Arnold, L.M.; Choi, H.; Deyo, R.A.; Gabriel, S.; Hirsch, R.; Hochberg, M.C.; Hunder, G.G.; et al. Estimates of the prevalence of arthritis and other rheumatic conditions in the United States. Part II. Arthritis Rheum. 2008, 58, 26–35. [Google Scholar] [CrossRef]
- Altman, R.; Asch, E.; Bloch, D.; Bole, G.; Borenstein, D.; Brandt, K.; Christy, W.; Cooke, T.D.; Greenwald, R.; Hochberg, M.; et al. Development of criteria for the classification and reporting of osteoarthritis. Classification of osteoarthritis of the knee. Diagnostic and Therapeutic Criteria Committee of the American Rheumatism Association. Arthritis Rheum. 1986, 29, 1039–1049. [Google Scholar] [CrossRef]
- Kohn, M.D.; Sassoon, A.A.; Fernando, N.D. Classifications in Brief: Kellgren-Lawrence Classification of Osteoarthritis. Clin. Orthop. Relat. Res. 2016, 474, 1886–1893. [Google Scholar] [CrossRef] [PubMed]
- Kellgren, J.H.; Lawrence, J.S. Radiological assessment of osteo-arthrosis. Ann. Rheum. Dis. 1957, 16, 494–502. [Google Scholar] [CrossRef] [PubMed]
- Möller, I.; Bong, D.; Naretdo, E.; Filippucci, E.; Carrasco, I.; Moragues, C.; Iagnocco, A. Ultrasound in the study and monitoring of osteoarthritis. Osteoarthr. Cartil. 2008, 16 (Suppl. 3), S4–S7. [Google Scholar] [CrossRef]
- Bardin, T.; Richette, P. Definition of hyperuricemia and gouty conditions. Curr. Opin. Rheumatol. 2014, 26, 186–191. [Google Scholar] [CrossRef] [PubMed]
- Rosales-Alexander, J.L.; Aznar, J.B.; Magro-Checa, C. Calcium pyrophosphate crystal deposition disease: Diagnosis and treatment. Open Access Rheumatol. Res. Rev. 2014, 6, 39–47. [Google Scholar] [CrossRef] [PubMed]
- Rosenthal, A.K.; Ryan, L.M. Calcium Pyrophosphate Deposition Disease. N. Engl. J. Med. 2016, 374, 2575–2584. [Google Scholar] [CrossRef]
- Zhang, W.; Doherty, M.; Bardini, T.; Barskova, V.; Guerne, P.-A.; Jansen, T.L.; Leeb, B.F.; Perez-Ruiz, F.; Pimentao, J.; Punzi, L.; et al. European League Against Rheumatism recommendations for calcium pyrophosphate deposition. Part I: Terminology and diagnosis. Ann. Rheum. Dis. 2011, 70, 563–570. [Google Scholar] [CrossRef]
- Li, Q.; Amano, K.; Link, T.M.; Ma, C.B. Advanced Imaging in Osteoarthritis. Sports Health 2016, 8, 418–428. [Google Scholar] [CrossRef]
- Richette, P.; Doherty, M.; Pascual, E.; Barskova, V.; Becce, F.; Castaneda, J.; Coyfish, M.; Guillo, S.; Jansen, T.; Janssens, H.; et al. Updated European League Against Rheumatism evidence-based recommendations for the diagnosis of gout. Ann. Rheum. Dis. 2020, 79, 31–38. [Google Scholar] [CrossRef] [PubMed]
- Hayashi, D.; Roemer, F.W.; Guermazi, A. Imaging for osteoarthritis. Ann. Phys. Rehabil. Med. 2016, 59, 161–169. [Google Scholar] [CrossRef] [PubMed]
- Keen, H.I.; Conaghan, P.G. Ultrasonography in osteoarthritis. Radiol. Clin. N. Am. 2009, 47, 581–594. [Google Scholar] [CrossRef] [PubMed]
- Levey, A.S.; Eckardt, K.-U.; Dorman, N.M.; Christiansen, S.L.; Hoorn, E.J.; Ingelfinger, J.R.; Inker, L.A.; Levin, A.; Mehrotra, R.; Palevsky, P.M.; et al. Nomenclature for kidney function and disease: Report of a Kidney Disease: Improving Global Outcomes (KDIGO) Consensus Conference. Kidney Int. 2020, 97, 1117–1129. [Google Scholar] [CrossRef]
- Neogi, T.; A Jansen, T.L.T.; Dalbeth, N.; Fransen, J.; Schumacher, H.R.; Berendsen, D.; Brown, M.; Choi, H.; Edwards, N.L.; Janssens, H.J.E.M.; et al. Gout classification criteria: An American College of Rheumatology/European League Against Rheumatism collaborative initiative. Ann. Rheum. Dis. 2015, 74, 1789–1798. [Google Scholar] [CrossRef]
- Miksanek, J.; Rosenthal, A.K. Imaging of calcium pyrophosphate deposition disease. Curr. Rheumatol. Rep. 2015, 17, 20. [Google Scholar] [CrossRef]
- Löffler, C.; Sattler, H.; Peters, L.; Löffler, U.; Uppenkamp, M.; Bergner, R. Distinguishing gouty arthritis from calcium pyrophosphate disease and other arthritides. J. Rheumatol. 2015, 42, 513–520. [Google Scholar] [CrossRef]
- Seidman, A.J.; Limaiem, F. (Eds.) StatPearls [Internet]; StatPearls Publishing: Treasure Island, FL, USA, 2020. [Google Scholar]
- R Core Team. R: A Language and Environment for Statistical Computing. 2014. Available online: http://www.R-project.org/ (accessed on 15 November 2020).
- Hothorn, T.; Hornik, K.; Zeileis, A. Unbiased Recursive Partitioning: A Conditional Inference Framework. J. Comput. Graph. Stat. 2006, 15, 651–674. [Google Scholar] [CrossRef]
- Annemans, L.; Spaetpen, E.; Gaskin, M.; Bonnemaire, M.; Malier, V.; Gilbert, T.; Nuki, G. Gout in the UK and Germany: Prevalence, comorbidities and management in general practice 2000–2005. Ann. Rheum. Dis. 2008, 67, 960–966. [Google Scholar] [CrossRef]
- Günther, K.P.; Sturmer, T.; Sauerland, S.; Zeissig, I.; Sun, Y.; Kessler, S.; Scharf, H.P.; Brenner, H.; Puhl, W. Prevalence of generalised osteoarthritis in patients with advanced hip and knee osteo-arthritis: The Ulm Osteoarthritis Study. Ann. Rheum. Dis. 1998, 57, 717–723. [Google Scholar] [CrossRef]
- Balderrama, C.K.; Rosenthal, A.K.; Lans, D.; Singh, J.A.; Bartels, C.M. Calcium Pyrophosphate Deposi-tion Disease and Associated Medical Comorbidities: A National Cross-Sectional Study of US Veterans. Arthritis Care Res. 2017, 69, 1400–1406. [Google Scholar] [CrossRef] [PubMed]
- Stack, A.G.; Hanley, A.; Cassetrly, L.; Cronin, C.; Abdalla, A.; Kiernan, T.; Murthy, B.; Hegarty, A.; Hannigan, A.; Nguyen, H. Independent and conjoint associations of gout and hyperuricaemia with total and cardiovascular mortality. QJM Mon. J. Assoc. Physicians 2013, 106, 647–658. [Google Scholar] [CrossRef] [PubMed]
- Kuwabara, M.; Niwa, K.; Nishi, Y.; Mizuno, A.; Asano, T.; Masuda, K.; Komatsu, I.; Yamazoe, M.; Takahashi, O.; Hisatome, I. Relationship between serum uric acid levels and hypertension among Japanese individuals not treated for hyperuricemia and hypertension. Hypertens Res. 2014, 37, 785–789. [Google Scholar] [CrossRef]
- Lanaspa, M.A.; Andres-Hernando, A.; Kuwabara, M. Uric acid and hypertension. Hypertens. Res. 2020, 43, 832–834. [Google Scholar] [CrossRef] [PubMed]
- Khan, Y.H.; Sarriff, A.; Adnan, A.S.; Khan, A.H.; Mallhi, T.H. Chronic Kidney Disease, Fluid Overload and Diuretics: A Complicated Triangle. PLoS ONE 2016, 11, e0159335. [Google Scholar] [CrossRef]
- Zhu, Y.; Pandya, B.J.; Choi, H.K. Comorbidities of gout and hyperuricemia in the US general population: NHANES 2007–2008. Am. J. Med. 2012, 125, 679–687.e1. [Google Scholar] [CrossRef]
- Johnson, R.J.; Nakagawa, T.; Jalal, D.; Sánchez-Lozada, L.G.; Kang, D.-H.; Ritz, E. Uric acid and chronic kidney disease: Which is chasing which? Nephrol. Dial. Transplant. Off. Publ. Eur. Dial. Transpl. Assoc. Eur. Ren. Assoc. 2013, 28, 2221–2228. [Google Scholar] [CrossRef] [PubMed]
- Liu, X.; Zhai, T.; Ma, R.; Luo, C.; Wang, H.; Liu, L. Effects of uric acid-lowering therapy on the progression of chronic kidney disease: A systematic review and meta-analysis. Ren. Fail. 2018, 40, 289–297. [Google Scholar] [CrossRef]
- Mallat, S.G.; Al Kattar, S.; Tanios, B.Y.; Jurjus, A. Hyperuricemia, Hypertension, and Chronic Kidney Disease: An Emerging Association. Curr. Hypertens. Rep. 2016, 18, 74. [Google Scholar] [CrossRef]
- Sampson, A.L.; Singer, R.F.; Walters, G.D. Uric acid lowering therapies for preventing or delaying the progression of chronic kidney disease. Cochrane Database Syst. Rev. 2017, 10, CD009460. [Google Scholar] [CrossRef]
- Hassan, R.; Hussain, S.; Bacha, R.; Gillani, S.A.; Malik, S.S. Reliability of Ultrasound for the Detection of Rheumatoid Arthritis. J. Med. Ultrasound 2019, 27, 3–12. [Google Scholar] [CrossRef]
- Calle, M.C.; Fernandez, M.L. Inflammation and type 2 diabetes. Diabetes Metab. 2012, 38, 183–191. [Google Scholar] [CrossRef]
- Alexandraki, K.; Piperi, C.; Kalofoutis, C.; Singh, J.; Alaveras, A.; Kalofoutis, A. Inflammatory process in type 2 diabetes: The role of cytokines. Ann. N. Y. Acad. Sci. 2006, 1084, 89–117. [Google Scholar] [CrossRef]
- Tabassum, R.; Mia, A.R.; Reza-Ul-Haq, K.M.; Yesmin, M.; Faruqui, J.M. C-reactive Protein Level in Type-2 Diabetic Patients Attending Mymensingh Medical College Hospital, Mymensingh. Mymensingh Med. J. MMJ 2017, 26, 56–60. [Google Scholar]
- Rodríguez-Morán, M.; Guerrero-Romero, F. Increased Levels of C-Reactive Protein in Noncontrolled Type II Diabetic Subjects. J. Diabetes Complicat. 1999, 13, 211–215. [Google Scholar] [CrossRef]
- Kanmani, S.; Kwon, M.; Shin, M.-K.; Kim, M.K. Association of C-Reactive Protein with Risk of Developing Type 2 Diabetes Mellitus, Role of Obesity and Hypertension: A Large Population-Based Korean Cohort Study. Sci. Rep. 2019, 9, 4573. [Google Scholar] [CrossRef]
- Roseff, R.; Wohlgethan, J.R.; Sipe, J.D.; Canoso, J.J. The acute phase response in gout. J. Rheumatol. 1987, 14, 974–977. [Google Scholar]
- Perruccio, A.V.; Chandran, V.; Power, J.D.; Kapoor, M.; Mahomed, N.N.; Gandhi, R. Systemic inflammation and painful joint burden in osteoarthritis: A matter of sex? Osteoarthr. Cartil. 2017, 25, 53–59. [Google Scholar] [CrossRef] [PubMed]
- Shimada, K.; Komiya, A.; Yokogawa, N.; Nishino, J.; Sugii, S.; Tohma, S. Impact of the size and number of swollen joints on serum C-reactive protein level and erythrocyte sedimentation rate in rheumatoid arthritis: A cross-sectional study in Japan. Clin. Rheumatol. 2017, 36, 427–431. [Google Scholar] [CrossRef] [PubMed]
- Alberts, A.; Klingbetrg, A.; Wessig, A.K.; Combes, C.; Witte, T.; Brand, K.; Pich, A.; Neumann, K. C-reactive protein (CRP) recognizes uric acid crystals and recruits proteases C1 and MASP1. Sci. Rep. 2020, 10, 6391. [Google Scholar] [CrossRef] [PubMed]
- Spiga, R.; Marini, M.A.; Mancuso, E.; Di Fatta, C.; Fuoco, A.; Perticone, F.; Andreozzi, F.; Mannino, G.C.; Sesti, G. Uric Acid Is Associated with Inflammatory Biomarkers and Induces Inflammation via Activating the NF-κB Signaling Pathway in HepG2 Cells. Arterioscler. Thromb. Vasc. Biol. 2017, 37, 1241–1249. [Google Scholar] [CrossRef] [PubMed]
- Ali, N.; Mahmood, S.; Islam, F.; Rahman, S.; Haque, T.; Islam, S.; Rahman, S.; Haque, N.; Mosaib, G.; Perveen, R.; et al. Relationship between serum uric acid and hypertension: A cross-sectional study in Bangladeshi adults. Sci. Rep. 2019, 9, 9061. [Google Scholar] [CrossRef] [PubMed]
Publisher’s Note: MDPI stays neutral with regard to jurisdictional claims in published maps and institutional affiliations. |
© 2021 by the authors. Licensee MDPI, Basel, Switzerland. This article is an open access article distributed under the terms and conditions of the Creative Commons Attribution (CC BY) license (https://creativecommons.org/licenses/by/4.0/).