
Percutaneous Microwave Ablation of Liver Lesions: Differences on the Sphericity Index of the Ablation Zone between Cirrhotic and Healthy Liver Parenchyma

 , ,
, ,  ,
, 
Abstract
1. Introduction
2. Materials and Methods
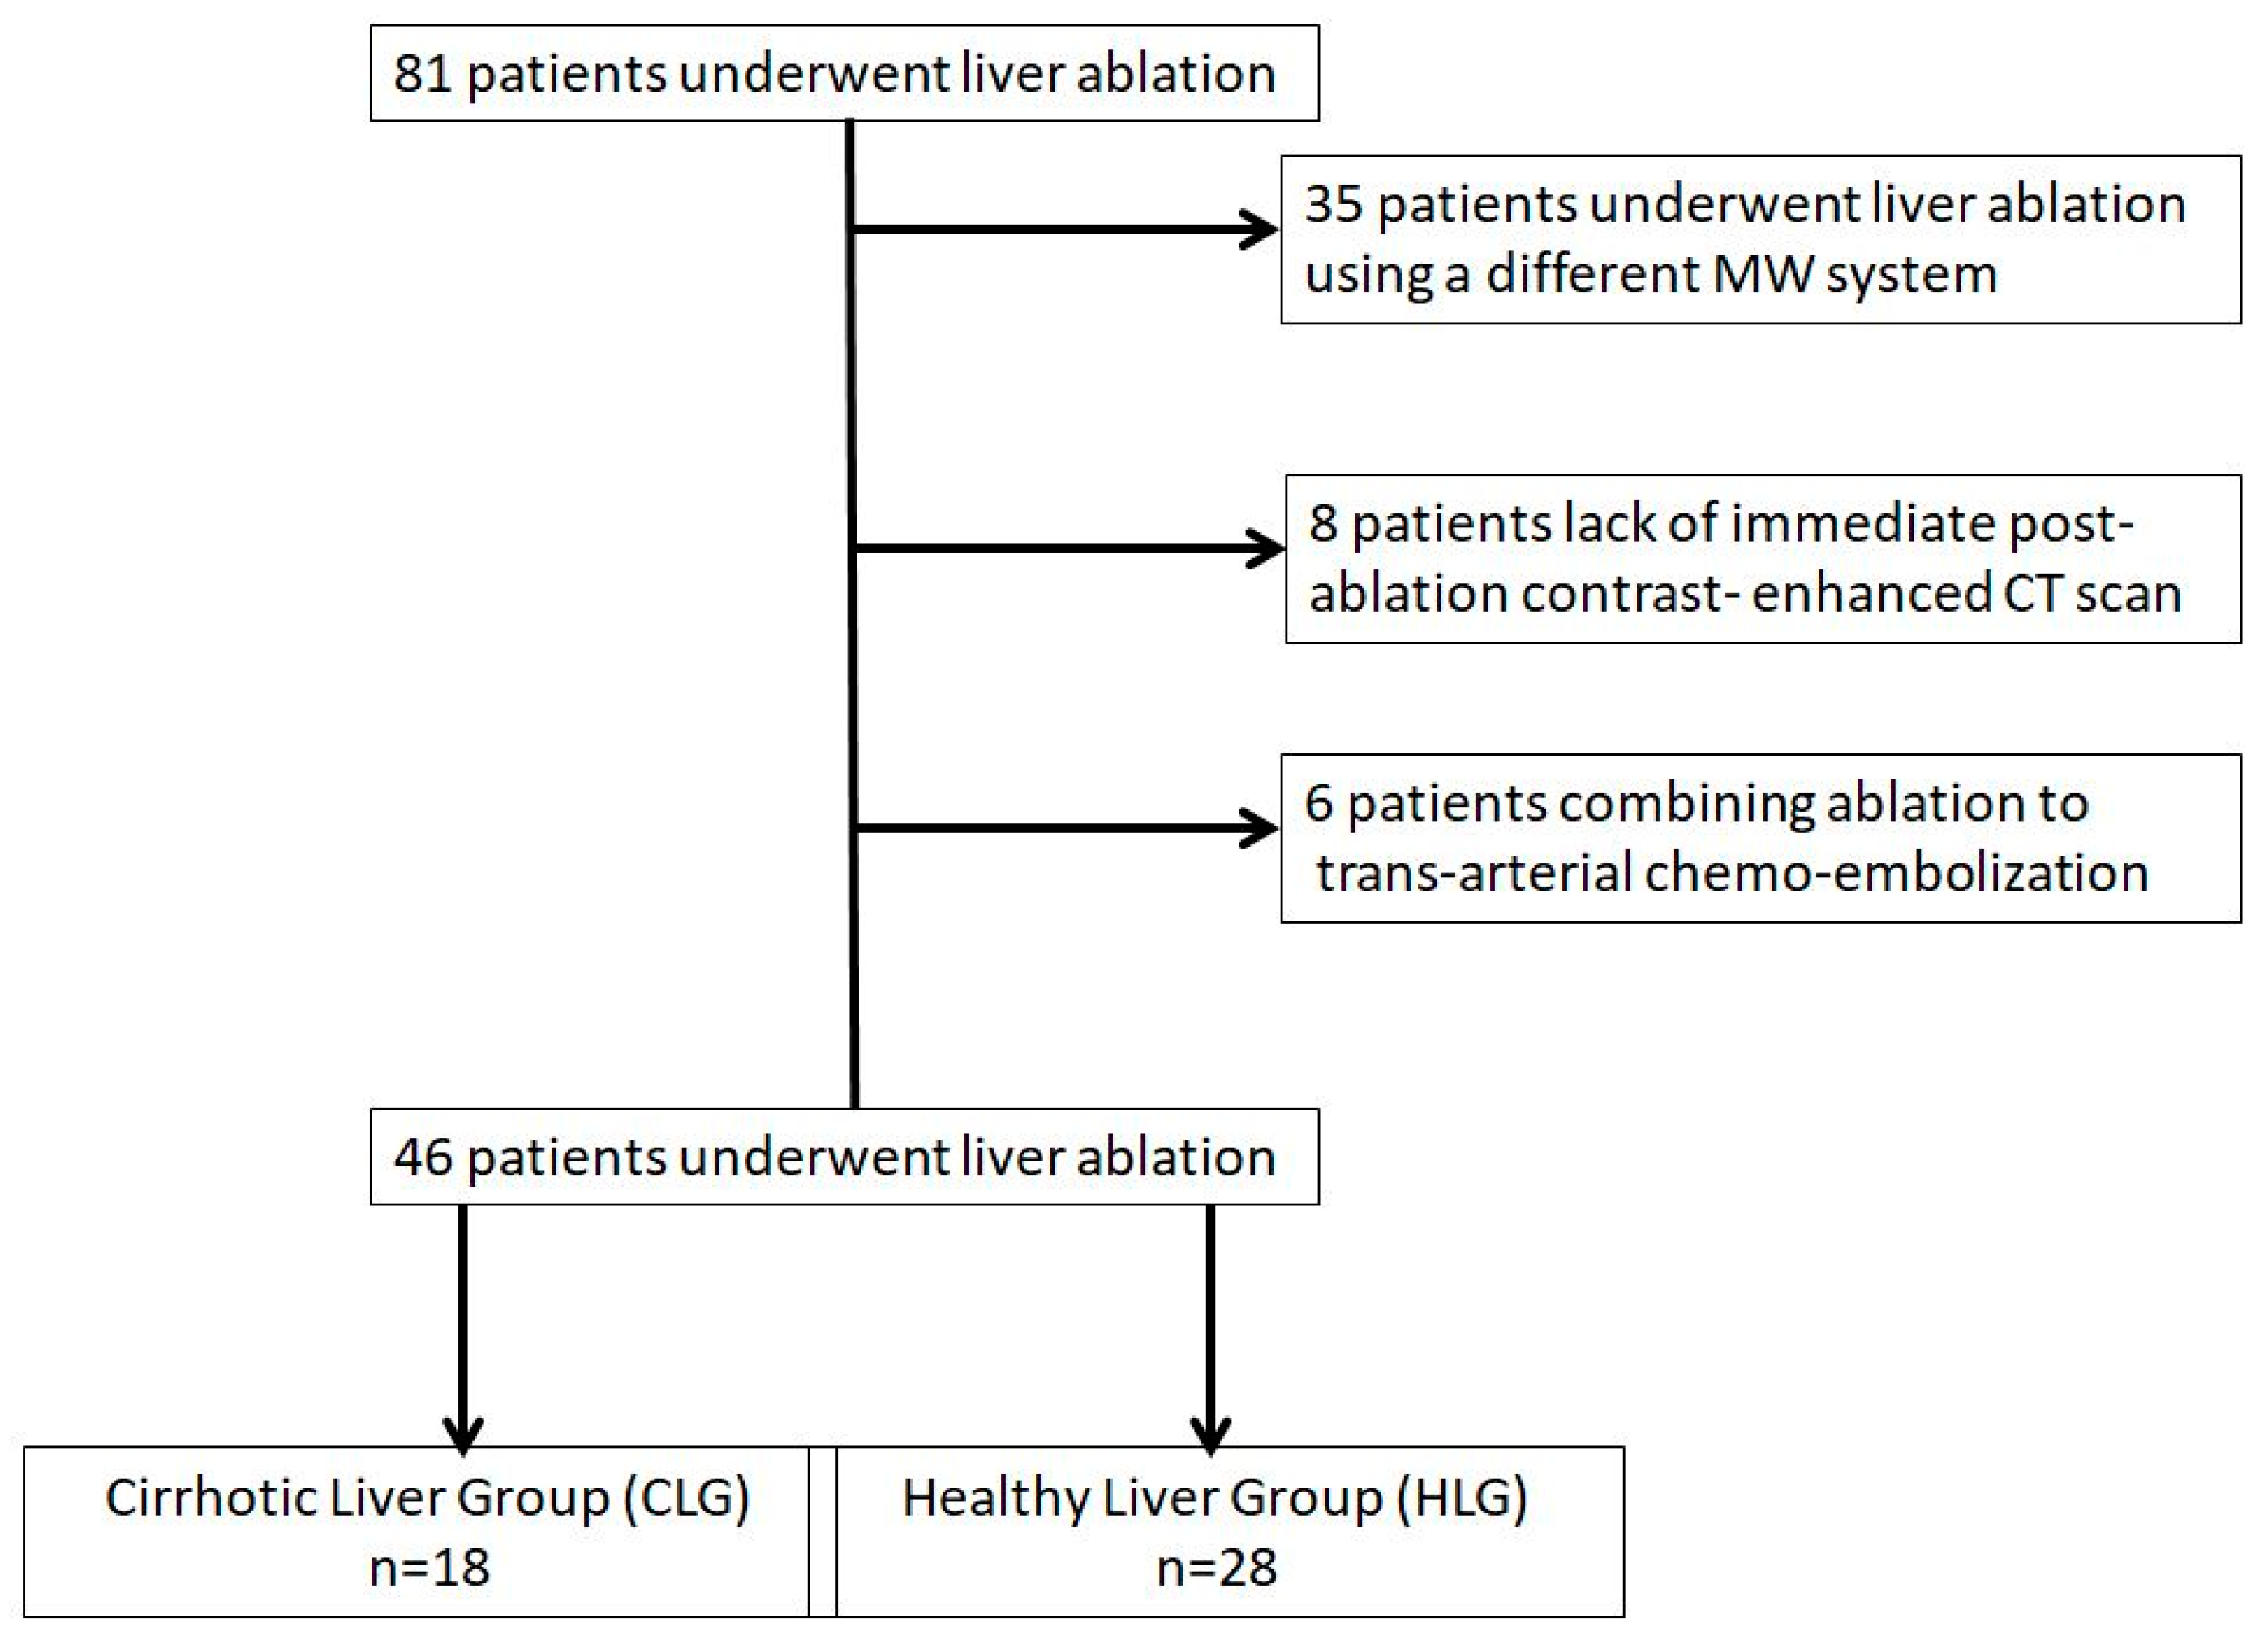
2.1. Patient Selection and Evaluation
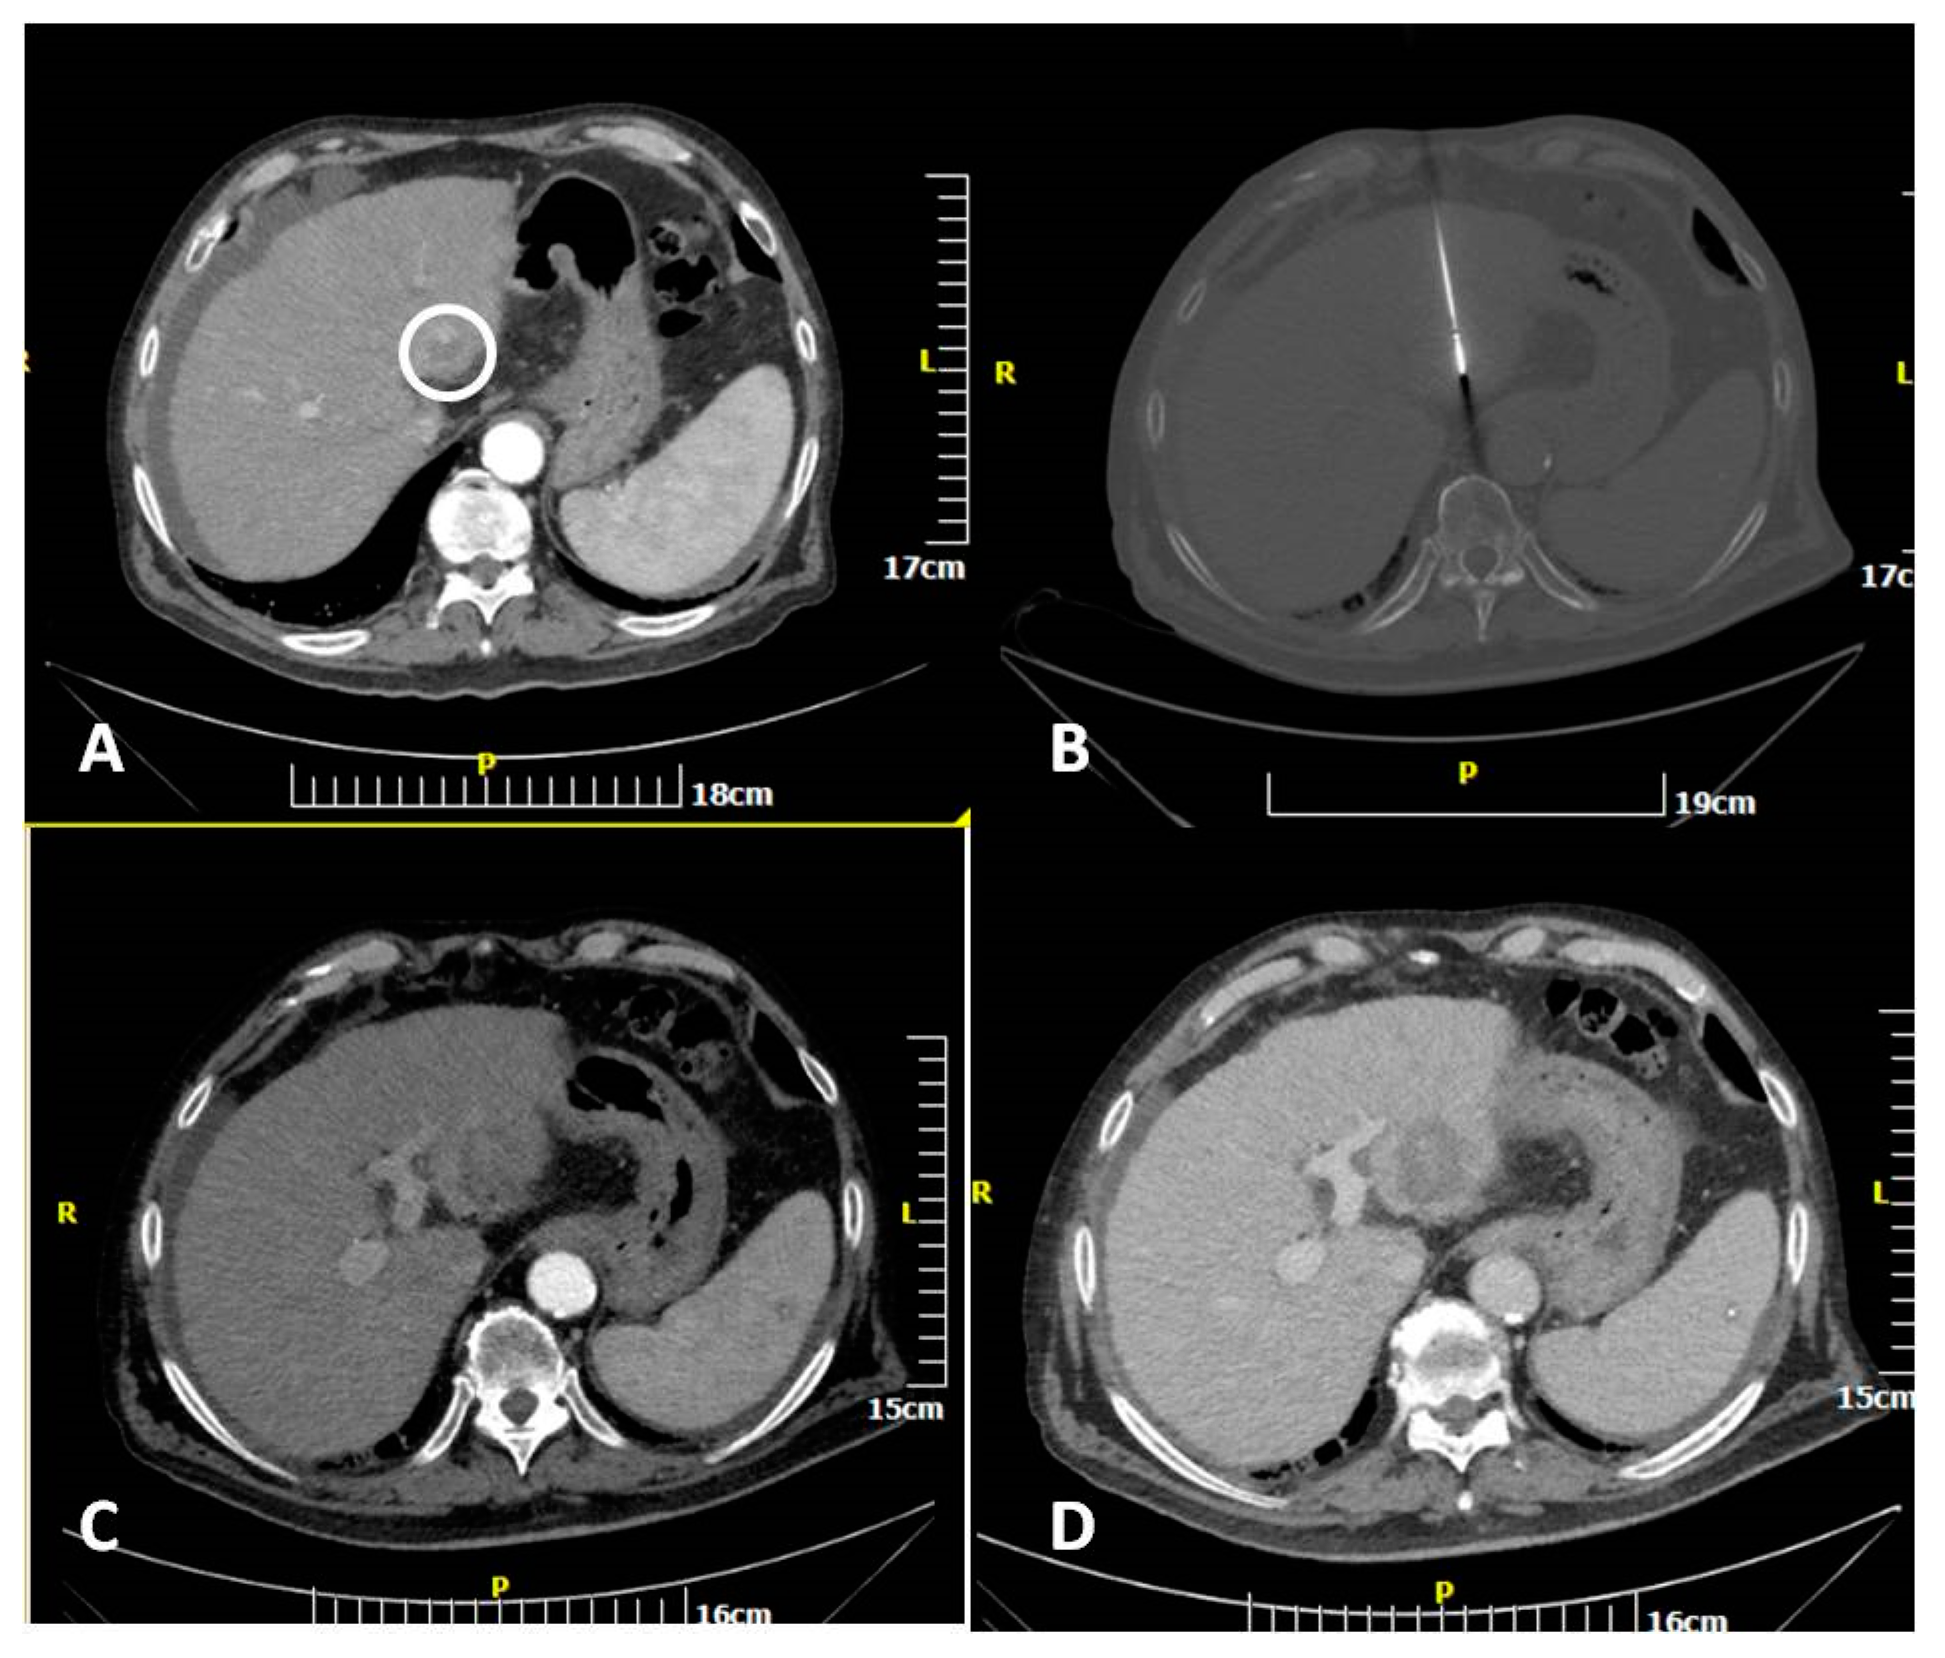
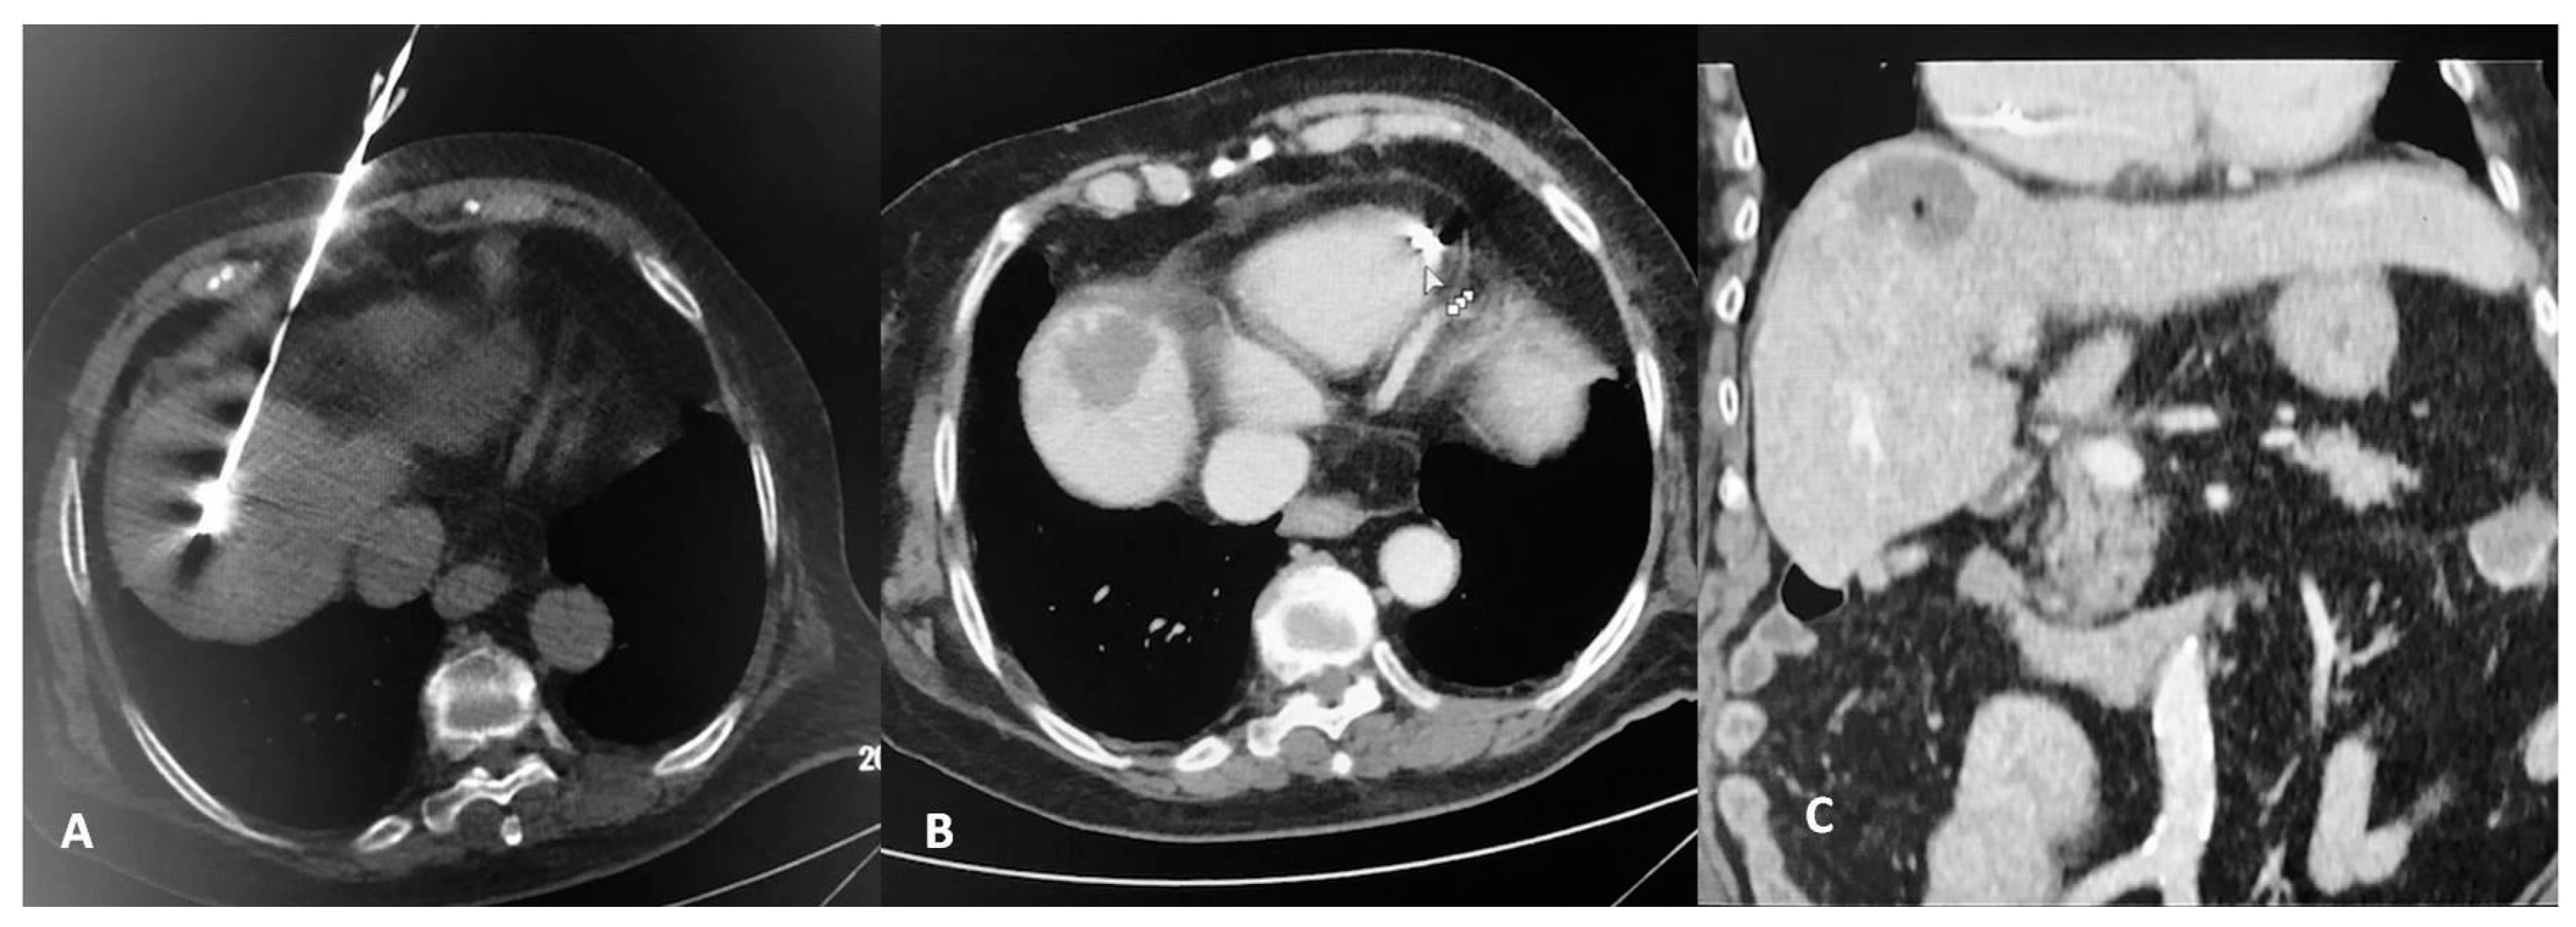
2.2. Percutaneous MW Ablation Procedure
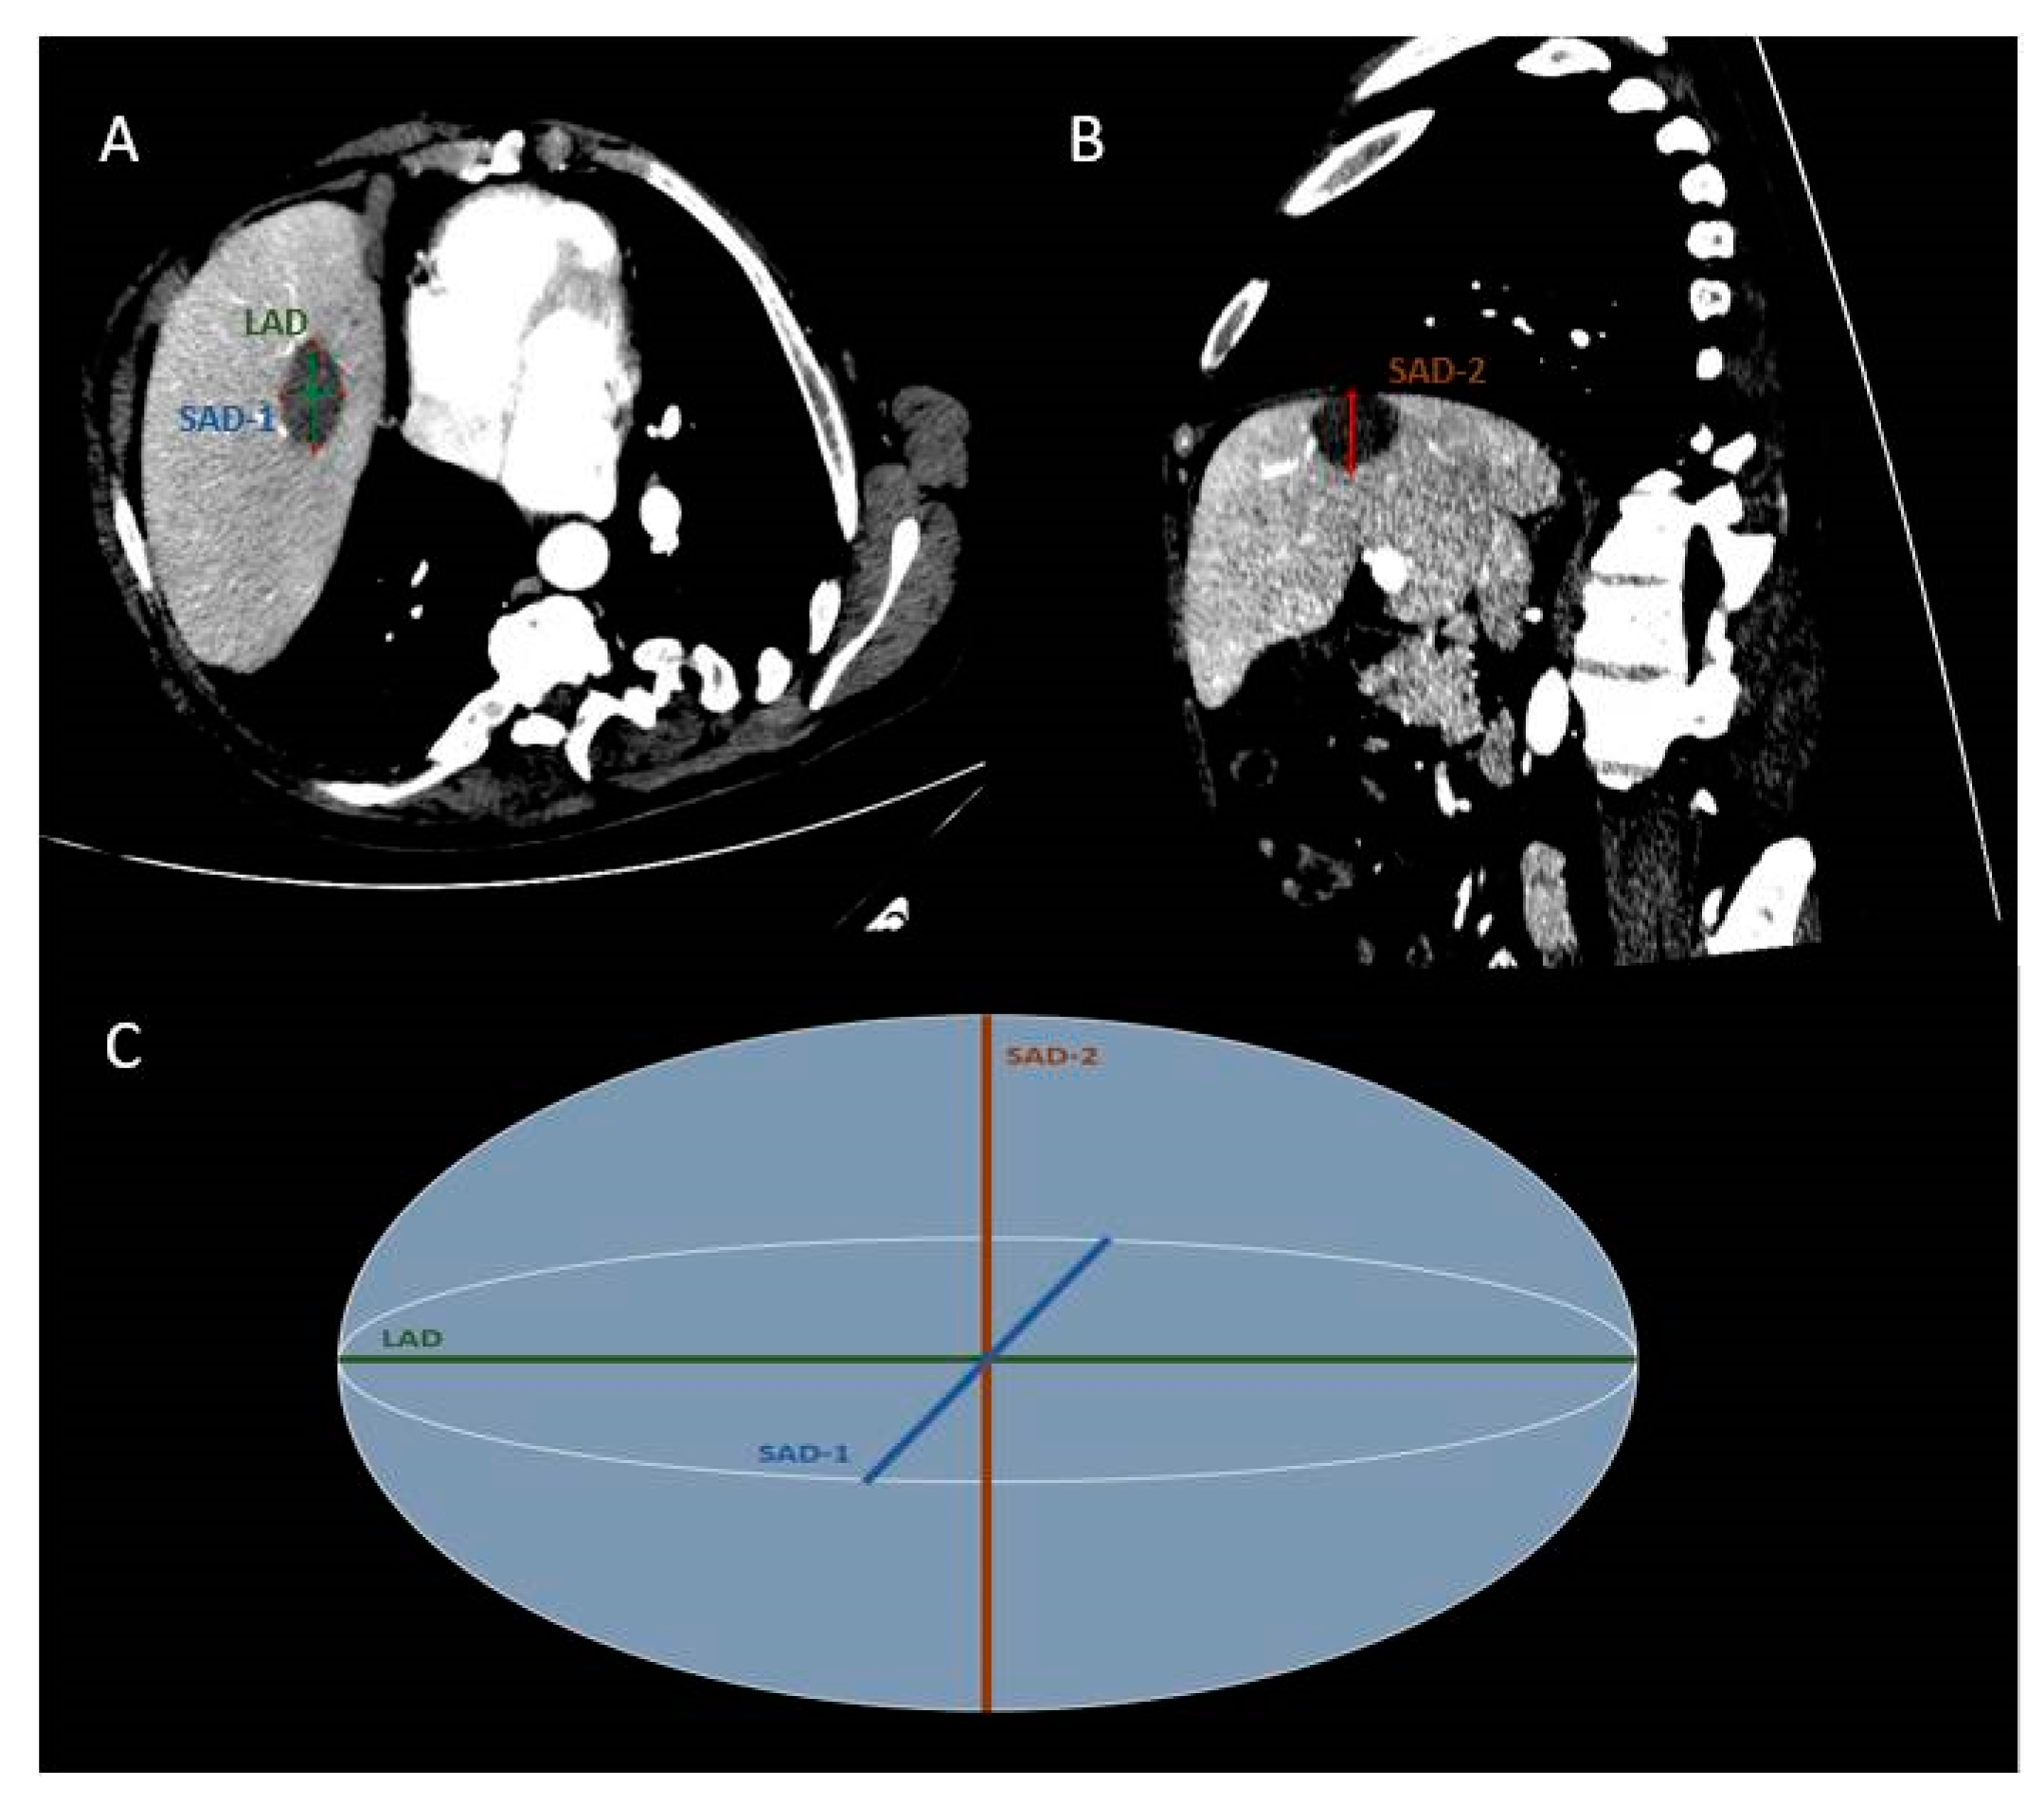
2.3. Outcome Measures
2.4. Statistical Analysis
3. Results
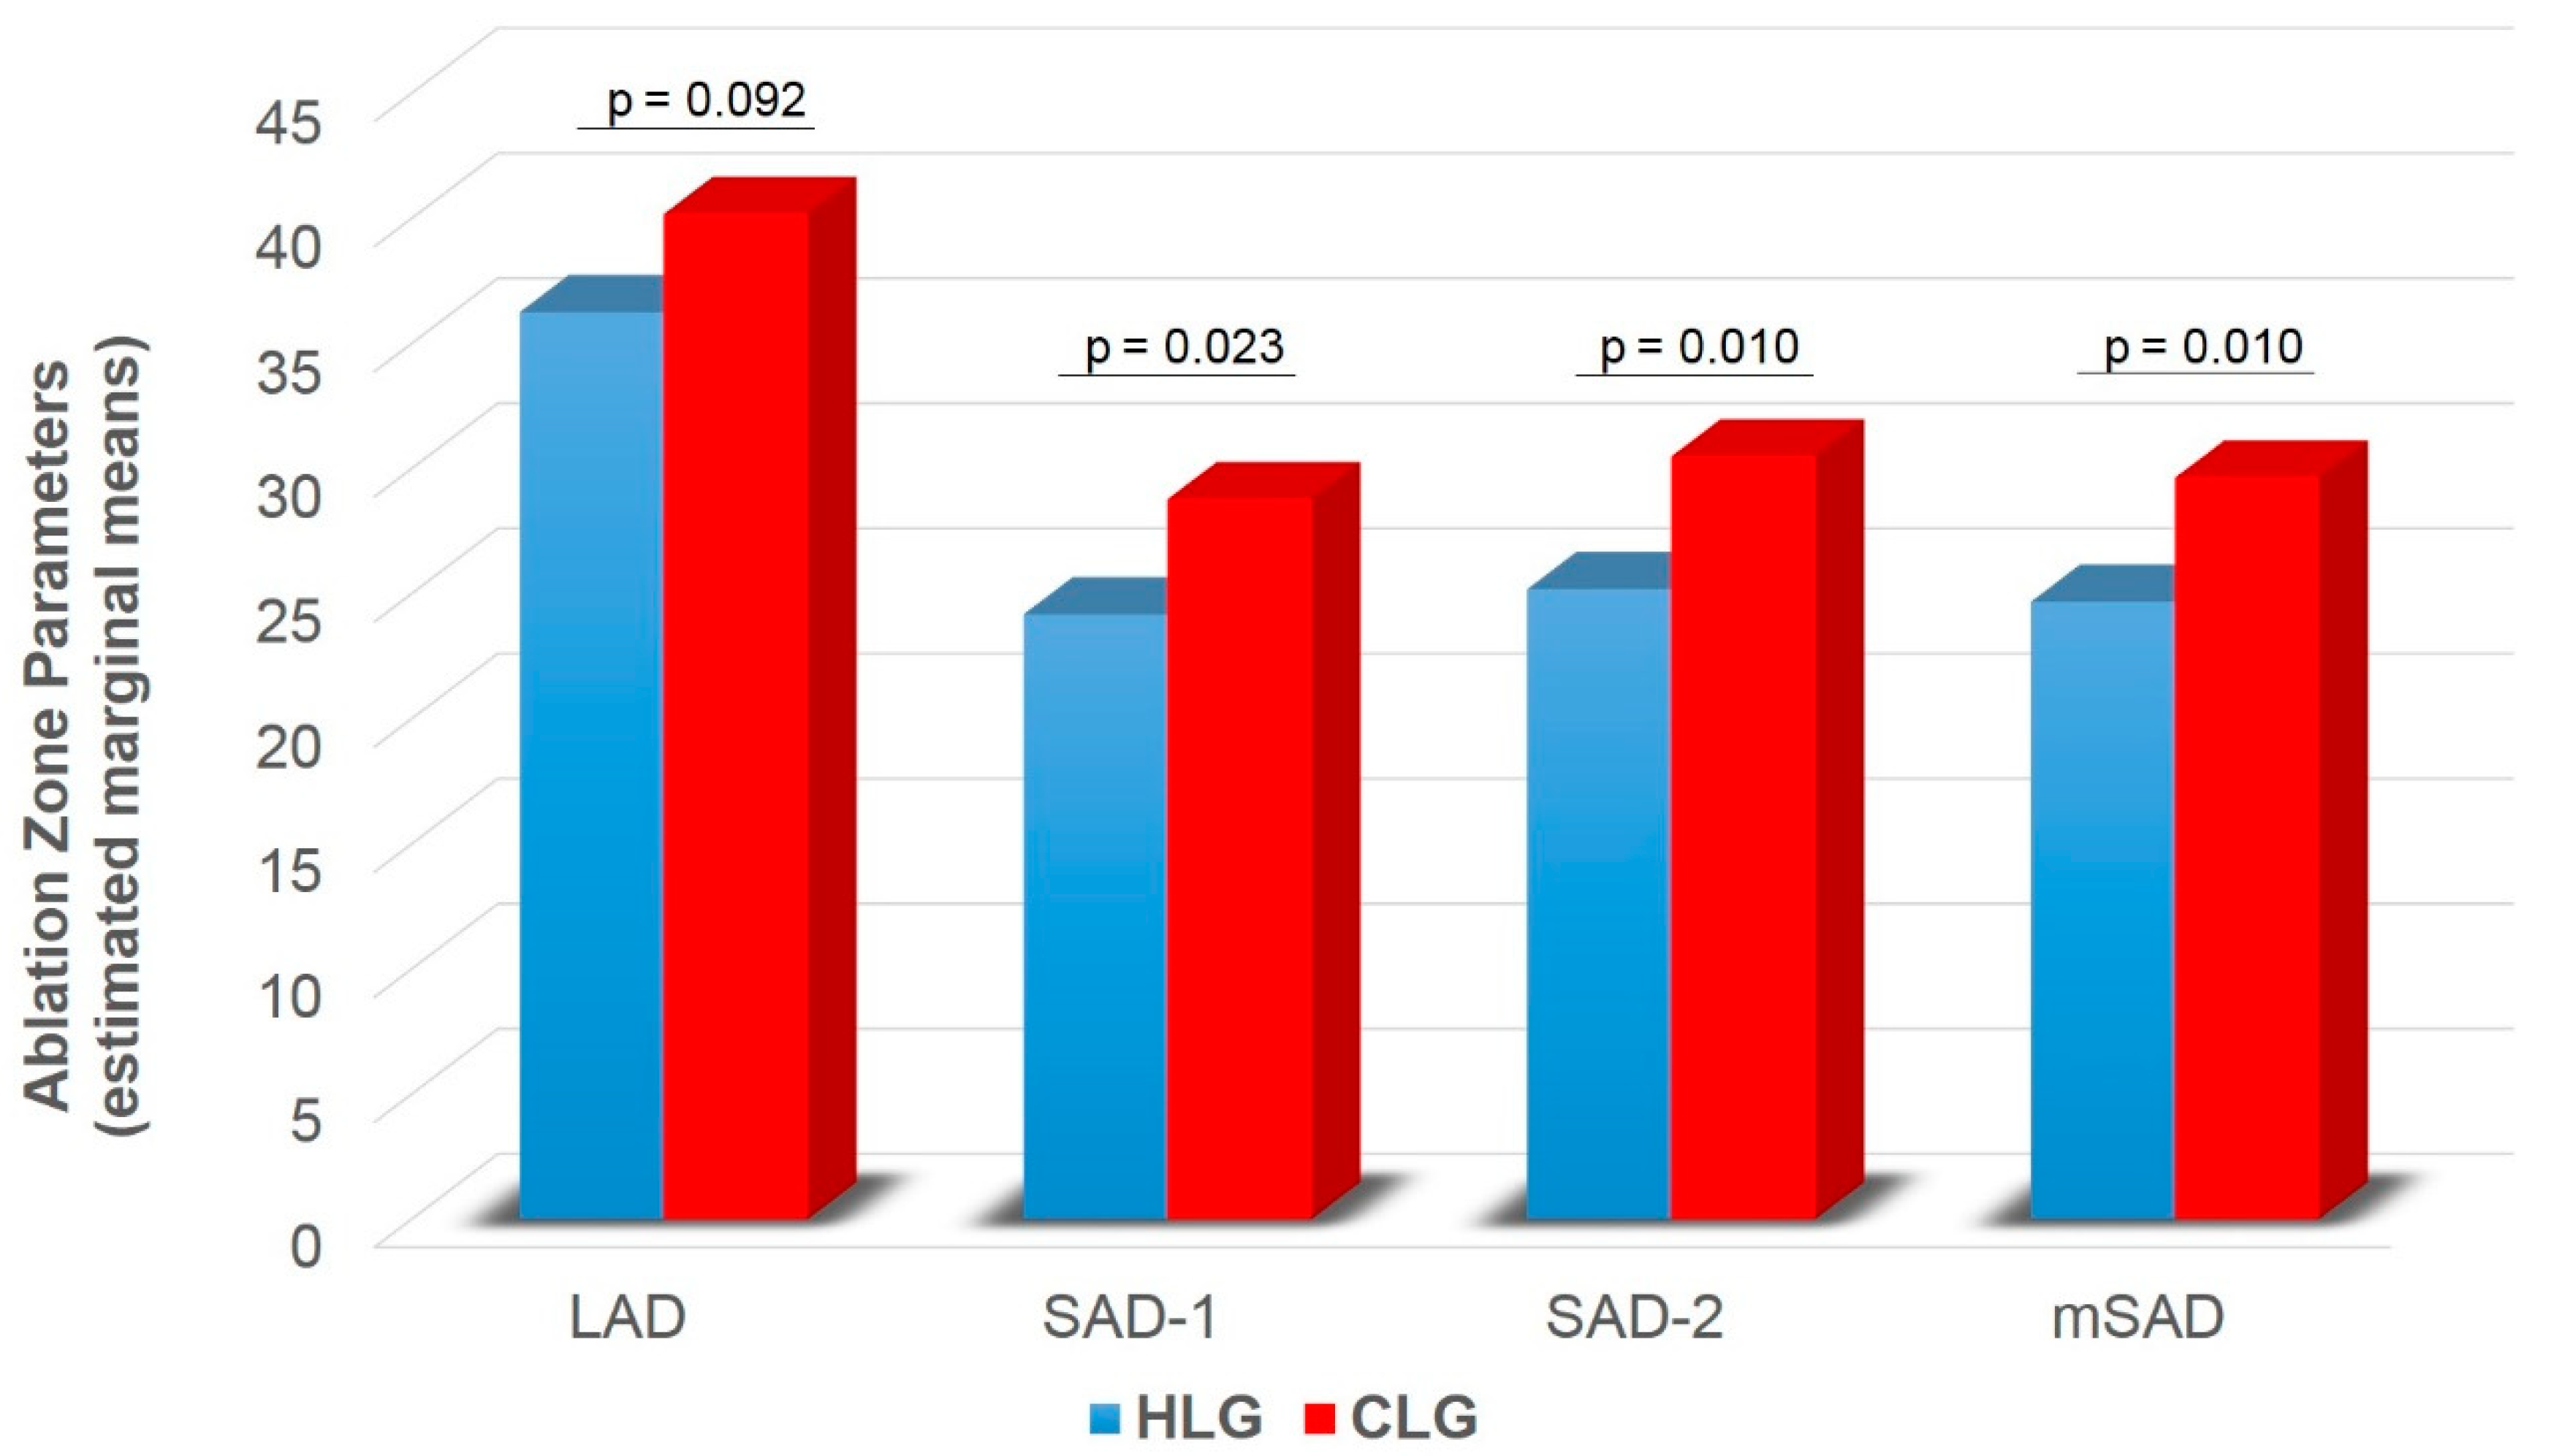
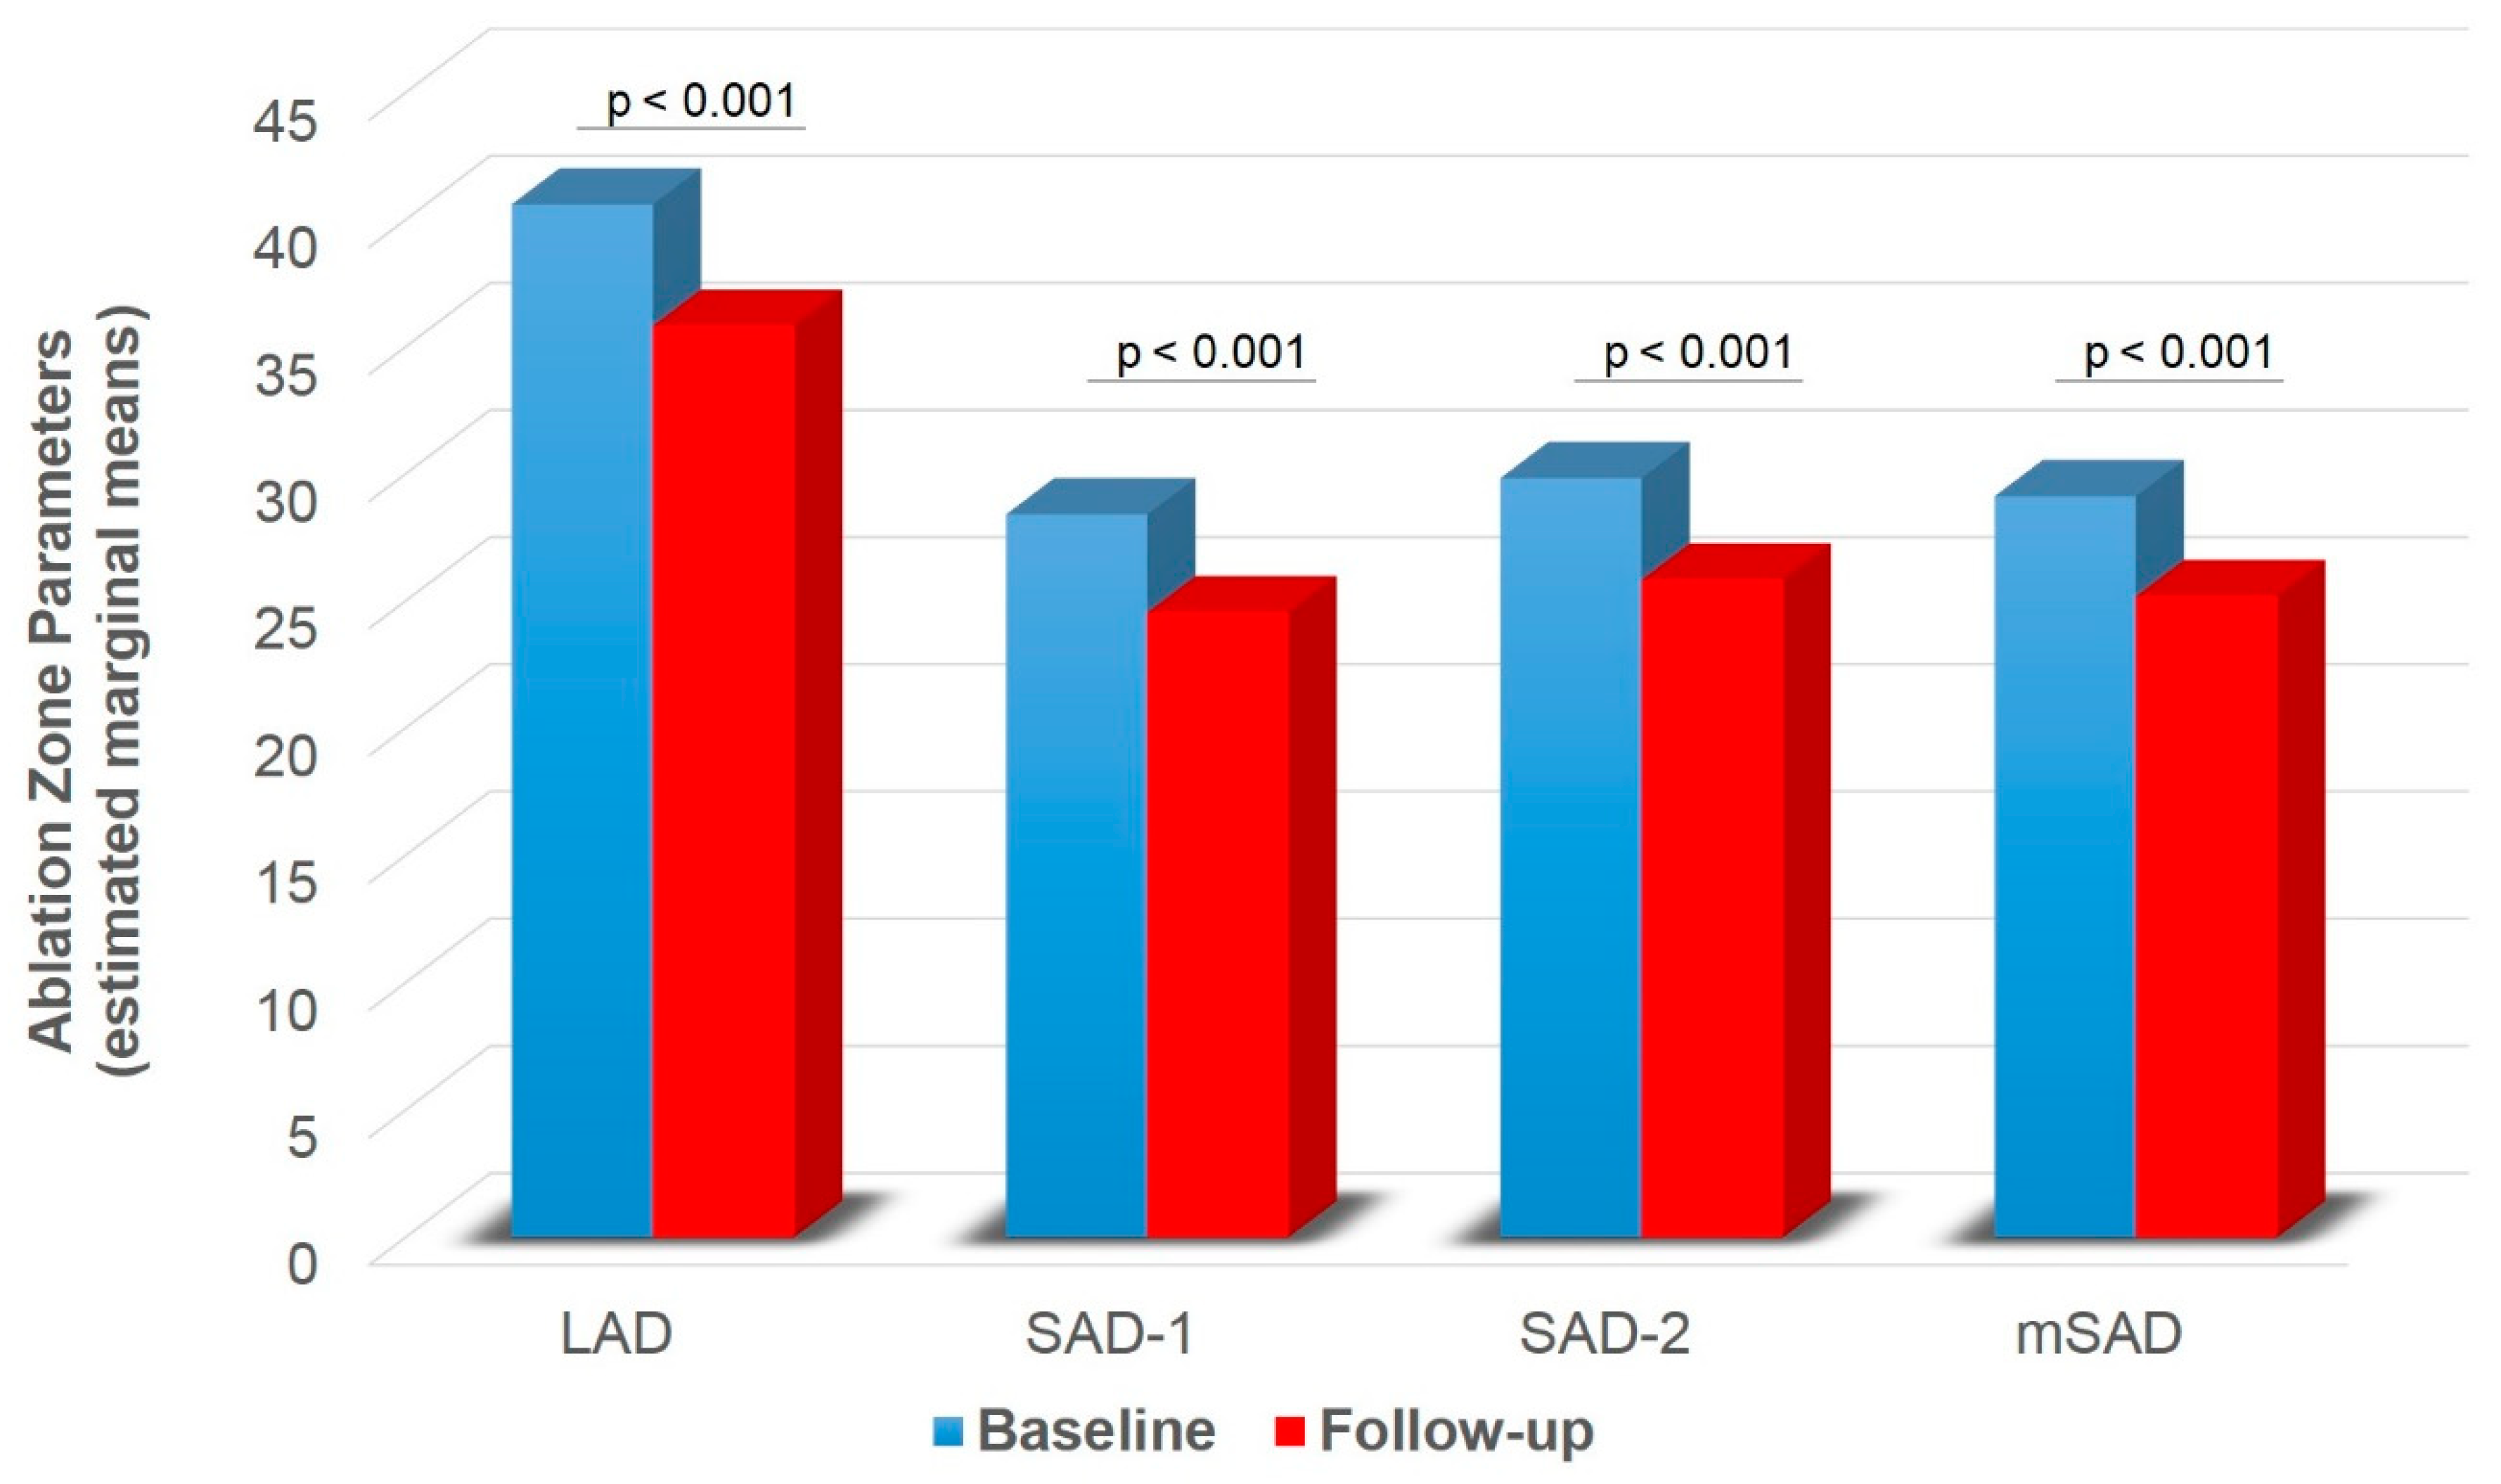
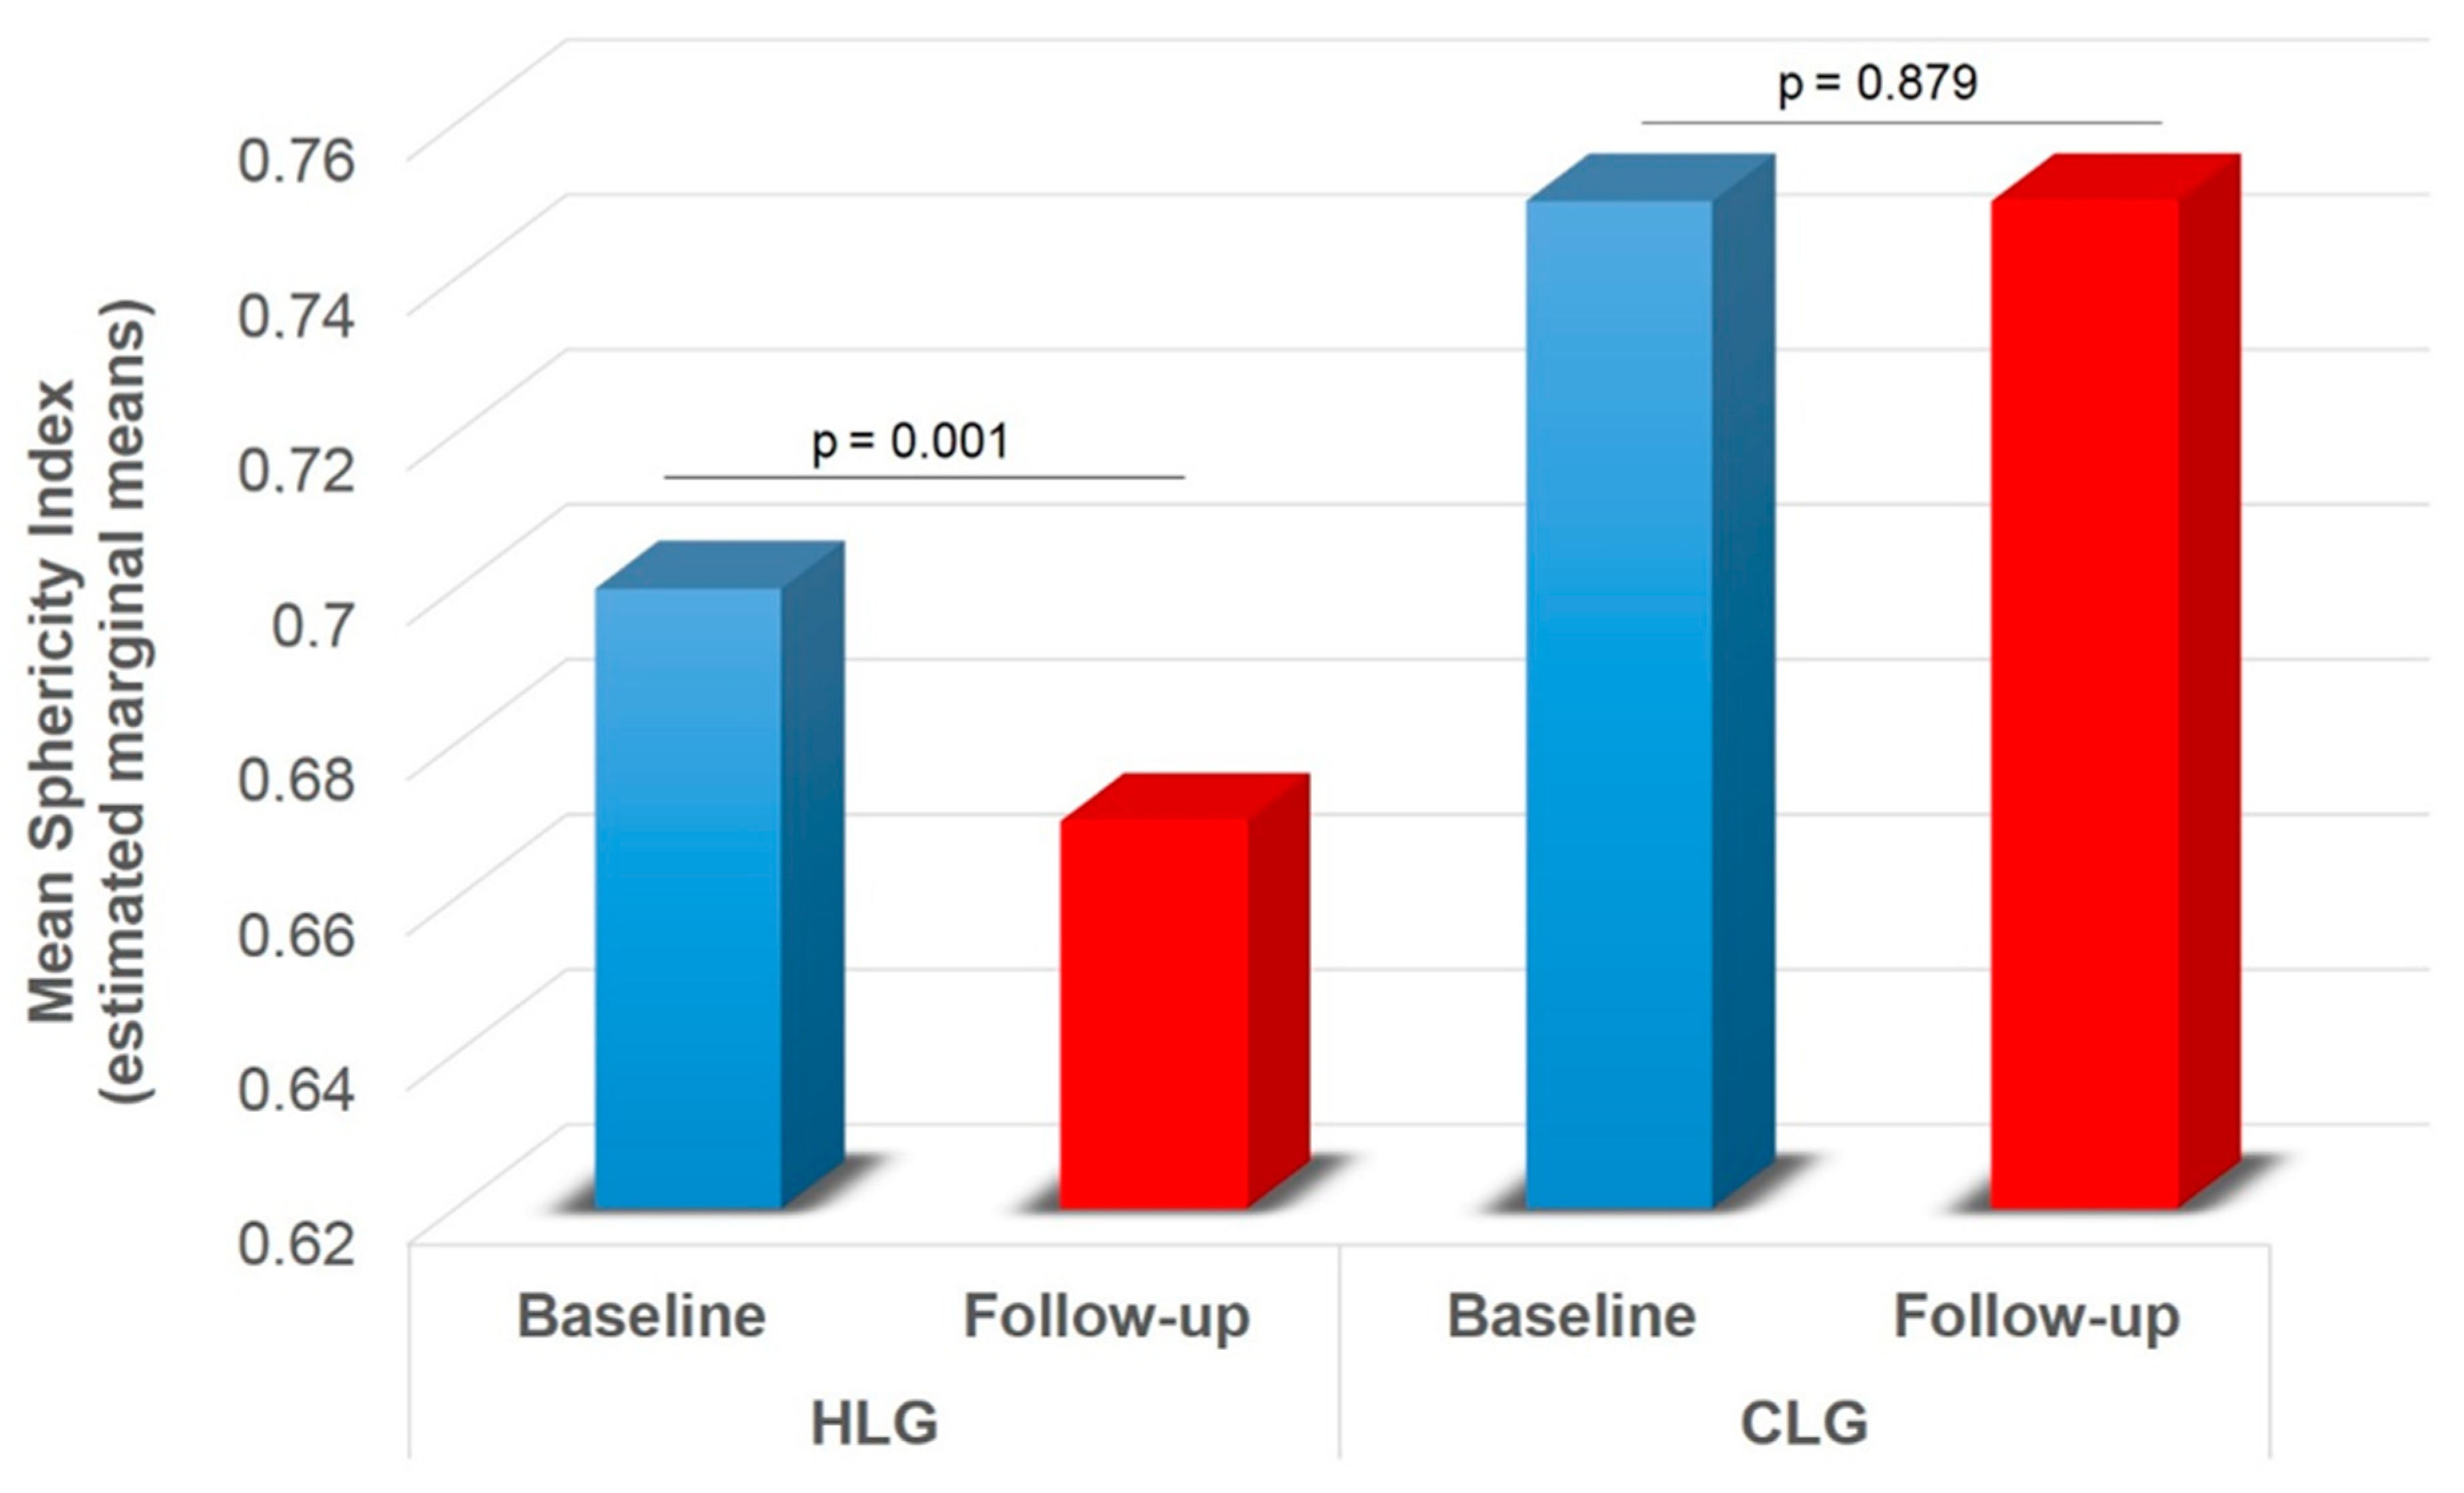
Ablation Zone Parameters
4. Discussion
Author Contributions
Funding
Institutional Review Board Statement
Informed Consent Statement
Data Availability Statement
Conflicts of Interest
References
- Crocetti, L.; De Baére, T.; Pereira, P.L.; Tarantino, F.P. CIRSE Standards of Practice on Thermal Ablation of Liver Tumours. Cardiovasc. Interv. Radiol. 2020, 43, 951–962. [Google Scholar] [CrossRef]
- Hinshaw, J.L.; Lubner, M.G.; Ziemlewicz, T.J.; Lee, F.T.; Brace, C.L. Percutaneous Tumor Ablation Tools: Microwave, Radiofrequency, or Cryoablation—What Should You Use and Why? RadioGraphics 2014, 34, 1344–1362. [Google Scholar] [CrossRef] [PubMed]
- Filippiadis, D.K.; Spiliopoulos, S.; Konstantos, C.; Reppas, L.; Kelekis, A.; Brountzos, E.; Kelekis, N. Computed tomography-guided percutaneous microwave ablation of hepatocellular carcinoma in challenging locations: Safety and efficacy of high-power microwave platforms. Int. J. Hyperth. 2017, 34, 863–869. [Google Scholar] [CrossRef]
- Di Vece, F.; Tombesi, P.; Ermilli, F.; Maraldi, C.; Sartori, S. Coagulation areas produced by cool-tip radiofrequency ablation and microwave ablation using a device to decrease back-heating effects: A prospective pilot study. Cardiovasc. Interv. Radiol. 2014, 37, 723–729. [Google Scholar] [CrossRef] [PubMed]
- Amabile, C.; Ahmed, M.; Solbiati, L.; Meloni, M.F.; Solbiati, M.; Cassarino, S.; Tosoratti, N.; Nissenbaum, Y.; Ierace, T.; Goldberg, S.N. Microwave ablation of primary and secondary liver tumours: Ex vivo, in vivo, and clinical characterisation. Int. J. Hyperth. 2017, 33, 34–42. [Google Scholar] [CrossRef] [PubMed]
- Glassberg, M.B.; Ghosh, S.; Clymer, J.W.; Qadeer, R.A.; Ferko, N.C.; Sadeghirad, B.; Wright, G.W.; Amaral, J.F. Microwave Ablation Compared With Radiofrequency Ablation for Treatment of Hepatocellular Carcinoma and Liver Metastases: A Systematic Review and Meta-Analysis. OncoTargets Ther. 2018, 12, 6407–6438. [Google Scholar] [CrossRef]
- Soliman, A.F.; Abouelkhair, M.M.; Allah, M.S.H.; El-Kady, N.M.; Ezzat, W.M.; A Gabr, H.; Elsayed, E.H.; I Saleh, A.; Kamel, A. Efficacy and Safety of Microwave Ablation (MWA) for Hepatocellular Carcinoma (HCC) in Difficult Anatomical Sites in Egyptian Patients with Liver Cirrhosis. Asian Pac. J. Cancer Prev. 2019, 20, 295–301. [Google Scholar] [CrossRef] [PubMed]
- Vogl, T.J.; Basten, L.M.; Nour-Eldin, N.-E.A.; Kaltenbach, B.; Bodelle, B.; Wichmann, J.L.; Ackermann, H.; Naguib, N.N.N. Evaluation of microwave ablation of liver malignancy with enabled constant spatial energy control to achieve a predictable spherical ablation zone. Int. J. Hyperth. 2017, 34, 492–500. [Google Scholar] [CrossRef]
- Liang, P.; Yu, J.; Lu, M.D.; Dong, B.W.; Yu, X.L.; Zhou, X.D.; Hu, B.; Xie, M.-X.; Cheng, W.; He, W.; et al. LuPractice guidelines for ultrasound-guided percutaneous microwave ablation for hepatic malignancy. World J. Gastroenterol. 2013, 7, 5430–5438. [Google Scholar] [CrossRef]
- Liu, Z.; Ahmed, M.; Weinstein, Y.; Yi, M.; Mahajan, R.L.; Goldberg, S.N. Characterization of the RF ablation-induced ‘oven effect’: The importance of background tissue thermal conductivity on tissue heating. Int. J. Hyperth. 2006, 22, 327–342. [Google Scholar] [CrossRef]
- Cassinotto, C.; Denys, A.; Gay, F.; Duran, R.; Hocquelet, A.; Piron, L.; Guiu, B. Radiofrequency Ablation of Liver Tumors: No Difference in the Ablation Zone Volume Between Cirrhotic and Healthy Liver. Cardiovasc. Interv. Radiol. 2018, 41, 905–911. [Google Scholar] [CrossRef]
- Hoffmann, R.; Rempp, H.; Erhard, L.; Blumenstock, G.; Pereira, P.L.; Claussen, C.D.; Clasen, S. Comparison of Four Microwave Ablation Devices: An Experimental Study in ex Vivo Bovine Liver. Radiology 2013, 268, 89–97. [Google Scholar] [CrossRef]
- Cazzato, R.L.; De Marini, P.; Leclerc, L.; Dalili, D.; Koch, G.; Rao, P.; Auloge, P.; Garnon, J.; Gangi, A. Large nearly spherical ablation zones are achieved with simultaneous multi-antenna microwave ablation applied to treat liver tumours. Eur. Radiol. 2019, 30, 971–975. [Google Scholar] [CrossRef] [PubMed]
- Cornelis, F.; Monard, E.; Moulin, M.-A.; Vignaud, E.; Laveissiere, F.; Ben Ammar, M.; Nouri-Neuville, M.; Barral, M.; Lombart, B. Sedation and analgesia in interventional radiology: Where do we stand, where are we heading and why does it matter? Diagn. Interv. Imaging 2019, 100, 753–762. [Google Scholar] [CrossRef] [PubMed]
- Forner, A.; Reig, M.; Bruix, J. Hepatocellular carcinoma. Lancet 2018, 391, 1301–1314. [Google Scholar] [CrossRef]
- EASL-EORTC clinical practice guidelines: Management of hepatocellular carcinoma. Eur. J. Cancer 2012, 48, 599–641. [CrossRef]
- Gillams, A.; Goldberg, N.; Ahmed, M.; Bale, R.; Breen, D.; Callstrom, M.; Chen, M.H.; Choi, B.I.; De Baere, T.; Dupuy, D.; et al. Thermal ablation of colorectal liver metastases: A position paper by an international panel of ablation experts, the interventional oncology sans frontières meeting 2013. Eur. Radiol. 2015, 25, 3438–3454. [Google Scholar] [CrossRef]
- Meloni, M.F.; Chiang, J.; Laeseke, P.F.; Dietrich, C.F.; Sannino, A.; Solbiati, M.; Nocerino, E.; Brace, C.L.; Lee, F.T. Microwave ablation in primary and secondary liver tumors: Technical and clinical approaches. Int. J. Hyperth. 2017, 33, 15–24. [Google Scholar] [CrossRef] [PubMed]
- Tsitskari, M.; Filippiadis, D.; Kostantos, C.; Palialexis, K.; Zavridis, P.; Kelekis, N.; Brountzos, E. The role of interventional oncology in the treatment of colorectal cancer liver metastases. Ann. Gastroenterol. 2018, 32, 147–155. [Google Scholar] [CrossRef] [PubMed]
- Aufranc, V.; Farouil, G.; Abdel-Rehim, M.; Smadja, P.; Tardieu, M.; Aptel, S.; Guibal, A. Percutaneous thermal ablation of primary and secondary lung tumors: Comparison between microwave and radiofrequency ablation. Diagn. Interv. Imaging 2019, 100, 781–791. [Google Scholar] [CrossRef] [PubMed]
- Kodama, H.; Ueshima, E.; Howk, K.; Lee, S.; Erinjeri, J.; Solomon, S.; Srimathveeravalli, G. Temporal evaluation of the microwave ablation zone and comparison of CT and gross sizes during the first month post-ablation in swine lung. Diagn. Interv. Imaging 2019, 100, 279–285. [Google Scholar] [CrossRef]
- Liu, D.; Brace, C.L. CT imaging during microwave ablation: Analysis of spatial and temporal tissue contraction. Med. Phys. 2014, 41, 113303. [Google Scholar] [CrossRef] [PubMed]
- Sommer, C.M.; Sommer, S.A.; Mokry, T.; Gockner, T.; Gnutzmann, D.; Bellemann, N.; Schmitz, A.; Radeleff, B.A.; Kauczor, H.U.; Stampfl, U.; et al. Quantification of Tissue Shrinkage and Dehydration Caused by Microwave Ablation: Experimental Study in Kidneys for the Estimation of Effective Coagulation Volume. J. Vasc. Interv. Radiol. 2013, 24, 1241–1248. [Google Scholar] [CrossRef] [PubMed]
- Brace, C.L.; Diaz, T.A.; Hinshaw, J.L.; Lee, F.T. Tissue Contraction Caused by Radiofrequency and Microwave Ablation: A Laboratory Study in Liver and Lung. J. Vasc. Interv. Radiol. 2010, 21, 1280–1286. [Google Scholar] [CrossRef] [PubMed]
- Cornelis, F.; Korenbaum, C.; Ben Ammar, M.; Tavolaro, S.; Nouri-Neuville, M.; Lotz, J. Multimodal image-guided electrochemotherapy of unresectable liver metastasis from renal cell cancer. Diagn. Interv. Imaging 2019, 100, 309–311. [Google Scholar] [CrossRef] [PubMed]


| Data | Total Group | HLG | CLG | p-Value |
|---|---|---|---|---|
| Patients (n) | 46 | 28 | 18 | - |
| Lesions (n) | 77 | 42 | 35 | - |
| Age (yrs) | 66.49 ± 9.90 | 66.90 ± 9.47 | 66.00 ± 10.50 | 0.692 |
| Gender (M/F) | 54/23 (70.1/29.9) | 22/20 (52.4/47.6) | 32/3 (91.4/8.6) | <0.001 |
| MWA protocol (A/B/C/D/E/F/G) | 22/23/1/3/25/1/2 (28.57/29.87/1.30/3.90/32.47/1.30/2.60) | 15/9/1/1/13/1/2 (35.71/21.43/2.38/2.38/30.95/2.38/4.76) | 7/14/0/2/12/0/0 (20.00/40.00/0.00/5.71/34.29/0.00/0.00) | 0.253 |
| MWA applications | 1.36 ± 0.48 | 1.31 ± 0.48 | 1.43 ± 0.50 | 0.286 |
| Tumor diameter (mm) | 24.18 ± 9.99 | 20.67 ± 8.84 | 28.40 ± 9.75 | <0.001 |
| Ablation Zone Parameters | HLG (n = 42) | CLG (n = 35) | Main Effects and Interactions | ||||
|---|---|---|---|---|---|---|---|
| Baseline | Follow-Up | Baseline | Follow-Up | Group | Time | Group by Time | |
| LAD | 38.76 ± 10.24 (19–60) | 34.31 ± 9.80 (15–55) | 42.37 ± 8.08 (28–66) | 37.29 ± 7.70 (23–62) | F = 2.905, p = 0.092 | F = 31.815, p < 0.001 | F = 2.779, p = 0.100 |
| SAD-1 | 26.67 ± 8.41 (11–46) | 22.69 ± 7.80 (7–40) | 30.03 ± 7.75 (14–45) | 26.29 ± 7.58 (12–42) | F = 5.416, p = 0.023 | F = 25.067, p < 0.001 | F = 0.029, p = 0.864 |
| SAD-2 | 27.69 ± 8.78 (12–45) | 23.76 ± 8.32 (11–40) | 31.86 ± 8.02 (17–48) | 27.80 ± 7.07 (14–45) | F = 6.896, p = 0.010 | F = 16.807, p < 0.001 | F = 0.182, p = 0.671 |
| mSAD | 27.18 ± 8.26 (13.50–45.50) | 23.23 ± 7.73 (11.00–39.50) | 30.94 ± 7.14 (17–46.50) | 27.04 ± 6.74 (15–43.50) | F = 6.943, p = 0.010 | F = 27.376, p < 0.001 | F = 0.038, p = 0.846 |
| mSPH | 0.71 ± 0.13 (0.39–1.00) | 0.68 ± 0.13 (0.36–0.94) | 0.74 ± 0.13 (0.46–1.00) | 0.73 ± 0.15 (0.43–0.98) | F = 3.311, p = 0.073 | F = 1.214, p = 0.274 | F = 4.211, p = 0.044 |
Publisher’s Note: MDPI stays neutral with regard to jurisdictional claims in published maps and institutional affiliations. |
© 2021 by the authors. Licensee MDPI, Basel, Switzerland. This article is an open access article distributed under the terms and conditions of the Creative Commons Attribution (CC BY) license (https://creativecommons.org/licenses/by/4.0/).
Share and Cite
Tsochatzis, A.; Mazioti, A.; Iliadis, G.; Velonakis, G.; Efthymiou, E.; Kelekis, A.; Kelekis, N.; Filippiadis, D. Percutaneous Microwave Ablation of Liver Lesions: Differences on the Sphericity Index of the Ablation Zone between Cirrhotic and Healthy Liver Parenchyma. Diagnostics 2021, 11, 655. https://doi.org/10.3390/diagnostics11040655
Tsochatzis A, Mazioti A, Iliadis G, Velonakis G, Efthymiou E, Kelekis A, Kelekis N, Filippiadis D. Percutaneous Microwave Ablation of Liver Lesions: Differences on the Sphericity Index of the Ablation Zone between Cirrhotic and Healthy Liver Parenchyma. Diagnostics. 2021; 11(4):655. https://doi.org/10.3390/diagnostics11040655
Chicago/Turabian StyleTsochatzis, Athanasios, Argyro Mazioti, Georgios Iliadis, Georgios Velonakis, Evgenia Efthymiou, Alexis Kelekis, Nikolaos Kelekis, and Dimitrios Filippiadis. 2021. "Percutaneous Microwave Ablation of Liver Lesions: Differences on the Sphericity Index of the Ablation Zone between Cirrhotic and Healthy Liver Parenchyma" Diagnostics 11, no. 4: 655. https://doi.org/10.3390/diagnostics11040655
APA StyleTsochatzis, A., Mazioti, A., Iliadis, G., Velonakis, G., Efthymiou, E., Kelekis, A., Kelekis, N., & Filippiadis, D. (2021). Percutaneous Microwave Ablation of Liver Lesions: Differences on the Sphericity Index of the Ablation Zone between Cirrhotic and Healthy Liver Parenchyma. Diagnostics, 11(4), 655. https://doi.org/10.3390/diagnostics11040655