
Changes in Salivary Amylase and Glucose in Diabetes: A Scoping Review

 ,
,  ,
,  ,
,  and
and 
Abstract
1. Introduction
2. Materials and Methods
Data Extraction
3. Results
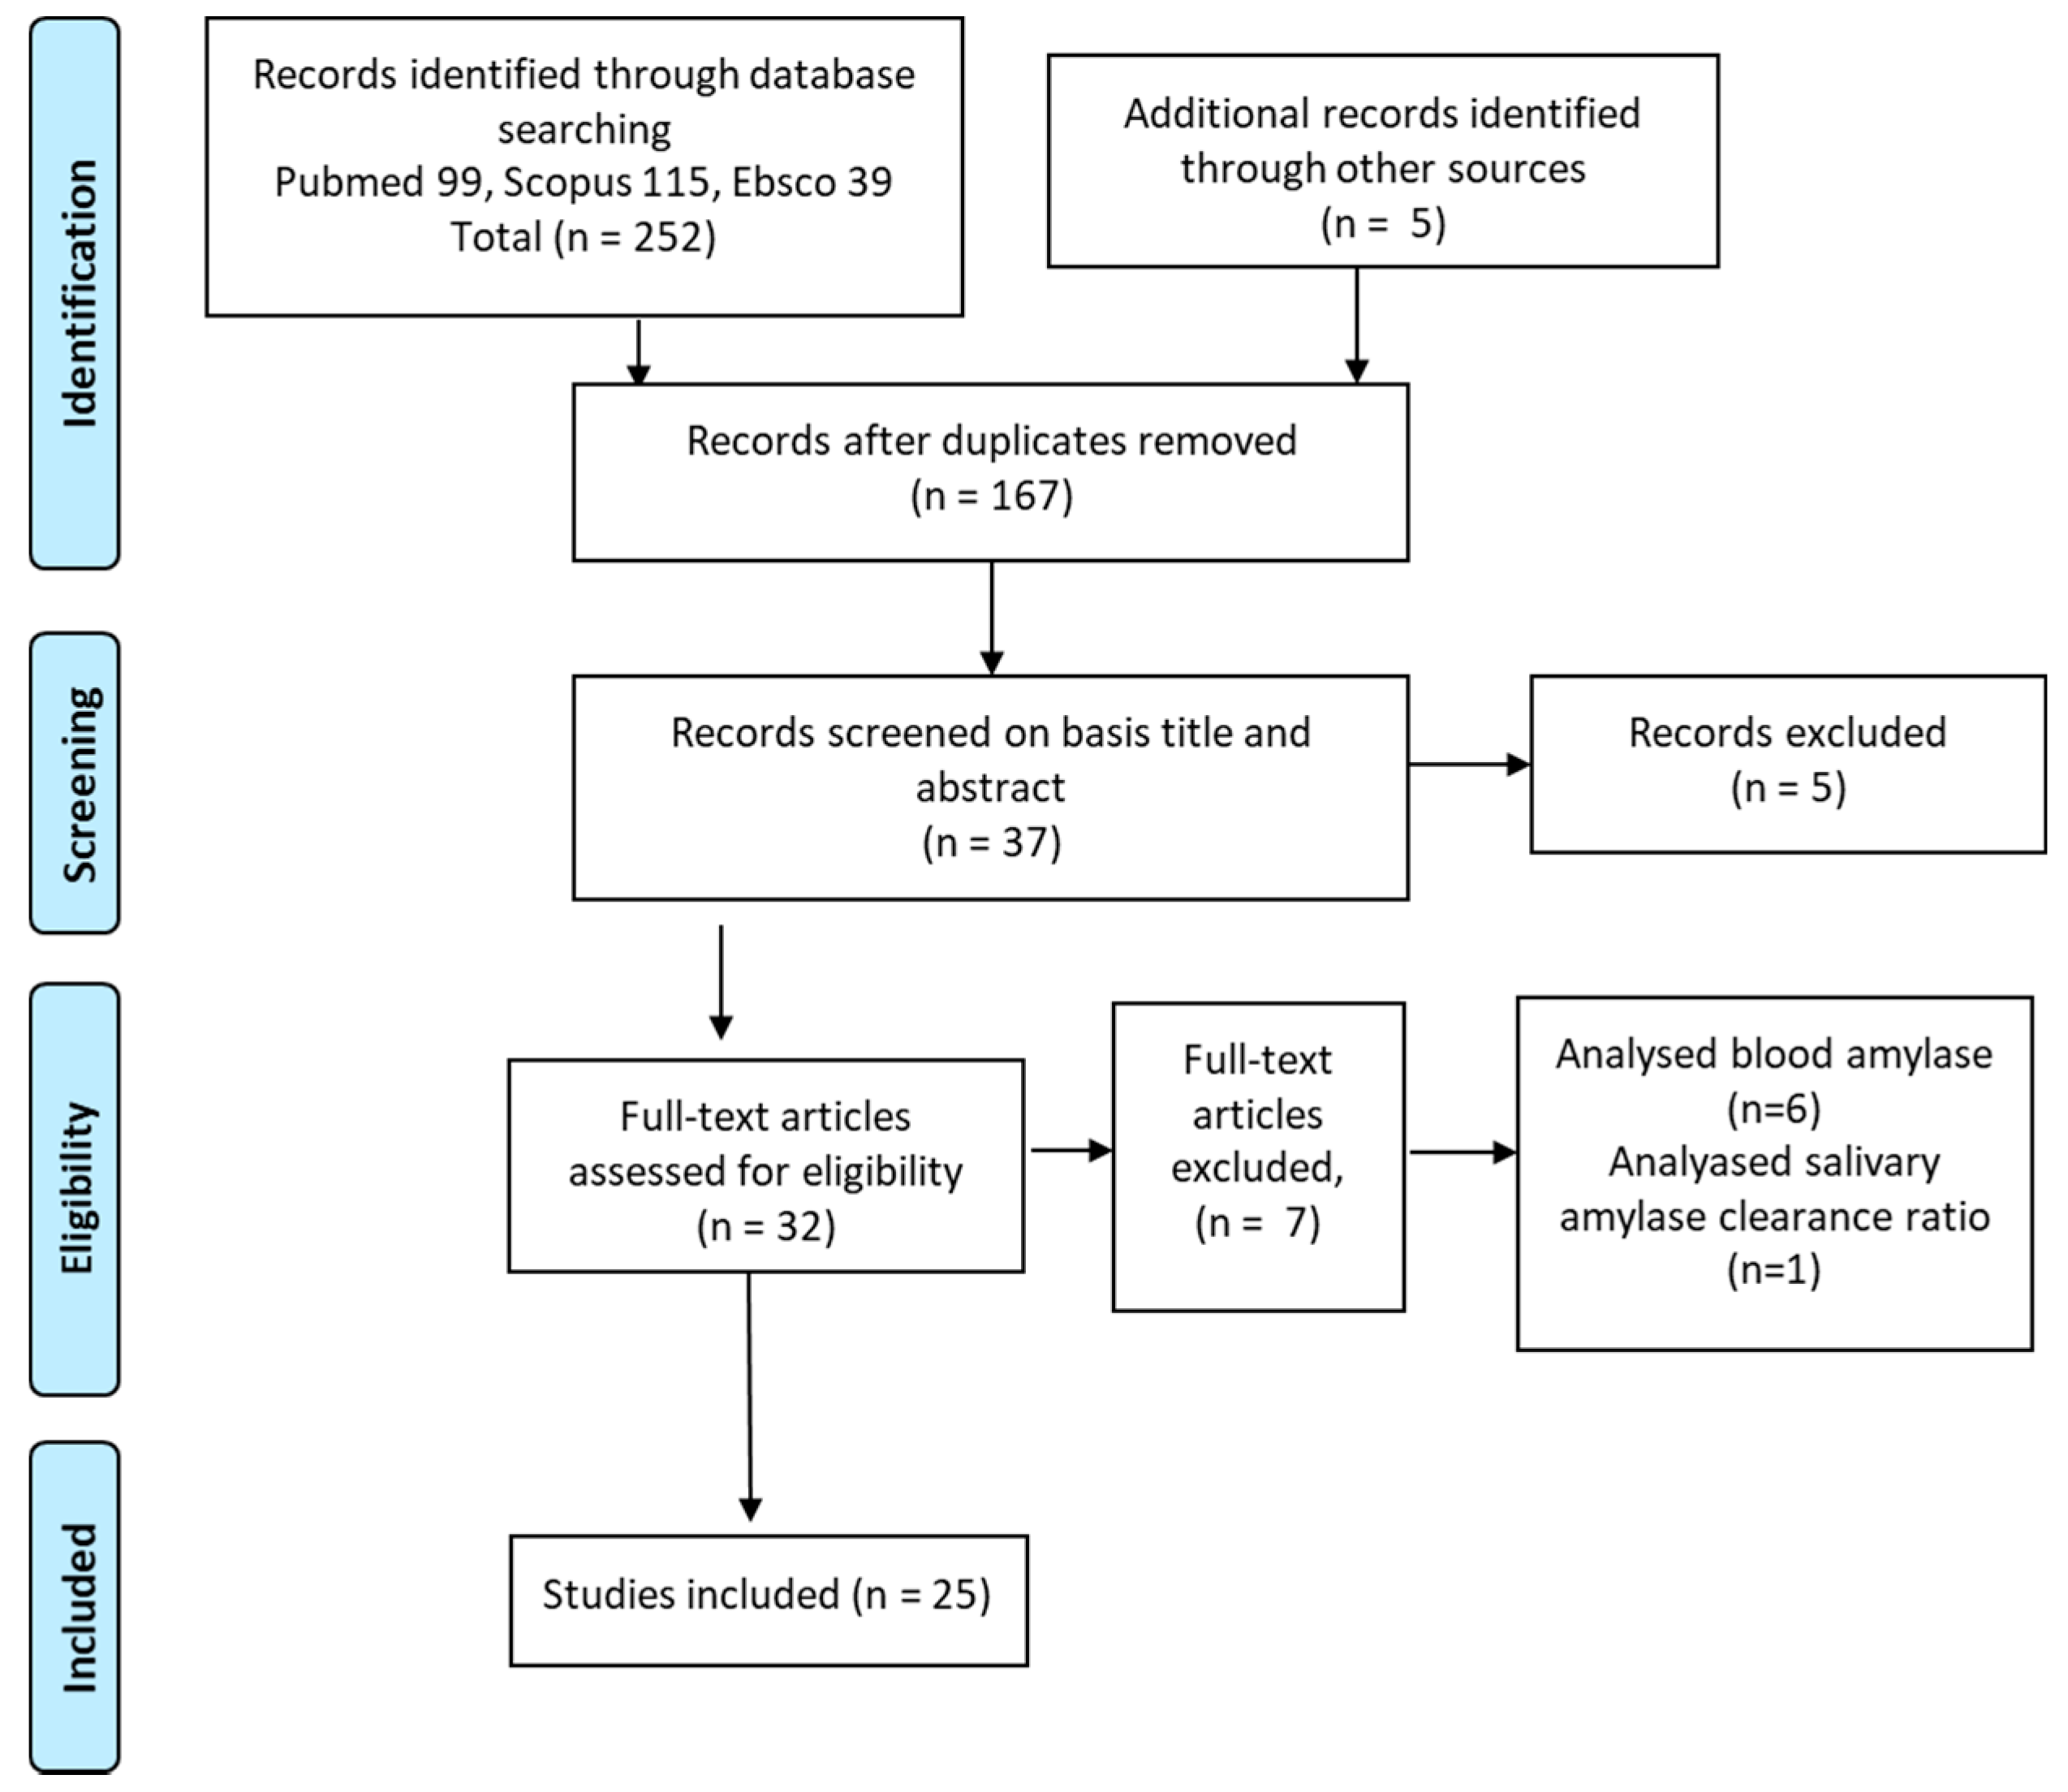
3.1. Summary of Identified Studies
3.2. Main Characteristics of the Studies’ Subjects
3.3. Saliva and Blood Sampling
3.3.1. Salivary Flow Rate in DM
3.3.2. Salivary Amylase Levels
3.3.3. Salivary Glucose Levels and Hb1ac Levels
3.3.4. Correlations between Salivary Amylase and Blood Glucose Levels
3.3.5. Enzymatic Activity of Salivary Amylase in Diabetics
3.3.6. Correlation between Salivary Amylase and Diabetic Complications
4. Discussion
5. Conclusions
Author Contributions
Funding
Institutional Review Board Statement
Informed Consent Statement
Conflicts of Interest
References
- Peters, S.A.E.; Woodward, M. Sex Differences in the Burden and Complications of Diabetes. Curr. Diab. Rep. 2018, 18, 33. [Google Scholar] [CrossRef] [PubMed]
- Boulton, A.J.; Vileikyte, L.; Ragnarson-Tennvall, G.; Apelqvist, J. The global burden of diabetic foot disease. Lancet 2005, 366, 1719–1724. [Google Scholar] [CrossRef]
- Cho, N.H.; Shaw, J.E.; Karuranga, S.; Huang, Y.; da Rocha Fernandes, J.D.; Ohlrogge, A.W.; Malanda, B. IDF Diabetes Atlas: Global estimates of diabetes prevalence for 2017 and projections for 2045. Diabetes Res. Clin. Pract. 2018, 138, 271–281. [Google Scholar] [CrossRef]
- Florkowski, C.; Don-Wauchope, A.; Gimenez, N.; Rodriguez-Capote, K.; Wils, J.; Zemlin, A. Point-of-care testing (POCT) and evidence-based laboratory medicine (EBLM)—Does it leverage any advantage in clinical decision making? Crit. Rev. Clin. Lab. Sci. 2017, 54, 471–494. [Google Scholar] [CrossRef] [PubMed]
- McLenon, J.; Rogers, M.A.M. The fear of needles: A systematic review and meta-analysis. J. Adv. Nurs. 2019, 75, 30–42. [Google Scholar] [CrossRef] [PubMed]
- Kanehisa, M.; Kawashima, C.; Nakanishi, M.; Okamoto, K.; Oshita, H.; Masuda, K.; Takita, F.; Izumi, T.; Inoue, A.; Ishitobi, Y.; et al. Gender differences in automatic thoughts and cortisol and alpha-amylase responses to acute psychosocial stress in patients with obsessive-compulsive personality disorder. J. Affect. Disord. 2017, 217, 1–7. [Google Scholar] [CrossRef]
- Kawano, A.; Tanaka, Y.; Ishitobi, Y.; Maruyama, Y.; Ando, T.; Inoue, A.; Okamoto, S.; Imanaga, J.; Kanehisa, M.; Higuma, H.; et al. Salivary alpha-amylase and cortisol responsiveness following electrical stimulation stress in obsessive-compulsive disorder patients. Psychiatry Res. 2013, 209, 85–90. [Google Scholar] [CrossRef]
- Panchbhai, A.S. Correlation of Salivary Glucose Level with Blood Glucose Level in Diabetes Mellitus. J. Oral Maxillofac. Res. 2012, 3. [Google Scholar] [CrossRef]
- Deneva, T.; Ianakiev, Y.; Keskinova, D. Burnout syndrome in physicians—Psychological assessment and biomarker research. Medicina 2019, 55, 209. [Google Scholar] [CrossRef]
- Tiongco, R.E.G.; Arceo, E.S.; Rivera, N.S.; Flake, C.C.D.; Policarpio, A.R. Estimation of salivary glucose, amylase, calcium, and phosphorus among non-diabetics and diabetics: Potential identification of non-invasive diagnostic markers. Diabetes Metab. Syndr. 2019, 13, 2601–2605. [Google Scholar] [CrossRef]
- Malathi, L.; Masthan, K.M.K.; Balachander, N.; Aravindha Babu, N.; Rajesh, E. Estimation of salivary amylase in diabetic patients and saliva as a diagnostic tool in early diabetic patients. J. Clin. Diagn. Res. 2013, 7, 2634–2636. [Google Scholar] [CrossRef]
- Satish, B.N.V.S.; Srikala, P.; Maharudrappa, B.; Awanti, S.M.; Kumar, P.; Hugar, D. Saliva: A tool in assessing glucose levels in Diabetes Mellitus. J. Int. Oral Health JIOH 2014, 6, 114–117. [Google Scholar]
- Ephraim, R.K.D.; Anto, E.O.; Acheampong, E.; Fondjo, L.A.; Barnie, R.B.; Sakyi, S.A.; Asare, A. Fasting salivary glucose levels is not a better measure for identifying diabetes mellitus than serum or capillary blood glucose levels: Comparison in a Ghanaian population. Heliyon 2019, 5. [Google Scholar] [CrossRef]
- Patel, B.J.; Dave, B.; Dave, D.; Karmakar, P.; Shah, M.; Sarvaiya, B. Comparison and Correlation of Glucose Levels in Serum and Saliva of Both Diabetic and Non-diabetic Patients. J. Int. Oral Health JIOH 2015, 7, 70–76. [Google Scholar]
- Nakamoto, I.; Morimoto, K.; Takeshita, T.; Toda, M. Correlation between saliva glycated and blood glycated proteins. In Environmental Health and Preventive Medicine; Japanese Society for Hygiene: Kyoto, Japan, 2003; Volume 8, pp. 95–99. [Google Scholar]
- Rao, P.V.; Laurie, A.; Bean, E.S.; Roberts, C.T.J.; Nagalla, S.R. Salivary protein glycosylation as a noninvasive biomarker for assessment of glycemia. J. Diabetes Sci. Technol. 2015, 9, 97–104. [Google Scholar] [CrossRef] [PubMed]
- Mandel, A.L.; Breslin, P.A.S. High endogenous salivary amylase activity is associated with improved glycemic homeostasis following starch ingestion in adults. J. Nutr. 2012, 142, 853–858. [Google Scholar] [CrossRef] [PubMed]
- Ali, N.; Nater, U.M. Salivary Alpha-Amylase as a Biomarker of Stress in Behavioral Medicine. Int. J. Behav. Med. 2020, 27, 337–342. [Google Scholar] [CrossRef] [PubMed]
- Chojnowska, S.; Ptaszyńska-Sarosiek, I.; Kępka, A.; Knaś, M.; Waszkiewicz, N. Salivary Biomarkers of Stress, Anxiety and Depression. J. Clin. Med. 2021, 10, 517. [Google Scholar] [CrossRef] [PubMed]
- Nater, U.M.; La Marca, R.; Florin, L.; Moses, A.; Langhans, W.; Koller, M.M.; Ehlert, U. Stress-induced changes in human salivary alpha-amylase activity—Associations with adrenergic activity. Psychoneuroendocrinology 2006, 31, 49–58. [Google Scholar] [CrossRef] [PubMed]
- Vasconcelos, A.C.U.; Soares, M.S.M.; Almeida, P.C.; Soares, T.C. Comparative study of the concentration of salivary and blood glucose in type 2 diabetic patients. J. Oral Sci. 2010, 52, 293–298. [Google Scholar] [CrossRef] [PubMed]
- Warshaw, A.L.; Feller, E.R.; Lee, K.H. On the cause of raised serum-amylase in diabetic ketoacidosis. Lancet 1977, 1, 929–931. [Google Scholar] [CrossRef]
- Møller-Petersen, J.; Andersen, P.T.; Hjørne, N.; Ditzel, J. Hyperamylasemia, specific pancreatic enzymes, and hypoxanthine during recovery from diabetic ketoacidosis. Clin. Chem. 1985, 31, 2001–2004. [Google Scholar] [CrossRef] [PubMed]
- Kameya, A.; Hayakawa, T.; Noda, A.; Kondo, T. Differential determination of serum isoamylase using an amylase inhibitor and its clinical application. Am. J. Gastroenterol. 1985, 80, 54–59. [Google Scholar] [PubMed]
- Kjaergaard, J.J.; Salling, N.; Magid, E.; Ditzel, J. Serum amylase during recovery from diabetic ketoacidosis. Diabete Metab. 1984, 10, 25–30. [Google Scholar] [PubMed]
- Recio, F.; Villamil, F. Charge selectivity and urine amylase isoenzymes. Kidney Int. Suppl. 1994, 47, S89–S92. [Google Scholar] [PubMed]
- Thum, C.N.; Oelbaum, R.S.; Foo, A.Y.; Rosalki, S.B. Renal isoamylase clearance as a measure of altered renal charge selectivity in patients with diabetes mellitus. Ann. Clin. Biochem. 1993, 30 Pt 5, 449–453. [Google Scholar] [CrossRef]
- Piras, M.; AR, H.; MI, M.; Piludu, M. Amylase and cyclic amp receptor protein expression in human diabetic parotid glands. J. Oral Pathol. Med. 2010, 39, 715–721. [Google Scholar] [CrossRef]
- Reuterving, C.O.; Reuterving, G.; Hagg, E.; Ericson, T. Salivary flow rate and salivary glucose concentration in patients with diabetes mellitus influence of severity of diabetes. Diabete Metab. 1987, 13, 457–462. [Google Scholar]
- Kheirmand Parizi, M.; Akbari, H.; Malek-Mohamadi, M.; Kheirmand Parizi, M.; Kakoei, S. Association of salivary levels of immunoglobulin-a and amylase with oral-dental manifestations in patients with controlled and non-controlled type 2 diabetes. BMC Oral Health 2019, 19, 175. [Google Scholar] [CrossRef]
- Panchbhai, A.S.; Degwekar, S.S.; Bhowte, R.R. Estimation of salivary glucose, salivary amylase, salivary total protein and salivary flow rate in diabetics in India. J. Oral Sci. 2010, 52, 359–368. [Google Scholar] [CrossRef]
- Reznick, A.Z.; Shehadeh, N.; Shafir, Y.; Nagler, R.M. Free radicals related effects and antioxidants in saliva and serum of adolescents with Type 1 diabetes mellitus. Arch. Oral Biol. 2006, 51, 640–648. [Google Scholar] [CrossRef]
- Priya, S.; Bharani, D.G.; Nagalingam, M.; Jayanthi, M.; Kanagavalli, M. Potential of Salivary Protein as a Biomarker in prognosis of Diabetes mellitus. J. Pharm. Res. 2011, 4, 2228–2229. [Google Scholar]
- Aydin, S. A comparison of ghrelin, glucose, alpha-amylase and protein levels in saliva from diabetics. J. Biochem. Mol. Biol. 2007, 40, 29–35. [Google Scholar] [CrossRef]
- Newrick, P.G.; Bowman, C.; Green, D.; O’Brien, I.A.; Porter, S.R.; Scully, C.; Corrall, R.J. Parotid salivary secretion in diabetic autonomic neuropathy. J. Diabet. Complicat. 1991, 5, 35–37. [Google Scholar] [CrossRef]
- Abd-Elraheem, S.E.; El Saeed, A.M.; Mansour, H.H. Salivary changes in type 2 diabetic patients. Diabetes Metab. Syndr. 2017, 11 (Suppl. 2), S637–S641. [Google Scholar] [CrossRef] [PubMed]
- Ben-Aryeh, H.; Cohen, M.; Kanter, Y.; Szargel, R.; Laufer, D. Salivary composition in diabetic patients. J. Diabet. Complicat. 1988, 2, 96–99. [Google Scholar] [CrossRef]
- Border, M.B.; Schwartz, S.; Carlson, J.; Dibble, C.F.; Kohltfarber, H.; Offenbacher, S.; Buse, J.B.; Bencharit, S. Exploring salivary proteomes in edentulous patients with type 2 diabetes. Mol. Biosyst. 2012, 8, 1304–1310. [Google Scholar] [CrossRef]
- Indira, M.; Chandrashekar, P.; Kattappagari, K.K.; Chandra, L.P.K.; Chitturi, R.T.; Bv, R.R. Evaluation of salivary glucose, amylase, and total protein in Type 2 diabetes mellitus patients. Indian J. Dent. Res. Off. Publ. Indian Soc. Dent. Res. 2015, 26, 271–275. [Google Scholar] [CrossRef]
- Ladgotra, A.; Verma, P.; Raj, S.S. Estimation of salivary and serum biomarkers in diabetic and non diabetic patients—A comparative study. J. Clin. Diagn. Res. 2016, 10, ZC56–ZC61. [Google Scholar] [CrossRef]
- Lima-Aragão, M.V.V.; de Oliveira-Junior, J.d.J.; Maciel, M.C.G.; Silva, L.A.; do Nascimento, F.R.F.; Guerra, R.N.M. Salivary profile in diabetic patients: Biochemical and immunological evaluation. BMC Res. Notes 2016, 9, 103. [Google Scholar] [CrossRef]
- Choukaife, A.E. Secretion, Sodium, Potassium, Protein, IgA and Amylase in Different Types of Diabetic Saliva. Int. Med. J. 2018, 25, 79–82. [Google Scholar]
- Dodds, M.W.; Dodds, A.P. Effects of glycemic control on saliva flow rates and protein composition in non-insulin-dependent diabetes mellitus. Oral Surg. Oral Med. Oral Pathol. Oral Radiol. Endod. 1997, 83, 465–470. [Google Scholar] [CrossRef]
- Siddiqui, A.; Madhu, S.V.; Sharma, S.B.; Desai, N.G. Endocrine stress responses and risk of type 2 diabetes mellitus. Stress 2015, 18, 498–506. [Google Scholar] [CrossRef]
- Yavuzyilmaz, E.; Yumak, O.; Akdoğanli, T.; Yamalik, N.; Ozer, N.; Ersoy, F.; Yeniay, I. The alterations of whole saliva constituents in patients with diabetes mellitus. Aust. Dent. J. 1996, 41, 193–197. [Google Scholar] [CrossRef]
- Tenovuo, J.; Lehtonen, O.P.; Viikari, J.; Larjava, H.; Vilja, P.; Tuohimaa, P. Immunoglobulins and innate antimicrobial factors in whole saliva of patients with insulin-dependent diabetes mellitus. J. Dent. Res. 1986, 65, 62–66. [Google Scholar] [CrossRef]
- Artino, M.; Dragomir, M.; Ionescu, S.; Bădiţa, D.; Niţă, V.; Chiţoi, E. Diurnal behaviour of some salivary parameters in patients with diabetes mellitus (protein concentration, amylase activity, density)—Note I. Rom. J. Physiol. Physiol. Sci. 1998, 35, 79–84. [Google Scholar]
- López, M.E.; Colloca, M.E.; Páez, R.G.; Schallmach, J.N.; Koss, M.A.; Chervonagura, A. Salivary characteristics of diabetic children. Braz. Dent. J. 2003, 14, 26–31. [Google Scholar] [CrossRef] [PubMed]
- Hirtz, C.; Chevalier, F.; Sommerer, N.; Raingeard, I.; Bringer, J.; Rossignol, M.; De Périère, D.D. Salivary protein profiling in type 1 diabetes using two-dimensional electrophoresis and mass spectrometry. Clin. Proteom. 2006, 2, 117–128. [Google Scholar] [CrossRef]
- Prathibha, K.M.; Johnson, P.; Ganesh, M.; Subhashini, A.S. Evaluation of Salivary Profile among Adult Type 2 Diabetes Mellitus Patients in South India. J. Clin. Diagn. Res. 2013, 7, 1592–1595. [Google Scholar] [CrossRef] [PubMed]
- Ohta, J.; Noda, N.; Sakurada, K. Comparison of Catalytic and Immunological Amylase Tests for Identifying of Saliva from Degraded Samples. J. Forensic Sci. 2019, 64, 873–877. [Google Scholar] [CrossRef] [PubMed]
- Valls, C.; Rojas, C.; Pujadas, G.; Garcia-Vallve, S.; Mulero, M. Characterization of the activity and stability of amylase from saliva and detergent: Laboratory practicals for studying the activity and stability of amylase from saliva and various commercial detergents. Biochem. Mol. Biol. Educ. 2012, 40, 254–265. [Google Scholar] [CrossRef]
- Duong, V.A.; Park, J.M.; Lee, H. Review of three-dimensional liquid chromatography platforms for bottom-up proteomics. Int. J. Mol. Sci. 2020, 21, 1524. [Google Scholar] [CrossRef]
- Sánchez Martínez, M.P. La Saliva Como Fluido Diagnóstico. Available online: http://www.sepeap.org/archivos/libros/OTORRINO/7.pdf (accessed on 2 February 2021).
- Grand, R.J.; Montgomery, R.K.; Chitkara, D.K.; Büller, H.A. Carbohydrate and Lactose Malabsorption. In Encyclopedia of Gastroenterology; Elsevier: Amsterdam, The Netherlands, 2004; pp. 268–274. [Google Scholar]
- Nater, U.M.; Rohleder, N. Salivary alpha-amylase as a non-invasive biomarker for the sympathetic nervous system: Current state of research. Psychoneuroendocrinology 2009, 34, 486–496. [Google Scholar] [CrossRef]
- Bosch, J.A.; Veerman, E.C.I.; de Geus, E.J.; Proctor, G.B. A-Amylase as a Reliable and Convenient Measure of Sympathetic Activity: Don’t start salivating just yet! Psychoneuroendocrinology 2011, 36, 449–453. [Google Scholar] [CrossRef] [PubMed]
- Balan, P.; Babu, S.G.; Sucheta, K.N.; Shetty, S.R.; Rangare, A.L.; Castelino, R.L.; Fazil, A.K. Can saliva offer an advantage in monitoring of diabetes mellitus?—A case control study. J. Clin. Exp. Dent. 2014, 6, e335–e338. [Google Scholar] [CrossRef] [PubMed]
- Nagler, R.M.; Hershkovich, O.; Lischinsky, S.; Diamond, E.; Reznick, A.Z. Saliva analysis in the clinical setting: Revisiting an underused diagnostic tool. J. Investig. Med. 2002, 50, 214–225. [Google Scholar] [CrossRef] [PubMed]
- Scott, D.A.; Renaud, D.E.; Krishnasamy, S.; Meriç, P.; Buduneli, N.; Çetinkalp, Ş.; Liu, K.Z. Diabetes-related molecular signatures in infrared spectra of human saliva. Diabetol. Metab. Syndr. 2010, 2. [Google Scholar] [CrossRef] [PubMed]
- Tiongco, R.E.; Bituin, A.; Arceo, E.; Rivera, N.; Singian, E. Salivary glucose as a non-invasive biomarker of type 2 diabetes mellitus. J. Clin. Exp. Dent. 2018, 10, e902–e907. [Google Scholar] [CrossRef]
- Naseri, R.; Mozaffari, H.; Ramezani, M.; Sadeghi, M. Effect of diabetes mellitus type 2 on salivary glucose, immunoglobulin A, total protein, and amylase levels in adults: A systematic review and meta-analysis of case-control studies. J. Res. Med. Sci. 2018, 23, 89. [Google Scholar]
- Peyrot des Gachons, C.; Breslin, P.A.S. Salivary Amylase: Digestion and Metabolic Syndrome. Curr. Diab. Rep. 2016, 16, 102. [Google Scholar] [CrossRef]
- Tumilasci, O.R.; Cersósimo, M.G.; Belforte, J.E.; Micheli, F.E.; Benarroch, E.E.; Pazo, J.H. Quantitative study of salivary secretion in Parkinson’s disease. Mov. Disord. 2006, 21, 660–667. [Google Scholar] [CrossRef] [PubMed]
- Valdez, I.H.; Fox, P.C. Interactions of the salivary and gastrointestinal systems. I. The role of saliva in digestion. Dig. Dis. 1991, 9, 125–132. [Google Scholar] [CrossRef]
- Ben-Aryeh, H.; Serouya, R.; Kanter, Y.; Szargel, R.; Laufer, D. Oral health and salivary composition in diabetic patients. J. Diabetes Complicat. 1993, 7, 57–62. [Google Scholar] [CrossRef]
- Fábián, T.K.; Hermann, P.; Beck, A.; Fejérdy, P.; Fábián, G. Salivary defense proteins: Their network and role in innate and acquired oral immunity. Int. J. Mol. Sci. 2012, 13, 4295–4320. [Google Scholar] [CrossRef] [PubMed]


| Author, Year | n (Patients/Controls) | Type of DM | DM Patients (Mean ± SD; Median (Range)/% Men) | Controls (Mean ± SD;Median(Range)/% Men) | Saliva Sampling | Stimulation for Saliva Sampling | Concomitant Blood Sampling |
|---|---|---|---|---|---|---|---|
| Abd-Elraheem et al., 2017 [36] | 20/20 | T2D | 47.6 ± 8.6/50 | 46.6 ± 8.4/50 | Fasting, between 7 and 8 a.m. | Unstimulated | Postprandrial |
| Artino et al., 1998 [47] | 17 ID, 14 NIDD/16 | IDD and NIDD | 39.7/47 ID, 56.4/50 DNID | 43.8/50 | Fasting before breakfast from 7:30 to 8:00 a.m.and fasting in the afternoon from 5:30 to 6:00 p.m. after at least 90 min of digestive rest | Unstimulated | NA |
| Aydin et al., 2007 [34] | 20 O, 20 NO/22 | T2D | 47/55 O, 48/50 NO | 49/45.5 | Fasting, at 8 a.m. before breakfast | Unstimulated | NA |
| Ben-Aryeh et al., 1988 [37] | 35/31 | T2D | 31.2 ± 7.4/57 | 29.0 ± 6.2/54.8 | Non-fasting 1 h after meal from 8 to 11 a.m. | Two samples, the first unstimulated and the second stimulated with citric acid | At the same time as saliva sampling |
| Border et al., 2012 [38] | 4/4 | T2D and edentulous | Total Range (55–75)/25% | NA | From 9 a.m. to 12 p.m., after 120 min without oral stimulus | Unstimulated | NA |
| Choukaife el al., 2018 [42] | 45/30 | NIDD | 30.7 ± 5.6/66.6 | 28.3 ± 5.4/66.6 | Non-fasting 1 h after meal from 8 to 11 a.m. | Two samples, the first unstimulated and the second stimulated with citric acid | Non-fasting |
| Dodds et al., [43] | 45/36 | NIDD | 50 ± 1.5/26.66 | 55.2 ± 1.7/36.11 | Fasting (2 h) | Unstimulated | Fasting |
| Hirtz et al., 2006 [49] | 8/8 | T1D poorly controlled (HbA1C > 8% and 5 years at least of DM) | 35.6 ± 9.9/75% | 34.7 ± 8.2/NA | Non-fasting, 2 h after breakfast time | Stimulated by chewingon paraffin wax | NA |
| Indira et al., 2013 [39] | 20/20 | T2D | 50.38 ± 6.57/50% | Non-fasting, 2 h after breakfast time | Unstimulated | NA | |
| Kheirmand Parizi et al., 2019 [30] | 30 U, 30 C/30 | T2D | 55.16 ± 2.2/33.3 U,50.76 ± 1.97/43.3 C | 49 ± 1.4/46.6 | Non-fasting 1 h after meal from 8 to 11 a.m. | Unstimulated | NA |
| Landgrota et al., 2016 [40] | 60/60 | T1D and T2D | 52.32 ± 8.05/68.3 | 48.33 ± 7.30/53.3 | Non-fasting, 2 h after breakfast time, from 9 to 11 a.m. | Unstimulated | Fasting |
| Lima-Aragão, 2016 [41] | 88/39 | T1D and T2D | 52 ± 18/64.8 | 23 ± 6/43.6 | Non-fasting | Unstimulated | NA |
| López et al., 2003 [48] | 20/21 | T1D | 9.4 ± 3.9/45 | 8.3± 1.8/42.9 | Fasting | Unstimulated | NA |
| Malathi et al., 2013 [11] | 33/34 | T2D NIDD | 47.21 ± 7.82/50 | 46.44 ± 7.5/50 | NA | NA | Fasting and postpandrial |
| Newrick et al., [35] | 8NP,8NNP/8 | NA | 53 (32–78) NP/NA, 55 (35–83)NNP/NA | 23 (18–30) | Non-fasting after a normal breakfast | Stimulated with citric acid | NA |
| Panchbhai et al., 2010 [31] | 40 U, 40 C/40 | T1D and T2D | 48.50 ± 7.86/45 U49.50 ± 10.88/37.5 C | 46.12 ± 10.25/40 | Non-fasting after 1 h meal from 8 to 11 a.m. | Two samples, the first unstimulated and the second stimulated with citric acid | Na |
| Prathibba et al., 2013 [50] | 30/30 | T2D | 48.14 (53.3) | 44.44/46.6 | Fasting between 7 and 8:30 a.m. | Unstimulated | NA |
| Piras et al., 2010 [28] | 4 T1D, 5 T2D/11 | T1D and T2D | Total Range (42–68) | - | Biopsia of parotid gland | - | NA |
| Reuterving et al., 1987 [29] | 11/NA | T1D and T2D | 28.7/72.7 | NA | Fasting after 1 h meal before noon | Stimulated by parafilm | Fasting after 1 h eating |
| Reznick et al., 2006 [32] | 11 U, 9 C/12 | NA | 15.1/50 U, 15/45.5 C | 16.5/44.4 | In the morning after 90 min without oral stimulus | Unstimulated | NA |
| Sathyapriya et al., 2016 [33] | 60/25 | T1D and T2D | 56.5 ± 14.3/50 | 46.6 ± 18.2/50 | Fasting from 8 to 11 a.m. | Unstimulated | Fasting, at 8 to 11 a.m. |
| Siddiqui et al., 2015 [44] | 125/125 | NIDD | 46.91 ± 8.3/37.6 | 43.74 ± 7.54/34.4 | Fasting at 8:00 a.m. | Unstimulated | Fasting and postpandrial |
| Tenovuo et al., 1986 [46] | 35/35 | IDD | 30.4 (17–61)/68.57 | Age and sex matched | Non-fasting after 1 h meal from 8 to 11 a.m. | Stimulated by parafilm | NA |
| Tiongco et al., 2019 [10] | 25/55 | NA | NA | NA | NA | Unstimulated | NA |
| Yavuzyilmaz et al., 1996 [45] | 17/17 | IDD and NIDD | 54.23 ± 15.82/58.8 | 23.17 ± 3.26/41.4 | Non-fasting after 1 h meal from 8 to 11 a.m. | Unstimulated | NA |
| Author, Year | S-Amylase Units | S-Amylase Diabetics vs. Controls (Mean ± SD or Median (Range)) | S-Amylase Diabetics vs. Controls | Flow rate (Mean ±SD or Median (Range)) (ml/min) | S-Glucose Diabetics vs. Controls (Mean ±SD or Median (Range)) (mg/dL) | Blood Glucose Diabetics vs. Controls (Mean ± SD or Median (Range)) (mg/dL) | Hb1AC Diabetics vs. Controls (Mean ± SD or Median (Range)) (%) | S-Amylase and S-Glucose Corre elations | S-Amylase and Blood Glucose Correlations | Other |
|---|---|---|---|---|---|---|---|---|---|---|
| Abd-Elraheem et al., 2017 [36] | U/L | 2164.3 ± 578.2 vs. 885 ± 434 *** | Higher *** | NA | 10.9 ± 10.11 vs. 4.8 ± 0.62 *** | PPBG 287 ± 34.65 vs. 122.2 ± 9.34 *** | 7.22 ± 1.25 vs. 2.86 ± 0.56 *** | NS | NA | NS differences by sex and age in both groups |
| Artino et al., 1998 [47] | UI/L/g protein | Morning: 25,000 IDD, 175,000 NIDD vs. 190,000 ¥ Afternoon: 51,000 IDD, 390,000 NIDD vs. 40,500 ¥ | NS | NA | NA | NA | NA | NA | NA | The increase in the salivary flow rate in the afternoon is accompanied by a decline in S-total protein concentration |
| Aydin et al., 2007 [34] | U/mL | 628 ± 62 O, 612 ± 57 NO vs. 494 ± 44 O vs. Controls **, O vs. NO*, NO vs. Controls * | Higher * | 0.97 ± 0.2 O, 1.09 ± 0.1 NO vs. 1.2 ± 0.3 | 3.9 ± 0.8 O, 3.8 ± 0.6 NO vs. 1.3 ± 0.3 O vs. C **, O vs. NO*, NO vs. C * | NA | NA | NA | NA | No differences between groups in total protein |
| Border et al., 2012 [38] | Spots | NA | Lower * | NA | NA | NA | NA | NA | NA | Reduced expression of salivary amylase in pooled samples from patients with diabetes compared to pooled control sample |
| Indira et al., 2013 [39] | U/mL | 107.66 ± 28.60 vs. 154.96 ± 25.07 *** | Lower *** | NA | 8.4 ± 4.59 vs. 1.65 ± 0.30 *** | 282.25 ± 42.81vs 109.55 ± 11.19 *** | NA | r = −0.3328, NS | r = −0.3098, NS | Significant differences were found in S-total protein content, and correlations were found between S-total protein and S-amylase (r = 0.4842)* and S-glucose (r = −0.5181)* |
| Kheirmand Parizi et al., 2019 [30] | U/L | 161,852 U vs. 95,793 C vs. 63,295 *** U vs. controls ** U vs. C | Higher *** | NA | NA | NA | r = −0.172 U, r = −0.166 C r = −0.096 Controls, NS | NA | r = −0.293 U, r = −0.222 C r = 0.096 Controls, NS | No correlation in S-amylase content by sex and age in both groups |
| Lodgrota et al., 2016 [40] | 1671.42 ± 569.86 vs1397.59 ± 415.97 | Higher ** | NA | 14.10 ± 6.99 vs. 5.87 ± 2.42 *** | 211.50 ± 43.82 88.81 ± 11.29 *** | NA | NA | NA | - | |
| Lima-Aragão, 2016 [41] | AU/dL | 37 ± 0.1 vs. 37 ± 0.4 ** | Higher ** | NA | 11 ± 2 vs. 3 ± 0.03 * | NA | NA | NA | NA | Nocorrelation between S-amylase by age |
| López et al., 2003 [48] | AU/dL | 58.8 ± 37.4 vs. 35.5 ± 16.8 ** | Higher ** | 0.2 ± 0.1 vs. 0.3 ± 0.1 *** | 2.1 ± 1.6 vs. 1.0 ± 1.0 ** | These parameters were inversely related to flow rate. | NA | NA | NA | NS differences in S-amylase by age S-glucose was poorly correlated with glycemia and with glycosylated hemoglobin; HbA1 S-amylase levels were lower than the levels in adults. |
| Malathi et al., 2013 [11] | U/L | 2739.48 ± 1525.2 vs. 1740.38 ± 638.51 *** | Higher *** | NA | NA | 173.88 ± 72.02 vs. 83.21 ± 9.84 ** PP 247.88 ± 86.37 vs. 141.62 ± 154.08 * | 7.79 ± 1.15 vs. 5.15 ± 0.60 *** | NA | NA | The oral findings of 30 non-insulin-dependent diabetic patients revealed 7 patients with poor oral hygiene and halitosis and 12 patients showed periodontitis.. The other patients showed mild to moderate gingivitis. |
| Panchbhai et al., 2010 [31] | U/mL | 108.48 ± 6.37 U vs. 100.83 ± 60.77 C vs. 146.72 ± 10.70* C vs. Controls | Lower* | Unst: 0.18 ± 0.12 U vs. 0.18 ± 0.14 C vs. 0.21 ± 0.20 St: 0.51 ± 0.27 U vs. 0.48 ± 0.29 C vs. 0.57 ± 0.35 | 8.09 ± 6.45 U vs. 7.65 ± 6.44 C vs. 1.89 ±1.44 ** U vs. Controls, C vs. Controls | NA | NA | With S-glucose * and S-total protein *** in U With S-total protein ** in C | No differences in S-amylase by sex between groups | |
| Prathibba et al., 2013 [50] | 19.20 ± 1.8 vs. 92.51 ± 13.74 | Lower ** | 0.46 ± 0.02 vs. 0.67 ± 0.04 ** | 17.31 ± 2.05 vs. 4.33 ± 0.29 *** | NA | NA | NA | NA | - | |
| Piras et al., año [28] | NA | 10.27 ± 0.67 T1D vs. 2.83 ± 0.41 T2D vs. 3.27 ± 0.63 ** T1D vs. Controls | Higher ** | NA | NA | NA | NA | NA | NA | - |
| Reznick et al., 2006 [32] | IU/L | 988 (187–2596) U vs. 333 (18–3670) C vs. 466 (4–1968) | NS P = 0.078 U vs. Controls | NA | NA | NA | NA | NA | NA | - |
| Sathyapriya et al., 2016 [33] | U/mL | G2 (<100 mg/dL) 102.32 ± 67.61, G3 (100–150 mg/dL) 106.83 ± 60.77, G4 (150–250 mg/dL)108.48 ± 6.37, G5 (>250 mg/dL) 111.12 ± 11.94/96.72 ± 10.70* | Higher * | NA | G2 (<100 mg/dL) 7.30 ± 5.84, G3 (100–150 mg/dL) 7.64 ± 6.44, G4 (150–250 mg/dL) 8.09 ± 6.45, G5 (>250 mg/dL) 9.04 ± 7.17/5.91 ± 2.19 * | NA | NA | NA | NA | A correlation was found between S-amylase and S-total protein |
| Siddiqui et al., 2015 [44] | nKat/L | 1.48 ± 1.15 vs. 1.24 ± 0.71 | NS | NA | NA | NA | NA | NS | with PPBG (r = 0.138) * | No correlation in S-amylase by sex |
| Tiongco et al., 2019 [10] | U/L | 930.8 ± 827.0 vs. 613.5 ± 667.3 * | Higher * | NA | 12.6 ± 10.5 vs. 5.4 ± 8.7 ** | 174.5 ± 92.7 vs. 94.1 ± 17.4 ** | S-glucose (r = 0.416) *** and FBG (r = 0.226) ** | NA | AUC for DM diagnoses en S-glucose 0.811 ** and S-amylase 0.649 * Blood amylase levels: 71.7 ±21.7 vs. 92.2 ± 97.2, NS | |
| Yavuzyilmaz et al., 1996 [45] | U/mL | 124.2 ± 79.7 vs. 228.2 ± 185.5 * | Lower * | NA | NA | 165 ± 51 vs. NA | NA | NA | NA | IDD 112.25 ± 76.37 NIDD 130.7 ± 82.2 |
| Author, year. | S-Amylase Units | S-Amylase Diabetics vs. Controls (Mean ± SD or Median (Range)) | S-Amylase Diabetics vs. Controls | Flow rate (Mean ± SD or Median (Range)) (ml/min) | S-Glucose Diabetics vs. Controls (Mean ± SD or Median (Range)) (mg/dL) | Blood Glucose Diabetics vs. Controls (Mean ± SD or Median (Range)) (mg/dL) | Hb1AC Diabetics vs. Controls (Mean ± SD or Median (Range)) (%) | S-Amylase and S-Glucose Correlations | S-Amylase and Blood Glucose Correlations | Other |
|---|---|---|---|---|---|---|---|---|---|---|
| Ben-Aryeh et al., 1988 [37] | 102 IU/£ | WR: 6026 ± 3753 vs. 6325 ± 4003 RP: 11,287 ± 3159 vs. 11,861 ± 4592 SP: 9930 ± 4089 vs. 11,200 ± 3140 | NS | 0.35 ± 0.24 vs. 0.48 ± 0.23 * | WR: 2.9 ± 5.8 vs. 1.5 ± 1.0 RP:3.2 ± 2.7 vs. 0.7 ± 0.6 *** SP: 1.9 ± 1.6 vs. 0.3 ± 0.3 *** | 236 ± 66 vs. 80 ± 10 *** | NA | NA | NA | No differences in amylase activity between groups. Significant correlation between S-amylase and total protein in the control group. |
| Choukaife el al., 2018 [42] | 102 IU/£ | WR: 5022 ± 2417 vs. 7590 ± 3652 RP:10,064 ± 4227 vs. 113,425 ± 66,457 SP:8697 ± 4125 vs. 12,465 ± 5920 | NS | 0,29 ± 0,17 vs. 0,58 ± 0,26 * | WR 3.48 ± 6.11 vs. 1.28 ± 0.88 RP 3.82 ± 2.90 vs. 0.58 ± 0.26 *** SP 2.27 ± 1.82 vs. 0.25 ± 0.1 *** | 283 ± 71 vs. 68 ± 6.62 ** | NA | NS | NA | No differences were found in Na, S-IgA Differences in proteins were found in WS and SP and differences in k were found in RPS, SP and WS |
| Hirtz et al., 2006 [49] | Spots | NA | Lower * | NA | NA | NA | NA | NA | NA | The spots were detected in nearly all subjects and showed an average five-fold under-accumulations in diabetic patients |
| Dodds et al., [43] | U/ml | 537.0 ± 36.3 vs. 431.2 ± 30.08 * | Higher * | WR 0.41 ± 0.04 vs. 0.45 ± 0.05 SP 0.34 ± 0.03 vs. 0.35 ± 0.03 | NA | 198.6 ± 10.3 vs. 97.3 ± 3.3 *** | NA | NA | NA | Amylase activity before/after in the same group: SRBG 862 ± 94.3 vs410.8 ± 76.5 *** SIBG 364 ± 51.7 vs. 422 ± 74.3, NS |
| Newrick et al., [35] | IU/l | 1144(514–5048) NNP vs. 488 (123–2443) NP vs. 727 (242–1400) | NS | 0.55 (0.31–0.8) NNP, 0.15 (0.06–0.36) NP vs. 0.68 (0.53–0.85) ** NP vs. Controls | NA | 261.32 (180–360) NNP vs. 216 (144–252) NPNA Controls | 12 (7–19) NNP vs. 12 (9–14) NP | NA | NA | - |
| Reuterving et al., 1987 [29] | U/ml | One group, two moments: 0.33 ± 0.04 Fst vs. 0.55 ± 0.18 Snd | - | WR:0.05 ± 0.02 vs. 0.09 ± 0.02 RP:0.04 ± 0.012 vs. 0.07 ± 0.03 SP:0.62 ± 0.11 vs. 0.57 ± 0.07 | WR:4.32 ± 0.72 vs. 1.26 ± 0.18 * RP:4.14 ± 1.26 vs. 1.62 ± 0.36 * SP:1.26 ± 0.36 vs. 0.36 ± 0.18 ** | 327.35± 158.54 vs. 105.21 ± 48.46 | 11.5 ± 1.86 vs. 7.92 ± 1.78 ** | NA | NA | No difference in controlled or uncontrolled diabetics |
| Tenovuo et al., 1986 [46] | U/mL3 | 233 ± 154 vs. 277 ± 136 | NS | 1.47 0.63 vs. 1.62 ± 0.74 | NA | NA | NA | No correlation for S-amylase by age. Diabetics have more Iga, IgG and peroxidase activity in saliva than controls |
Publisher’s Note: MDPI stays neutral with regard to jurisdictional claims in published maps and institutional affiliations. |
© 2021 by the authors. Licensee MDPI, Basel, Switzerland. This article is an open access article distributed under the terms and conditions of the Creative Commons Attribution (CC BY) license (http://creativecommons.org/licenses/by/4.0/).
Share and Cite
Pérez-Ros, P.; Navarro-Flores, E.; Julián-Rochina, I.; Martínez-Arnau, F.M.; Cauli, O. Changes in Salivary Amylase and Glucose in Diabetes: A Scoping Review. Diagnostics 2021, 11, 453. https://doi.org/10.3390/diagnostics11030453
Pérez-Ros P, Navarro-Flores E, Julián-Rochina I, Martínez-Arnau FM, Cauli O. Changes in Salivary Amylase and Glucose in Diabetes: A Scoping Review. Diagnostics. 2021; 11(3):453. https://doi.org/10.3390/diagnostics11030453
Chicago/Turabian StylePérez-Ros, Pilar, Emmanuel Navarro-Flores, Ivan Julián-Rochina, Francisco Miguel Martínez-Arnau, and Omar Cauli. 2021. "Changes in Salivary Amylase and Glucose in Diabetes: A Scoping Review" Diagnostics 11, no. 3: 453. https://doi.org/10.3390/diagnostics11030453
APA StylePérez-Ros, P., Navarro-Flores, E., Julián-Rochina, I., Martínez-Arnau, F. M., & Cauli, O. (2021). Changes in Salivary Amylase and Glucose in Diabetes: A Scoping Review. Diagnostics, 11(3), 453. https://doi.org/10.3390/diagnostics11030453