


Assessing the Relationship of Different Levels of Pain to the Health Status of Long-Term Breast Cancer Survivors: A Cross-Sectional Study

 ,
,  , , , and
Abstract
1. Introduction
2. Materials and Methods
2.1. Design and Participants
2.2. Variables
2.2.1. Demographic, Clinical, and Medical Data Collection
2.2.2. Pain Measures
2.2.3. Cancer-Related Fatigue
2.2.4. Physical Activity Level
2.2.5. Fitness Condition
2.2.6. Mood State
2.2.7. Health-Related Quality of Life
2.2.8. Statistical Analysis
3. Results
3.1. Demographic and Clinical Characteristics
3.2. Pain
3.3. Cancer-Related Fatigue
3.4. Physical Activity Level
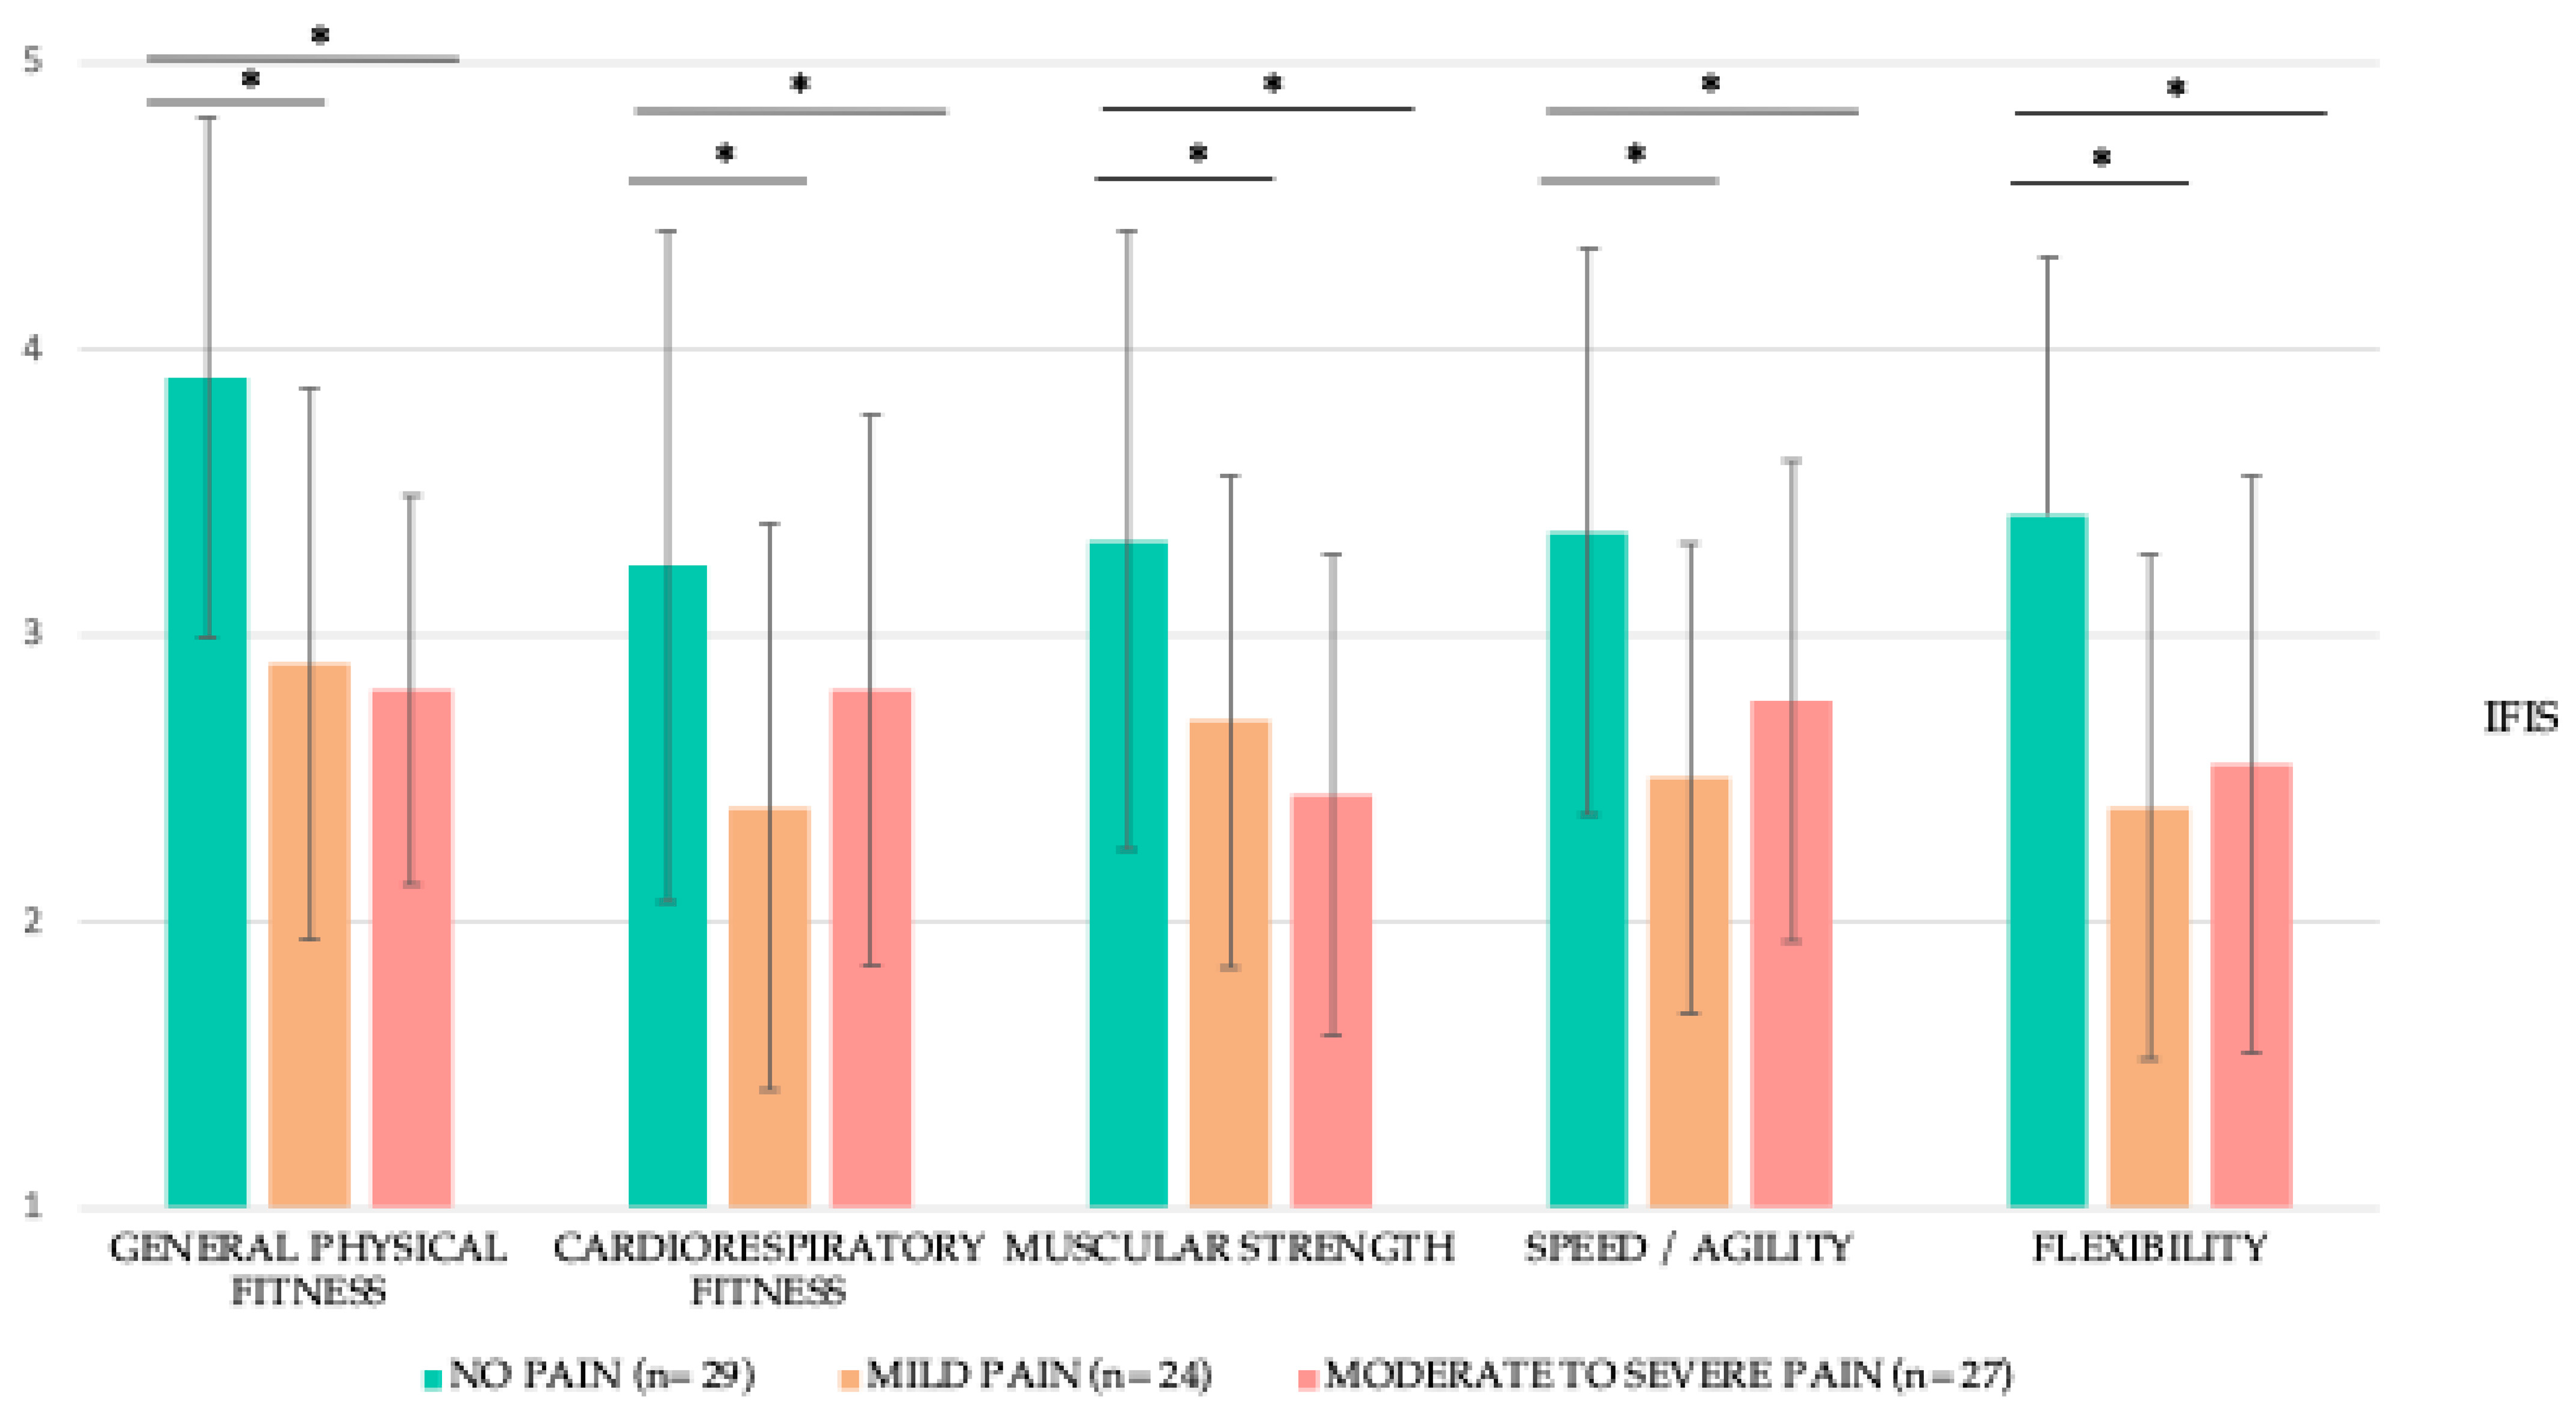
3.5. Fitness Condition
3.6. Mood State
3.7. Health-Related Quality of Life
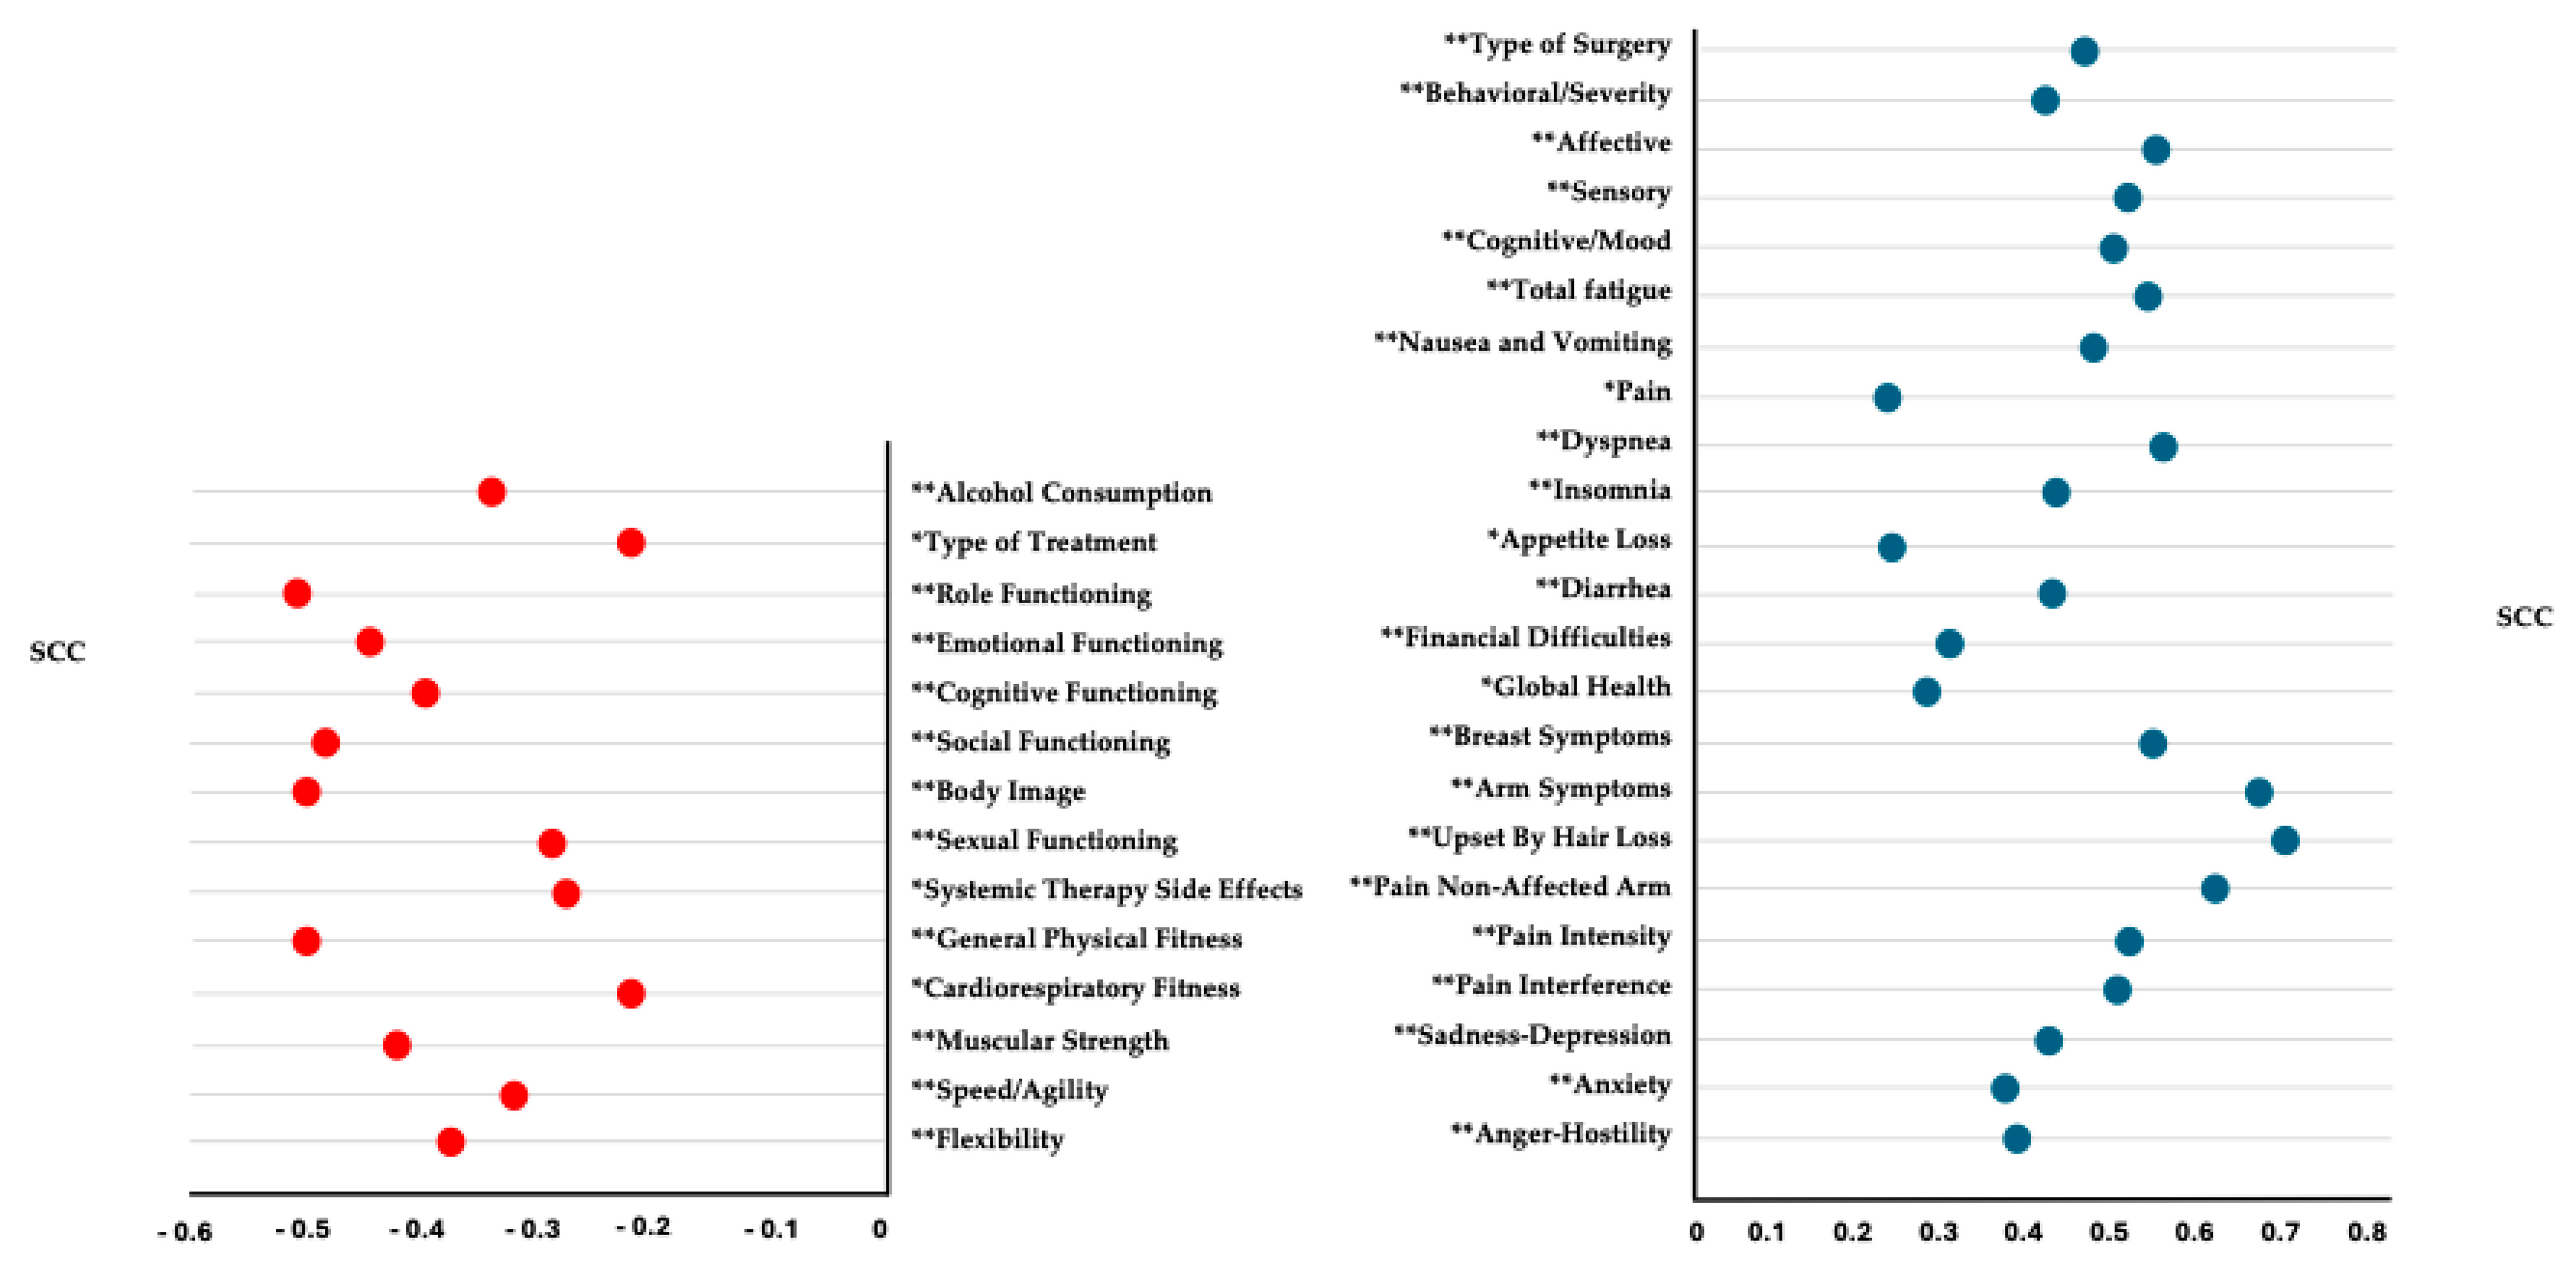
3.8. Correlation Analysis
3.9. Multiple Regression Analysis
4. Discussion
5. Conclusions
Supplementary Materials
Author Contributions
Funding
Institutional Review Board Statement
Informed Consent Statement
Data Availability Statement
Acknowledgments
Conflicts of Interest
References
- The Lancet Oncology. Curbing the climb in cancer incidence. Lancet Oncol. 2024, 25, 529. [Google Scholar] [CrossRef] [PubMed]
- Zhao, J.; Xu, L.; Sun, J.; Song, M.; Wang, L.; Yuan, S.; Zhu, Y.; Wan, Z.; Larsson, S.; Tsilidis, K.; et al. Global trends in incidence, death, burden and risk factors of early-onset cancer from 1990 to 2019. BMJ Oncol. 2023, 2, e000049. [Google Scholar] [CrossRef]
- Bloom, J.R.; Petersen, D.M.; Kang, S.H. Multi-dimensional quality of life among long-term (5+ years) adult cancer survivors. Psychooncology 2007, 16, 691–706. [Google Scholar] [CrossRef] [PubMed]
- Taylor, C.; McGale, P.; Probert, J.; Broggio, J.; Charman, J.; Darby, S.C.; Kerr, A.J.; Whelan, T.; Cutter, D.J.; Mannu, G.; et al. Breast cancer mortality in 500,000 women with early invasive breast cancer diagnosed in England, 1993–2015: Population based observational cohort study. BMJ 2023, 381, e074684. [Google Scholar] [CrossRef]
- Jensen, M.P.; Chang, H.-Y.; Lai, Y.-H.; Syrjala, K.L.; Fann, J.R.; Gralow, J.R. Pain in long-term breast cancer survivors: Frequency, severity, and impact. Pain Med. 2010, 11, 1099–1106. [Google Scholar] [CrossRef] [PubMed]
- Maass, S.; Boerman, L.; Verhaak, P.; Du, J.; de Bock, G.H.; Berendsen, A. Long-term psychological distress in breast cancer survivors and their matched controls: A cross-sectional study. Maturitas 2019, 130, 6–12. [Google Scholar] [CrossRef] [PubMed]
- Breidenbach, C.; Heidkamp, P.; Hiltrop, K.; Pfaff, H.; Enders, A.; Ernstmann, N.; Kowalski, C. Prevalence and determinants of anxiety and depression in long-term breast cancer survivors. BMC Psychiatry 2022, 22, 101. [Google Scholar] [CrossRef] [PubMed]
- Andersen, K.G.; Kehlet, H. Persistent pain after breast cancer treatment: A critical review of risk factors and strategies for prevention. J. Pain 2011, 12, 725–746. [Google Scholar] [CrossRef]
- Bao, T.; Seidman, A.; Li, Q.; Seluzicki, C.; Blinder, V.; Meghani, S.H.; Farrar, J.T.; Mao, J.J. Living with chronic pain: Perceptions of breast cancer survivors. Cancer Res. Treat. 2018, 169, 133–140. [Google Scholar] [CrossRef]
- Li, J.-X. Pain and depression comorbidity: A preclinical perspective. Behav. Brain Res. 2014, 276, 92–98. [Google Scholar] [CrossRef] [PubMed]
- Buscemi, V.; Chang, W.-J.; Liston, M.B.; McAuley, J.H.; Schabrun, S.M. The role of perceived stress and life stressors in the development of chronic musculoskeletal pain disorders: A systematic review. J. Pain 2019, 20, 1127–1139. [Google Scholar] [CrossRef]
- Leysen, L.; Beckwée, D.; Nijs, J.; Pas, R.; Bilterys, T.; Vermeir, S.; Adriaenssens, N. Risk factors of pain in breast cancer survivors: A systematic review and meta-analysis. Support. Care Cancer 2017, 25, 3607–3643. [Google Scholar] [CrossRef] [PubMed]
- Doan, L.V.; Yoon, J.; Chun, J.; Perez, R.; Wang, J. Pain associated with breast cancer: Etiologies and therapies. Front. Pain Res. 2023, 4, 1182488. [Google Scholar] [CrossRef]
- Werner, M.U.; Mjöbo, H.N.; Nielsen, P.R.; Rudin, A. Prediction of postoperative pain: A systematic review of predictive experimental pain studies. Anesthesiology 2010, 112, 1494–1502. [Google Scholar] [CrossRef] [PubMed]
- Gärtner, R.; Jensen, M.-B.; Nielsen, J.; Ewertz, M.; Kroman, N.; Kehlet, H. Prevalence of and factors associated with persistent pain following breast cancer surgery. JAMA 2009, 302, 1985–1992. [Google Scholar] [CrossRef]
- Pérez, C.; Ochoa, D.; Sánchez, N.; Ballesteros, A.I.; Santidrián, S.; López, I.; Mondéjar, R.; Carnaval, T.; Villoria, J.; Colomer, R. Pain in long-term cancer survivors: Prevalence and impact in a cohort composed mostly of breast cancer survivors. Cancers 2024, 16, 1581. [Google Scholar] [CrossRef] [PubMed]
- Zelman, D.C.; Dukes, E.; Brandenburg, N.; Bostrom, A.; Gore, M. Identification of cut-points for mild, moderate and severe pain due to diabetic peripheral neuropathy. Pain 2005, 115, 29–36. [Google Scholar] [CrossRef] [PubMed]
- Snijders, R.A.H.; Brom, L.; Theunissen, M.; Everdingen, M.H.J.v.D.B.-V. Update on prevalence of pain in patients with cancer 2022: A systematic literature review and meta-analysis. Cancers 2023, 15, 591. [Google Scholar] [CrossRef]
- Shrestha, B.; Dunn, L. The Declaration of Helsinki on medical research involving human subjects: A review of seventh revision. J. Nepal Health Res. Counc. 2020, 17, 548–552. [Google Scholar] [CrossRef]
- Bijur, P.E.; Silver, W.; Gallagher, E.J. Reliability of the visual analog scale for measurement of acute pain. Acad. Emerg. Med. 2001, 8, 1153–1157. [Google Scholar] [CrossRef] [PubMed]
- Badia, X.; Muriel, C.; Gracia, A.; Núñez-Olarte, J.M.; Perulero, N.; Gálvez, R.; Carulla, J.; Cleeland, C.S. Validación española del cuestionario Brief Pain Inventory en pacientes con dolor de causa neoplásica. Med. Clin. 2003, 120, 52–59. [Google Scholar] [CrossRef] [PubMed]
- Cantarero-Villanueva, I.; Fernández-Lao, C.; Rodriguez, L.D.; I Cuesta-Vargas, A.; Fernández-De-Las-Peñas, C.; Piper, B.F.; Arroyo-Morales, M. The Piper Fatigue Scale-Revised: Translation and psychometric evaluation in Spanish-speaking breast cancer survivors. Qual. Life Res. 2013, 23, 271–276. [Google Scholar] [CrossRef] [PubMed]
- Piper, B.F.; Dibble, S.L.; Dodd, M.J.; Weiss, M.C.; Slaughter, R.E.; Paul, S.M. The revised Piper Fatigue Scale: Psychometric evaluation in women with breast cancer. Oncol. Nurs. Forum. 1998, 25, 677–684. [Google Scholar] [PubMed]
- Stover, A.M.; Reeve, B.B.; Piper, B.F.; Alfano, C.M.; Smith, A.W.; Mitchell, S.A.; Bernstein, L.; Baumgartner, K.B.; McTiernan, A.; Ballard-Barbash, R. Deriving clinically meaningful cut-scores for fatigue in a cohort of breast cancer survivors: A Health, Eating, Activity, and Lifestyle (HEAL) Study. Qual. Life Res. 2013, 22, 2279–2292. [Google Scholar] [CrossRef] [PubMed]
- Berger, A.M.; Mooney, K.; Alvarez-Perez, A.; Breitbart, W.S.; Carpenter, K.M.; Cella, D.; Cleeland, C.; Dotan, E.; Eisenberger, M.A.; Escalante, C.P.; et al. Cancer-Related Fatigue, version 2.2015. J. Natl. Compr. Cancer Netw. 2015, 13, 1012–1039. [Google Scholar] [CrossRef] [PubMed]
- Comellas, A.R.; Pera, G.; Díez, J.M.B.; Tudurí, X.M.; Sas, T.A.; Elosua, R.; Monserrat, P.T.; Heras, A.; Raurell, R.F.; Gamisans, M.F.; et al. Validation of a Spanish short version of the Minnesota leisure time Physical Activity Questionnaire (VREM). Rev. Esp. Salud Publica 2012, 86, 495–508. [Google Scholar] [CrossRef]
- Ainsworth, B.E.; Haskell, W.L.; Whitt, M.C.; Irwin, M.L.; Swartz, A.M.; Strath, S.J.; O’Brien, W.L.; Bassett, D.R., Jr.; Schmitz, K.H.; Emplaincourt, P.O.; et al. Compendium of physical activities: An update of activity codes and MET intensities. Med. Sci. Sports Exerc. 2000, 32, S498–S504. [Google Scholar] [CrossRef]
- Español-Moya, M.N.; Ramírez-Vélez, R. Validación del cuestionario International Fitness Scale (IFIS) en sujetos colombianos de entre 18 y 30 años de edad. Rev. Esp. Salud Publica 2014, 88, 271–278. [Google Scholar] [CrossRef] [PubMed]
- Sanz, J. Un instrumento para evaluar la eficacia de los procedimientos de inducción de estado de ánimo: “La Escala de Valoración del Estado de Ánimo” (EVEA). Análisis Modif. Conducta 2001, 27, 71–110. [Google Scholar]
- Zawisza, K.; Tobiasz-Adamczyk, B.; Nowak, W.; Kulig, J.; Jędrys, J. Validity and reliability of the quality of life questionnaire (EORTC QLQ C30) and its breast cancer module (EORTC QLQ BR23). Ginekol. Pol. 2010, 81, 262–267. [Google Scholar]
- Sprangers, M.A.; Groenvold, M.; Arraras, J.I.; Franklin, J.; te Velde, A.; Muller, M.; Franzini, L.; Williams, A.; De Haes, H.C.; Hopwood, P.; et al. The European Organization for Research and Treatment of Cancer breast cancer-specific quality-of-life questionnaire module: First results from a three-country field study. J. Clin. Oncol. 1996, 14, 2756–2768. [Google Scholar] [CrossRef] [PubMed]
- Husson, O.; de Rooij, B.H.; Kieffer, J.; Oerlemans, S.; Mols, F.; Aaronson, N.K.; van der Graaf, W.T.; van de Poll-Franse, L.V. The EORTC QLQ-C30 summary score as prognostic factor for survival of patients with cancer in the “real-world”: Results from the population-based PROFILES registry. Oncologist 2019, 25, e722–e732. [Google Scholar] [CrossRef] [PubMed]
- Cohen, J. Statistical Power Analysis for the Behavioural Sciences; Academic: New York, NY, USA, 1977. [Google Scholar]
- Mela, C.F.; Kopalle, P.K. The impact of collinearity on regression analysis: The asymmetric effect of negative and positive correlations. Appl. Econ. 2002, 34, 667–677. [Google Scholar] [CrossRef]
- Chambless, L.E.; Dobson, A.J.; Patterson, C.C.; Raines, B. On the use of a logistic risk score in predicting risk of coronary heart disease. Stat. Med. 1990, 9, 385–396. [Google Scholar] [CrossRef] [PubMed]
- Selk, L.; Gertheiss, J. Nonparametric regression and classification with functional, categorical, and mixed covariates. arXiv 2021, arXiv:2111.03115. [Google Scholar] [CrossRef]
- Yin, M.; Gu, K.; Cai, H.; Shu, X.-O. Association between chronic pain and quality of life in long-term breast cancer survivors: A prospective analysis. Breast Cancer 2023, 30, 785–795. [Google Scholar] [CrossRef]
- Yin, M.; Wang, C.; Gu, K.; Bao, P.; Shu, X.-O. Chronic pain and its correlates among long-term breast cancer survivors. J. Cancer Surviv. 2022, 17, 460–467. [Google Scholar] [CrossRef] [PubMed]
- Forsythe, L.P.; Alfano, C.M.; George, S.M.; McTiernan, A.; Baumgartner, K.B.; Bernstein, L.; Ballard-Barbash, R. Pain in long-term breast cancer survivors: The role of body mass index, physical activity, and sedentary behavior. Breast Cancer Res. Treat. 2012, 137, 617–630. [Google Scholar] [CrossRef]
- Shen, A.; Zhang, Z.; Ye, J.; Wang, Y.; Zhao, H.; Li, X.; Wu, P.; Qiang, W.; Lu, Q. Arm symptom pattern among breast cancer survivors with and without lymphedema: A contemporaneous network analysis. Oncologist 2024, 29, e1656–e1668. [Google Scholar] [CrossRef]
- Hauerslev, K.R.; Madsen, A.H.; Overgaard, J.; Damsgaard, T.E.; Christiansen, P. Long-term follow-up on shoulder and arm morbidity in patients treated for early breast cancer. Acta Oncol. 2020, 59, 851–858. [Google Scholar] [CrossRef] [PubMed]
- Biering, K.; Frydenberg, M.; Pappot, H.; Hjollund, N.H. The long-term course of fatigue following breast cancer diagnosis. J. Patient Rep. Outcomes 2020, 4, 37. [Google Scholar] [CrossRef] [PubMed]
- Schmidt, M.E.; Chang-Claude, J.; Seibold, P.; Vrieling, A.; Heinz, J.; Flesch-Janys, D.; Steindorf, K. Determinants of long-term fatigue in breast cancer survivors: Results of a prospective patient cohort study. Psychooncology 2014, 24, 40–46. [Google Scholar] [CrossRef]
- Hefferon, K.; Murphy, H.; McLeod, J.; Mutrie, N.; Campbell, A. Understanding barriers to exercise implementation 5-year post-breast cancer diagnosis: A large-scale qualitative study. Health Educ. Res. 2013, 28, 843–856. [Google Scholar] [CrossRef] [PubMed]
- Hiensch, A.E.; Peeters, P.H.M.; Jansen, M.; van der Wall, E.; Backx, F.J.G.; Velthuis, M.J.; May, A.M. Socio-ecological correlates of physical activity in breast and colon cancer survivors 4 years after participation in a randomized controlled exercise trial (PACT study). PLoS ONE 2020, 15, e0231663. [Google Scholar] [CrossRef]
- Rasmussen, G.H.F.; Madeleine, P.; Arroyo-Morales, M.; Voigt, M.; Kristiansen, M. Pain sensitivity and shoulder function among breast cancer survivors compared to matched controls: A case-control study. J. Cancer Surviv. 2023, 17, 150–159. [Google Scholar] [CrossRef]
- Peters, M.; Butson, G.; Mizrahi, D.; Denehy, L.; Lynch, B.M.; Swain, C.T.V. Physical activity and pain in people with cancer: A systematic review and meta-analysis. Support. Care Cancer 2024, 32, 145. [Google Scholar] [CrossRef]
- Shabangu, N.; Thebe, T.; Casey, M.; Wesselmann, U.; Parker, R. Chronic pain in female breast cancer survivors—Prevalence, characteristics and contributing factors: A cross-sectional pilot study. BMC Women’s Health 2023, 23, 613. [Google Scholar] [CrossRef]
- Masiero, M.; Durosini, I.; Filipponi, C.; Campanini, M.L.; Pravettoni, G. Chronic pain in breast cancer survivors is linked with an impairment on emotion-based decisions and fatalistic time orientation. Curr. Psychol. 2024, 43, 27680–27689. [Google Scholar] [CrossRef]
- Bell, L.L. Impact of persistent pain on HRQoL in long-term breast cancer survivors. J. Clin. Oncol. 2021, 39, 1594–1601. [Google Scholar]
- Peuckmann, V.; Ekholm, O.; Rasmussen, N.; Groenvold, M.; Christiansen, P.; Møller, S.; Eriksen, J.; Sjøgren, P. Chronic pain and other sequelae in long-term breast cancer survivors: Nationwide survey in Denmark. Eur. J. Pain 2012, 13, 478–485. [Google Scholar] [CrossRef]
- Tang, W.-Z.; Mangantig, E.; Iskandar, Y.H.P.; Cheng, S.-L.; Yusuf, A.; Jia, K. Prevalence and associated factors of psychological distress among patients with breast cancer: A systematic review and meta-analysis. BMJ Open 2024, 14, e077067. [Google Scholar] [CrossRef] [PubMed]
- Sebri, V.; Durosini, I.; Triberti, S.; Pravettoni, G. The efficacy of psychological intervention on Body Image in breast cancer patients and survivors: A systematic-review and meta-analysis. Front. Psychol. 2021, 12, 611954. [Google Scholar] [CrossRef] [PubMed]
- Sanford, N.N.; Sher, D.J.; Xu, X.; Ahn, C.; D’amico, A.V.; Aizer, A.A.; Mahal, B.A. Alcohol use among patients with cancer and survivors in the United States, 2000–2017. J. Natl. Compr. Cancer Netw. 2020, 18, 69–79. [Google Scholar] [CrossRef] [PubMed]
- Amatsu, T.; Tsujiguchi, H.; Hara, A.; Miyagi, S.; Kannon, T.; Suzuki, K.; Shimizu, Y.; Nguyen, T.T.T.; Pham, K.-O.; Suzuki, F.; et al. Relationship between alcohol intake and chronic pain with depressive symptoms: A cross-sectional analysis of the Shika study. Int. J. Environ. Res. Public Health 2022, 19, 2024. [Google Scholar] [CrossRef]

| LTBCSs’ Level of Pain in the Affected Arm | ||||
|---|---|---|---|---|
| Characteristics | No Pain (NP) | Mild Pain (MP) | Moderate to Severe Pain (MTSP) | p/x2 |
| 0–0.99 (VAS) | 1–3.99 (VAS) | 4–10 (VAS) | ||
| (n = 29) | (n = 24) | (n = 27) | ||
| Mean age ± SD, years | 51.12 ± 8.74 | 45.00 ± 6.82 | 50.51 ± 7.00 | 0.16 a |
| Mean weight ± SD, kg | 69.77 ± 9.81 | 63.85 ± 7.24 | 67.97 ± 9.58 | 0.08 a |
| Mean height ± SD, cm | 161.27 ± 6.22 | 160.51 ± 4.99 | 159.97 ± 6.51 | 0.70 a |
| Mean body mass index ± SD, kg/m2 | 26.84 ± 3.61 | 24.88 ± 3.34 | 26.69 ± 4.41 | 0.16 a |
| Mean time since diagnosis ± SD, months | 87.46 ± 26.30 | 96.20 ± 31.43 | 89.88 ± 31.39 | 0.57 a |
| Mean time since the first surgery ± SD, months | 85.50 ± 26.73 | 91.70 ± 32.06 | 87.14 ± 31.99 | 0.76 a |
| Marital status, n (%) | ||||
| Unmarried | 5 (17.2) | 5 (20.8) | 4 (14.8) | 0.52 b |
| Married | 20 (68.9) | 16 (66.6) | 16 (59.3) | |
| Divorced | 2 (6.8) | 2 (8.33) | 5 (18.5) | |
| Widowed | 2 (6.8) | 1 (4.16) | 2 (7.4) | |
| Educational level, n (%) | ||||
| Primary school | 14 (48.2) | 7 (29.1) | 15 (55.6) | 0.18 b |
| Secondary school | 6 (20.6) | 5 (20.8) | 6 (22.2) | |
| University | 9 (31) | 12 (50) | 6 (22.2) | |
| Employment status, n (%) | ||||
| Housewife | 9 (31) | 8 (33.3) | 8 (29.6) | 0.58 b |
| Currently working | 9 (31) | 5 (20.8) | 3 (11.1) | |
| Sick leave | 9 (31) | 9 (37.5) | 12 (44.4) | |
| Retired | 2 (6.8) | 2 (8.33) | 4 (14.8) | |
| Tumor stage, n (%) | ||||
| I | 9 (31) | 7 (29.1) | 7 (25.9) | 0.86 b |
| II | 15 (51.7) | 14 (58.3) | 17 (63) | |
| IIIa | 5 (17.2) | 3 (12.5) | 3 (11.1) | |
| Dominant side, n (%) | ||||
| Right-sided | 24 (82.7) | 20 (83.3) | 25 (92.6) | 0.62 b |
| Left-sided | 5 (17.2) | 4 (16.6) | 2 (7.4) | |
| Tumor location, n (%) | ||||
| Right side | 9 (31) | 8 (33.3) | 9 (33.3) | 0.47 b |
| Left side | 20 (68.9) | 13 (54.1) | 16 (59.3) | |
| Bilateral | 0 (18.2) | 3 (12.5) | 2 (7.4) | |
| Tumor location on dominant side, n (%) | ||||
| No | 13 (44.8) | 10 (41.6) | 9 (33.3) | 0.59 b |
| Yes | 16 (55.1) | 14 (58.3) | 18 (66.7) | |
| Tobacco consumption, n (%) | ||||
| Non-consumption | 13 (44.8) | 12 (50) | 15 (50) | 0.76 b |
| Smoker | 6 (20.6) | 7 (29.1) | 6 (23.8) | |
| Ex-smoker | 10 (34.4) | 5 (20.8) | 6 (26.3) | |
| Alcohol consumption, n (%) | ||||
| Non-consumption | 6 (20.6) | 7 (29.1) | 17 (63) | 0.06 b |
| Monthly | 8 (27.5) | 6 (25) | 5 (18.5) | |
| Weekly | 15 (51.7) | 7 (29.1) | 4 (14.8) | |
| Daily | 0 (0) | 4 (16.6) | 1 (3.7) | |
| Family history of breast cancer, n (%) | ||||
| No | 13 (44.8) | 13 (54.1) | 13 (48.1) | 0.52 b |
| Yes | 16 (55.1) | 11 (45.8) | 14 (51.9) | |
| Menopause, n (%) | ||||
| No | 3 (10.3) | 6 (25) | 4 (14.8) | 0.52 b |
| Yes | 26 (89.6) | 18 (75) | 23 (85.2) | |
| Type of treatment, n (%) | ||||
| None | 0 (0) | 0 (0) | 0 (0) | 0.17 b |
| Radiotherapy | 0 (0) | 0 (0) | 3 (11.1) | |
| Chemotherapy | 2 (6.8) | 6 (25) | 2 (7.4) | |
| Radiotherapy and chemotherapy | 27 (93.1) | 18 (75) | 22 (81.5) | |
| Surgery, n (%) | ||||
| Lumpectomy | 10 (34.4) | 3 (12.5) | 2 (7.4) | 0.06 b |
| Quadrantectomy | 17 (58.6) | 9 (37.5) | 12 (44.4) | |
| Unilateral mastectomy | 1 (3.4) | 10 (41.6) | 11 (40.7) | |
| Bilateral mastectomy | 1 (3.4) | 2 (8.3) | 2 (7.4) | |
| Type of medication, n (%) | ||||
| None | 10 (34.4) | 4 (16.6) | 4 (14.8) | 0.06 b |
| Tamoxifen | 8 (27.5) | 14 (58.3) | 10 (37) | |
| Other types | 11 (37.9) | 6 (25) | 13 (48.1) | |
| Metastasis, n (%) | ||||
| No | 24 (82.7) | 18 (75.00) | 23 (85.2) | 0.59 b |
| Yes | 5 (17.2) | 6 (25.00) | 4 (14.8) | |
| Recurrence, n (%) | ||||
| No | 23 (79.3) | 16 (66.6) | 27 (100) | 0.06 b |
| Yes | 6 (20.6) | 8 (33.3) | 0 (0) | |
| Currently seeing a psychologist or in the last three months, n (%) | ||||
| No | 20 (68.9) | 8 (33.3) | 11 (40.7) | 0.98 b |
| Yes | 9 (31) | 16 (66.6) | 16 (59.3) | |
| Currently seeing a physiotherapist or in the last three months, n (%) | ||||
| No | 9 (31) | 8 (33.3) | 10 (37) | 0.88 b |
| Yes | 20 (68.9) | 16 (66.6) | 17 (63) | |
| Variables | LTBCSs’ Level of Pain in the Affected Arm | |||||||||
|---|---|---|---|---|---|---|---|---|---|---|
| No Pain (NP) | Mild Pain (MP) | Moderate to Severe Pain (MTSP) | ||||||||
| 0–0.99 | 1–3.99 | 4–10 | ||||||||
| (VAS) | (VAS) | (VAS) | p-Values | COHEN’S d | p-Values | COHEN’S d | p-Values | COHEN’S d | ||
| (n = 29) | (n = 24) | (n = 27) | NP vs. MP | NP vs. MP | NP vs. MTSP | NP vs. MTSP | MP vs. MTSP | MP vs. MTSP | ||
| VAS (cm), mean ± SD, median; IQR, and (95% CI) a | ||||||||||
| Non-affected arm | 0.30 ± 1.21 0.00; 0.00 | 0.30 ± 0.57 0.00; 0.75 | 3.74 ± 3.41 3.65; 7.00 | 0.07 | 0 | <0.01 ** | 1.34 | <0.01 ** | 1.39 | |
| (−0.12–0.73) | (0.03–0.56) | (2.38–5.09) | ||||||||
| BPI, mean ± SD, median; IQR, and (95% CI) a | ||||||||||
| Interference | 0.75 ± 1.70 0.00; 0.64 (0.85–3.25) | 2.05 ± 2.56 0.57; 4.46 (0.85–3.25) | 3.56 ± 2.94 3.43; 5.29 (2.39–4.72) | 0.01 * | 0.59 | <0.01 ** | 1.17 | 0.08 | 0.54 | |
| PFS domains, mean ± SD, median; IQR, and (95% CI) a | ||||||||||
| Behavioral/Severity | 1.84 ± 2.49 0.33; 3.40 (0.96–2.73) | 3.32 ± 2.73 3.66; 6.00 (2.04–4.59) | 4.14 ± 2.95 3.50; 5.16 (2.97–5.31) | 0.05 * | 0.56 | <0.01 ** | 0.84 | 0.32 | 0.28 | |
| Affective | 1.53 ± 2.53 0.00; 1.60 (0.63–2.43) | 3.93 ± 2.82 4.40; 5.00 (2.61–5.25) | 5.05 ± 3.05 5.80; 4.20 (3.84–6.26) | <0.01 ** | 0.89 | <0.01 ** | 1.06 | 0.16 | 0.38 | |
| Sensory | 1.69 ± 2.41 0.40; 3.00 (0.83–2.54) | 4.40 ± 2.94 5.40; 5.20 (3.02–5.77) | 4.97 ± 2.88 5.40; 4.40 (3.83–6.10) | <0.01 ** | 1.00 | <0.01 ** | 1.23 | 0.57 | 0.19 | |
| Cognitive/Mood | 1.77 ± 2.49 0.50; 2.42 (0.88–2.65) | 3.21 ± 2.48 3.25; 4.80 (2.05–4.37) | 4.94 ± 2.92 5.17; 5.00 (3.78–6.10) | 0.01 * | 0.57 | <0.01 ** | 1.16 | 0.04 * | 0.63 | |
| Total fatigue score | 1.72 ± 2.37 0.64; 2.78 (0.88–2.56) | 3.68 ± 2.44 4.41; 4.34 (2.53–4.82) | 4.79 ± 2.70 4.82; 3.78 (3.72–5.86) | <0.01 ** | 0.81 | <0.01 ** | 1.20 | 0.22 | 0.43 | |
| PFS (Cut-score type A), (%) b | ||||||||||
| No fatigue | 0–0.9 | 17 (58.6) | 5 (20.8) | 3 (11.1) | <0.01 ** | - | <0.01 ** | - | 0.373 | - |
| Mild | 1–3.9 | 7 (24.1) | 6 (25) | 7 (25.9) | ||||||
| Moderate | 4–6.9 | 3 (10.3) | 11 (45.8) | 11 (40.7) | ||||||
| Severe | 7–10 | 2 (6.8) | 2 (8.3) | 6 (22.2) | ||||||
| PFS (Cut-score type B), (%) b | ||||||||||
| No fatigue | 0–0.9 | 17 (58.6) | 5 (20.8) | 3 (11.1) | 0.14 | - | <0.01 ** | - | 0.71 | - |
| Mild | 1–2.9 | 5 (17.2) | 5 (29.1) | 5 (18.5) | ||||||
| Moderate | 3–5.9 | 5 (17.2) | 7 (29.1) | 11 (40.7) | ||||||
| Severe | 6–10 | 2 (6.8) | 7 (20.8) | 8 (29.6) | ||||||
| MLTPA (MET hour/week), n (%) b | ||||||||||
| Inactive (≤3) | 4 (13.7) | 6 (25) | 11 (40.7) | 0.47 | - | 0.05 * | - | 0.52 | - | |
| Low active (3.1–7.4) | 11 (37.9) | 11 (45.8) | 10 (37) | |||||||
| Active (≥7.5) | 14 (48.2) | 7 (29.1) | 6 (22.2) | |||||||
| EVEA, mean ± SD, median; IQR, and (95% CI) a | ||||||||||
| Sadness–depression | 1.88 ± 2.63 0.75; 3.38 (0.95–2.82) | 2.80 ± 2.42 2.00; 3.88 (1.66–3.93) | 4.26 ± 2.47 4.25; 3.00 (3.28–5.24) | 0.04 * | 0.36 | <0.01 ** | 0.93 | 0.04 * | 0.59 | |
| Anxiety | 2.25 ± 2.25 1.50; 2.88 (1.45–3.05) | 2.52 ± 2.54 1.75; 3.56 (1.33–3.71) | 4.42 ± 2.60 4.75; 3.75 (3.39–5.45) | 0.76 | 0.11 | <0.01 ** | 0.89 | 0.01 * | 0.73 | |
| Anger–hostility | 1.46 ± 2.07 0.50; 2.50 (0.73–2.20) | 1.78 ± 1.82 1.25; 2.75 (0.93–2.64) | 3.54 ± 2.91 2.75; 4.50 (2.39–4.69) | 0.24 | 0.16 | <0.01 ** | 0.82 | 0.03 * | 0.72 | |
| Happiness | 5.88 ± 2.54 6.00; 4.13 (4.98–6.78) | 5.17 ± 2.25 4.75; 3.94 (4.12–6.22) | 6.73 ± 9.90 4.75; 4.00 (2.81–10.64) | 0.21 | 0.29 | 0.27 | 0.11 | 0.86 | 0.21 | |
| LTBCSs’ Level of Pain in the Affected Arm | |||||||||
|---|---|---|---|---|---|---|---|---|---|
| Variables | No Pain (NP) | Mild Pain (MP) | Moderate to Severe Pain (MTSP) | ||||||
| 0–0.99 | 1–3.99 | 4–10 | |||||||
| (VAS) | (VAS) | (VAS) | p-Values | COHEN’S d | p-Values | COHEN’S d | p-Values | COHEN’S d | |
| (n = 29) | (n = 24) | (n = 27) | NP vs. MP | NP vs. MP | NP vs. MTSP | NP vs. MTSP | MP vs. MTSP | MP vs. MTSP | |
| Functioning Scales QLQ-C30, mean ± SD, median; IQR, and (95% CI) | |||||||||
| Physical functioning | 32.82 ± 17.97 33.33; 0.00 (27.60–38.04) | 29.98 ± 10.25 33.33; 0.00 (25.18–34.77) | 33.33 ± 27.73 33.33; 33.33 (22.36–44.30) | 0.30 | 0.19 | 0.73 | 0.02 | 0.80 | 0.16 |
| Role functioning | 91.54 ± 10.82 93.33; 13.33 (87.70–95.38) | 81.33 ± 23.25 86.67; 18.33 (70.45–92.21) | 69.64 ± 21.19 73.33; 26.67 (61.25–78.02) | 0.04 * | 0.56 | <0.01 ** | 2.85 | 0.01 * | 0.53 |
| Emotional functioning | 91.91 ± 16.20 100.00; 16.67 (86.17–97.66) | 79.99 ± 29.91 100.00; 33.33 (65.99–93.99) | 63.58 ± 34.29 66.67; 66.67 (50.01–77.14) | 0.12 | 0.49 | <0.01 ** | 1.05 | 0.06 | 0.51 |
| Cognitive functioning | 72.72 ± 29.92 75.00; 41.67 (62.11–83.33) | 75.41 ± 17.82 75.00; 31.26 (67.07–83.76) | 47.83 ± 32.81 50.00; 58.33 (34.85–60.82) | 0.70 | 0.10 | <0.01 ** | 0.79 | <0.01 ** | 1.04 |
| Social functioning | 74.24 ± 28.59 83.33; 50.00 (64.10–84.37) | 67.49 ± 22.60 66.67; 33.33 (56.92–78.07) | 42.59 ± 30.42 33.33; 50.00 (30.55–54.63) | 0.20 | 0.26 | <0.01 ** | 1.07 | <0.01 ** | 0.93 |
| Symptom Scales QLQ-C30, mean ± SD, median; IQR, and (95% CI) | |||||||||
| Fatigue | 55.55 ± 34.59 66.67; 50.00 (41.87–69.24) | 76.66 ± 21.89 75.00; 33.33 (66.41–86.91) | 83.83 ± 29.60 100.00; 25.00 (73.34–94.33) | 0.06 | 0.72 | <0.01 ** | 0.88 | 0.03 * | 0.27 |
| Nausea and vomiting | 21.88 ± 25.53 11.11; 33.33 (12.83–30.93) | 39.44 ± 30.68 33.33; 44.45 (25.08–53.81) | 52.26 ± 30.78 44.44; 44.45 (40.08–64.44) | 0.02 * | 0.62 | <0.01 ** | 1.07 | 0.15 | 0.42 |
| Pain | 5.55 ± 19.83 0.00; 0.00 (−1.47–12.58) | 8.33 ± 19.11 0.00; 0.00 (−0.61–17.28) | 9.25 ± 15.56 0.00; 16.67 (3.10–15.41) | 0.28 | 0.14 | 0.19 | 0.21 | 0.55 | 0.05 |
| Single Items QLQ-C30, mean ± SD, median; IQR, and (95% CI) | |||||||||
| Dyspnea | 21.21 ± 26.11 16.67; 33.33 (11.95–30.47) | 37.50 ± 26.96 33.33; 33.33 (24.87–50.12) | 61.11 ± 29.59 66.67; 50.00 (49.40–72.81) | 0.01 * | 0.61 | <0.01 ** | 1.42 | <0.01 ** | 0.83 |
| Insomnia | 10.10 ± 17.64 0.00; 33.33 (3.84–16.35) | 21.66 ± 32.93 0.00; 33.33 (6.25–37.08) | 40.74 ± 35.00 33.33; 66.67 (26.89–54.58) | 0.24 | 0.43 | <0.01 ** | 1.10 | 0.04 * | 0.56 |
| Appetite loss | 43.43 ± 32.79 33.33; 50.01 (31.80–55.06) | 49.16 ± 37.25 50.00; 70.83 (31.72–66.60) | 59.25 ± 32.46 66.67; 66.67 (46.41–72.10) | 0.56 | 0.16 | 0.20 | 0.48 | 0.36 | 0.29 |
| Constipation | 9.09 ± 22.47 0.00; 0.00 (1.12–17.05) | 18.33 ± 31.48 0.00; 33.33 (3.59–33.06) | 9.87 ± 24.13 0.00; 0.00 (0.32–19.42) | 0.17 | 0.34 | 0.32 | 0.03 | 0.22 | 0.30 |
| Diarrhea | 12.62 ± 23.20 0.00; 33.33 (4.39–20.85) | 23.33 ± 34.37 0.00; 33.33 (7.24–39.41) | 41.97 ± 32.80 33.33; 66.67 (28.99–54.95) | 0.26 | 0.37 | <0.01 ** | 1.03 | 0.03 * | 0.55 |
| Financial difficulties | 6.06 ± 17.58 0.00; 0.00 (−0.17–12.29) | 11.66 ± 24.83 0.00; 25.00 (0.04–23.29) | 19.75 ± 26.56 0.00; 33.33 (9.24–30.26) | 0.25 | 0.26 | 0.02 * | 0.61 | 0.17 | 0.31 |
| Global Health Status QLQ-C30, mean ± SD, median; IQR, and (95% CI) | |||||||||
| Global health status | 17.17 ± 29.01 0.00; 33.33 (6.88–27.45) | 18.33 ± 29.56 0.00; 33.33 (4.49–32.17) | 33.45 ± 40.19 33.33; 66.67 (17.55–49.35) | 0.80 | 0.04 | 0.12 | 0.46 | 0.15 | 0.43 |
| Summary Score QLQ-C30, mean ± SD, median; IQR, and (95% CI) | |||||||||
| Summary score | 73.50 ± 11.39 75.73; 9.73 (69.45–77.54) | 66.13 ± 16.02 69.81; 24.80 (58.63–73.63) | 55.91 ± 14.43 59.23; 20 (50.20–61.62) | 0.10 | 0.53 | <0.01 ** | 1.35 | 0.01 * | 0.67 |
| Functional Scales QLQ-BR23, mean ± SD, median; IQR, and (95% CI) | |||||||||
| Body image | 76.26 ± 20.31 75.00; 33.33 (69.05–83.46) | 60.83 ± 19.13 62.50; 31.25 (51.87–69.78) | 50.30 ± 19.40 50.00; 33.34 (42.63–57.98) | 0.01 * | 0.78 | <0.01 ** | 1.30 | 0.10 | 0.55 |
| Sexual functioning | 86.36 ± 22.03 100.00; 16.67 (78.55–94.17) | 71.66 ± 28.27 75.00; 56.25 (58.43–84.90) | 70.06 ± 31.96 83.33; 58.33 (57.41–82.70) | 0.02 * | 0.58 | 0.03 * | 0.59 | 0.93 | 0.05 |
| Sexual enjoyment | 23.23 ± 20.38 33.33; 33.33 (16.00–30.46) | 21.66 ± 16.31 33.33; 33.33 (14.03–29.29) | 20.37 ± 25.45 16.67; 33.33 (10.29–30.44) | 0.89 | 0.09 | 0.64 | 0.12 | 0.47 | 0.06 |
| Future perspective | 33.33 ± 25.00 33.33; 0.00 (24.46–42.19) | 31.66 ± 22.87 33.33; 25.00 (20.95–42.37) | 30.86 ± 27.62 33.33; 33.33 (19.93–41.78) | 0.96 | 0.07 | 0.85 | 0.09 | 0.69 | 0.03 |
| Symptom Scales QLQ-BR23, mean ± SD, median; IQR, and (95% CI) | |||||||||
| Systemic therapy side effects | 67.67 ± 34.84 66.67; 33.33 (55.32–80.03) | 45.00 ± 40.86 33.33; 91.67 (25.87–64.12) | 45.67 ± 37.15 33.33; 66.67 (30.98–60.37) | 0.05 * | 0.60 | 0.03 * | 0.61 | 0.93 | 0.02 |
| Breast symptoms | 18.43 ± 19.25 14.29; 19.05 (11.60–25.25) | 27.85 ± 22.18 23.81; 23.81 (17.47–38.24) | 41.62 ± 20.22 28.10; 33.82 (33.62–49.62) | 0.06 | 0.45 | <0.01 ** | 1.17 | 0.01 * | 0.6 |
| Arm symptoms | 10.35 ± 14.88 8.33; 16.67 (5.07–15.63) | 19.58 ± 19.17 16.67; 16.67 (10.61–28.55) | 50.30 ± 27.97 50.00; 41.67 (39.24–61.37) | 0.03 * | 0.54 | <0.01 ** | 1.78 | <0.01 ** | 1.28 |
| Upset by hair loss | 14.14 ± 22.95 0.00; 22.22 (6.00–22.27) | 25.55 ± 15.33 33.33; 22.22 (18.37–32.73) | 58.02 ± 30.56 44.44; 55.56 (45.93–70.11) | <0.01 ** | 0.58 | <0.01 ** | 1.62 | <0.01 ** | 1.46 |
| Model | Variables/Predictors | β | 95% CI | t | p-Values | Linear Regression Equation Y = a + bX |
| Model 1 (r² = 0.497) | Upset by hair loss (QLQ-C30) | 0.70 | 0.04 ± 0.07 | 8.78 | <0.01 ** | Pain in the affected arm = 0.43 + (0.05 * Upset by hair loss) |
| Model 2 (r² = 0.580) | Upset by hair loss (QLQ-C30) | 0.58 | 0.03 ± 0.06 | 7.35 | <0.01 ** | Pain in the affected arm = −0.09 + (0.04 * Upset by hair loss) + (0.25 * Affective domain) |
| Affective domain (PFS) | 0.31 | 0.12 ± 0.38 | 3.89 | <0.01 ** | ||
| Model 3 (r² = 0.614) | Upset by hair loss (QLQ-C30) | 0.53 | 0.03 ± 0.05 | 6.62 | <0.01 ** | Pain in the affected arm = −0.40 + (0.04 * Upset by hair loss) + (−0.18 * Affective domain) + (0.01 * Dyspnea) |
| Affective domain (PFS) | 0.22 | 0.04 ± 0.32 | 2.70 | <0.01 ** | ||
| Dyspnea (QLQ-C30) | 0.22 | 0.00 ± 0.03 | 2.60 | 0.01 * | ||
| Model 4 (r² = 0.646) | Upset by hair loss (QLQ-C30) | 0.52 | 0.03 ± 0.05 | 6.78 | <0.01 ** | Pain in the affected arm = 0.31 + (0.04 * Upset by hair loss) + (0.11 * Affective domain) + (0.01 * Dyspnea) + (0.51 * Alcohol consumption) |
| Affective domain (PFS) | 0.16 | −0.04 ± 0.26 | 1.93 | 0.05 * | ||
| Dyspnea (QLQ-C30) | 0.22 | 0.05 ± 0.07 | 2.79 | <0.01 ** | ||
| Alcohol consumption | −0.19 | −0.905 ± −0.012 | 2.61 | 0.01 * |
Disclaimer/Publisher’s Note: The statements, opinions and data contained in all publications are solely those of the individual author(s) and contributor(s) and not of MDPI and/or the editor(s). MDPI and/or the editor(s) disclaim responsibility for any injury to people or property resulting from any ideas, methods, instructions or products referred to in the content. |
© 2025 by the authors. Licensee MDPI, Basel, Switzerland. This article is an open access article distributed under the terms and conditions of the Creative Commons Attribution (CC BY) license (https://creativecommons.org/licenses/by/4.0/).
Share and Cite
Álvarez-Salvago, F.; Figueroa-Mayordomo, M.; Molina-García, C.; Pujol-Fuentes, C.; Atienzar-Aroca, S.; de Diego-Moreno, M.; Medina-Luque, J. Assessing the Relationship of Different Levels of Pain to the Health Status of Long-Term Breast Cancer Survivors: A Cross-Sectional Study. Life 2025, 15, 177. https://doi.org/10.3390/life15020177
Álvarez-Salvago F, Figueroa-Mayordomo M, Molina-García C, Pujol-Fuentes C, Atienzar-Aroca S, de Diego-Moreno M, Medina-Luque J. Assessing the Relationship of Different Levels of Pain to the Health Status of Long-Term Breast Cancer Survivors: A Cross-Sectional Study. Life. 2025; 15(2):177. https://doi.org/10.3390/life15020177
Chicago/Turabian StyleÁlvarez-Salvago, Francisco, Maria Figueroa-Mayordomo, Cristina Molina-García, Clara Pujol-Fuentes, Sandra Atienzar-Aroca, Manuel de Diego-Moreno, and Jose Medina-Luque. 2025. "Assessing the Relationship of Different Levels of Pain to the Health Status of Long-Term Breast Cancer Survivors: A Cross-Sectional Study" Life 15, no. 2: 177. https://doi.org/10.3390/life15020177
APA StyleÁlvarez-Salvago, F., Figueroa-Mayordomo, M., Molina-García, C., Pujol-Fuentes, C., Atienzar-Aroca, S., de Diego-Moreno, M., & Medina-Luque, J. (2025). Assessing the Relationship of Different Levels of Pain to the Health Status of Long-Term Breast Cancer Survivors: A Cross-Sectional Study. Life, 15(2), 177. https://doi.org/10.3390/life15020177